performance innovation growthoxypublications.com/annualreport/pdf/2017/occidental_ar_2017.pdf ·...
TRANSCRIPT

Performance Innovation GrowthOccidental Petroleum Corporat ion 2017 Annual Report
OC
CID
EN
TAL
PE
TR
OL
EU
M C
OR
PO
RA
TIO
N | 2
01
7 A
NN
UA
L R
EP
OR
T
5 Greenway Plaza, Suite 110
Houston, Texas 77046-0521
(713) 215-7000
18030002_2_OXY_AR_2017_Cover_Flat_r18_EP1.indd 1 3/14/18 12:39 PM

(in millions, except per-share amounts)As of and for the years ended December 31, 2017 2016 2015 2014 2013
RESULTS OF OPERATIONS (a)
Net sales $ 12,508 $ 10,090 $ 12,480 $ 19,312 $ 20,170Income (loss) from continuing operations $ 1,311 $ (1,002 $ (8,146 $ (130 $ 4,932Net income (loss) attributable to common stock $ 1,311 $ (574 $ (7,829 $ 616 $ 5,903Basic earnings (loss) per common share from continuing operations $ 1.71 $ (1.31 $ (10.64 $ (0.18 $ 6.12Basic earnings (loss) per common share $ 1.71 $ (0.75 $ (10.23 $ 0.79 $ 7.33Diluted earnings (loss) per common share $ 1.70 $ (0.75 $ (10.23 $ 0.79 $ 7.32
FINANCIAL POSITION (a)
Total assets $ 42,026 $ 43,109 $ 43,409 $ 56,237 $ 69,415Long-term debt, net $ 9,328 $ 9,819 $ 6,855 $ 6,816 $ 6,911Stockholders’ equity $ 20,572 $ 21,497 $24,350 $34,959 $ 43,372
MARKET CAPITALIZATION (b) $ 56,357 $ 54,437 $ 51,632 $ 62,119 $ 75,699
CASH FLOW FROM CONTINUING OPERATIONS
Operating:Cash flow from continuing operations $ 4,996 $ 2,519 $ 3,254 $ 8,871 $ 10,229 Investing:Capital expenditures $ (3,599 $ (2,717 $ (5,272 $ (8,930 $ (7,357Cash provided (used) by all other investing activities, net $ 385 $ (2,025 $ (151 $ 2,686 $ 1,040Financing:Cash dividends paid $ (2,346 $ (2,309 $ (2,264 $ (2,210 $ (1,553Purchases of treasury stock $ (25 $ (22 $ (593 $ (2,500 $ (943Cash provided (used) by all other financing activities, net $ 28 $ 2,722 $ 4,341 $ 2,384 $ (437
DIVIDENDS PER COMMON SHARE $ 3.06 $ 3.02 $ 2.97 $ 2.88 $ 2.56
WEIGHTED AVERAGE BASIC SHARES OUTSTANDING (MILLIONS) 765 764 766 781 804
) ) ) ) )) ) ) ) ) ) )
) ) ) ) ) ) )
) ) ) ) ) ) ) ) ) )
)
Selected Financial Data
Note: The statements of income and cash flows related to California Resources have been treated as discontinued operations for all periods presented. The assets and liabilities of California Resources were removed from Occidental’s consolidated balance sheet as of November 30, 2014.(a) See the MD&A section of this report and the Notes to Consolidated Financial Statements for information regarding acquisitions and dispositions, discontinued operations
and other items affecting comparability.(b) Market capitalization is calculated by multiplying the year-end total shares of common stock outstanding, net of shares held as treasury stock, by the year-end closing stock price.
ON THE COVER: Occidental’s Permian Basin operations, Pecos County, Texas
Partner of Choice®
At Occidental, what we do is important — and how we do it is even more so. Our mission is to develop energy — safely, responsibly and profitably — to maximize shareholder value and remain a partner of choice for our stakeholders.
Occidental Petroleum Corporation (NYSE: OXY) is an international oil and gas exploration and production company with operations in the United States, Middle East and Latin America. Headquartered in Houston, Occidental is one of the largest U.S. oil and gas companies, based on equity market capitalization. Occidental’s midstream and marketing segment gathers, processes, transports, stores, purchases and markets hydrocarbons and other commodities. The company’s wholly owned subsidiary OxyChem manufactures and markets basic chemicals and vinyls.
Occidental is committed to safeguarding the environment, protecting the safety and health of employees and neighboring communities, and upholding high standards of social responsibility throughout its worldwide operations.
Auditors
KPMG LLP
Houston, Texas
Transfer Agent and Registrar
EQ Shareowner Services
P.O. Box 64874
St. Paul, MN 55164-0874
Toll free – (877) OXY-8166
International callers – (651) 450-4064
www.shareowneronline.com
Stock Exchange List ing
Occidental’s common stock is listed on the New York
Stock Exchange (NYSE). The symbol is OXY.
Div idend Reinvestment Plan
Occidental stockholders owning at least 25 shares
of common or preferred stock registered in their
name are eligible to purchase additional shares of
common stock under the Dividend Reinvestment
Plan by investing dividends on the greater of
25 shares or 10 percent of their share balance
of common or preferred stock and making optional
cash investments of up to $10,000 per month.
Information may be obtained from: EQ Shareowner
Services at www.shareowneronline.com.
Annual Cert i f icat ions
Occidental has filed the certifications of the chief
executive officer and chief financial officer required
by Section 302 of the Sarbanes-Oxley Act of 2002
as Exhibits 31.1 and 31.2 to its 2017 Annual Report on
Form 10-K filed with the Securities and Exchange
Commission. In addition, in 2017, Occidental
submitted to the NYSE a certificate of the chief
executive officer stating that she is not aware of
any violation by the company of the NYSE corporate
governance listing standards.
Current News and General Information
Information about Occidental, including news releases
and investor packages, is available at www.oxy.com.
twitter.com/Oxy_Petroleum
linkedin.com/company/Oxy
youtube.com/user/OxyUTube
This Annual Report is printed on Forest Stewardship
Council®-certified paper that contains wood from
well-managed forests, controlled sources and
recycled wood or fiber.
Additional Information
18030002_2_OXY_AR_2017_Cover_Flat_r18_EP1.indd 2 3/14/18 12:39 PM

United States
50%of worldwide ongoing production296,000 BOEPD of ongoing production
1.555 billion BOE of proved reserves
InternationalInternational
50%of worldwide ongoing production298,000 BOEPD of ongoing production
1.043 billion BOE of proved reserves
Occidental’s Permian Basin operations, Martin County, Texas
Occidental’s Oman operations, Safah Field
18030002_2_OXY_AR_2017_Interior_r18_EP2.indd 1 3/14/18 11:44 AM

From the President and Chief Executive Officer
2017 was a year of strong operational performance, constant innovation and value-enhancing growth for Occidental.
We finished the year with the highest-quality portfolio of assets in the company’s nearly 100-year history and continued to deliver on our value proposition of dividend and moderate production growth. We raised the dividend for the 15th consecutive year, grew production from ongoing operations and materially increased reserves. We maintained a solid balance sheet and A grades from the major credit rating agencies, a reflection of our financial discipline and strength.
These were significant accomplishments and are a testament to our company’s resiliency in a challenging commodities price environment. But we need to do more, and drive our performance to higher levels.
In 2017, we implemented a strategic cash flow breakeven plan, positioning our company for sustained annual production growth in a lower price environment and to support our dividend. The objective is to be cash-flow neutral at a $40 West Texas Intermediate (WTI) price per barrel of oil, meaning we can cover the dividend and production-sustaining capital. At $50 WTI, we will generate additional cash flows to grow production by 5 to 8 percent. We expect to achieve the $50 breakeven plan in the third quarter of 2018, ahead of schedule. All segments of our business are contributing to this effort. We continue to take significant and aggressive steps to reduce costs and eliminate inefficiencies.
Our goal is to invest in projects that generate long-term value, targeting returns well above the cost of capital. As always, our cash flow priorities are first to safely and responsibly maintain the business. Our second priority is to increase shareholder dividends. Our next priority is growing and strengthening the business. Excess cash flow is deployed to acquisitions and share repurchases, depending on the relative value created by each investment choice.
We remain committed to disciplined capital allocation and have set the 2018 budget at $3.9 billion with the flexibility to adjust activity if market conditions warrant. Our focus continues to be on delivering value-based production growth.
The Board of Directors increased the dividend in 2017, returning $2.3 billion to our shareholders. This February, the Board affirmed an annualized dividend rate of $3.08 per share, and we expect to continue funding the dividend from cash flow generated by our base business and increased production from organic growth and completed projects.
In the United States, we continue to hold a dominant position in the Permian Basin, one of the leading oil-and-gas basins
in the world. Our unique portfolio of unconventional and conventional acreage differentiates us from competitors. Our Permian Resources business adds unconventional, short-cycle production at high rates, while our Permian Enhanced Oil Recovery (EOR) business provides reliable production and steady cash flow. Our midstream assets are complementary to and support upstream operations, providing an integrated business from point of production to point of sale.
In 2017, we enhanced our Permian Basin position with the goal of accelerating cash flow and improving future returns. We acquired the controlling interest in the Seminole-San Andres carbon dioxide (CO
2) EOR unit, making it the largest such
operation in our portfolio. Demonstrating our industry-leading capability in EOR technology and operating mature oil fields at a high margin, we increased plant throughput capacity by 10 percent within one month of assuming operatorship, improving gross production by 2,300 barrels of oil equivalent (BOE) per day. Concurrently, we divested non-core Permian Resources acreage, maximizing the net present value of our portfolio.
Our investment in data analytics, subsurface characterization, seismic acquisition and petro-physical models generated breakthrough productivity gains in Permian Resources. Some of our New Mexico wells ranked among the most productive in the basin’s history, based on average 30-day performance rates.
Internationally, our long-term, low-decline assets continued to be a significant driver of free cash flow. We operate in four core countries where we have decades of experience and valuable partnerships — Oman, Qatar and the United Arab Emirates in the Middle East and Colombia in Latin America. In 2017, we produced our billionth gross barrel of oil, including condensate, in Oman, a demonstration of operational excellence.
Worldwide oil and gas production was 594,000 BOE per day from ongoing operations in 2017, compared to 575,000 from a year ago. We ended the year with Permian Resources production up 29 percent in the last quarter of 2017, compared to the same period the year before.
We had a strong year growing the company’s reserve base, with estimated total proved reserves of 2.6 billion BOE at year-end 2017, compared to 2.4 billion BOE at year-end 2016. Our total company reserve replacement ratio was nearly 190 percent. We replaced about 280 percent of our domestic production, with Permian Resources replacing 365 percent of its production. Our finding-and-development costs were $8.53 per BOE company-wide, a 12 percent improvement from a year ago. Occidental’s ability to replace reserves and improve the efficiencies of our operations makes us more competitive.
2
18030002_2_OXY_AR_2017_Interior_r18_EP2.indd 2 3/14/18 11:44 AM

OxyChem, Occidental’s world-class chemical business, continued to generate high financial returns, a result of improved market fundamentals, operational excellence and focus on efficiency. We successfully completed two major projects on time and within budget. In Ingleside, Texas, we began operations of our joint venture ethylene cracker with Mexichem. In Geismar, Louisiana, we started manufacturing 4CPe, a raw material enabling the efficient production of next-generation, climate-friendly refrigerants. This product was developed by OxyChem, and we’ve patented the process globally.
In midstream, our crude oil terminal at Ingleside made Occidental a leader in exports from the U.S. Gulf Coast. Benefiting from widening Brent-to-WTI price differentials, we delivered Permian crude to new markets in Europe, India, China and East Asia.We were the first Gulf Coast terminal to dock a 2-million-barrel-capacity Very Large Crude Carrier (VLCC) — among the largest oil tankers in the world — and are in the process of upgrading our facility to load these vessels more quickly. Our ability to load VLCCs dockside will reduce the per-barrel cost of transportation and make our terminal more competitive in shipping Permian crude to global markets.
Our commitment to safety remains unchanged. I’m proud to say that our teams live this philosophy every day and our entire organization continues to make strides toward preventing all incidents. For example, in 2017, we achieved our best-ever employee safety performance, based on the U.S. Department of Labor’s Injury and Illness Incidence Rate, and, in Qatar, our employees and contractors achieved a second full year without a recordable injury.
We strive to be a Partner of Choice® everywhere we operate, and to be a valued partner in the communities where we do business. We were honored to be named No. 1 in the Mining, Crude-Oil Production category in Fortune magazine’s 2018 World’s Most Admired Companies list. This was our 10th time to achieve this top ranking, which we have received every reported year since 2008.
As part of our ongoing commitment to environmental stewardship and shareholder communication, we published a climate report on our efforts to reduce emissions and prepare for a lower carbon economy. The report demonstrates how we are uniquely positioned to help reduce CO
2 emissions
because of our expertise in EOR and carbon capture, utilization and sequestration. We believe our leadership in these areas provides a long-term competitive advantage.
I want to express my appreciation to our Board of Directors, my fellow employees, investors and other stakeholders. Occidental continues to sustain our unique value proposition of dividend and moderate production growth with the strongest portfolio in our company’s history, a focused plan and a best-in-class workforce that continues to innovate and improve the way we do business.
This is an exciting time for our industry, and I am confident that Occidental is well-positioned for success.
Vicki HollubPresident and Chief Executive Officer
18030002_2_OXY_AR_2017_Interior_r18_EP2.indd 3 3/14/18 11:45 AM

2017 Financial & Operational Review
2017 Financial & Operational Review
Occidental achieved a year of strong operational performance in 2017, increasing the dividend and growing production. We remained focused on improving our overall performance, generating shareholder value and delivering sustainable, long-term growth.
2017 Financial Performance
Net income for 2017 was $1.3 billion ($1.70 per diluted share), compared with a loss of $574 million (75 cents per diluted share) for 2016.
Operating cash flow before working capital changes was $5 billion in 2017, and capital expenditures were $3.6 billion. We returned $2.3 billion of cash to our shareholders in the form of dividends. We exited 2017 with a cash balance of $1.7 billion.
Standard & Poor’s and Moody’s rating services maintained Occidental’s ‘A’ and ‘A3’ ratings, respectively, both with a stable outlook. Superior debt ratings give Occidental enhanced financial liquidity.
2017 Market Performance
Occidental’s closing stock price at the end of 2017 was $73.66 per share, up 3 percent from $71.23 at the end of 2016. The company’s market capitalization at year-end was approximately $56.4 billion, and our ranking within the S&P 500, which is based on market capitalization, was No. 101 at the close of 2017.
2017 Oi l and Gas Performance
Worldwide oil and gas production volumes from ongoing operations averaged 594,000 barrels of oil equivalent (BOE) per day for 2017, compared with 575,000 BOE per day in the prior year. U.S. production from ongoing operations was 296,000 BOE per day, and international production was 298,000 BOE per day.
Our worldwide realized crude oil price for 2017 averaged $48.93 per barrel, an approximately 26 percent increase from $38.73 per barrel in 2016. Worldwide natural gas liquids (NGL) prices rose 46 percent to $21.63 per barrel
in 2017, and domestic natural gas prices were higher by nearly 22 percent to $2.31 per thousand cubic feet.
The company’s worldwide estimated proved reserves increased 8 percent to 2.6 billion BOE at year-end 2017, from 2.4 billion BOE the year before. Occidental’s reserve replacement ratio was nearly 190 percent, with Permian Resources replacing approximately 365 percent. Approximately 74 percent of our total proved reserves at year-end 2017 were developed and 75 percent of proved reserves were liquids.
Occidental’s oil and gas segment reported earnings of $1.1 billion in 2017, compared with a loss of $0.6 billion in 2016.
UNITED STATES OIL AND GAS OPERATIONS
Our U.S. oil and gas business is focused in the Permian Basin of West Texas and southeast New Mexico, where Occidental is one of the largest acreage holders and oil producers, with an approximate 9 percent net share of the total oil production in the basin. The company’s 2017 Permian production was 291,000 BOE per day, up more than 8 percent from 269,000 BOE per day the year before.
Occidental manages operations in the Permian Basin through two businesses: Permian Resources, which consists of growth-oriented unconventional opportunities, and Permian EOR, which utilizes enhanced oil recovery (EOR) techniques such as carbon dioxide (CO
2) floods
and waterfloods.
Permian Resources is our fastest-growing asset, with over 11,200 drilling locations in its horizontal inventory focused in the Midland and Delaware basins. In 2017, Permian Resources produced an average of 141,000 BOE per day, a nearly 14 percent increase from 124,000 BOE per day in 2016.
Permian EOR produced 150,000 BOE per day in 2017. Nearly three quarters of our Permian EOR production is from fields that actively employ CO
2 flooding. Each year,
we inject approximately 950 billion cubic feet of CO2 into
oil reserves, making Occidental the largest CO2 injector in
the Permian and among the largest globally. Occidental is a world leader in applying this technology, which can increase ultimate oil recovery by 10 to 25 percent in the fields where it is employed. This technology also has the potential to significantly reduce CO
2 emissions.
4
18030002_2_OXY_AR_2017_Interior_r18_EP2.indd 4 3/14/18 11:45 AM

In June 2017, Occidental enhanced its portfolio with a number of purchase and sale transactions in the Permian Basin. We acquired controlling interest in the Seminole-San Andres Unit, a premier CO
2 flood that is
now our largest operated, oil-producing EOR unit, and the Seminole Gas Processing Plant. The transactions also included CO
2 source fields at the Bravo Dome and West
Bravo Dome Units.
MIDDLE EAST OIL AND GAS OPERATIONS
Occidental’s core areas in the Middle East are Oman, Qatar and the United Arab Emirates (UAE). Our goal in this region is to operate a focused business and generate free cash flow. The region represented approximately 45 percent of 2017 total worldwide ongoing production, or 266,000 BOE per day.
Occidental has operated in Oman for more than 30 years and is the largest independent oil producer in the country. In 2017, we produced our billionth gross barrel of oil, including condensate. Our major operations are concentrated at the Mukhaizna Field in south-central Oman, and in northern Oman, primarily at the Safah Field and Block 62. In 2017, Occidental signed a 15-year contract extension for Block 9, and was awarded an exploration agreement for Block 30, adjacent to blocks we already operate. Our 2017 share of production in Oman averaged 95,000 BOE per day.
In Qatar, Occidental is the second-largest oil producer offshore with primary operations at Idd El Shargi North Dome and Idd El Shargi South Dome. Occidental also participates in the Dolphin Gas Project, the premier transborder natural gas project in the Middle East, delivering gas from Qatar’s North Field to customers in the UAE and Oman. Occidental’s total 2017 share of production from Qatar was approximately 100,000 BOE per day.
In the UAE, Occidental is a partner with Abu Dhabi National Oil Company (ADNOC) on Al Hosn Gas. One of the largest natural gas developments in the Middle East, Al Hosn Gas gross production exceeded expectations in 2017, with Occidental’s share at 71,000 BOE per day.
LATIN AMERICA OIL AND GAS OPERATIONS
Our Latin America operations, primarily focused in Colombia, provided 32,000 BOE per day in 2017, representing about 5 percent of the company’s worldwide production. These assets continue to generate very high returns and substantial free cash flow.
2017 Midstream and Market ing Performance
Occidental’s midstream and marketing segment gathers, processes, transports, stores, purchases and markets hydrocarbons and other commodities primarily in support of Occidental’s upstream businesses.
In 2017, the midstream and marketing segment earned $85 million, compared with a loss of $0.4 billion in 2016. In the first full year of operations at the Ingleside, Texas, crude oil terminal, Occidental became the largest exporter of light sweet crude from the U.S. Gulf Coast.
2017 Chemical Performance
Occidental Chemical Corporation (OxyChem), a wholly owned subsidiary, mainly manufactures and markets chlor-alkali products and vinyls used in water treatment, paper production, pharmaceuticals, construction, automobile manufacturing, soaps and disinfecting products, among numerous other beneficial applications. Chemical segment earnings were $822 million in 2017, compared with $571 million the year before.
The joint-venture ethylene cracker at OxyChem’s Ingleside plant began operations in early 2017. In December 2017, our Geismar, Louisiana, plant began manufacturing 4CPe, a raw material used in making next-generation, climate-friendly refrigerants with a low global-warming and zero ozone-depletion potential.
Social Responsibi l i ty
Occidental is committed to providing safe, healthy and secure workplaces; protecting the environment; maintaining high ethical standards; upholding and promoting human rights; and respecting cultural norms and values, everywhere we operate.
The safety of our operations, workforce and neighbors is our highest priority. Occidental’s 2017 combined employee-and-contractor Injury and Illness Incidence Rate of 0.26 is less than one-tenth of the current U.S. private industry average for employees of 2.9 published by the U.S. Bureau of Labor Statistics.
Our core values of investment, integrity and innovation are essential to our success, to operating responsibly and building our global reputation as a Partner of Choice®.
5Occidental 2017 Annual Report
18030002_2_OXY_AR_2017_Interior_r18_EP2.indd 5 3/14/18 11:45 AM

6
SPENCER ABRAHAM 2, 4
Chairman and Chief Executive Officer, The Abraham Group LLC; Former U.S. Secretary of Energy
AVEDICK B. POLADIAN 1, 3
Former Executive Vice President and Chief Operating Officer, Lowe Enterprises, Inc.
CARLOS M. GUTIERREZ 1, 3
Co-Chair, Albright Stonebridge Group; Former U.S. Secretary of Commerce; Former President and Chairman, Kellogg Company
MARGARET M. FORAN 2, 3
Chief Governance Officer, Senior Vice President and Corporate Secretary, Prudential Financial, Inc.
JOHN E. FEICK 2, 3, 4
Chairman, Matrix Solutions Inc.
EUGENE L. BATCHELDER 3
Former Senior Vice President and Chief Administrative Officer, ConocoPhillips
JACK B. MOORE 2, 4
Former Chairman and Chief Executive Officer, Cameron International Corporation
VICKI HOLLUBPresident and Chief Executive Officer, Occidental Petroleum Corporation
Board of Directors and Management
ELISSE B. WALTER 1, 4
Former Chairman, U.S. Securities and Exchange Commission
18030002_2_OXY_AR_2017_Interior_r18_EP2.indd 6 3/14/18 11:45 AM

BOARD COMMITTEE INVOLVEMENT AS OF DECEMBER 31, 2017
1 Member of the Audit Committee
2 Member of the Executive Compensation Committee
3 Member of the Corporate Governance, Nominating and Social Responsibility Committee
4 Member of the Environmental, Health and Safety Committee
7Occidental 2017 Annual Report
HOWARD I. ATKINS 1, 4
Former Senior Executive Vice President and Chief Financial Officer, Wells Fargo & Company
WILLIAM R. KLESSE 2, 4
Former Chairman and Chief Executive Officer, Valero Energy Corporation
PRESIDENT AND CHIEF EXECUTIVE OFFICER
Vicki Hollub
EXECUTIVE AND SENIOR VICE PRESIDENTS
Edward A. (Sandy) Lowe | Executive Vice President and Group Chairman, Middle East
Marcia E. Backus | Senior Vice President, General Counsel and Chief Compliance Officer
Oscar K. Brown | Senior Vice President, Corporate Strategy and Development
Cedric W. Burgher | Senior Vice President and Chief Financial Officer
Kenneth Dillon | Senior Vice President and President, International Oil and Gas Operations
Joseph C. (Jody) Elliott | Senior Vice President and President, Occidental Oil and Gas – Domestic
Robert E. Palmer | Senior Vice President, Technical Support, Occidental Oil and Gas Corporation
Jeff F. Simmons | Senior Vice President, Technical Planning and Evaluation
Glenn M. Vangolen | Senior Vice President, Business Support
Cynthia L. Walker | Senior Vice President, Marketing and Midstream Operations and Development
VICE PRESIDENTS AND KEY DIVISIONAL EXECUTIVES
Ioannis A. (Yanni) Charalambous | Vice President and Chief Information Officer
Gary L. Daugherty | Vice President, Internal Audit
Ian M. Davis | Vice President, Government Relations
Bernard F. (Ben) Figlock | Vice President and Treasurer
Burnis J. (B.J.) Hebert | President, Occidental Chemical Corporation
Elliott Heide | Vice President, Health, Environment and Safety,and Corporate Secretary
Richard A. Jackson | Vice President, Investor Relations
Jennifer M. Kirk | Vice President and Principal Accounting Officer
Sunil Mathew | Vice President, Strategic Planning and Analysis
Darin S. Moss | Vice President, Human Resources
Melissa E. Schoeb | Vice President, Corporate Affairs
Michael P. Ure | Vice President and Senior Vice President, Business Development, Occidental Oil and Gas Corporation
18030002_2_OXY_AR_2017_Interior_r18_EP2.indd 7 3/14/18 11:45 AM

2.56
2.88 2.97 3.02 3.06
1
217 229261 273
210 212
268302
427 441
529575
296
298
594
10.2
8.9
3.32.5
5.0
147 156183 186
169 172
197 194316 328
380 380
200
181
381
1 Excludes Bahrain, California, Hugoton, Iraq, Libya, Piceance, South Texas, Williston and Yemen.
Occidental by the Numbers
2013 2014 2015 2016 2017
2013 2014 2015 2016 2017
2013 2014 2015 2016 2017
2013 2014 2015 2016 2017
United States International
DIVIDENDS PER COMMON SHAREIn dollars
WORLDWIDE PRODUCTION1
Ongoing MBOEPD
CASH FLOW FROM CONTINUING OPERATIONS$ in billions
WORLDWIDE OIL PRODUCTION1
Ongoing MBOPD
8
18030002_2_OXY_AR_2017_Interior_r18_EP2.indd 8 3/14/18 11:45 AM

2017Form 10-K
PAGE 1 OF 10K - PRINTS ON FINANCIALS STOCK

UNITED STATES SECURITIES AND EXCHANGE COMMISSIONWashington, D.C. 20549
Form 10-K
Annual Report Pursuant to Section 13 or 15(d) of the Securities Exchange Act of 1934
Transition Report Pursuant to Section 13 or 15(d) of the Securities Exchange Act of 1934
For the fiscal year ended December 31, 2017 For the transition period from to
Commission File Number 1-9210
Occidental Petroleum Corporation(Exact name of registrant as specified in its charter)
State or other jurisdiction of incorporation or organization DelawareI.R.S. Employer Identification No. 95-4035997Address of principal executive offices 5 Greenway Plaza, Suite 110, Houston, TexasZip Code 77046Registrant's telephone number, including area code (713) 215-7000
Securities registered pursuant to Section 12(b) of the Act:
Title of Each Class Name of Each Exchange on Which Registered9 1/4% Senior Debentures due 2019 New York Stock ExchangeCommon Stock, $0.20 par value New York Stock Exchange
Securities registered pursuant to Section 12(g) of the Act: None
Indicate by check mark if the registrant is a well-known seasoned issuer, as defined in Rule 405 of the Securities Act. Yes No
Indicate by check mark if the registrant is not required to file reports pursuant to Section 13 or Section 15(d) of the Act: (Note: Checking the box will not relieve any registrant required to file reports pursuant to Section 13 or 15(d) of the Exchange Act from their obligations under those Sections). Yes No
Indicate by check mark whether the registrant (1) has filed all reports required to be filed by Section 13 or 15(d) of the Securities Exchange Act of 1934 during the preceding 12 months (or for such shorter period that the registrant was required to file such reports), and (2) has been subject to such filing requirements for the past 90 days. Yes No
Indicate by check mark whether the registrant has submitted electronically and posted on its corporate web site, if any, every Interactive Date File required to be submitted and posted pursuant to Rule 405 of Regulation S-T during the preceding 12 months (or such shorter period as the registrant was required to submit and post files). Yes No
Indicate by check mark if disclosure of delinquent filers pursuant to Item 405 of Regulation S-K is not contained herein, and will not be contained, to the best of registrant's knowledge, in definitive proxy or information statements incorporated by reference in Part III of this Form 10-K or any amendment to this Form 10-K.
Indicate by check mark whether the registrant is a large accelerated filer, an accelerated filer, a non-accelerated filer or a smaller reporting company. (See definition of "large accelerated filer," "accelerated filer" and "smaller reporting company" in Rule 12b-2 of the Exchange Act).
Large Accelerated Filer Accelerated Filer Emerging Growth CompanyNon-Accelerated Filer Smaller Reporting Company
If an Emerging Growth Company, indicate by check mark if the registrant has elected not to use the extended transition period for complying with any new or revised financial accounting standards provided pursuant to Section 13(a) of the Exchange Act.
Indicate by check mark whether the registrant is a shell company (as defined in Exchange Act Rule 12b-2) Yes No
The aggregate market value of the voting common stock held by nonaffiliates of the registrant was approximately $45.8 billion, computed by reference to the closing price on the New York Stock Exchange composite tape of $59.87 per share of Common Stock on June 30, 2017. Shares of Common Stock held by each executive officer and director have been excluded from this computation in that such persons may be deemed to be affiliates. This determination of potential affiliate status is not a conclusive determination for other purposes.
At January 31, 2018, there were 765,148,694 shares of Common Stock outstanding, par value $0.20 per share.
DOCUMENTS INCORPORATED BY REFERENCEPortions of the registrant’s definitive Proxy Statement, relating to its May 4, 2018 Annual Meeting of Stockholders, are incorporated
by reference into Part III.

TABLE OF CONTENTS Page
Part IItems 1 and 2 Business and Properties.........................................................................................................................................................
General.............................................................................................................................................................................Oil and Gas Operations....................................................................................................................................................Chemical Operations........................................................................................................................................................Midstream and Marketing Operations...............................................................................................................................Capital Expenditures.........................................................................................................................................................Employees........................................................................................................................................................................Environmental Regulation.................................................................................................................................................Available Information.........................................................................................................................................................
Item 1A Risk Factors............................................................................................................................................................................Item 1B Unresolved Staff Comments...................................................................................................................................................Item 3 Legal Proceedings..................................................................................................................................................................Item 4 Mine Safety Disclosures.........................................................................................................................................................
Executive Officers...................................................................................................................................................................Part II
Item 5 Market for Registrant’s Common Equity, Related Stockholder Matters and Issuer Purchases of Equity Securities..............Item 6 Selected Financial Data..........................................................................................................................................................Item 7 Management’s Discussion and Analysis of Financial Condition and Results of Operations (MD&A).....................................
Strategy.............................................................................................................................................................................Oil and Gas Segment........................................................................................................................................................Chemical Segment............................................................................................................................................................Midstream and Marketing Segment..................................................................................................................................Segment Results of Operations and Significant Items Affecting Earnings........................................................................Taxes.................................................................................................................................................................................Consolidated Results of Operations.................................................................................................................................Consolidated Analysis of Financial Position......................................................................................................................Liquidity and Capital Resources.......................................................................................................................................Off-Balance-Sheet Arrangements.....................................................................................................................................Contractual Obligations.....................................................................................................................................................Lawsuits, Claims and Contingencies................................................................................................................................Environmental Liabilities and Expenditures......................................................................................................................Foreign Investments.........................................................................................................................................................Critical Accounting Policies and Estimates.......................................................................................................................Significant Accounting and Disclosure Changes...............................................................................................................Safe Harbor Discussion Regarding Outlook and Other Forward-Looking Data................................................................
Item 7A Quantitative and Qualitative Disclosures About Market Risk..................................................................................................Item 8 Financial Statements and Supplementary Data.....................................................................................................................
Report of Independent Registered Public Accounting Firm on Consolidated Financial Statements.................................Report of Independent Registered Public Accounting Firm on Internal Control Over Financial Reporting.......................Consolidated Balance Sheets...........................................................................................................................................Consolidated Statements of Operations...........................................................................................................................Consolidated Statements of Comprehensive Income.......................................................................................................Consolidated Statements of Stockholders' Equity.............................................................................................................Consolidated Statements of Cash Flows..........................................................................................................................Notes to Consolidated Financial Statements....................................................................................................................Quarterly Financial Data (Unaudited)................................................................................................................................Supplemental Oil and Gas Information (Unaudited).........................................................................................................
Financial Statement Schedule:Schedule II – Valuation and Qualifying Accounts..............................................................................................................
Item 9 Changes in and Disagreements with Accountants on Accounting and Financial Disclosure.................................................Item 9A Controls and Procedures........................................................................................................................................................
Management's Annual Assessment of and Report on Internal Control Over Financial Reporting....................................Disclosure Controls and Procedures.................................................................................................................................
Item 9B Other Information....................................................................................................................................................................
Part IIIItem 10 Directors, Executive Officers and Corporate Governance......................................................................................................Item 11 Executive Compensation........................................................................................................................................................Item 12 Security Ownership of Certain Beneficial Owners and Management ....................................................................................Item 13 Certain Relationships and Related Transactions and Director Independence.......................................................................Item 14 Principal Accounting Fees and Services................................................................................................................................
Part IVItem 15 Exhibits and Financial Statement Schedules.........................................................................................................................Item 16 Form 10-K Summary..............................................................................................................................................................
33345666668889
911121213192021232425262728282930303434343636373840414243447375
919292929292
9293939393
9395

3
Part I ITEMS 1 AND 2 BUSINESS AND PROPERTIES
In this report, "Occidental" means Occidental Petroleum Corporation, a Delaware corporation (OPC) incorporated in 1986, or OPC and one or more entities in which it owns a controlling interest (subsidiaries). Occidental conducts its operations through various subsidiaries and affiliates. Occidental’s executive offices are located at 5 Greenway Plaza, Suite 110, Houston, Texas 77046; telephone (713) 215-7000.
GENERALOccidental’s principal businesses consist of three
segments. The oil and gas segment explores for, develops and produces oil and condensate, natural gas liquids (NGLs) and natural gas. The chemical segment (OxyChem) mainly manufactures and markets basic chemicals and vinyls. The midstream and marketing segment gathers, processes, transports, stores, purchases and markets oil, condensate, NGLs, natural gas, carbon dioxide (CO2) and power. It also trades around its assets, including transportation and storage capacity. Additionally, the midstream and marketing segment operates a crude oil export terminal, as well as invests in entities that conduct similar activities.
For information regarding Occidental's segments, geographic areas of operation and current developments, including strategies and actions related thereto, see the information in the "Management’s Discussion and Analysis of Financial Condition and Results of Operations" (MD&A) section of this report and Note 16 to the Consolidated Financial Statements.
OIL AND GAS OPERATIONSGeneral
Occidental’s domestic upstream oil and gas operations are located in New Mexico and Texas. International operations are located in Colombia, Oman, Qatar and the United Arab Emirates (UAE).
Proved Reserves and Sales VolumesThe table below shows Occidental’s total oil, NGLs and
natural gas proved reserves and sales volumes in 2017, 2016 and 2015. See "MD&A — Oil and Gas Segment," and the information under the caption "Supplemental Oil and Gas Information" for certain details regarding Occidental’s proved reserves, the reserves estimation process, sales and production volumes, production costs and other reserves-related data.
Competition As a producer of oil and condensate, NGLs and natural
gas, Occidental competes with numerous other domestic and foreign private and government producers. Oil, NGLs and natural gas are commodities that are sensitive to prevailing global and local, current and anticipated market conditions. Occidental competes for transportation capacity and infrastructure for the delivery of its products, which are sold at current market prices or on a forward basis to refiners and other market participants. Occidental’s competitive strategy relies on increasing production through developing conventional and unconventional fields, utilizing primary and enhanced oil recovery (EOR) techniques and strategic acquisitions in areas where Occidental has a competitive advantage as a result of its current successful operations or investments in shared infrastructure. Occidental also competes to develop and produce its worldwide oil and gas reserves cost-effectively, maintain a skilled workforce and obtain quality services.
Comparative Oil and Gas Proved Reserves and Sales Volumes
Oil, which includes condensate, and NGLs are in millions of barrels; natural gas is in billions of cubic feet (Bcf); barrels of oil equivalent (BOE) are in millions.
2017 2016 2015Proved Reserves Oil NGLs Gas BOE (a) Oil NGLs Gas BOE (a) Oil NGLs Gas BOE (a)
United States 1,107 247 1,205 1,555 960 219 1,045 1,353 915 186 1,019 1,271International 408 198 2,626 1,043 397 201 2,729 1,053 394 144 2,349 929Total 1,515 445 3,831 2,598 1,357 420 3,774 2,406 1,309 330 3,368 2,200Sales VolumesUnited States 73 20 108 111 69 19 132 110 73 20 155 119International 66 11 188 109 74 11 217 121 86 7 205 127Total 139 31 296 220 143 30 349 231 159 27 360 246
Note: The detailed proved reserves information presented in accordance with Item 1202(a)(2) to Regulation S-K under the Securities Exchange Act of 1934 (Exchange Act) is provided under the heading "Supplemental Oil and Gas Information". Proved reserves are stated on a net basis after applicable royalties.(a) Natural gas volumes are converted to BOE at six thousand cubic feet (Mcf) of gas per one barrel of oil. Barrels of oil equivalence does not necessarily result in price
equivalence. The price of natural gas on a barrel of oil equivalent basis is currently substantially lower than the corresponding price for oil and has been similarly lower for a number of years. For example, in 2017, the average prices of West Texas Intermediate (WTI) oil and New York Mercantile Exchange (NYMEX) natural gas were $51.34 per barrel and $3.08 per Mcf, respectively, resulting in an oil to gas ratio of 17 to 1.
4
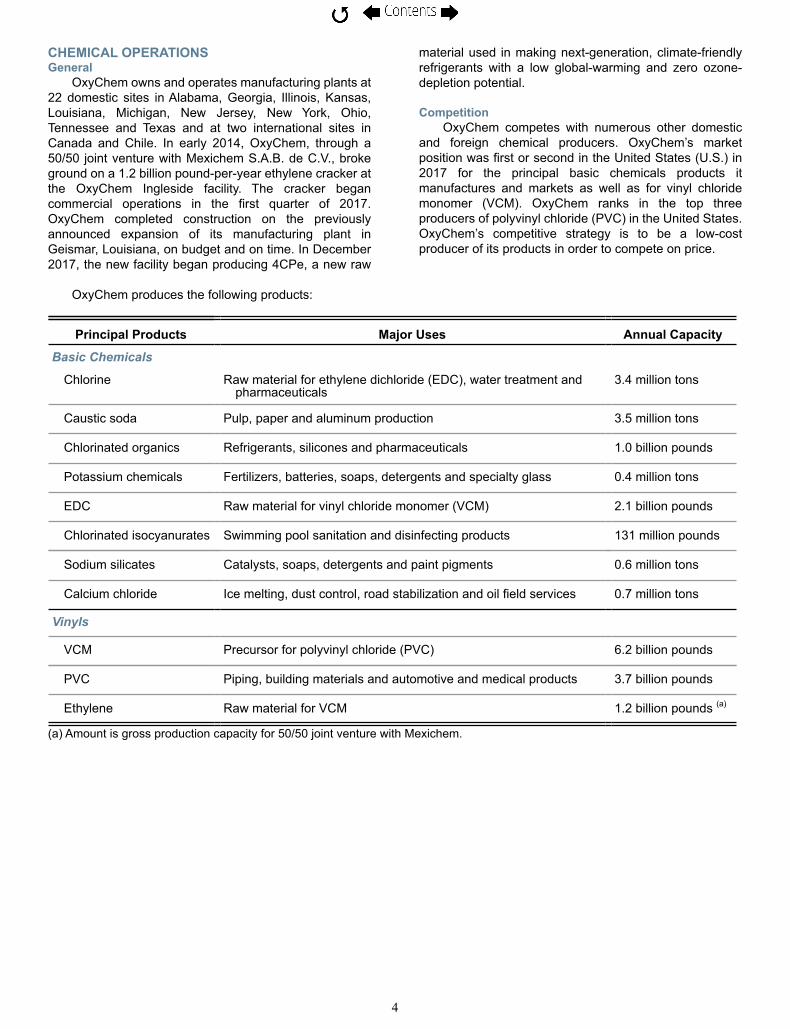
CHEMICAL OPERATIONSGeneral
OxyChem owns and operates manufacturing plants at 22 domestic sites in Alabama, Georgia, Illinois, Kansas, Louisiana, Michigan, New Jersey, New York, Ohio, Tennessee and Texas and at two international sites in Canada and Chile. In early 2014, OxyChem, through a 50/50 joint venture with Mexichem S.A.B. de C.V., broke ground on a 1.2 billion pound-per-year ethylene cracker at the OxyChem Ingleside facility. The cracker began commercial operations in the first quarter of 2017. OxyChem completed construction on the previously announced expansion of its manufacturing plant in Geismar, Louisiana, on budget and on time. In December 2017, the new facility began producing 4CPe, a new raw
material used in making next-generation, climate-friendly refrigerants with a low global-warming and zero ozone-depletion potential.
CompetitionOxyChem competes with numerous other domestic
and foreign chemical producers. OxyChem’s market position was first or second in the United States (U.S.) in 2017 for the principal basic chemicals products it manufactures and markets as well as for vinyl chloride monomer (VCM). OxyChem ranks in the top three producers of polyvinyl chloride (PVC) in the United States. OxyChem’s competitive strategy is to be a low-cost producer of its products in order to compete on price.
OxyChem produces the following products:
Principal Products Major Uses Annual Capacity
Basic Chemicals
Chlorine Raw material for ethylene dichloride (EDC), water treatment andpharmaceuticals
3.4 million tons
Caustic soda Pulp, paper and aluminum production 3.5 million tons
Chlorinated organics Refrigerants, silicones and pharmaceuticals 1.0 billion pounds
Potassium chemicals Fertilizers, batteries, soaps, detergents and specialty glass 0.4 million tons
EDC Raw material for vinyl chloride monomer (VCM) 2.1 billion pounds
Chlorinated isocyanurates Swimming pool sanitation and disinfecting products 131 million pounds
Sodium silicates Catalysts, soaps, detergents and paint pigments 0.6 million tons
Calcium chloride Ice melting, dust control, road stabilization and oil field services 0.7 million tons
Vinyls
VCM Precursor for polyvinyl chloride (PVC) 6.2 billion pounds
PVC Piping, building materials and automotive and medical products 3.7 billion pounds
Ethylene Raw material for VCM 1.2 billion pounds (a)
(a) Amount is gross production capacity for 50/50 joint venture with Mexichem.
5
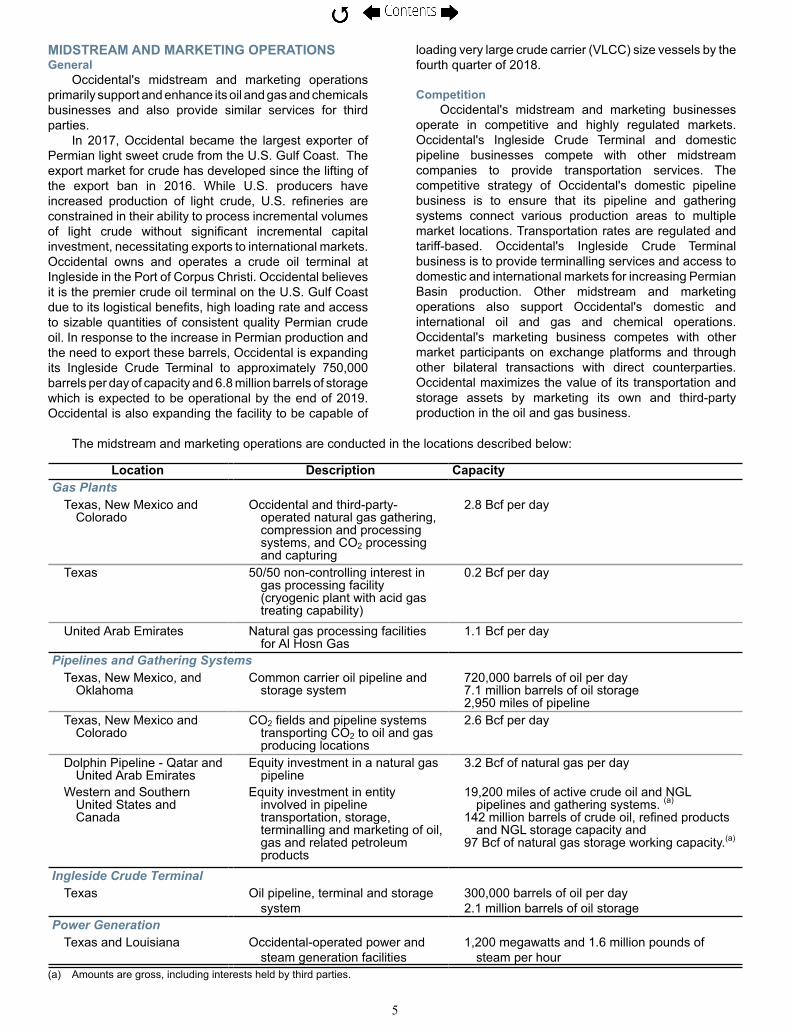
MIDSTREAM AND MARKETING OPERATIONSGeneral
Occidental's midstream and marketing operations primarily support and enhance its oil and gas and chemicals businesses and also provide similar services for third parties.
In 2017, Occidental became the largest exporter of Permian light sweet crude from the U.S. Gulf Coast. The export market for crude has developed since the lifting of the export ban in 2016. While U.S. producers have increased production of light crude, U.S. refineries are constrained in their ability to process incremental volumes of light crude without significant incremental capital investment, necessitating exports to international markets. Occidental owns and operates a crude oil terminal at Ingleside in the Port of Corpus Christi. Occidental believes it is the premier crude oil terminal on the U.S. Gulf Coast due to its logistical benefits, high loading rate and access to sizable quantities of consistent quality Permian crude oil. In response to the increase in Permian production and the need to export these barrels, Occidental is expanding its Ingleside Crude Terminal to approximately 750,000 barrels per day of capacity and 6.8 million barrels of storage which is expected to be operational by the end of 2019. Occidental is also expanding the facility to be capable of
loading very large crude carrier (VLCC) size vessels by the fourth quarter of 2018.
CompetitionOccidental's midstream and marketing businesses
operate in competitive and highly regulated markets. Occidental's Ingleside Crude Terminal and domestic pipeline businesses compete with other midstream companies to provide transportation services. The competitive strategy of Occidental's domestic pipeline business is to ensure that its pipeline and gathering systems connect various production areas to multiple market locations. Transportation rates are regulated and tariff-based. Occidental's Ingleside Crude Terminal business is to provide terminalling services and access to domestic and international markets for increasing Permian Basin production. Other midstream and marketing operations also support Occidental's domestic and international oil and gas and chemical operations. Occidental's marketing business competes with other market participants on exchange platforms and through other bilateral transactions with direct counterparties. Occidental maximizes the value of its transportation and storage assets by marketing its own and third-party production in the oil and gas business.
The midstream and marketing operations are conducted in the locations described below:
Location Description CapacityGas Plants
Texas, New Mexico andColorado
Occidental and third-party-operated natural gas gathering, compression and processing systems, and CO2 processing and capturing
2.8 Bcf per day
Texas 50/50 non-controlling interest ingas processing facility(cryogenic plant with acid gastreating capability)
0.2 Bcf per day
United Arab Emirates Natural gas processing facilitiesfor Al Hosn Gas
1.1 Bcf per day
Pipelines and Gathering SystemsTexas, New Mexico, and
OklahomaCommon carrier oil pipeline and
storage system720,000 barrels of oil per day7.1 million barrels of oil storage2,950 miles of pipeline
Texas, New Mexico andColorado
CO2 fields and pipeline systems transporting CO2 to oil and gas producing locations
2.6 Bcf per day
Dolphin Pipeline - Qatar andUnited Arab Emirates
Equity investment in a natural gaspipeline
3.2 Bcf of natural gas per day
Western and SouthernUnited States andCanada
Equity investment in entityinvolved in pipelinetransportation, storage,terminalling and marketing of oil,gas and related petroleumproducts
19,200 miles of active crude oil and NGL pipelines and gathering systems. (a)
142 million barrels of crude oil, refined products and NGL storage capacity and
97 Bcf of natural gas storage working capacity.(a)
Ingleside Crude TerminalTexas Oil pipeline, terminal and storage
system300,000 barrels of oil per day2.1 million barrels of oil storage
Power GenerationTexas and Louisiana Occidental-operated power and
steam generation facilities1,200 megawatts and 1.6 million pounds of
steam per hour(a) Amounts are gross, including interests held by third parties.

6
CAPITAL EXPENDITURESFor information on capital expenditures, see the
information under the heading "Liquidity and Capital Resources” in the MD&A section of this report.
EMPLOYEESOccidental employed approximately 11,000 people at
December 31, 2017, 7,000 of whom were located in the U.S. Occidental employed approximately 7,000 people in the oil and gas and midstream and marketing segments and 3,000 people in the chemical segment. An additional 1,000 people were employed in administrative and headquarters functions. Approximately 500 U.S.-based employees and 900 foreign-based employees are represented by labor unions.
ENVIRONMENTAL REGULATIONFor environmental regulation information, including
associated costs, see the information under the heading "Environmental Liabilities and Expenditures" in the MD&A section of this report and "Risk Factors."
AVAILABLE INFORMATIONOccidental makes the following information available
free of charge on its website at www.oxy.com:
Forms 10-K, 10-Q, 8-K and amendments to these forms as soon as reasonably practicable after they are electronically filed with, or furnished to, the Securities and Exchange Commission (SEC);
Other SEC filings, including Forms 3, 4 and 5; and
Corporate governance information, including its Corporate Governance Policies, board-committee charters and Code of Business Conduct.
Information contained on Occidental's website is not part of this report.
ITEM 1A RISK FACTORS Volatile global and local commodity pricing strongly
affect Occidental’s results of operations.Occidental's financial results correlate closely to the prices
it obtains for its products, particularly oil and, to a lesser extent, natural gas and NGLs, and its chemical products.
Prices for crude oil, natural gas and NGLs fluctuate widely. Historically, the markets for crude oil, natural gas, NGLs and refined products have been volatile and may continue to be volatile in the future. If the prices of oil, natural gas, or NGLs continue to be volatile, reverse their recent increases or decline, Occidental's operations, financial condition, cash flows and level of expenditures may be materially and adversely affected.
Prices are set by global and local market forces which are not in Occidental's control. These factors include, among others:
Worldwide and domestic supplies of, and demand for, crude oil, natural gas, NGLs and refined products.The cost of exploring for, developing, producing, refining and marketing crude oil, natural gas, NGLs and refined products.Operational impacts such as production disruptions, technological advances and regional market conditions,
including available transportation capacity and infrastructure constraints in producing areas. Changes in weather patterns and climate.The impacts of the members of OPEC and other non-OPEC member-producing nations that may agree to and maintain production levels.The worldwide military and political environment, uncertainty or instability resulting from an escalation or outbreak of armed hostilities or acts of terrorism in the United States, or elsewhere.The price and availability of alternative and competing fuels.Domestic and foreign governmental regulations and taxes.Additional or increased nationalization and expropriation activities by foreign governments.General economic conditions worldwide.Volatility in commodity futures markets.
The long-term effects of these and other conditions on the
prices of crude oil, natural gas, NGLs and refined products are uncertain. Generally, Occidental's practice is to remain exposed to market prices of commodities; however, management may elect to hedge the price risk of crude oil, natural gas and NGLs in the future.
The prices obtained for Occidental’s chemical products correlate strongly to the health of the United States and global economies, as well as chemical industry expansion and contraction cycles. Occidental also depends on feedstocks and energy to produce chemicals, which are commodities subject to significant price fluctuations.
Occidental may experience delays, cost overruns, losses or other unrealized expectations in development efforts and exploration activities.
Occidental bears the risks of equipment failures, construction delays, escalating costs or competition for services, materials, supplies or labor, property or border disputes, disappointing drilling results or reservoir performance, title problems and other associated risks that may affect its ability to profitably grow production, replace reserves and achieve its targeted returns.
Exploration is inherently risky and is subject to delays, misinterpretation of geologic or engineering data, unexpected geologic conditions or finding reserves of disappointing quality or quantity, which may result in significant losses.
Governmental actions and political instability may affect Occidental’s results of operations.
Occidental’s businesses are subject to the decisions of many federal, state, local and foreign governments and political interests. As a result, Occidental faces risks of:
New or amended laws and regulations, or new or different applications or interpretations of existing laws and regulations, including those related to drilling, manufacturing or production processes (including well stimulation techniques such as hydraulic fracturing and acidization), labor and employment, taxes, royalty rates, permitted production rates, entitlements, import, export and use of raw materials, equipment or products, use or increased use of land, water and other natural resources, safety, the manufacturing of chemicals, asset integrity management, the marketing of commodities, security and environmental protection, all of which may restrict or prohibit activities of Occidental or its contractors, increase

7
Occidental's costs or reduce demand for Occidental's products.Refusal of, or delay in, the extension or grant of exploration, development or production contracts.Development delays and cost overruns due to approval delays for, or denial of, drilling, construction, environmental and other permits and authorizations. In addition, Occidental has and may continue to
experience adverse consequences, such as risk of loss or production limitations, because certain of its international operations are located in countries affected by political instability, nationalizations, corruption, armed conflict, terrorism, insurgency, civil unrest, security problems, labor unrest, OPEC production restrictions, equipment import restrictions and sanctions. Exposure to such risks may increase if a greater percentage of Occidental’s future oil and gas production or revenue comes from international sources.
Occidental's oil and gas business operates in highly competitive environments, which affect, among other things, its ability to make acquisitions to grow production and replace reserves.
Results of operations, reserves replacement and growth in oil and gas production depend, in part, on Occidental’s ability to profitably acquire additional reserves. Occidental has many competitors (including national oil companies), some of which: (i) are larger and better funded, (ii) may be willing to accept greater risks or (iii) have special competencies. Competition for reserves may make it more difficult to find attractive investment opportunities or require delay of reserve replacement efforts. In addition, during periods of low product prices, any cash conservation efforts may delay production growth and reserve replacement efforts.
Occidental’s acquisition activities also carry risks that it may: (i) not fully realize anticipated benefits due to less-than-expected reserves or production or changed circumstances, such as declines in crude oil, NGL, and gas prices; (ii) bear unexpected integration costs or experience other integration difficulties; (iii) experience share price declines based on the market’s evaluation of the activity; or (iv) assume liabilities that are greater than anticipated.
Occidental’s oil and gas reserves are estimates based on professional judgments and may be subject to revision.
Reported oil and gas reserves are an estimate based on periodic review of reservoir characteristics and recoverability, including production decline rates, operating performance and economic feasibility at the prevailing commodity prices, assumptions concerning future crude oil and natural gas prices, future operating costs and capital expenditures, and assumed effects of regulation by governmental agencies. The procedures and methods for estimating the reserves by our internal engineers were reviewed by independent petroleum consultants; however, there are inherent uncertainties in estimating reserves. Actual production, revenues and expenditures with respect to our reserves may vary from estimates, and the variance may be material. If Occidental were required to make significant negative reserve revisions, its results of operations and stock price could be adversely affected. In addition, the discounted cash flows included in this Form 10-K should not be construed as the fair value of the reserves attributable to our properties. The estimated discounted future net cash flows from proved reserves are based on an unweighted 12-month average first-day-of-the-month prices in accordance with SEC regulations. Actual future
prices and costs may differ materially from SEC regulation-compliant prices and costs used for purposes of estimating future discounted net cash flows from proved reserves.
Concerns about climate change and further regulation of greenhouse gas emissions may adversely affect Occidental’s operations or results.
Continuing political and social attention to the issue of climate change has resulted in both existing and pending international agreements and national, regional and local legislation and regulatory programs to reduce greenhouse gas emissions. These and other government actions relating to greenhouse gas emissions could require Occidental to incur increased operating and maintenance costs, such as costs to purchase and operate emissions control systems, to acquire emissions allowances or comply with new regulatory or reporting requirements, or they could promote the use of alternative sources of energy and thereby decrease demand for oil, natural gas and other products that Occidental’s businesses produce. Any such legislation or regulatory programs could also increase the cost of consuming, and thereby reduce demand for, oil, natural gas and other products produced by Occidental’s businesses. Consequently, government actions designed to reduce emissions of greenhouse gases could have an adverse effect on Occidental’s business, financial condition and results of operations. In addition, increasing attention to climate change risks has resulted in an increased possibility of governmental investigations and additional private litigation against Occidental, which could increase our costs or otherwise adversely affect our business.
It is difficult to predict the timing and certainty of such government actions and the ultimate effect on Occidental, which could depend on, among other things, the type and extent of greenhouse gas reductions required, the availability and price of emissions allowances or credits, the availability and price of alternative fuel sources, the energy sectors covered, and Occidental’s ability to recover the costs incurred through its operating agreements or the pricing of the company’s oil, natural gas and other products.
Occidental’s businesses may experience catastrophic events.
The occurrence of events such as hurricanes, floods, droughts, earthquakes or other acts of nature, well blowouts, fires, explosions, chemical releases, crude oil releases, including maritime releases and releases into navigable waters, material or mechanical failure, industrial accidents, physical attacks and other events that cause operations to cease or be curtailed may negatively affect Occidental’s businesses and the communities in which it operates. Coastal operations are particularly susceptible to disruption from extreme weather events. Third-party insurance may not provide adequate coverage or Occidental may be self-insured with respect to the related losses.
Cyber-attacks could significantly affect Occidental.Cyber-attacks on businesses have escalated in recent
years. Occidental relies on digital systems, related infrastructure, technologies and networks to run its business and to control and manage its oil and gas, chemicals, marketing and pipeline operations. Use of the internet, cloud services and other public networks exposes Occidental’s business and that of other third parties with whom Occidental does business to cyber-attacks that attempt to gain unauthorized access to

8
data and systems, release confidential information, corrupt data and disrupt critical systems and operations. Even though Occidental has implemented controls and multiple layers of security to mitigate the risks of a cyber-attack that it believes are reasonable, there can be no assurance that such cyber security measures will be sufficient to prevent security breaches of its systems from occurring. Further, Occidental has no control over the comparable systems of the third parties with whom it does business. While Occidental has experienced cyber-attacks in the past, Occidental has not suffered any material losses. However, if in the future Occidental's cyber security measures are compromised or prove insufficient, the potential consequences to Occidental’s businesses and the communities in which it operates could be significant. As cyber-attacks continue to evolve in magnitude and sophistication, Occidental may be required to expend additional resources in order to continue to enhance Occidental's cyber security measures and to investigate and remediate any digital systems, related infrastructure, technologies and network security vulnerabilities.
Occidental's oil and gas reserve additions may not continue at the same rate and a failure to replace reserves may negatively affect Occidental's business.
Unless Occidental conducts successful exploration or development activities, acquires properties containing proved reserves, or both, proved reserves will generally decline. Management expects improved recovery, extensions and discoveries to continue as main sources for reserve additions but factors such as geology, government regulations and permits, and the effectiveness of development plans are partially or fully outside management's control and could cause results to differ materially from expectations.
The ultimate impact of the 2017 Tax Cuts and Jobs Act (Tax Reform) may differ from Occidental's estimates.
Tax Reform was enacted in December 2017 and made significant changes to the U.S. federal income tax law, including lowering the federal corporate income tax rate from 35 percent to 21 percent, repealing the corporate alternative minimum tax (AMT) and mandating a deemed repatriation of accumulated earnings and profits of U.S.-owned foreign corporations. Occidental recorded the effects of the changes in the tax law for which the accounting was complete. In accordance with the guidance from the SEC, Occidental recorded a provisional estimate for the federal and state tax associated with the mandatory deemed repatriation and the resulting impact to the net federal deferred tax liability. With regards to the global intangible low-taxed income (GILTI) and base erosion anti-abuse tax (BEAT) provisions of the new tax law, Occidental has recorded no tax liability based on preliminary estimates. The ultimate impact of Tax Reform may differ from Occidental’s
estimates due to changes in interpretations and assumptions, as well as additional regulatory guidance. Occidental will adjust provisional amounts as updated information is evaluated.
Other risk factors.Additional discussion of risks and uncertainties related to
price and demand, litigation, environmental matters, oil and gas reserves estimation processes, impairments, derivatives, market risks and internal controls appears under the headings: "MD&A — Oil & Gas Segment — Proved Reserves" and "— Industry Outlook," "— Chemical Segment — Industry Outlook," "— Midstream and Marketing Segment — Industry Outlook," "— Lawsuits, Claims and Contingencies," "— Environmental Liabilities and Expenditures," "— Critical Accounting Policies and Estimates," "— Quantitative and Qualitative Disclosures About Market Risk," and "Management's Annual Assessment of and Report on Internal Control Over Financial Reporting."
The risks described in this report are not the only risks facing Occidental and other risks, including risks deemed immaterial, may have material adverse effects.
ITEM 1B UNRESOLVED STAFF COMMENTSNone.
ITEM 3 LEGAL PROCEEDINGS In the fourth quarter of 2014, the U.S. Department of
Transportation Pipeline and Hazardous Materials Safety Administration sent a notice to an OPC subsidiary that it is seeking penalties of $165,900 related to a routine, comprehensive inspection of the subsidiary's records, procedures and facilities, covering a multi-year period. The subsidiary contested the penalties and is awaiting a decision.
In the third quarter of 2014, the U.S. Department of Transportation Pipeline and Hazardous Materials Safety Administration sent a notice to an OPC subsidiary that it is seeking civil penalties related to a crude oil pipeline incident in Scurry County, Texas. The subsidiary is contesting the $122,400 in penalties being sought.
For information regarding other legal proceedings, see the information under the caption "Lawsuits, Claims Commitments and Contingencies" in the MD&A section of this report and in Note 9 to the Consolidated Financial Statements.
ITEM 4 MINE SAFETY DISCLOSURESNot applicable.

9
EXECUTIVE OFFICERSThe current term of office of each executive officer of Occidental will expire at the May 4, 2018, meeting of the Board of
Directors or when a successor is selected. The following table sets forth the executive officers of Occidental:
NameCurrent Title
Age at February 22,2018 Positions with Occidental and Subsidiaries and Employment History
Vicki HollubChief Executive Officer and President
58 President, Chief Executive Officer and Director since April 2016; President, Chief Operating Officer and Director, 2015-2016; Senior Executive Vice President and President, Oxy Oil and Gas, 2015; Executive Vice President and President Oxy Oil and Gas - Americas, 2014-2015; Vice President and Executive Vice President, U.S. Operations, Oxy Oil and Gas, 2013-2014; Executive Vice President - California Operations, 2012-2013.
Cedric W. BurgherChief Financial Officer and Senior Vice President
57 Senior Vice President and Chief Financial Officer since May 2017; EOG Resources: Senior Vice President, Investor and Public Relations, 2014-2017, QR Energy L.P.; Chief Financial Officer, 2010-2014.
Edward A. “Sandy” LoweExecutive Vice President
66 Executive Vice President since 2015; Group Chairman - Middle East since 2016; Senior Vice President, 2008-2015; President - Oxy Oil & Gas International, 2009-2016.
Marcia E. BackusSenior Vice President
63 Senior Vice President, General Counsel and Chief Compliance Officer since December 2016; Senior Vice President, General Counsel, Chief Compliance Officer and Corporate Secretary, 2015-2016; Vice President, General Counsel and Corporate Secretary, 2014-2015; Vice President and General Counsel, 2013-2014; Vinson & Elkins: Partner, 1990-2013.
Joseph C. ElliottSenior Vice President
60 Senior Vice President since December 2016; President - Oxy Oil & Gas Domestic since June 2015; President and General Manager - Permian Resources Midland, 2014-2015; Manager Operations/Well Construction - Permian Resources, 2013-2014; Manager Operations - South Texas, 2011-2013.
Glenn M. VangolenSenior Vice President
59 Senior Vice President - Business Support since February 2015; Executive Vice President - Business Support, 2014-2015; Senior Vice President - Oxy Oil & Gas Middle East, 2010-2014.
Jennifer M. KirkVice President
43 Vice President, Controller and Principal Accounting Officer since 2014; Controller, Occidental Oil and Gas Corporation, 2012-2014.
Part IIITEM 5 MARKET FOR REGISTRANT'S COMMON EQUITY, RELATED STOCKHOLDER MATTERS
AND ISSUER PURCHASES OF EQUITY SECURITIES
TRADING PRICE RANGE AND DIVIDENDS This section incorporates by reference the quarterly financial data appearing under the caption "Quarterly Financial Data
(Unaudited)" after the Notes to the Consolidated Financial Statements, and the information appearing under the caption "Liquidity and Capital Resources" in the MD&A section of this report. Occidental’s common stock was held by approximately 24,500 stockholders of record at January 31, 2018, and by approximately 700,000 additional stockholders whose shares were held for them in street name or nominee accounts. The common stock is listed and traded on the New York Stock Exchange. The quarterly financial data set forth the range of trading prices for the common stock as reported on the composite tape of the New York Stock Exchange and quarterly dividend information.
Dividends declared on the common stock were $0.76 for the first and second quarter of 2017 and $0.77 for the third and fourth quarter ($3.06 for the year). On February 8, 2018, a quarterly dividend of $0.77 per share was declared on the common stock, payable on April 16, 2018, to stockholders of record on March 9, 2018. The current annual dividend rate of $3.08 per share has increased by over 500 percent since 2002. The declaration of future dividends is a business decision made by the Board of Directors from time to time, and will depend on Occidental’s financial condition and other factors deemed relevant by the Board.
SECURITIES AUTHORIZED FOR ISSUANCE UNDER EQUITY COMPENSATION PLANSAll of Occidental's stock-based compensation plans for its employees and non-employee directors have been approved
by the stockholders. The aggregate number of shares of Occidental common stock authorized for issuance under such plans is approximately 35 million, of which approximately 6.1 million had been reserved for issuance through December 31, 2017. The following is a summary of the securities available for issuance under such plans:
a) Number of securities to be issued uponexercise of outstanding options, warrantsand rights
b) Weighted-average exercise price ofoutstanding options, warrants and rights
c) Number of securities remaining available forfuture issuance under equity compensationplans (excluding securities in column (a))
7,339,506 (1) 79.98 (2) 18,836,578 (3)
(1) Includes shares reserved to be issued pursuant to restricted stock units, stock options (Options), and performance-based awards. Shares for performance-based awards are included assuming maximum payout, but may be paid out at lesser amounts, or not at all, according to achievement of performance goals.
(2) Price applies only to the Options included in column (a). Exercise price is not applicable to the other awards included in column (a).(3) A plan provision requires each share covered by an award (other than stock appreciation rights (SARs) and Options) to be counted as if three
shares were issued in determining the number of shares that are available for future awards. Accordingly, the number of shares available for future awards may be less than the amount shown depending on the type of award granted. Additionally, under the plan, the amount shown may increase, depending on the award type, by the number of shares currently unvested or forfeitable, or three times that number as applicable, that (i) fail to vest, (ii) are forfeited or canceled, or (iii) correspond to the portion of any stock-based awards settled in cash.
10
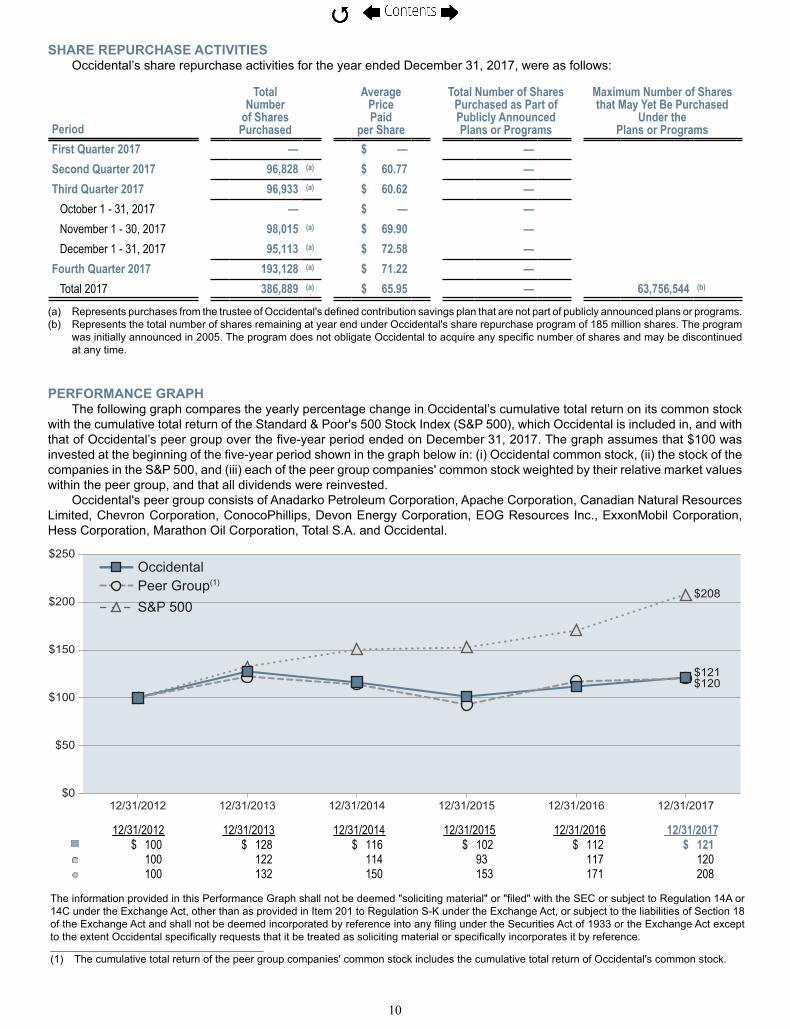
SHARE REPURCHASE ACTIVITIESOccidental’s share repurchase activities for the year ended December 31, 2017, were as follows:
Period
Total Number
of Shares Purchased
Average Price Paid
per Share
Total Number of Shares Purchased as Part of Publicly Announced Plans or Programs
Maximum Number of Shares that May Yet Be Purchased
Under the Plans or Programs
First Quarter 2017 — $ — —Second Quarter 2017 96,828 (a) $ 60.77 —Third Quarter 2017 96,933 (a) $ 60.62 —
October 1 - 31, 2017 — $ — —November 1 - 30, 2017 98,015 (a) $ 69.90 —December 1 - 31, 2017 95,113 (a) $ 72.58 —
Fourth Quarter 2017 193,128 (a) $ 71.22 —Total 2017 386,889 (a) $ 65.95 — 63,756,544 (b)
(a) Represents purchases from the trustee of Occidental's defined contribution savings plan that are not part of publicly announced plans or programs.(b) Represents the total number of shares remaining at year end under Occidental's share repurchase program of 185 million shares. The program
was initially announced in 2005. The program does not obligate Occidental to acquire any specific number of shares and may be discontinued at any time.
PERFORMANCE GRAPHThe following graph compares the yearly percentage change in Occidental’s cumulative total return on its common stock
with the cumulative total return of the Standard & Poor's 500 Stock Index (S&P 500), which Occidental is included in, and with that of Occidental’s peer group over the five-year period ended on December 31, 2017. The graph assumes that $100 was invested at the beginning of the five-year period shown in the graph below in: (i) Occidental common stock, (ii) the stock of the companies in the S&P 500, and (iii) each of the peer group companies' common stock weighted by their relative market values within the peer group, and that all dividends were reinvested.
Occidental's peer group consists of Anadarko Petroleum Corporation, Apache Corporation, Canadian Natural Resources Limited, Chevron Corporation, ConocoPhillips, Devon Energy Corporation, EOG Resources Inc., ExxonMobil Corporation, Hess Corporation, Marathon Oil Corporation, Total S.A. and Occidental.
12/31/2012 12/31/2013 12/31/2014 12/31/2015 12/31/2016 12/31/2017$ 100 $ 128 $ 116 $ 102 $ 112 $ 121
100 122 114 93 117 120100 132 150 153 171 208
The information provided in this Performance Graph shall not be deemed "soliciting material" or "filed" with the SEC or subject to Regulation 14A or 14C under the Exchange Act, other than as provided in Item 201 to Regulation S-K under the Exchange Act, or subject to the liabilities of Section 18 of the Exchange Act and shall not be deemed incorporated by reference into any filing under the Securities Act of 1933 or the Exchange Act except to the extent Occidental specifically requests that it be treated as soliciting material or specifically incorporates it by reference.________________________________________________(1) The cumulative total return of the peer group companies' common stock includes the cumulative total return of Occidental's common stock.
$250
$200
$150
$100
$50
$0
$208
12/31/2012 12/31/2013 12/31/2014 12/31/2015 12/31/2016 12/31/2017
$120$121
Occidental
S&P 500Peer Group(1)
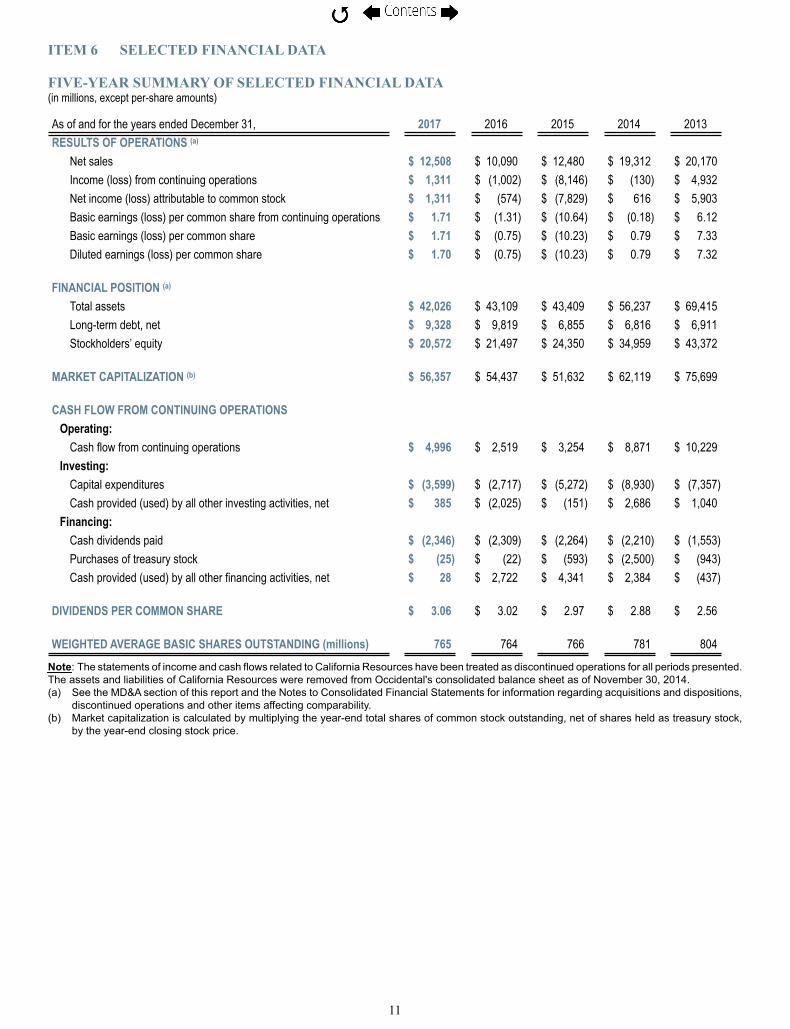
11
ITEM 6 SELECTED FINANCIAL DATA FIVE-YEAR SUMMARY OF SELECTED FINANCIAL DATA(in millions, except per-share amounts)
As of and for the years ended December 31, 2017 2016 2015 2014 2013RESULTS OF OPERATIONS (a)
Net sales $ 12,508 $ 10,090 $ 12,480 $ 19,312 $ 20,170Income (loss) from continuing operations $ 1,311 $ (1,002) $ (8,146) $ (130) $ 4,932Net income (loss) attributable to common stock $ 1,311 $ (574) $ (7,829) $ 616 $ 5,903Basic earnings (loss) per common share from continuing operations $ 1.71 $ (1.31) $ (10.64) $ (0.18) $ 6.12Basic earnings (loss) per common share $ 1.71 $ (0.75) $ (10.23) $ 0.79 $ 7.33Diluted earnings (loss) per common share $ 1.70 $ (0.75) $ (10.23) $ 0.79 $ 7.32
FINANCIAL POSITION (a)
Total assets $ 42,026 $ 43,109 $ 43,409 $ 56,237 $ 69,415Long-term debt, net $ 9,328 $ 9,819 $ 6,855 $ 6,816 $ 6,911Stockholders’ equity $ 20,572 $ 21,497 $ 24,350 $ 34,959 $ 43,372
MARKET CAPITALIZATION (b) $ 56,357 $ 54,437 $ 51,632 $ 62,119 $ 75,699
CASH FLOW FROM CONTINUING OPERATIONSOperating:
Cash flow from continuing operations $ 4,996 $ 2,519 $ 3,254 $ 8,871 $ 10,229Investing:
Capital expenditures $ (3,599) $ (2,717) $ (5,272) $ (8,930) $ (7,357)Cash provided (used) by all other investing activities, net $ 385 $ (2,025) $ (151) $ 2,686 $ 1,040
Financing:Cash dividends paid $ (2,346) $ (2,309) $ (2,264) $ (2,210) $ (1,553)Purchases of treasury stock $ (25) $ (22) $ (593) $ (2,500) $ (943)Cash provided (used) by all other financing activities, net $ 28 $ 2,722 $ 4,341 $ 2,384 $ (437)
DIVIDENDS PER COMMON SHARE $ 3.06 $ 3.02 $ 2.97 $ 2.88 $ 2.56
WEIGHTED AVERAGE BASIC SHARES OUTSTANDING (millions) 765 764 766 781 804
Note: The statements of income and cash flows related to California Resources have been treated as discontinued operations for all periods presented. The assets and liabilities of California Resources were removed from Occidental's consolidated balance sheet as of November 30, 2014. (a) See the MD&A section of this report and the Notes to Consolidated Financial Statements for information regarding acquisitions and dispositions,
discontinued operations and other items affecting comparability.(b) Market capitalization is calculated by multiplying the year-end total shares of common stock outstanding, net of shares held as treasury stock,
by the year-end closing stock price.

12
ITEM 7 MANAGEMENT'S DISCUSSION AND ANALYSIS OF FINANCIAL CONDITION AND RESULTS OF OPERATIONS (MD&A)
In this report, "Occidental" means Occidental Petroleum Corporation (OPC), or OPC and one or more entities in which it owns a controlling interest (subsidiaries). Occidental's principal businesses consist of three segments. The oil and gas segment explores for, develops and produces oil and condensate, natural gas liquids (NGLs) and natural gas. The chemical segment (OxyChem) mainly manufactures and markets basic chemicals and vinyls. The midstream and marketing segment gathers, processes, transports, stores, purchases and markets oil, condensate, NGLs, natural gas, carbon dioxide (CO2) and power. It also trades around its assets, including transportation and storage capacity. Additionally, the midstream and marketing segment operates a crude oil export terminal, as well as invests in entities that conduct similar activities.
Occidental's oil and gas assets are located in some of the world’s highest-margin basins and are characterized by an advantaged mix of short- and long-cycle, high-return development opportunities. In the United States, Occidental continues to hold a leading position in the Permian Basin. Other core operations are in the Middle East (Oman, Qatar and UAE) and Latin America (Colombia). Occidental's midstream and marketing business provides access to domestic and international markets through pipeline infrastructure and Occidental's Ingleside Crude Terminal with an emphasis on operational excellence. OxyChem is a world-class chemical business that generates high financial returns.
STRATEGYGeneral
Occidental is focused on delivering a unique shareholder value proposition through continual enhancements to its asset quality, organizational capability and innovative technical applications that provide competitive advantages. The attributes of Occidental's strategy include its mix of short- and long-cycle investment opportunities, low base production declines, strong financial position and focus on generating shareholder returns through its value-based development approach. Occidental aims to maximize shareholder returns through a combination of:
Consistent dividend growth; Value growth through oil and gas development that
meets above cost-of-capital returns and return targets of greater than 15 percent and 20 percent for domestic and international projects, respectively;
Targeted production growth rates of 5 to 8 percent average per year over the long-term; and
Maintenance of a strong balance sheet to secure business and enhance shareholder value.Occidental conducts its operations with a focus on its
social responsibility commitments and initiatives, including health and safety, and environmental stewardship. Capital is employed to operate all assets in a safe and environmentally sound manner. Occidental accepts
commodity, engineering and limited exploration risks. Occidental seeks to limit its financial and political risks.
Price volatility is inherent in the oil and gas business and Occidental’s strategy is to position the business to thrive in an up- or down-cycle commodity price environment. Recent strategic initiatives have resulted in Occidental exiting its non-core areas, including South Texas in 2017, and strengthening its position in areas where Occidental has a competitive advantage and an advantaged asset portfolio. In 2017, Occidental continued to build upon its business, including a growing dividend and production growth at low oil prices. During the year, Occidental's board of directors and management implemented a short-term strategic plan that is intended to maintain production and sustain the dividend at a West Texas Intermediate (WTI) oil price of $40 per barrel. At $50 WTI, Occidental’s plan anticipates that the business will generate additional capital to cover production growth of 5 to 8 percent, and fulfill Occidental's dividend growth goal. This plan has continued into 2018 and, longer term, Occidental will continue to build upon this low-cost, high-margin value proposition through development and operation of its focused and advantaged assets.
The following describes the application of Occidental’s overall strategy for each of its operating segments:
Oil and GasOccidental’s oil and gas segment focuses on long-term
value creation and leadership in health, safety and the environment. In each core operating area, Occidental's operations benefit from scale, technical expertise, environmental and safety leadership, and commercial and governmental collaboration. These attributes allow Occidental to bring additional production quickly to market, extend the life of older fields at lower costs, and provide low-cost growth opportunities with advanced technology.
As a result of Occidental's strategic positioning, Occidental's assets provide current production and a future portfolio of projects that are flexible, have short-cycle investment paybacks, deliver a low base decline and provide decades of diverse and unique opportunities to support energy demand across many future scenarios. Together with Occidental's technical capabilities, the oil and gas segment is able to achieve low development and operating costs to obtain full-cycle value while promoting innovative ideas that differentiate Occidental's approach and provide future opportunities.
The oil and gas business implements Occidental's strategy primarily by:
Operating and developing areas where reserves are known to exist and to increase production from core areas, primarily in the Permian Basin, Colombia, Oman, Qatar and UAE;
Focusing on cost-reduction efficiencies, improvement in new well productivity and better base management to reduce total spend per barrel;

13
Using enhanced oil recovery techniques, such as CO2, water and steam floods, in mature fields;
Focusing many of Occidental's subsurface characterization and technical activities on unconventional opportunities, primarily in the Permian Basin. This focus is in support of a sizable capital program within these developments and
Maintaining a disciplined and prudent approach to capital expenditures with focus on returns and maintain discipline and an emphasis on creating value and further enhancing Occidental's existing positions.
In 2017, oil and gas capital expenditures were approximately $3.0 billion, and were mainly comprised of expenditures in the Permian Basin and the Middle East. This activity reflects Occidental's strategy to focus on achieving returns well above the cost of capital even in a low price environment.
Management believes Occidental's oil and gas segment growth will occur primarily through exploitation and development opportunities in the Permian Basin and Colombia and focused international projects in the Middle East.
ChemicalThe primary objective of OxyChem is to generate cash
flow in excess of its normal capital expenditure requirements and achieve above-cost-of-capital returns. The chemical segment's strategy is to be a low-cost producer in order to maximize its cash flow generation. OxyChem concentrates on the chlorovinyls chain beginning with chlorine, which is co-produced with caustic soda, and markets both to external customers. In addition, chlorine, together with ethylene, is converted through a series of intermediate products into polyvinyl chloride (PVC). OxyChem's focus on chlorovinyls allows it to maximize the benefits of integration and take advantage of economies of scale. Capital is employed to sustain production capacity in a safe and environmentally sound manner, as well as to focus on projects and developments designed to improve the competitiveness of segment assets. Acquisitions and plant development opportunities may be pursued when they are expected to enhance the existing core chlor-alkali and PVC businesses or take advantage of other specific opportunities. In the first quarter of 2017, OxyChem, through a 50/50 joint venture with Mexichem S.A.B. de C.V., began commercial operations on a 1.2 billion pound-per-year ethylene cracker at the OxyChem Ingleside facility. The joint venture provides an opportunity to capitalize on the advantage that U.S. shale gas development has presented to U.S. chemical producers by providing low-cost ethane as a raw material. The joint venture will provide OxyChem with an ongoing source of ethylene, significantly reducing OxyChem's reliance on third-party ethylene suppliers. In 2017, capital expenditures for OxyChem totaled $308 million. An additional $39 million was contributed to the Mexichem joint venture. OxyChem completed construction on the previously announced expansion of its manufacturing plant in Geismar, Louisiana, on budget and on time. In December 2017, the new facility began producing 4CPe, a new raw
material used in making next-generation, climate-friendly refrigerants with a low global-warming and zero ozone-depletion potential.
Midstream and Marketing
The midstream and marketing segment strives to maximize realized value by optimizing the use of its transportation, storage and terminal assets and by providing access to domestic and international market alternatives. To generate returns, the segment evaluates opportunities across the value chain and uses its assets to provide services to Occidental subsidiaries as well as third parties. The midstream and marketing segment invests in and operates pipeline and gathering systems, gas plants, co-generation facilities, storage facilities and terminal assets. This segment also seeks to minimize the costs of gas, power and other commodities used in Occidental's various businesses. Capital is employed to sustain or expand facilities in the gathering, transportation, storage and terminal assets to improve the competitiveness of Occidental's businesses. In 2017, capital expenditures totaled $284 million related to Permian Basin gas processing and gathering infrastructure, Al Hosn Gas, the Ingleside Crude Terminal, and expansion of the oil pipeline system in New Mexico by an additional 50 miles.
Key Performance IndicatorsOccidental seeks to meet its strategic goals by
continually measuring its success in its key performance metrics that drive total stockholder return. In addition to production growth and capital allocation and deployment discussed above, Occidental believes the following are its most significant metrics:
Health, environmental and safety performance measures;
Total Shareholder Return, including funding the dividend;
Return on capital employed (ROCE) and cash return on capital employed (CROCE); and
Specific measures such as per-unit profit, production cost, cash flow, finding-and-development costs and reserves replacement percentages.
OIL AND GAS SEGMENTBusiness Environment
Oil and gas prices are the major variables that drive the industry’s financial performance. The following table presents the average daily West Texas Intermediate (WTI), Brent and New York Mercantile Exchange (NYMEX) prices for 2017 and 2016:
2017 2016WTI oil ($/barrel) $ 50.95 $ 43.32Brent oil ($/barrel) $ 54.82 $ 45.04NYMEX gas ($/Mcf) $ 3.09 $ 2.42

14
The following table presents Occidental's average realized prices as a percentage of WTI, Brent and NYMEX for 2017 and 2016:
2017 2016Worldwide oil as a percentage of average WTI 96% 89%Worldwide oil as a percentage of average Brent 89% 86%Worldwide NGLs as a percentage of average WTI 42% 34%Worldwide NGLs as a percentage of average Brent 39% 33%Domestic natural gas as a percentage of NYMEX 75% 79%
Average WTI and Brent oil price indexes increased 18 percent and 22 percent, from $43.32 and $45.04 in 2016 to $50.95 and $54.82 in 2017, respectively. Average worldwide realized oil prices rose $10.20, or 26 percent, in 2017 compared to 2016. WTI and Brent oil price indexes increased in the fourth quarter of 2017, closing at $60.42 per barrel and $66.87 per barrel, respectively, well above 2017 average prices. The average realized domestic natural gas price in 2017 increased 22 percent from 2016. Average NYMEX natural gas prices increased 28 percent, from $2.42 in 2016 to $3.09 in 2017.
Prices and differentials can vary significantly, even on a short-term basis, making it difficult to predict realized prices with a reliable degree of certainty.
Operations2017 Developments
In the third quarter of 2017, Occidental closed on two divestitures of non-core acreage in the Permian Basin for proceeds of approximately $0.6 billion, resulting in a pre-tax gain of approximately $81 million. Concurrently, Occidental purchased additional ownership interests and assumed operatorship in CO2 enhanced oil recovery (EOR) properties located in the Seminole-San Andres Unit for approximately $0.6 billion, which was primarily allocated to proved property. In the fourth quarter of 2017, Occidental sold other non-core proved and unproved acreage in the Permian Basin for approximately $90 million, resulting in a pre-tax gain of approximately $55 million. Occidental also classified approximately $0.5 billion in non-core proved and unproved Permian acreage to assets held for sale at December 31, 2017.
In April 2017, Occidental completed the sale of its South Texas operations for net proceeds of $0.5 billion resulting in pre-tax gain of $0.5 billion.
Business ReviewDomestic Interests
Occidental conducts its domestic operations through land leases, subsurface mineral rights it owns, or a combination of both surface land and subsurface mineral rights it owns. Occidental's domestic oil and gas leases have a primary term ranging from one to ten years, which is extended through the end of production once it commences. Of the total 3.4 million net acres in which Occidental has interests, approximately 83 percent is leased, 16 percent is owned subsurface mineral rights and 1 percent is owned land with mineral rights.
The following charts show Occidental’s domestic total production volumes for the last five years:
Notes:• Excludes volumes from California Resources, which was
separated on November 30, 2014, and included as discontinued operations for all applicable periods.
• Operations sold include South Texas (sold in April 2017), Piceance (sold in March 2016), Williston (sold in November 2015) and Hugoton (sold in April 2014)
United States Assets
United States
1. Delaware Basin2. Midland Basin3. Central Basin Platform
Permian Basin The Permian Basin extends throughout West Texas
and southeast New Mexico and is one of the largest and most active oil basins in the United States, accounting for more than 20% of the total United States oil production.
Occidental manages its Permian Basin operations through two business units: Permian Resources, which includes growth-oriented unconventional opportunities, and Permian EOR, which utilizes enhanced oil recovery techniques such as CO2 floods and waterfloods. Occidental has a leading position in the Permian Basin, producing
2017 2016 20142015 2013
296
8
304 302
29
273
328
Domestic Ongoing
67
261
318
89
229
320
103
217
Operations Sold
Domestic Production Volumes(thousands BOE/day)
1 2
3
N E WN E WM E X I C OM E X I C O
T E X A ST E X A S
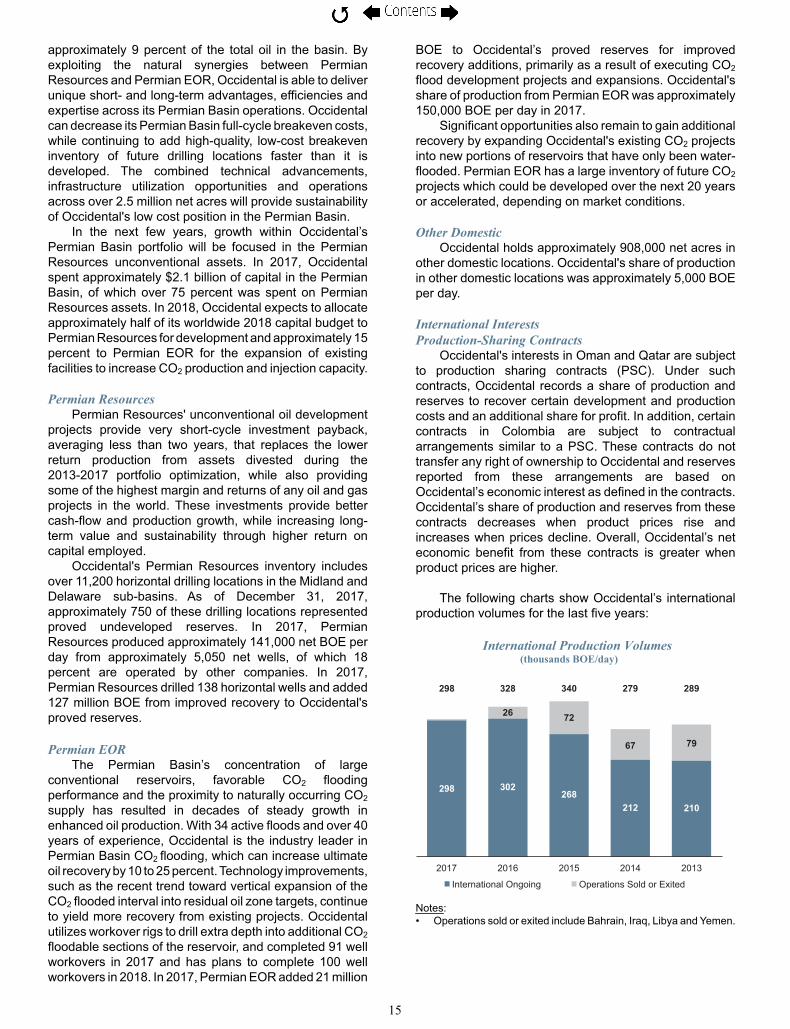
15
approximately 9 percent of the total oil in the basin. By exploiting the natural synergies between Permian Resources and Permian EOR, Occidental is able to deliver unique short- and long-term advantages, efficiencies and expertise across its Permian Basin operations. Occidental can decrease its Permian Basin full-cycle breakeven costs, while continuing to add high-quality, low-cost breakeven inventory of future drilling locations faster than it is developed. The combined technical advancements, infrastructure utilization opportunities and operations across over 2.5 million net acres will provide sustainability of Occidental's low cost position in the Permian Basin.
In the next few years, growth within Occidental’s Permian Basin portfolio will be focused in the Permian Resources unconventional assets. In 2017, Occidental spent approximately $2.1 billion of capital in the Permian Basin, of which over 75 percent was spent on Permian Resources assets. In 2018, Occidental expects to allocate approximately half of its worldwide 2018 capital budget to Permian Resources for development and approximately 15 percent to Permian EOR for the expansion of existing facilities to increase CO2 production and injection capacity.
Permian ResourcesPermian Resources' unconventional oil development
projects provide very short-cycle investment payback, averaging less than two years, that replaces the lower return production from assets divested during the 2013-2017 portfolio optimization, while also providing some of the highest margin and returns of any oil and gas projects in the world. These investments provide better cash-flow and production growth, while increasing long-term value and sustainability through higher return on capital employed.
Occidental's Permian Resources inventory includes over 11,200 horizontal drilling locations in the Midland and Delaware sub-basins. As of December 31, 2017, approximately 750 of these drilling locations represented proved undeveloped reserves. In 2017, Permian Resources produced approximately 141,000 net BOE per day from approximately 5,050 net wells, of which 18 percent are operated by other companies. In 2017, Permian Resources drilled 138 horizontal wells and added 127 million BOE from improved recovery to Occidental's proved reserves.
Permian EORThe Permian Basin’s concentration of large
conventional reservoirs, favorable CO2 flooding performance and the proximity to naturally occurring CO2 supply has resulted in decades of steady growth in enhanced oil production. With 34 active floods and over 40 years of experience, Occidental is the industry leader in Permian Basin CO2 flooding, which can increase ultimate oil recovery by 10 to 25 percent. Technology improvements, such as the recent trend toward vertical expansion of the CO2 flooded interval into residual oil zone targets, continue to yield more recovery from existing projects. Occidental utilizes workover rigs to drill extra depth into additional CO2 floodable sections of the reservoir, and completed 91 well workovers in 2017 and has plans to complete 100 well workovers in 2018. In 2017, Permian EOR added 21 million
BOE to Occidental’s proved reserves for improved recovery additions, primarily as a result of executing CO2 flood development projects and expansions. Occidental's share of production from Permian EOR was approximately 150,000 BOE per day in 2017.
Significant opportunities also remain to gain additional recovery by expanding Occidental's existing CO2 projects into new portions of reservoirs that have only been water-flooded. Permian EOR has a large inventory of future CO2projects which could be developed over the next 20 years or accelerated, depending on market conditions.
Other DomesticOccidental holds approximately 908,000 net acres in
other domestic locations. Occidental's share of production in other domestic locations was approximately 5,000 BOE per day.
International InterestsProduction-Sharing Contracts
Occidental's interests in Oman and Qatar are subject to production sharing contracts (PSC). Under such contracts, Occidental records a share of production and reserves to recover certain development and production costs and an additional share for profit. In addition, certain contracts in Colombia are subject to contractual arrangements similar to a PSC. These contracts do not transfer any right of ownership to Occidental and reserves reported from these arrangements are based on Occidental’s economic interest as defined in the contracts. Occidental’s share of production and reserves from these contracts decreases when product prices rise and increases when prices decline. Overall, Occidental’s net economic benefit from these contracts is greater when product prices are higher.
The following charts show Occidental’s international production volumes for the last five years:
Notes:• Operations sold or exited include Bahrain, Iraq, Libya and Yemen.
2017 2016 20142015 2013
298
298 328
26
302
340
International Ongoing
72
268
279
67
212
289
79
210
Operations Sold or Exited
International Production Volumes(thousands BOE/day)

16
Middle East Assets
1. Qatar2. United Arab Emirates3. Oman
OmanIn Oman, Occidental is the operator of Block 9 with a
50-percent working interest, Block 27 with a 65-percent working interest, Block 53 with a 45-percent working interest; and Block 62, with an 80-percent working interest. Also, in November 2017, Occidental was awarded a three-year exploration contract in Block 30.
In December 2015, the existing PSC for Block 9 expired and Occidental agreed to operate Block 9 under modified operating terms until a new contract was approved. The Block 9 Exploration and Production Sharing Agreement 15-year extension was signed in January 2017 and was ratified in March 2017 through Royal Decree. In 2017, the average gross production from Block 9 was 91,000 BOE per day.
The term for Block 27 expires in 2035 and the average gross production was 16,000 BOE per day in 2017.
A 30-year PSC for Block 53 (Mukhaizna Field) was signed with the Government of Oman in 2005, pursuant to which Occidental assumed operation of the field. By the end of 2017, Occidental had drilled more than 3,000 new wells and continued implementation of a major steamflood project. In 2017, the average gross daily production was 123,000 BOE per day.
In 2008, Occidental was awarded a 20-year contract for Block 62, subject to declaration of commerciality, where it is pursuing development and exploration opportunities targeting natural gas and condensate resources. In 2014, Occidental signed a five-year extension for the initial phase for the discovered non-associated gas area (natural gas not in contact with crude oil in a reservoir) for Block 62. In 2017, the average gross daily production was 22,000 BOE per day.
Occidental's Oman operations reached a significant milestone in November 2017 with the production of its one billionth gross barrel of oil, including condensate, from all its blocks. Over two-thirds of this production has come in the last ten years, illustrating the tremendous growth achieved over that period. In 2017, Occidental's share of production in Oman averaged 95,000 BOE per day.
QatarIn Qatar, Occidental is the operator of the offshore
fields Idd El Shargi North Dome (ISND) and Idd El Shargi South Dome (ISSD), with a 100-percent working interest in each. The terms for ISND and ISSD expire in October 2019 and December 2022, respectively. Occidental's net share of production from ISND and ISSD was 53,000 BOE and 4,000 BOE per day respectively, in 2017.
Occidental operated Al-Rayyan (Block 12) until the term expired on May 31, 2017, when Block 12 was successfully transitioned back to the Government of Qatar. Production from Block 12 in 2017 was not significant.
Occidental has continued to successfully implement large scale water flooding projects combined with state-of-the-art horizontal drilling, advanced completion techniques as well as utilizing extensive automated artificial lift systems that are significantly extending the life of the fields. Since the commencement of its operations in 1994, Occidental has boosted the production from the Idd El Shargi fields by over 400 percent with current gross oil rates of around 91,000 BOE per day.
Utilizing Occidental’s expertise in artificial lift, together with other game-changing technologies and innovations, the ISSD field continues to outperform expectations and exited 2017 with record gross production rates of over 9,000 BOE per day. Despite complex marine operations, Occidental is recognized as a regional leader in its safety performance as well as being the lowest-cost offshore oil operator in the State of Qatar.
Occidental also partners in the Dolphin Energy project, an investment that is comprised of two separate economic interests. Occidental has a 24.5-percent interest in the upstream operations to develop and produce natural gas, NGLs and condensate from Qatar’s North Field through mid-2032. Occidental also has a 24.5-percent interest in Dolphin Energy Limited which operates a pipeline and is discussed further in "Midstream and Marketing Segment – Pipeline Transportation. Occidental's net share of production from the Dolphin upstream operations was 42,000 BOE per day in 2017.
Occidental's share of production from Qatar was approximately 100,000 BOE per day in 2017.
United Arab EmiratesIn 2011, Occidental acquired a 40-percent participating
interest in Al Hosn Gas, joining with the Abu Dhabi National Oil Company (ADNOC) in a 30-year joint venture agreement. In 2017, Al Hosn Gas gross production exceeded expectations, producing over 525 MMcf per day of natural gas and 90,000 barrels per day of NGLs and condensate. Occidental’s share of production from Al Hosn Gas was 211 MMcf per day of natural gas and 36,000 barrels per day of NGLs and condensate in 2017. Al Hosn Gas includes gas processing facilities which are discussed further in "Midstream and Marketing Segment - Gas Processing Plants and CO2 Fields and Facilities".
Occidental conducts a majority of its Middle East business development activities through its office in Abu Dhabi, which also provides various support functions for Occidental’s Middle East oil and gas operations.
1
2
3

17
Latin America Assets
1. Teca Heavy Oil Area2. La Cira-Infantas Waterflood Area3. Northern Llanos Basin
ColombiaOccidental has working interests in the La Cira-
Infantas and Teca areas and has operations within the Llanos Norte Basin. Occidental's interests range from 39 to 61 percent and certain interests expire between 2023 and 2038, while others extend through the economic limit of the areas. In 2017, Occidental continued a thermal recovery pilot at the Teca heavy oil field and the initial results are better than anticipated. Production began from these pilots in 2016. Occidental's share of production from Colombia was approximately 31,000 BOE per day in 2017.
Proved ReservesProved oil, NGLs and gas reserves were estimated
using the unweighted arithmetic average of the first-day-of-the-month price for each month within the year, unless prices were defined by contractual arrangements. Oil, NGLs and natural gas prices used for this purpose were based on posted benchmark prices and adjusted for price differentials including gravity, quality and transportation costs. For the 2017, 2016 and 2015 disclosures, the calculated average West Texas Intermediate oil prices were $51.34, $42.75 and $50.28 per barrel, respectively. The calculated average Brent oil prices for 2017, 2016 and 2015 disclosures were $54.93, $44.49 and $55.57, per barrel, respectively. The calculated average Henry Hub gas prices for 2017, 2016 and 2015 were $3.08, $2.55 and $2.66 per MMBtu, respectively.
Occidental had proved reserves at year-end 2017 of 2,598 million BOE, compared to the year-end 2016 amount of 2,406 million BOE. Proved reserves at year-end 2017 and 2016 consisted of, respectively, 58 percent and 56 percent oil, 17 percent and 17 percent NGLs and 25 percent and 27 percent natural gas. Proved developed reserves represented approximately 74 percent and 77 percent, respectively, of Occidental’s total proved reserves at year-end 2017 and 2016.
Occidental does not have any reserves from non-traditional sources. For further information regarding Occidental's proved reserves, see "Supplemental Oil and Gas Information" following the "Financial Statements."
Changes in Proved ReservesOccidental's total proved reserves increased 192
million BOE in 2017, which included additions of 206 million BOE from Occidental's development program.
Changes in reserves were as follows:
(in millions of BOE) 2017Revisions of previous estimates 151Improved recovery 201Extensions and discoveries 5Purchases 99Sales (44)Production (220)Total 192
Occidental's ability to add reserves, other than through purchases, depends on the success of improved recovery, extension and discovery projects, each of which depends on reservoir characteristics, technology improvements and oil and natural gas prices, as well as capital and operating costs. Many of these factors are outside management’s control, and may negatively or positively affect Occidental's reserves.
Revisions of Previous EstimatesRevisions can include upward or downward changes
to previous proved reserve estimates for existing fields due to the evaluation or interpretation of geologic, production decline or operating performance data. In addition, product price changes affect proved reserves recorded by Occidental. For example, lower prices may decrease the economically recoverable reserves, particularly for domestic properties, because the reduced margin limits the expected life of the operations. Offsetting this effect, lower prices increase Occidental's share of proved reserves under PSCs because more oil is required to recover costs. Conversely, when prices rise, Occidental's share of proved reserves decreases for PSCs and economically recoverable reserves may increase for other operations. In 2017, Occidental had positive revisions of 151 million BOE, mainly in the Permian Basin and Oman.
Reserve estimation rules require that estimated ultimate recoveries be much more likely to increase or remain constant than to decrease, as changes are made due to increased availability of technical data.
Improved RecoveryIn 2017, Occidental added proved reserves of 201
million BOE mainly associated with the Permian Basin and UAE. These properties comprise both conventional projects, which are characterized by the deployment of EOR development methods, largely employing application of CO2 flood, waterflood or steam flood, and unconventional projects. These types of conventional EOR development methods can be applied through existing wells, though additional drilling is frequently required to fully optimize the development configuration. Waterflooding is the technique of injecting water into the formation to displace the oil to the offsetting oil production wells. The use of either CO2 or steam flooding depends on the geology of the formation, the evaluation of engineering data, availability and cost of
1
2
3
2

18
either CO2 or steam and other economic factors. Both techniques work similarly to lower viscosity causing the oil to move more easily to the producing wells. Many of Occidental's projects, including unconventional projects, rely on improving permeability to increase flow in the wells. In addition, some improved recovery comes from drilling infill wells that allow recovery of reserves that would not be recoverable from existing wells.
Extensions and DiscoveriesOccidental also added proved reserves from
extensions and discoveries, which are dependent on successful exploration and exploitation programs. In 2017, extensions and discoveries added 5 million BOE related primarily to the recognition of proved developed reserves in Oman.
Purchases of Proved ReservesOccidental continues to seek opportunities to add
reserves through acquisitions when properties are available at prices it deems reasonable. As market conditions change, the available supply of properties may increase or decrease accordingly.
In 2017, Occidental purchased 99 million BOE of proved reserves in the Permian Basin, which mainly came from acquisitions made in the third quarter of 2017.
Sales of Proved ReservesIn 2017, Occidental sold 44 million BOE in proved
reserves mainly related to the sales of South Texas and non-core Permian acreage.
Proved Undeveloped ReservesOccidental had proved undeveloped reserves at year-
end 2017 of 670 million BOE, compared to the year-end 2016 amount of 550 million BOE.
Changes in proved undeveloped reserves were as follows:
(in millions of BOE) 2017Revisions of previous estimates 51Improved recovery 127Extensions and discoveries 3Purchases 37Sales (9)Transfer to proved developed reserves (89)Total 120
The increase in proved undeveloped reserves from the Permian Basin added approximately 168 million BOE through improved recovery, positive revisions and purchases. The remaining additions mainly came from Oman and UAE.
The 2017 additions to proved undeveloped reserves were partially offset by 89 million BOE of transfers to proved developed reserves, mainly from the Permian Basin, and sales of proved undeveloped reserves related to the sales of South Texas and non-core Permian acreage.
Occidental’s highest-return projects and most active development areas are located in the Permian Basin, which
represented 73 percent of the proved undeveloped reserves as of December 31, 2017. The majority of Occidental’s 2018 capital program of $3.9 billion is allocated to the development program in the Permian Basin. Overall, Occidental plans to spend approximately $8 billion, or over 76 percent of total estimated future development costs, over the next five years to develop its proved undeveloped reserves in the Permian Basin.
Occidental’s proved undeveloped reserves in international locations are associated with approved long-term international development projects.
Reserves Evaluation and Review ProcessOccidental's estimates of proved reserves and
associated future net cash flows as of December 31, 2017, were made by Occidental’s technical personnel and are the responsibility of management. The estimation of proved reserves is based on the requirement of reasonable certainty of economic producibility and funding commitments by Occidental to develop the reserves. This process involves reservoir engineers, geoscientists, planning engineers and financial analysts. As part of the proved reserves estimation process, all reserve volumes are estimated by a forecast of production rates, operating costs and capital expenditures. Price differentials between benchmark prices (the unweighted arithmetic average of the first-day-of-the-month price for each month within the year) and realized prices and specifics of each operating agreement are then used to estimate the net reserves. Production rate forecasts are derived by a number of methods, including estimates from decline curve analysis, type curve analysis, material balance calculations that take into account the volumes of substances replacing the volumes produced, and associated reservoir pressure changes, seismic analysis and computer simulation of the reservoir performance. These field-tested technologies have demonstrated reasonably certain results with consistency and repeatability in the formation being evaluated or in an analogous formation. Operating and capital costs are forecast using the current cost environment applied to expectations of future operating and development activities.
Net proved developed reserves are those volumes that are expected to be recovered through existing wells with existing equipment and operating methods for which the incremental cost of any additional required investment is relatively minor.
Net proved undeveloped reserves are those volumes that are expected to be recovered from new wells on undrilled acreage, or from existing wells where a relatively major expenditure is required for recompletion. Proved undeveloped reserves are supported by a five-year, detailed, field-level development plan, which includes the timing, location and capital commitment of the wells to be drilled. The development plan is reviewed and approved annually by senior management and technical personnel. Annually a detailed review is performed by Occidental’s Worldwide Reserves Group and its technical personnel on a lease-by-lease basis to assess whether proved undeveloped reserves are being converted on a timely basis within five years from the initial disclosure date. Any leases not showing timely transfers from proved

19
undeveloped reserves to proved developed reserves are reviewed by senior management to determine if the remaining reserves will be developed in a timely manner and has sufficient capital committed in the development plan. Only proved undeveloped reserves that are reasonably certain to be drilled within five years of booking and are supported by a final investment decision to drill them are included in the development plan. A portion of the proved developed reserves associated with international operations are expected to be developed beyond the five years and are tied to approved long-term development plans.
The current Senior Vice President, Reserves for Oxy Oil and Gas is responsible for overseeing the preparation of reserve estimates, in compliance with U.S. Securities and Exchange Commission (SEC) rules and regulations, including the internal audit and review of Occidental's oil and gas reserves data. He has over 30 years of experience in the upstream sector of the exploration and production business, and has held various assignments in North America, Asia and Europe. He is a three-time past Chair of the Society of Petroleum Engineers Oil and Gas Reserves Committee. He is an American Association of Petroleum Geologists (AAPG) Certified Petroleum Geologist and currently serves on the AAPG Committee on Resource Evaluation. He is a member of the Society of Petroleum Evaluation Engineers, the Colorado School of Mines Potential Gas Committee and the UNECE Expert Group on Resource Classification. He has Bachelor of Science and Master of Science degrees in geology from Emory University in Atlanta.
Occidental has a Corporate Reserves Review Committee (Reserves Committee), consisting of senior corporate officers, to review and approve Occidental's oil and gas reserves. The Reserves Committee reports to the Audit Committee of Occidental's Board of Directors during the year. Since 2003, Occidental has retained Ryder Scott Company, L.P. (Ryder Scott), independent petroleum engineering consultants, to review its annual oil and gas reserve estimation processes.
In 2017, Ryder Scott conducted a process review of the methods and analytical procedures utilized by Occidental’s engineering and geological staff for estimating the proved reserves volumes, preparing the economic evaluations and determining the reserves classifications as of December 31, 2017, in accordance with the SEC regulatory standards. Ryder Scott reviewed the specific application of such methods and procedures for selected oil and gas properties considered to be a valid representation of Occidental’s 2017 year-end total proved reserves portfolio. In 2017, Ryder Scott reviewed approximately 20 percent of Occidental’s proved oil and gas reserves. Since being engaged in 2003, Ryder Scott has reviewed the specific application of Occidental’s reserve estimation methods and procedures for approximately 80 percent of Occidental’s existing proved oil and gas reserves. Management retains Ryder Scott to provide objective third-party input on its methods and procedures and to gather industry information applicable to Occidental’s reserve estimation and reporting process. Ryder Scott has not been engaged to render an opinion as to the reasonableness of reserves quantities reported by
Occidental. Occidental has filed Ryder Scott's independent report as an exhibit to this Form 10-K.
Based on its reviews, including the data, technical processes and interpretations presented by Occidental, Ryder Scott has concluded that the overall procedures and methodologies Occidental utilized in estimating the proved reserves volumes, documenting the changes in reserves from prior estimates, preparing the economic evaluations and determining the reserves classifications for the reviewed properties are appropriate for the purpose thereof and comply with current SEC regulations.
Industry OutlookThe petroleum industry is highly competitive and
subject to significant volatility due to various market conditions. WTI and Brent oil price indexes for 2017 were above the 2016 index prices closing at $60.42 per barrel and $66.87 per barrel, respectively, as of December 31, 2017. Commodity prices remained relatively constant in 2017 and started to increase in the latter part of the fourth quarter.
Oil prices will continue to be affected by: (i) global supply and demand, which are generally a function of global economic conditions, inventory levels, production disruptions, technological advances, regional market conditions and the actions of OPEC, other significant producers and governments; (ii) transportation capacity, infrastructure constraints, and costs in producing areas; (iii) currency exchange rates; and (iv) the effect of changes in these variables on market perceptions.
NGLs prices are related to the supply and demand for the components of products making up these liquids. Some of them more typically correlate to the price of oil while others are affected by natural gas prices as well as the demand for certain chemical products for which they are used as feedstock. In addition, infrastructure constraints magnify the pricing volatility from region to region.
Domestic natural gas prices and local differentials are strongly affected by local supply and demand fundamentals, as well as government regulations and availability of transportation capacity from producing areas.
These and other factors make it difficult to predict the future direction of oil, NGLs and domestic gas prices reliably. For purposes of the current capital plan, Occidental anticipates 2018 oil prices to be higher than average 2017 oil prices. International gas prices are generally fixed under long-term contracts. Occidental continues to respond to economic conditions by adjusting capital expenditures in line with current economic conditions with the goal of keeping returns well above its cost of capital.
CHEMICAL SEGMENTBusiness Environment
In 2017, U.S. economic growth surpassed that of 2016 and was supported by growing demand for domestically produced energy and feedstocks, even though natural gas and ethylene pricing was higher on average than in 2016. Hurricane Harvey impacted the ethylene market in the second half of 2017 and ethylene pricing on average ended the year slightly higher than 2016. The impact of higher energy and feedstock costs was offset in 2017, as tighter supply and increased demand in the caustic market

20
resulted in higher margins, while PVC margins slightly improved as prices kept up with raw material costs.
Business ReviewBasic Chemicals
In 2017, the U.S. economic growth rate was expected to exceed the 1.5 percent experienced in 2016. The higher U.S. growth rate bolstered domestic demand as the 2017 industry chlorine operating rate increased by 4 percent, to 88 percent, resulting in an improvement in chlorine pricing in the second half of 2017. Exports of downstream chlorine derivatives into the vinyls chain were stable in 2017 as U.S. ethylene and energy costs remained advantaged over global pricing. Liquid caustic soda prices improved both domestically and globally in 2017, as increased demand and tighter supply supported the higher pricing.
VinylsDemand for PVC improved year-over-year with
domestic demand improving 5 percent and export demand being on par with 2016. Domestic demand was driven by construction as housing starts continued their year-over-year increase and rising home values drove increased home remodeling. Export volume remains a significant portion of PVC sales, representing over 30 percent of total North American producer’s production. PVC industry operating rates decreased less than one percent compared to 2016, despite impact from Hurricane Harvey. Industry PVC margins slightly improved in 2017, as PVC pricing kept pace with higher ethylene cost.
Industry OutlookIndustry performance will depend on the health of the
global economy, specifically in the housing, construction, automotive and durable goods markets. Margins also depend on market supply-and-demand balances and feedstock and energy prices. Strengthening in the petroleum industry may positively affect the demand and pricing of a number of Occidental’s products that are consumed by industry participants. U.S. commodity export markets will continue to be impacted by the relative strength of the U.S. dollar, which is anticipated to be relatively neutral in 2018.
Basic ChemicalsContinued improvement in the United States housing,
automotive and durable goods markets should drive a moderate increase in domestic demand for basic chemical products in 2018. Export demand for caustic is also expected to remain firm in 2018. Chlor-alkali operating rates should improve moderately with higher demand and continued competitive energy and raw material pricing as compared to global feedstock costs. Businesses such as calcium chloride and muriatic acid continue to improve as oil and gas drilling activity increases in the U.S., which is expected to continue in 2018.
VinylsNorth American demand should continue to show
improvement in 2018 over 2017 levels as growth in construction spending continues with further upside potential driven by new infrastructure projects. North
American operating rates are expected to remain relatively flat with 2017 but margins should improve as demand in the United States strengthens.
MIDSTREAM AND MARKETING SEGMENTBusiness Environment
Midstream and marketing segment earnings are affected by the performance of its various businesses including its gas processing, transportation, power-generation assets, and storage facilities and terminal business. The marketing business aggregates markets, and stores Occidental's and third-party volumes. Marketing performance is affected primarily by commodity price changes and margins in oil and gas transportation and storage programs. Gas processing and transportation results are affected by the volumes that are processed and transported through the segment's plants and pipelines, as well as the margins obtained on related services.
The midstream and marketing segment earnings in 2017 were significantly higher than those in 2016 primarily due to improved Permian to Gulf Coast price differentials, higher plant income due to higher NGL prices and higher income from a full year of operating the Ingleside Crude Terminal.
Business ReviewPipeline and Gathering Systems and Transportation
Margin and cash flow from pipeline transportation operations mainly reflect volumes shipped. Dolphin Energy owns and operates a 230-mile-long, 48-inch-diameter natural gas pipeline (Dolphin Pipeline), which transports dry natural gas from Qatar to the UAE and Oman. The Dolphin Pipeline contributes significantly to Occidental's pipeline transportation results through Occidental's 24.5-percent interest in Dolphin Energy. The Dolphin Pipeline has capacity to transport up to 3.2 Bcf of natural gas per day and currently transports approximately 2.2 Bcf per day, and up to 2.5 Bcf per day in the summer.
Occidental owns an oil common carrier pipeline and storage system with approximately 2,950 miles of pipelines from southeast New Mexico across the Permian Basin in West Texas to Cushing, Oklahoma. The system has a current throughput capacity of about 720,000 barrels per day, 7.1 million barrels of active storage capability and 128 truck unloading facilities at various points along the system, which allow for additional volumes to be delivered into the pipeline. In 2017, Occidental expanded its oil pipeline system in New Mexico by an additional 50 miles.
Occidental's 2017 pipeline transportation earnings increased from 2016 due to higher throughput volumes and improved margins.
Gas Processing Plants and CO2 Fields and FacilitiesOccidental processes its and third-party domestic wet
gas to extract NGLs and other gas byproducts, including CO2, and delivers dry gas to pipelines. Margins primarily result from the difference between inlet costs of wet gas and market prices for NGLs. Occidental’s 2017 earnings from these operations increased compared to 2016 due to higher throughput volumes and higher realized NGL pricing.
Occidental has a 40-percent participating interest in Al Hosn Gas which is designed to process 1.0 Bcf per day of

21
natural gas and separate it into sales gas, condensate, NGLs and sulfur. The facilities produce approximately 10,500 tons per day of sulfur, of which approximately 4,200 tons is Occidental's share. Al Hosn Gas facilities generate revenues from gas processing fees and the sale of sulfur. The increase in 2017 earnings compared to 2016 was primarily due to higher throughput volumes and higher sulfur pricing.
Power Generation FacilitiesEarnings from power and steam generation facilities
are derived from sales to affiliates and third parties. The decrease in earnings in 2017 compared to 2016 was a result of lower production due to longer outages and lower ancillary sales.
Storage Facilities and Terminal AssetsOccidental owns the Oxy Ingleside Energy Center,
which includes the Ingleside Crude Terminal, a crude oil storage and export terminal located in the Port of Corpus Christi in Ingleside, Texas. The facility has a competitive advantage over other similarly situated export terminals, with a location near port entry, access to deep water, industry-leading loading rates and reduced lay times while berthed. The facility has over 300,000 barrels per day of throughput capacity, along with 2.1 million barrels of storage and three loading berths with 80,000 barrels per hour loading capability. The terminal is currently capable of loading articulated tug barges (ATB), medium range (MR), Aframax and Suezmax size vessels.
In 2017, Occidental became the largest exporter of Permian light sweet crude from the United States (U.S.) Gulf Coast. The export market for crude has developed since the lifting of the export ban in 2016. While U.S. producers have increased production of light crude, U.S. refineries are constrained in their ability to process incremental volumes of light crude without significant incremental capital investment, necessitating exports to international markets. In response to the increase in Permian production and the need to export these barrels, Occidental is expanding its terminal to approximately 750,000 barrels per day of capacity and 6.8 million barrels of storage which will be operational by the end of 2019. Occidental is also expanding the facility to be capable of loading VLCC size vessels by the fourth quarter of 2018.
Marketing The marketing group markets substantially all of
Occidental’s oil, NGLs and gas production, as well as trades around its assets, including its own and third-party transportation and storage capacity. Occidental’s third-party marketing activities focus on purchasing oil, NGLs and gas for resale from parties whose oil and gas supply is located near its transportation and storage assets. These purchases allow Occidental to aggregate volumes to better utilize and optimize its assets. Marketing performance in 2017 improved compared to 2016 due to favorable Permian-to-Gulf Coast crude oil price differentials and higher marketing volumes.
Industry OutlookThe pipeline transportation and power generation
businesses are expected to remain relatively stable. Marketing results can have significant volatile results depending on significant price swings, as well as Permian-to-Gulf Coast crude oil differentials. The gas processing plant operations could have volatile results depending on NGLs prices. Generally, higher NGLs prices result in higher profitability.
SEGMENT RESULTS OF OPERATIONS AND SIGNIFICANT ITEMS AFFECTING EARNINGS
Segment earnings exclude income taxes, interest income, interest expense, environmental remediation expenses, unallocated corporate expenses and discontinued operations, but include gains and losses from dispositions of segment assets and income from the segments' equity investments. Seasonality is not a primary driver of changes in Occidental's consolidated quarterly earnings during the year.
The following table sets forth the sales and earnings of each operating segment and corporate items:
(in millions, except per share amounts)For the years endedDecember 31, 2017 2016 2015NET SALES (a)
Oil and Gas $ 7,870 $ 6,377 $ 8,304Chemical 4,355 3,756 3,945Midstream and Marketing 1,157 684 891Eliminations (874) (727) (660) $ 12,508 $ 10,090 $ 12,480SEGMENT RESULTS ANDEARNINGS
Domestic $ (589) $ (1,552) $ (4,151)Foreign 1,767 965 (3,747)Exploration (67) (49) (162)
Oil and Gas 1,111 (636) (8,060)Chemical 822 571 542Midstream and Marketing 85 (381) (1,194) 2,018 (446) (8,712)Unallocated corporate
itemsInterest expense, net (324) (275) (141)Income taxes (17) 662 1,330Other (366) (943) (623)Income (loss) from
continuing operations 1,311 (1,002) (8,146)Discontinued operations, net — 428 317Net income (loss) $ 1,311 $ (574) $ (7,829)Basic Earnings per
Common Share $ 1.71 $ (0.75) $ (10.23)(a) Intersegment sales eliminate upon consolidation and are generally
made at prices approximating those that the selling entity would be able to obtain in third-party transactions.

22
Oil and Gas
(in millions)For the years ended December 31, 2017 2016 2015Segment Sales $7,870 $6,377 $8,304Segment Results (a)
Domestic $ (589) $(1,552) $(4,151)Foreign 1,767 965 (3,747)Exploration (67) (49) (162)
$1,111 $ (636) $(8,060)
Significant items affecting resultsAsset sale gains (b) $ 655 $ 107 $ 10Asset impairments and related items domestic (c) $ (397) $ (1) $(3,457)Asset impairments and related items international (d) $ (4) $ (70) $(5,050)Total Oil and Gas $ 254 $ 36 $(8,497)
(a) Results include significant items listed below.(b) The 2017 gain on sale of assets included the sale of South Texas
and non-core acreage in the Permian Basin. The 2016 gain on sale of assets included the sale of Piceance and South Texas oil and gas properties.
(c) The 2017 amount included $397 million of impairment and related charges associated with non-core proved and unproved Permian acreage. The 2015 amount included approximately $1.6 billion of impairment and related charges associated with non-core domestic oil and gas assets in the Williston Basin (sold in November 2015) and Piceance Basin (sold in March 2016). The remaining 2015 charges were mainly associated with the decline in commodity prices and management changes to future development plans.
(d) The 2016 amount included a net charge of $61 million related to the sale of Libya and exit from Iraq. The 2015 amount included impairment and related charges of approximately $1.7 billion for operations where Occidental exited or reduced its involvement in and $3.4 billion related to the decline in commodity prices.
(in millions)For the years ended December 31, 2017 2016 2015Average Realized Prices
Oil Prices ($ per bbl) United States $47.91 $39.38 $45.04Latin America $48.50 $37.48 $44.49Middle East/North Africa $50.38 $38.25 $49.65Total worldwide $48.93 $38.73 $47.10
NGLs Prices ($ per bbl)United States $23.67 $14.72 $15.35Middle East/North Africa $18.05 $15.01 $17.88Total worldwide $21.63 $14.82 $15.96
Gas Prices ($ per Mcf)United States $ 2.31 $ 1.90 $ 2.15Latin America $ 5.08 $ 3.78 $ 5.20Total worldwide $ 1.84 $ 1.53 $ 1.49
Domestic oil and gas results were losses of $0.6 billion, $1.6 billion and $4.2 billion in 2017, 2016 and 2015, respectively. Excluding significant items affecting results, domestic oil and gas results in 2017 increased from 2016, due to a 22 percent increase in realized oil prices, and lower DD&A rates.
Excluding significant items affecting results, domestic oil and gas results in 2016 were lower than 2015, due to a 13 percent decrease in realized oil prices, higher DD&A rates, and lower oil volumes due to the sale of non-core domestic operations. These decreases were partially offset by lower operating expenses.
International oil and gas earnings were $1.8 billion and $1.0 billion in 2017 and 2016, respectively and a loss of $3.7 billion in 2015. Excluding significant items affecting results, international oil and gas earnings in 2017, increased from 2016. The improved 2017 earnings reflected a 32 and 20 percent increase in realized crude oil and NGL prices in the Middle East, respectively.
Excluding significant items affecting results, the decrease in international oil and gas results in 2016, compared to 2015, reflected lower realized crude oil prices, which had decreased by 23 percent in the Middle East and 16 percent in Latin America. The decrease in prices was partially offset by lower DD&A rates.
Average production costs for 2017, excluding taxes other than on income, were $11.73 per BOE, compared to $10.76 per BOE for 2016. The increase in average production costs per BOE reflected the sales of low margin non-core gas assets, including South Texas and Piceance Basin. Permian Resources production costs per BOE for 2017 decreased by 5 percent from the prior year due to continued improved operational efficiencies.
Average production costs for 2016, excluding taxes other than on income, were $10.76 per BOE,compared to $11.57 per BOE for 2015. The decrease in average costs reflected lower maintenance, workover, and support costs as a result of improvements in operating efficiencies, especially in domestic operations.
The following table sets forth the production volumes of oil, NGLs and natural gas per day from ongoing operations for each of the three years in the period ended December 31, 2017.
Production per Day from OngoingOperations (MBOE) 2017 2016 2015United States
Permian Resources 141 124 110Permian EOR 150 145 145Other Domestic 5 4 6
Total 296 273 261Latin America 32 34 37Middle East
Al Hosn Gas 71 64 35Dolphin 42 43 41Oman 95 96 89Qatar 58 65 66
Total 266 268 231Total Production Ongoing
Operations 594 575 529Sold domestic operations 8 29 67Sold or Exited MENA operations — 26 72
Total Production (MBOE) (a) 602 630 668(a) Natural gas volumes have been converted to BOE based on energy
content of six Mcf of gas to one barrel of oil. Barrels of oil equivalence does not necessarily result in price equivalence. Please refer to "Supplemental Oil and Gas Information (unaudited)" for additional information on oil and gas production and sales.

23
Average daily production volumes were 602,000 BOE and 630,000 BOE for 2017 and 2016, respectively, and included production from assets sold or exited of 8,000 BOE and 55,000 BOE for 2017 and 2016, respectively. Excluding production for assets sold or exited, average daily production volumes were 594,000 BOE and 575,000 BOE for 2017 and 2016, respectively. The increase in production mainly reflected higher Permian Resources production which increased by 14 percent from the prior year.
Average daily production volumes were 630,000 BOE and 668,000 BOE for 2016 and 2015, respectively, and included production from assets sold or exited of 55,000 BOE and 139,000 BOE for 2016 and 2015, respectively. Excluding production for assets sold or exited, average daily production volumes were 575,000 BOE and 529,000 BOE for 2016 and 2015, respectively. The increase in production from on-going operations mainly reflected higher production from Al Hosn Gas as it was not fully operational in 2015 and higher production from Permian Resources, which increased its 2016 production by 13 percent compared to 2015. These increases were offset by lower production from South Texas and Other due to curtailed drilling.
Chemical
(in millions)For the years ended December 31, 2017 2016 2015Segment Sales $4,355 $3,756 $3,945Segment Results (a) $ 822 $ 571 $ 542
Significant items affecting resultsAsset sale gains (b) $ 5 $ 88 $ 98Asset impairments and related items — — (121)Total Chemicals $ 5 $ 88 $ (23)
(a) Results include significant items listed below.(b) The 2016 amount included the $57 million gain on sale of the
Occidental Tower in Dallas and a $31 million gain on the sale of a non-core specialty chemicals business. The 2015 amount included a $98 million gain on sale of an idled facility.
Chemical segment earnings were $822 million, $571 million and $542 million for 2017, 2016 and 2015, respectively. Excluding significant items affecting results, the year over year increase in 2017 earnings compared to 2016, was the result of higher realized pricing for caustic soda, improved vinyls margins, higher sales volumes across most product lines, and the addition of equity income from the joint venture ethylene cracker in Ingleside, Texas.
Excluding significant items affecting results, the decrease in 2016 earnings, compared to 2015, reflected lower PVC margins as PVC pricing decreased with lower ethylene pricing, which was partially offset by lower ethylene and energy costs.
Midstream and Marketing
(in millions)For the years ended December 31, 2017 2016 2015Segment Sales $1,157 $ 684 $ 891Segment Results (a) $ 85 $ (381) $(1,194)
Significant items affecting resultsAsset and equity investment gains (b) $ 94 $ — $ —Asset impairments and related items(c) (120) (160) (1,259)Total Midstream and Marketing $ (26) $ (160) $(1,259)
(a) Results include significant items listed below.(b) The 2017 amount included a $94 million non-cash fair value gain on
the Plains equity investment. (c) The 2017 amount included $120 million of impairment and related
charges related to idled midstream facilities. The 2016 amount included charges related to the termination of crude oil supply contracts. The 2015 amount included an impairment charge of $814 million related to the Century gas processing plant as a result of our partner's inability to provide volumes to the plant and meet its contractual obligations to deliver CO2.
Midstream and marketing segment results were earnings of $0.1 billion and losses of $0.4 billion and $1.2 billion in 2017, 2016 and 2015, respectively. Excluding significant items affecting results, the increase in 2017 results compared to 2016, reflected higher marketing margins due to improved spreads, higher plant income due to higher NGL prices and higher income from a full year of operating the Ingleside Crude Terminal.
Excluding the significant items noted above, the decrease in 2016 results compared to 2015 reflected lower marketing margins due to unfavorable contract pricing on long-term supply agreements as well as unfavorable Permian-to-Gulf Coast differentials, decreased throughput and lower realized NGLs pricing.
CorporateThe following table sets forth significant transactions
and events affecting Occidental’s earnings that vary widely and unpredictably in nature, timing and amount.
Benefit (Charge) (in millions) 2017 2016 2015CORPORATE
Asset sale losses $ — $ — $ (8)Asset impairments and related
items(a) — (619) (235)Severance, spin-off and other — — (118)Tax effect of pre-tax and otheradjustments 392 424 1,903Discontinued operations, net of tax(b) — 428 317
TOTAL $ 392 $ 233 $1,859(a) The 2016 amount included charges of $541 million related to a
reserve for doubtful accounts and $78 million loss on the distribution of the remaining CRC stock. The 2015 amount included a $227 million other-than-temporary loss on Occidental’s investment in California Resources.
(b) The 2016 and 2015 amounts included gains related to the Ecuador settlement. See Note 2 of the consolidated financial statements.

24
TAXESOn December 22, 2017, Tax Reform was enacted which
made significant changes to the U.S. federal income tax law, including lowering the federal corporate income tax rate from 35 percent to 21 percent, repealing the corporate AMT and mandating a deemed repatriation of accumulated earnings and profits of U.S.-owned foreign corporations. Occidental recorded the effects of the changes in the tax law for which the accounting was complete. In accordance with the guidance from the SEC, Occidental recorded a provisional estimate for the federal and state tax associated with the mandatory deemed repatriation and the resulting impact to the net federal deferred tax liability. Tax Reform resulted in a one-time non-cash gain of $583 million due to the remeasurement of net deferred tax liabilities to the new federal corporate income tax rate. Occidental recognized a noncurrent receivable of $221 million for its corporate AMT credit carryforwards. The tax impact of Occidental's deemed repatriation of accumulated earnings was fully offset by foreign tax credits. At December 31, 2017, Occidental reversed its indefinite re-investment assertion with regards to its investments in foreign subsidiaries and as a result, a deferred foreign tax liability of $99 million was recorded. The ultimate impact of Tax Reform may differ from Occidental’s estimates due to changes in interpretations and assumptions as well as additional regulatory guidance. Occidental will adjust provisional amounts as updated information is evaluated. Refer to Note 10 in the Consolidated Financial Statements for additional details.
Deferred tax liabilities, net of deferred tax assets of $1.8 billion, were $581 million at December 31, 2017. The deferred tax assets, net of allowances, are expected to be realized through future operating income and reversal of temporary differences.
Worldwide Effective Tax RateThe following table sets forth the calculation of the
worldwide effective tax rate for income from continuing operations:
(in millions) 2017 2016 2015SEGMENT RESULTS
Oil and Gas $ 1,111 $ (636) $(8,060)Chemical 822 571 542Midstream and Marketing 85 (381) (1,194)Unallocated Corporate Items (690) (1,218) (764)
Pre-tax (loss) income 1,328 (1,664) (9,476)Income tax (benefit) expense
Federal and State (903) (1,298) (2,070)Foreign 920 636 740
Total income tax (benefit) expense 17 (662) (1,330)Income (loss) from continuing operations $ 1,311 $(1,002) $(8,146)Worldwide effective tax rate 1% 40% 14%
In 2017, Occidental's worldwide effective tax rate was 1 percent, which is lower than the 2016 rate mainly due to the remeasurement of net deferred tax liabilities to the new federal corporate income tax rate. Excluding the impact of impairments, tax rate changes and other nonrecurring
items, Occidental's worldwide effective tax rate for 2017 would be 37 percent.
CONSOLIDATED RESULTS OF OPERATIONSChanges in components of Occidental's results of
continuing operations are discussed below:
Revenue and Other Income Items
(in millions) 2017 2016 2015Net sales $ 12,508 $ 10,090 $ 12,480Interest, dividends and other income $ 99 $ 106 $ 118Gain on sale of equity investments and
other assets $ 667 $ 202 $ 101
The increase in net sales in 2017, compared to 2016, was mainly due to the increase in average worldwide realized oil and NGLs prices, as well as higher realized prices for caustic soda in the Chemical business. Average worldwide realized oil prices rose approximately 26 percent from 2016 to 2017.
The decrease in net sales in 2016, compared to 2015, was mainly due to the decline in average worldwide realized oil prices in 2016 and a decline in worldwide production as Occidental exited non-core areas. Average worldwide realized oil prices fell by approximately 18 percent from 2015 to 2016.
Price and volume changes in the oil and gas segment generally represent the majority of the change in oil and gas segment sales, which is a substantially larger portion of the overall change in sales than the chemical and midstream and marketing segments.
The 2017 gain on sale included the sale of South Texas and non-core proved and unproved Permian acreage. The 2016 gain on sale included the sale of Piceance and South Texas oil and gas properties, the Occidental Tower building in Dallas, and a non-core specialty chemicals business. The 2015 gain on sale included $98 million for the sale of an idled chemical facility.
Expense Items
(in millions) 2017 2016 2015Cost of sales $ 5,594 $ 5,189 $ 5,804Selling, general and administrative and
other operating expenses $ 1,424 $ 1,330 $ 1,270Depreciation, depletion and amortization $ 4,002 $ 4,268 $ 4,544Asset impairments and related items $ 545 $ 825 $ 10,239Taxes other than on income $ 311 $ 277 $ 343Exploration expense $ 82 $ 62 $ 36Interest and debt expense, net $ 345 $ 292 $ 147
Cost of sales increased in 2017 from 2016 due primarily to increases in chemical feedstock and energy costs and higher oil and gas purchase injectants. Cost of sales decreased in 2016 from the prior year due primarily to lower oil and gas maintenance costs and lower chemical feedstock and energy costs.
Selling, general and administrative and other operating expenses increased in 2017 compared to 2016, due to the change in timing of incentive compensation awards. Selling,

25
general and administrative and other operating expenses increased in 2016 compared to 2015, due to lower compensation accruals in 2015 related to Occidental's decision not to pay bonuses.
DD&A expense decreased in 2017, compared to 2016, due to lower volumes and lower DD&A rates. DD&A expense decreased in 2016, compared to 2015, due to lower volumes from the exited non-core oil and gas operations and lower DD&A rates in the Middle East.
In 2017, Occidental incurred impairment and related items charges of $545 million, of which $397 million related to proved and unproved non-core Permian acreage and $120 million for idled midstream assets. In 2016, Occidental incurred impairment and related items charges of $825 million, of which $541 million related to a reserve for doubtful accounts and $160 million for the termination of crude oil supply contracts, $78 million related to the disposal of CRC stock and $61 million related to exits from Libya and Iraq. The allowance for doubtful accounts recorded during 2016 includes a reserve against the long-term receivable related to environmental sites indemnified by Maxus described in Note 8, Environmental Liabilities and Expenditures. Occidental recorded a reserve against this receivable due to the uncertainty of collection as a result of the Maxus bankruptcy.
Asset impairments and related items in 2015 of $10.2 billion included charges of $3.5 billion related to domestic oil and gas assets due to Occidental’s exit from the Williston and Piceance basins, as well as the decline in the futures price curve and management’s decision not to pursue activities associated with certain non-producing acreage. International oil and gas charges of $5.0 billion were due to a combination of Occidental’s strategic plan to exit or reduce its exposure in certain Middle East and North Africa operations as well as the decline in the futures price curve, which have made certain projects in the region unprofitable. Midstream charges of $1.3 billion included the impairment of Occidental’s Century gas processing plant as a result of our partner’s inability to provide volumes to the plant and meet their contractual obligations to deliver CO2. Occidental recorded an other-than-temporary loss of $227 million for its available for sale investment in California Resources.
Taxes other than on income in 2017 increased from 2016 due primarily to higher oil, NGL and natural gas prices, which resulted in higher production taxes. Taxes other than on income decreased in 2016 from 2015 due primarily to lower production taxes, which are directly tied to lower commodity prices.
Other Items
Income/(expense) (in millions) 2017 2016 2015(Provision for) benefit from income taxes $ (17) $ 662 $ 1,330Income from equity investments $ 357 $ 181 $ 208Discontinued operations, net $ — $ 428 $ 317
In 2017, Occidental recorded an income tax expense as opposed to an income tax benefit recorded in 2016, due to higher pre-tax operating income as a result of a recovery in commodity prices, partially offset by the deferred tax benefit from Tax Reform. The benefit from income taxes
decreased in 2016 from the prior year as a result of a lower net loss in 2016, compared to 2015, which reflected significant impairments and related item charges.
The increase in income from equity investments in 2017 from 2016 is the result of the OxyChem Ingleside facility beginning operations in the first quarter of 2017 and a non-cash fair value gain on the Plains equity investment. The decline in income from equity investments in 2016 from 2015 is the result of lower Dolphin gas sales.
There were no charges for discontinued operations in 2017. Discontinued operations, net in 2016 and 2015 of $428 and $317 million, respectively, primarily include settlement payments by the Republic of Ecuador. See Note 2 of the Consolidated Financial Statements.
CONSOLIDATED ANALYSIS OF FINANCIAL POSITIONThe changes in select components of Occidental’s
balance sheet are discussed below:
(in millions) 2017 2016CURRENT ASSETS
Cash and cash equivalents $ 1,672 $ 2,233Trade receivables, net 4,145 3,989Inventories 1,246 866Assets held for sale 474 —Other current assets 733 1,340Total current assets $ 8,270 $ 8,428
Investments in unconsolidated entities $ 1,515 $ 1,401Property, plant and equipment, net $ 31,174 $ 32,337Long-term receivables and other assets, net $ 1,067 $ 943
CURRENT LIABILITIESCurrent maturities of long-term debt $ 500 $ —Accounts payable 4,408 3,926Accrued liabilities 2,492 2,436Total current liabilities $ 7,400 $ 6,362
Long-term debt, net $ 9,328 $ 9,819DEFERRED CREDITS AND OTHERLIABILITIES
Deferred domestic and foreign income taxes $ 581 $ 1,132Asset retirement obligations $ 1,241 $ 1,245Pension and postretirement obligations $ 1,005 $ 963Environmental remediation reserves $ 728 $ 739Other $ 1,171 $ 1,352Total deferred credits and other liabilities $ 4,726 $ 5,431
STOCKHOLDERS' EQUITY $ 20,572 $ 21,497
Assets See "Liquidity and Capital Resources — Cash Flow
Analysis" for discussion of the change in cash and cash equivalents and restricted cash.
The increase in trade receivables, net, was the result of improved oil and gas prices at the end of 2017, compared to the end of 2016. Average December WTI and Brent prices increased approximately 11 percent and 17 percent, per barrel, respectively from 2016 to 2017. The increase in inventories in 2017 was the result of more exported domestic crude oil in transit in the midstream and marketing segment. Assets held for sale at the end of 2017 mainly reflected non-core proved and unproved Permian acreage. Other current assets decreased as a result of the receipt of a federal tax refund related to the 2016 net operating loss
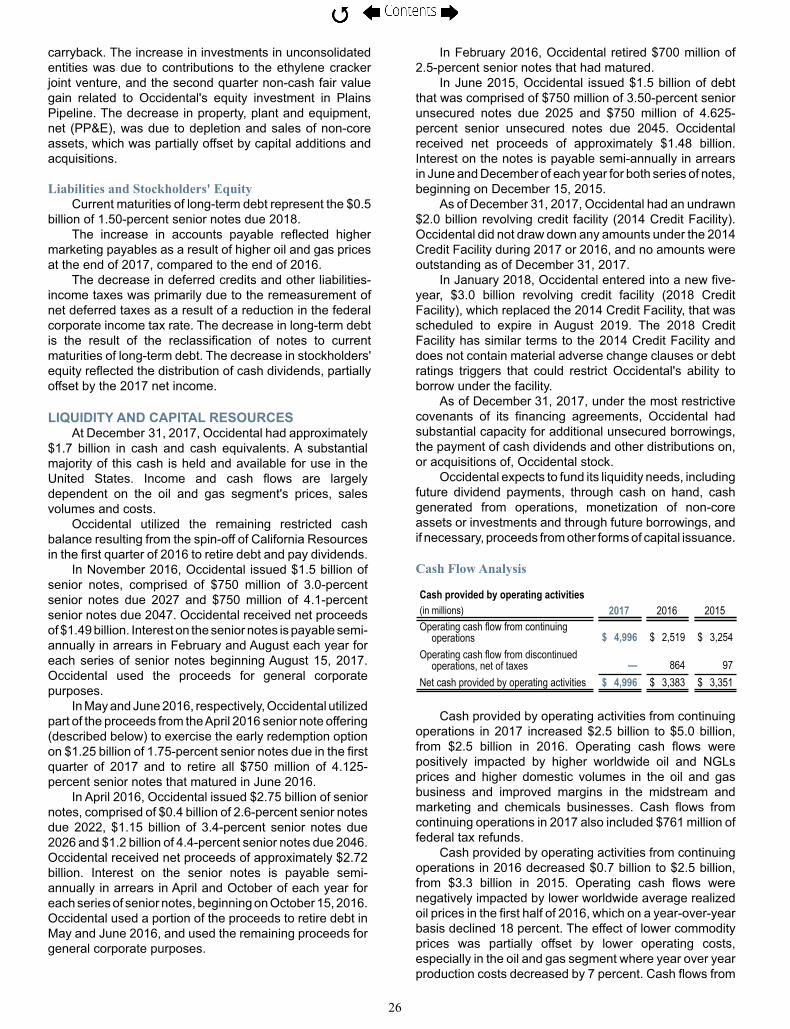
26
carryback. The increase in investments in unconsolidated entities was due to contributions to the ethylene cracker joint venture, and the second quarter non-cash fair value gain related to Occidental's equity investment in Plains Pipeline. The decrease in property, plant and equipment, net (PP&E), was due to depletion and sales of non-core assets, which was partially offset by capital additions and acquisitions.
Liabilities and Stockholders' EquityCurrent maturities of long-term debt represent the $0.5
billion of 1.50-percent senior notes due 2018.The increase in accounts payable reflected higher
marketing payables as a result of higher oil and gas prices at the end of 2017, compared to the end of 2016.
The decrease in deferred credits and other liabilities-income taxes was primarily due to the remeasurement of net deferred taxes as a result of a reduction in the federal corporate income tax rate. The decrease in long-term debt is the result of the reclassification of notes to current maturities of long-term debt. The decrease in stockholders' equity reflected the distribution of cash dividends, partially offset by the 2017 net income.
LIQUIDITY AND CAPITAL RESOURCESAt December 31, 2017, Occidental had approximately
$1.7 billion in cash and cash equivalents. A substantial majority of this cash is held and available for use in the United States. Income and cash flows are largely dependent on the oil and gas segment's prices, sales volumes and costs.
Occidental utilized the remaining restricted cash balance resulting from the spin-off of California Resources in the first quarter of 2016 to retire debt and pay dividends.
In November 2016, Occidental issued $1.5 billion of senior notes, comprised of $750 million of 3.0-percent senior notes due 2027 and $750 million of 4.1-percent senior notes due 2047. Occidental received net proceeds of $1.49 billion. Interest on the senior notes is payable semi-annually in arrears in February and August each year for each series of senior notes beginning August 15, 2017. Occidental used the proceeds for general corporate purposes.
In May and June 2016, respectively, Occidental utilized part of the proceeds from the April 2016 senior note offering (described below) to exercise the early redemption option on $1.25 billion of 1.75-percent senior notes due in the first quarter of 2017 and to retire all $750 million of 4.125-percent senior notes that matured in June 2016.
In April 2016, Occidental issued $2.75 billion of senior notes, comprised of $0.4 billion of 2.6-percent senior notes due 2022, $1.15 billion of 3.4-percent senior notes due 2026 and $1.2 billion of 4.4-percent senior notes due 2046. Occidental received net proceeds of approximately $2.72 billion. Interest on the senior notes is payable semi-annually in arrears in April and October of each year for each series of senior notes, beginning on October 15, 2016. Occidental used a portion of the proceeds to retire debt in May and June 2016, and used the remaining proceeds for general corporate purposes.
In February 2016, Occidental retired $700 million of 2.5-percent senior notes that had matured.
In June 2015, Occidental issued $1.5 billion of debt that was comprised of $750 million of 3.50-percent senior unsecured notes due 2025 and $750 million of 4.625-percent senior unsecured notes due 2045. Occidental received net proceeds of approximately $1.48 billion. Interest on the notes is payable semi-annually in arrears in June and December of each year for both series of notes, beginning on December 15, 2015.
As of December 31, 2017, Occidental had an undrawn $2.0 billion revolving credit facility (2014 Credit Facility). Occidental did not draw down any amounts under the 2014 Credit Facility during 2017 or 2016, and no amounts were outstanding as of December 31, 2017.
In January 2018, Occidental entered into a new five-year, $3.0 billion revolving credit facility (2018 Credit Facility), which replaced the 2014 Credit Facility, that was scheduled to expire in August 2019. The 2018 Credit Facility has similar terms to the 2014 Credit Facility and does not contain material adverse change clauses or debt ratings triggers that could restrict Occidental's ability to borrow under the facility.
As of December 31, 2017, under the most restrictive covenants of its financing agreements, Occidental had substantial capacity for additional unsecured borrowings, the payment of cash dividends and other distributions on, or acquisitions of, Occidental stock.
Occidental expects to fund its liquidity needs, including future dividend payments, through cash on hand, cash generated from operations, monetization of non-core assets or investments and through future borrowings, and if necessary, proceeds from other forms of capital issuance.
Cash Flow Analysis
Cash provided by operating activities(in millions) 2017 2016 2015Operating cash flow from continuing
operations $ 4,996 $ 2,519 $ 3,254Operating cash flow from discontinued
operations, net of taxes — 864 97Net cash provided by operating activities $ 4,996 $ 3,383 $ 3,351
Cash provided by operating activities from continuing operations in 2017 increased $2.5 billion to $5.0 billion, from $2.5 billion in 2016. Operating cash flows were positively impacted by higher worldwide oil and NGLs prices and higher domestic volumes in the oil and gas business and improved margins in the midstream and marketing and chemicals businesses. Cash flows from continuing operations in 2017 also included $761 million of federal tax refunds.
Cash provided by operating activities from continuing operations in 2016 decreased $0.7 billion to $2.5 billion, from $3.3 billion in 2015. Operating cash flows were negatively impacted by lower worldwide average realized oil prices in the first half of 2016, which on a year-over-year basis declined 18 percent. The effect of lower commodity prices was partially offset by lower operating costs, especially in the oil and gas segment where year over year production costs decreased by 7 percent. Cash flows from
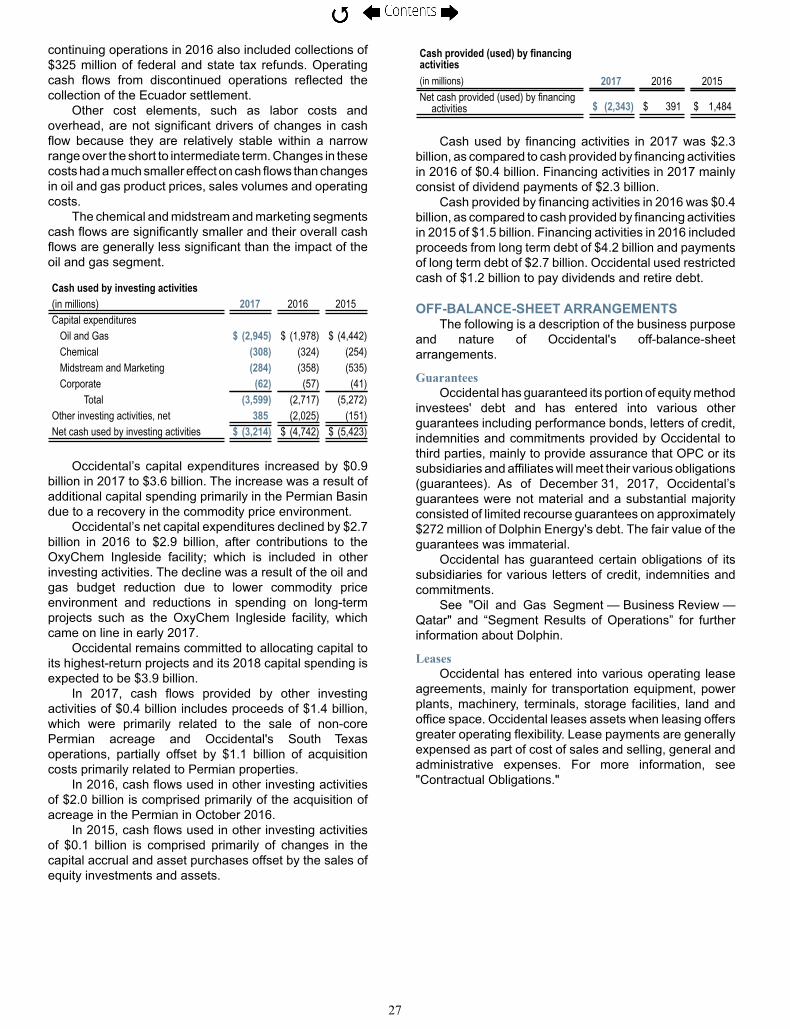
27
continuing operations in 2016 also included collections of $325 million of federal and state tax refunds. Operating cash flows from discontinued operations reflected the collection of the Ecuador settlement.
Other cost elements, such as labor costs and overhead, are not significant drivers of changes in cash flow because they are relatively stable within a narrow range over the short to intermediate term. Changes in these costs had a much smaller effect on cash flows than changes in oil and gas product prices, sales volumes and operating costs.
The chemical and midstream and marketing segments cash flows are significantly smaller and their overall cash flows are generally less significant than the impact of the oil and gas segment.
Cash used by investing activities(in millions) 2017 2016 2015Capital expenditures
Oil and Gas $ (2,945) $ (1,978) $ (4,442)Chemical (308) (324) (254)Midstream and Marketing (284) (358) (535)Corporate (62) (57) (41)
Total (3,599) (2,717) (5,272)Other investing activities, net 385 (2,025) (151)Net cash used by investing activities $ (3,214) $ (4,742) $ (5,423)
Occidental’s capital expenditures increased by $0.9 billion in 2017 to $3.6 billion. The increase was a result of additional capital spending primarily in the Permian Basin due to a recovery in the commodity price environment.
Occidental’s net capital expenditures declined by $2.7 billion in 2016 to $2.9 billion, after contributions to the OxyChem Ingleside facility; which is included in other investing activities. The decline was a result of the oil and gas budget reduction due to lower commodity price environment and reductions in spending on long-term projects such as the OxyChem Ingleside facility, which came on line in early 2017.
Occidental remains committed to allocating capital to its highest-return projects and its 2018 capital spending is expected to be $3.9 billion.
In 2017, cash flows provided by other investing activities of $0.4 billion includes proceeds of $1.4 billion, which were primarily related to the sale of non-core Permian acreage and Occidental's South Texas operations, partially offset by $1.1 billion of acquisition costs primarily related to Permian properties.
In 2016, cash flows used in other investing activities of $2.0 billion is comprised primarily of the acquisition of acreage in the Permian in October 2016.
In 2015, cash flows used in other investing activities of $0.1 billion is comprised primarily of changes in the capital accrual and asset purchases offset by the sales of equity investments and assets.
Cash provided (used) by financingactivities(in millions) 2017 2016 2015Net cash provided (used) by financing
activities $ (2,343) $ 391 $ 1,484
Cash used by financing activities in 2017 was $2.3
billion, as compared to cash provided by financing activities in 2016 of $0.4 billion. Financing activities in 2017 mainly consist of dividend payments of $2.3 billion.
Cash provided by financing activities in 2016 was $0.4 billion, as compared to cash provided by financing activities in 2015 of $1.5 billion. Financing activities in 2016 included proceeds from long term debt of $4.2 billion and payments of long term debt of $2.7 billion. Occidental used restricted cash of $1.2 billion to pay dividends and retire debt.
OFF-BALANCE-SHEET ARRANGEMENTSThe following is a description of the business purpose
and nature of Occidental's off-balance-sheet arrangements.
GuaranteesOccidental has guaranteed its portion of equity method
investees' debt and has entered into various other guarantees including performance bonds, letters of credit, indemnities and commitments provided by Occidental to third parties, mainly to provide assurance that OPC or its subsidiaries and affiliates will meet their various obligations (guarantees). As of December 31, 2017, Occidental’s guarantees were not material and a substantial majority consisted of limited recourse guarantees on approximately $272 million of Dolphin Energy's debt. The fair value of the guarantees was immaterial.
Occidental has guaranteed certain obligations of its subsidiaries for various letters of credit, indemnities and commitments.
See "Oil and Gas Segment — Business Review — Qatar" and “Segment Results of Operations” for further information about Dolphin.
LeasesOccidental has entered into various operating lease
agreements, mainly for transportation equipment, power plants, machinery, terminals, storage facilities, land and office space. Occidental leases assets when leasing offers greater operating flexibility. Lease payments are generally expensed as part of cost of sales and selling, general and administrative expenses. For more information, see "Contractual Obligations."

28
CONTRACTUAL OBLIGATIONSThe table below summarizes and cross-references
Occidental’s contractual obligations. This summary indicates on- and off-balance-sheet obligations as of December 31, 2017.
Contractual Obligations(in millions)
Payments Due by Year
Total 2018
2019and
2020
2021and
2022
2023and
thereafterOn-Balance
Sheet Long-term debt
(Note 5) (a) $ 9,907 $ 500 $ 116 $2,462 $ 6,829Other long-term
liabilities (b) 2,092 217 472 317 1,086Off-Balance
SheetOperating leases
(Note 6) 1,068 275 234 172 387Purchase
obligations (c) 8,095 1,582 2,031 1,288 3,194Total $21,162 $2,574 $2,853 $4,239 $ 11,496
(a) Excludes unamortized debt discount and interest on the debt. As of December 31, 2017, interest on long-term debt totaling $4.8 billion is payable in the following years (in millions): 2018 - $356, 2019 and 2020 - $695, 2021 and 2022 - $561, 2023 and thereafter - $3,141.
(b) Includes obligations under postretirement benefit and deferred compensation plans, accrued transportation commitments and other accrued liabilities.
(c) Amounts include payments which will become due under long-term agreements to purchase goods and services used in the normal course of business to secure terminal, pipeline and processing capacity, drilling rigs and services, CO2, electrical power, steam and certain chemical raw materials. Amounts exclude certain product purchase obligations related to marketing activities for which there are no minimum purchase requirements or the amounts are not fixed or determinable. Long-term purchase contracts are discounted at a 3.7 percent discount rate.
Delivery CommitmentsOccidental has commitments to certain refineries and
other buyers to deliver oil, natural gas and NGLs. The domestic volumes contracted to be delivered, which are not presented in Note 7 of the consolidated financial statements, are approximately 279 million barrels of oil through 2025, 2 Bcf of gas through 2019 and 25 million barrels of NGLs through 2019. The price for these deliveries is set at the time of delivery of the product. Occidental has significantly more production capacity than the amounts committed and has the ability to secure additional volumes in case of a shortfall.
LAWSUITS, CLAIMS AND CONTINGENCIES Occidental or certain of its subsidiaries are involved, in
the normal course of business, in lawsuits, claims and other legal proceedings that seek, among other things, compensation for alleged personal injury, breach of contract, property damage or other losses, punitive damages, civil penalties, or injunctive or declaratory relief. Occidental or certain of its subsidiaries also are involved in proceedings under CERCLA and similar federal, state, local and foreign environmental laws. These environmental proceedings seek funding or performance of remediation and, in some cases, compensation for alleged property damage, punitive damages, civil penalties and injunctive relief. Usually Occidental or such subsidiaries are among
many companies in these environmental proceedings and have to date been successful in sharing response costs with other financially sound companies. Further, some lawsuits, claims and legal proceedings involve acquired or disposed assets with respect to which a third party or Occidental retains liability or indemnifies the other party for conditions that existed prior to the transaction.
In accordance with applicable accounting guidance, Occidental accrues reserves for outstanding lawsuits, claims and proceedings when it is probable that a liability has been incurred and the liability can be reasonably estimated. In Note 8, Occidental has disclosed its reserve balances for environmental remediation matters that satisfy this criteria. Reserve balances for matters, other than environmental remediation matters that satisfy this criteria as of December 31, 2017, and December 31, 2016, were not material to Occidental's consolidated balance sheet.
In 2017, Andes Petroleum Ecuador Ltd. filed a demand for arbitration, claiming it is entitled to a 40 percent share of the settlement payments made by the Republic of Ecuador to Occidental for the 2006 expropriation of Occidental’s Participation Contract for Ecuador’s Block 15. Occidental intends to vigorously defend against this claim in arbitration.
The ultimate outcome and impact of outstanding lawsuits, claims and proceedings on Occidental cannot be predicted. Management believes that the resolution of these matters will not, individually or in the aggregate, have a material adverse effect on Occidental's consolidated balance sheet, statements of operations or cash flows after consideration of recorded accruals. Occidental’s estimates are based on information known about the legal matters and its experience in contesting, litigating and settling similar matters. Occidental reassesses the probability and estimability of contingent losses as new information becomes available.
Tax MattersDuring the course of its operations, Occidental is
subject to audit by tax authorities for varying periods in various federal, state, local and foreign tax jurisdictions. Although taxable years through 2009 for U.S. federal income tax purposes have been audited by the United States Internal Revenue Service (IRS) pursuant to its Compliance Assurance Program, subsequent taxable years are currently under review. Taxable years from 2002 through the current year remain subject to examination by foreign and state government tax authorities in certain jurisdictions. In certain of these jurisdictions, tax authorities are in various stages of auditing Occidental’s income taxes. During the course of tax audits, disputes have arisen and other disputes may arise as to facts and matters of law. Occidental believes that the resolution of outstanding tax matters would not have a material adverse effect on its consolidated financial position or results of operations.
Indemnities to Third Parties Occidental, its subsidiaries, or both, have indemnified
various parties against specified liabilities those parties might incur in the future in connection with purchases and other transactions that they have entered into with Occidental. These indemnities usually are contingent upon
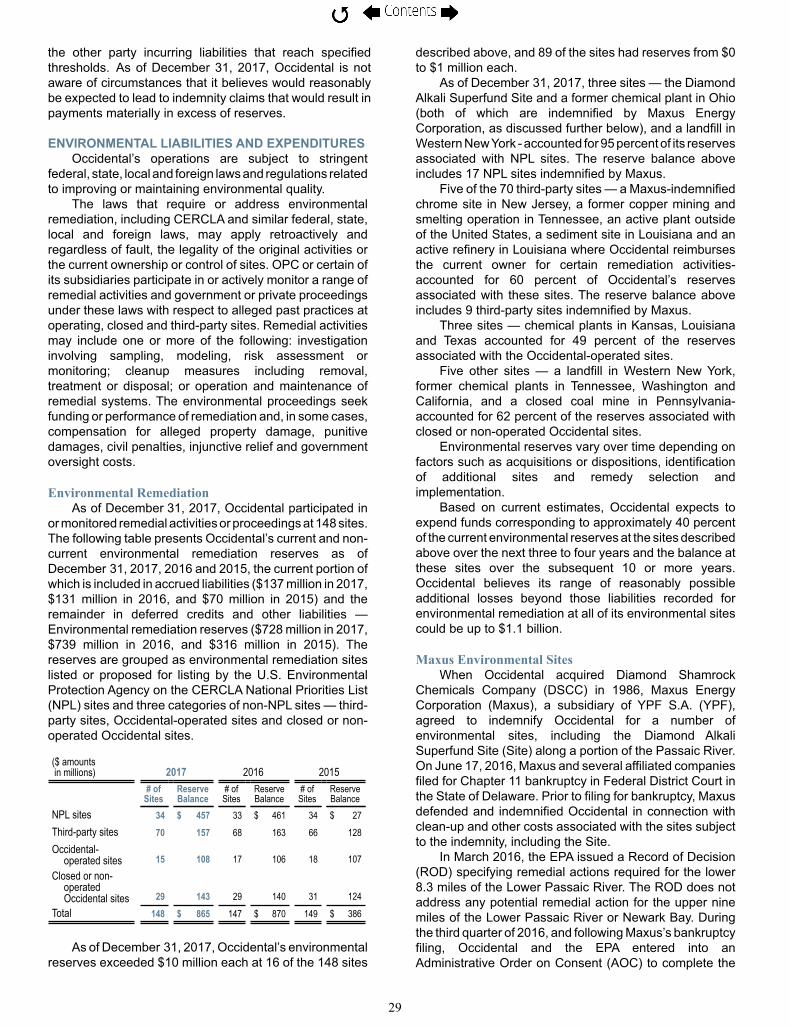
29
the other party incurring liabilities that reach specified thresholds. As of December 31, 2017, Occidental is not aware of circumstances that it believes would reasonably be expected to lead to indemnity claims that would result in payments materially in excess of reserves.
ENVIRONMENTAL LIABILITIES AND EXPENDITURESOccidental’s operations are subject to stringent
federal, state, local and foreign laws and regulations related to improving or maintaining environmental quality.
The laws that require or address environmental remediation, including CERCLA and similar federal, state, local and foreign laws, may apply retroactively and regardless of fault, the legality of the original activities or the current ownership or control of sites. OPC or certain of its subsidiaries participate in or actively monitor a range of remedial activities and government or private proceedings under these laws with respect to alleged past practices at operating, closed and third-party sites. Remedial activities may include one or more of the following: investigation involving sampling, modeling, risk assessment or monitoring; cleanup measures including removal, treatment or disposal; or operation and maintenance of remedial systems. The environmental proceedings seek funding or performance of remediation and, in some cases, compensation for alleged property damage, punitive damages, civil penalties, injunctive relief and government oversight costs.
Environmental RemediationAs of December 31, 2017, Occidental participated in
or monitored remedial activities or proceedings at 148 sites. The following table presents Occidental’s current and non-current environmental remediation reserves as of December 31, 2017, 2016 and 2015, the current portion of which is included in accrued liabilities ($137 million in 2017, $131 million in 2016, and $70 million in 2015) and the remainder in deferred credits and other liabilities — Environmental remediation reserves ($728 million in 2017, $739 million in 2016, and $316 million in 2015). The reserves are grouped as environmental remediation sites listed or proposed for listing by the U.S. Environmental Protection Agency on the CERCLA National Priorities List (NPL) sites and three categories of non-NPL sites — third-party sites, Occidental-operated sites and closed or non-operated Occidental sites.
($ amounts in millions) 2017 2016 2015
# of
SitesReserveBalance
# ofSites
ReserveBalance
# ofSites
ReserveBalance
NPL sites 34 $ 457 33 $ 461 34 $ 27Third-party sites 70 157 68 163 66 128Occidental-
operated sites 15 108 17 106 18 107Closed or non-
operatedOccidental sites 29 143 29 140 31 124
Total 148 $ 865 147 $ 870 149 $ 386
As of December 31, 2017, Occidental’s environmental reserves exceeded $10 million each at 16 of the 148 sites
described above, and 89 of the sites had reserves from $0 to $1 million each.
As of December 31, 2017, three sites — the Diamond Alkali Superfund Site and a former chemical plant in Ohio (both of which are indemnified by Maxus Energy Corporation, as discussed further below), and a landfill in Western New York - accounted for 95 percent of its reserves associated with NPL sites. The reserve balance above includes 17 NPL sites indemnified by Maxus.
Five of the 70 third-party sites — a Maxus-indemnified chrome site in New Jersey, a former copper mining and smelting operation in Tennessee, an active plant outside of the United States, a sediment site in Louisiana and an active refinery in Louisiana where Occidental reimburses the current owner for certain remediation activities- accounted for 60 percent of Occidental’s reserves associated with these sites. The reserve balance above includes 9 third-party sites indemnified by Maxus.
Three sites — chemical plants in Kansas, Louisiana and Texas accounted for 49 percent of the reserves associated with the Occidental-operated sites.
Five other sites — a landfill in Western New York, former chemical plants in Tennessee, Washington and California, and a closed coal mine in Pennsylvania- accounted for 62 percent of the reserves associated with closed or non-operated Occidental sites.
Environmental reserves vary over time depending on factors such as acquisitions or dispositions, identification of additional sites and remedy selection and implementation.
Based on current estimates, Occidental expects to expend funds corresponding to approximately 40 percent of the current environmental reserves at the sites described above over the next three to four years and the balance at these sites over the subsequent 10 or more years. Occidental believes its range of reasonably possible additional losses beyond those liabilities recorded for environmental remediation at all of its environmental sites could be up to $1.1 billion.
Maxus Environmental SitesWhen Occidental acquired Diamond Shamrock
Chemicals Company (DSCC) in 1986, Maxus Energy Corporation (Maxus), a subsidiary of YPF S.A. (YPF), agreed to indemnify Occidental for a number of environmental sites, including the Diamond Alkali Superfund Site (Site) along a portion of the Passaic River. On June 17, 2016, Maxus and several affiliated companies filed for Chapter 11 bankruptcy in Federal District Court in the State of Delaware. Prior to filing for bankruptcy, Maxus defended and indemnified Occidental in connection with clean-up and other costs associated with the sites subject to the indemnity, including the Site.
In March 2016, the EPA issued a Record of Decision (ROD) specifying remedial actions required for the lower 8.3 miles of the Lower Passaic River. The ROD does not address any potential remedial action for the upper nine miles of the Lower Passaic River or Newark Bay. During the third quarter of 2016, and following Maxus’s bankruptcy filing, Occidental and the EPA entered into an Administrative Order on Consent (AOC) to complete the

30
design of the proposed clean-up plan outlined in the ROD at an estimated cost of $165 million. The EPA announced that it will pursue similar agreements with other potentially responsible parties.
Occidental has accrued a reserve relating to its estimated allocable share of the costs to perform the design and the remediation called for in the AOC and the ROD, as well as for certain other Maxus-indemnified sites. Occidental's accrued estimated environmental reserve does not consider any recoveries for indemnified costs. Occidental’s ultimate share of this liability may be higher or lower than the reserved amount, and is subject to final design plans and the resolution of Occidental's allocable share with other potentially responsible parties. Occidental continues to evaluate the costs to be incurred to comply with the AOC, the ROD and to perform remediation at other Maxus-indemnified sites in light of the Maxus bankruptcy and the share of ultimate liability of other potentially responsible parties.
In June 2017, the court overseeing the Maxus bankruptcy approved a Plan of Liquidation (Plan) to liquidate Maxus and create a trust to pursue claims against YPF, Repsol and others to satisfy claims by Occidental and other creditors for past and future cleanup and other costs. In July 2017, the court-approved Plan became final and the trust became effective. Among other responsibilities, the trust will pursue claims against YPF, Repsol and others and distribute assets to Maxus' creditors in accordance with the trust agreement and Plan.
Environmental CostsOccidental’s environmental costs, some of which
include estimates, are presented below for each segment for each of the years ended December 31:
(in millions) 2017 2016 2015Operating Expenses
Oil and Gas $ 68 $ 65 $ 93Chemical 78 75 74Midstream and Marketing 15 11 13
$ 161 $ 151 $ 180Capital Expenditures
Oil and Gas $ 77 $ 43 $ 122Chemical 18 25 41Midstream and Marketing 6 5 4
$ 101 $ 73 $ 167Remediation Expenses
Corporate $ 39 $ 61 $ 117
Operating expenses are incurred on a continual basis. Capital expenditures relate to longer-lived improvements in properties currently operated by Occidental. Remediation expenses relate to existing conditions from past operations.
Occidental presently estimates capital expenditures for environmental compliance of approximately $137 million for 2018.
FOREIGN INVESTMENTSMany of Occidental’s assets are located outside North
America. At December 31, 2017, the carrying value of Occidental’s assets in countries outside North America
aggregated approximately $9.8 billion, or 23 percent of Occidental’s total assets at that date. Of such assets, approximately $8.2 billion are located in the Middle East and approximately $1.1 billion are located in Latin America. For the year ended December 31, 2017, net sales outside North America totaled $4.4 billion, or approximately 35 percent of total net sales.
CRITICAL ACCOUNTING POLICIES AND ESTIMATESThe process of preparing financial statements in
accordance with generally accepted accounting principles requires Occidental's management to make informed estimates and judgments regarding certain items and transactions. Changes in facts and circumstances or discovery of new information may result in revised estimates and judgments, and actual results may differ from these estimates upon settlement but generally not by material amounts. There has been no material change to Occidental's critical accounting policies over the past three years. The selection and development of these policies and estimates have been discussed with the Audit Committee of the Board of Directors. Occidental considers the following to be its most critical accounting policies and estimates that involve management's judgment.
Oil and Gas PropertiesThe carrying value of Occidental’s PP&E represents
the cost incurred to acquire or develop the asset, including any asset retirement obligations and capitalized interest, net of accumulated depreciation, depletion, and amortization (DD&A) and any impairment charges. For assets acquired, PP&E cost is based on fair values at the acquisition date. Asset retirement obligations and interest costs incurred in connection with qualifying capital expenditures are capitalized and amortized over the lives of the related assets.
Occidental uses the successful efforts method to account for its oil and gas properties. Under this method, Occidental capitalizes costs of acquiring properties, costs of drilling successful exploration wells, and development costs. The costs of exploratory wells are initially capitalized pending a determination of whether proved reserves have been found. If proved reserves have been found, the costs of exploratory wells remain capitalized. Otherwise, Occidental charges the costs of the related wells to expense. In some cases, a determination of proved reserves cannot be made at the completion of drilling, requiring additional testing and evaluation of the wells. Occidental generally expenses the costs of such exploratory wells if a determination of proved reserves has not been made within a 12-month period after drilling is complete.
Occidental expenses annual lease rentals, the costs of injectants used in production, and geological, geophysical and seismic costs as incurred.
Occidental determines depreciation and depletion of oil and gas producing properties by the unit-of-production method. It amortizes acquisition costs over total proved reserves and capitalized development and successful exploration costs over proved developed reserves.
Proved oil and gas reserves are those quantities of oil and gas which, by analysis of geoscience and engineering

31
data, can be estimated with reasonable certainty to be economically producible—from a given date forward, from known reservoirs, and under existing economic conditions, operating methods, and government regulations—prior to the time at which contracts providing the right to operate expire, unless evidence indicates that renewal is reasonably certain, regardless of whether deterministic or probabilistic methods are used for the estimation. Occidental has no proved oil and gas reserves for which the determination of economic producibility is subject to the completion of major additional capital expenditures.
Several factors could change Occidental’s proved oil and gas reserves. For example, Occidental receives a share of production from PSCs to recover its costs and generally an additional share for profit. Occidental’s share of production and reserves from these contracts decreases when product prices rise and increases when prices decline. Overall, Occidental’s net economic benefit from these contracts is greater at higher product prices. In other cases, particularly with long-lived properties, lower product prices may lead to a situation where production of a portion of proved reserves becomes uneconomical. For such properties, higher product prices typically result in additional reserves becoming economical. Estimation of future production and development costs is also subject to change partially due to factors beyond Occidental's control, such as energy costs and inflation or deflation of oil field service costs. These factors, in turn, could lead to changes in the quantity of proved reserves. Additional factors that could result in a change of proved reserves include production decline rates and operating performance differing from those estimated when the proved reserves were initially recorded.
Additionally, Occidental performs impairment tests with respect to its proved properties whenever events or circumstances indicate that the carrying value of property may not be recoverable. If there is an indication the carrying amount of the asset may not be recovered due to declines in current and forward prices, significant changes in reserve estimates, changes in management's plans, or other significant events, management will evaluate the property for impairment. Under the successful efforts method, if the sum of the undiscounted cash flows is less than the carrying value of the proved property, the carrying value is reduced to estimated fair value and reported as an impairment charge in the period. Individual proved properties are grouped for impairment purposes at the lowest level for which there are identifiable cash flows. The fair value of impaired assets is typically determined based on the present value of expected future cash flows using discount rates believed to be consistent with those used by market participants. The impairment test incorporates a number of assumptions involving expectations of future cash flows which can change significantly over time. These assumptions include estimates of future product prices, contractual prices, estimates of risk-adjusted oil and gas reserves and estimates of future operating and development costs. It is reasonably possible that prolonged declines in commodity prices, reduced capital spending in response to lower prices or increases in operating costs could result in additional impairments.
For impairment testing, unless prices were contractually fixed, Occidental used observable forward strip prices for oil and natural gas prices when projecting future cash flows. Prices are held constant for periods beyond those covered by forward strip prices. Future operating and development costs were estimated using the current cost environment applied to expectations of future operating and development activities to develop and produce oil and gas reserves. Market prices for crude oil, natural gas and NGLs have been volatile and may continue to be volatile in the future. Current market fundamentals indicate improved prices for crude oil, natural gas and NGLs in 2018; however, changes in global supply and demand, transportation capacity, currency exchange rates, and applicable laws and regulations, and the effect of changes in these variables on market perceptions could impact current forecasts. Future fluctuations in commodity prices could result in estimates of future cash flows to vary significantly.
The most significant ongoing financial statement effect from a change in Occidental's oil and gas reserves or impairment of its proved properties would be to the DD&A rate. For example, a 5 percent increase or decrease in the amount of oil and gas reserves would change the DD&A rate by approximately $0.55 per barrel, which would increase or decrease pre-tax income by approximately $120 million annually at current production rates.
A portion of the carrying value of Occidental’s oil and gas properties is attributable to unproved properties. Net capitalized costs attributable to unproved properties were $1.0 billion and $1.4 billion at December 31, 2017 and 2016, respectively. The unproved amounts are not subject to DD&A until they are classified as proved properties. Capitalized costs attributable to the properties become subject to DD&A when proved reserves are assigned to the property. If the exploration efforts are unsuccessful, or management decides not to pursue development of these properties as a result of lower commodity prices, higher development and operating costs, contractual conditions or other factors, the capitalized costs of the related properties would be expensed. The timing of any writedowns of these unproved properties, if warranted, depends upon management's plans, the nature, timing and extent of future exploration and development activities and their results. Occidental believes its current plans and exploration and development efforts will allow it to realize its unproved property balance.
Chemical AssetsOccidental's chemical assets are depreciated using
either the unit-of-production or the straight-line method, based upon the estimated useful lives of the facilities. The estimated useful lives of Occidental’s chemical assets, which range from three years to 50 years, are also used for impairment tests. The estimated useful lives for the chemical facilities are based on the assumption that Occidental will provide an appropriate level of annual expenditures to ensure productive capacity is sustained. Such expenditures consist of ongoing routine repairs and maintenance, as well as planned major maintenance activities (PMMA). Ongoing routine repairs and maintenance expenditures are expensed as incurred.

32
PMMA costs are capitalized and amortized over the period until the next planned overhaul. Additionally, Occidental incurs capital expenditures that extend the remaining useful lives of existing assets, increase their capacity or operating efficiency beyond the original specification or add value through modification for a different use. These capital expenditures are not considered in the initial determination of the useful lives of these assets at the time they are placed into service. The resulting revision, if any, of the asset’s estimated useful life is measured and accounted for prospectively.
Without these continued expenditures, the useful lives of these assets could decrease significantly. Other factors that could change the estimated useful lives of Occidental’s chemical assets include sustained higher or lower product prices, which are particularly affected by both domestic and foreign competition, demand, feedstock costs, energy prices, environmental regulations and technological changes.
Occidental performs impairment tests on its chemical assets whenever events or changes in circumstances lead to a reduction in the estimated useful lives or estimated future cash flows that would indicate that the carrying amount may not be recoverable, or when management’s plans change with respect to those assets. Any impairment loss would be calculated as the excess of the asset's net book value over its estimated fair value.
Occidental's net PP&E for the chemical segment is approximately $2.4 billion and its DD&A expense for 2018 is expected to be approximately $350 million. The most significant financial statement impact of a decrease in the estimated useful lives of Occidental's chemical plants would be on depreciation expense. For example, a reduction in the remaining useful lives of one year would increase depreciation and reduce pre-tax earnings by approximately $44 million per year.
Midstream, Marketing and Other AssetsDerivatives are carried at fair value and on a net basis
when a legal right of offset exists with the same counterparty. Occidental applies hedge accounting when transactions meet specified criteria for cash-flow hedge treatment and management elects and documents such treatment. Otherwise, any fair value gains or losses are recognized in earnings in the current period. For cash-flow hedges, the gain or loss on the effective portion of the derivative is reported as a component of other comprehensive income (OCI) with an offsetting adjustment to the basis of the item being hedged. Realized gains or losses from cash-flow hedges, and any ineffective portion, are recorded as a component of net sales in the consolidated statements of operations. Ineffectiveness is primarily created by a lack of correlation between the hedged item and the hedging instrument due to location, quality, grade or changes in the expected quantity of the hedged item. Gains and losses from derivative instruments are reported net in the consolidated statements of operations. There were no fair value hedges as of and during the years ended December 31, 2017, 2016 and 2015.
A hedge is regarded as highly effective such that it qualifies for hedge accounting if, at inception and
throughout its life, it is expected that changes in the fair value or cash flows of the hedged item will be offset by 80 to 125 percent of the changes in the fair value or cash flows, respectively, of the hedging instrument. In the case of hedging a forecast transaction, the transaction must be probable and must present an exposure to variations in cash flows that could ultimately affect reported net income or loss. Occidental discontinues hedge accounting when it determines that a derivative has ceased to be highly effective as a hedge; when the hedged item matures or is sold or repaid; or when a forecast transaction is no longer deemed probable.
Occidental's midstream and marketing PP&E is depreciated over the estimated useful lives of the assets, using either the unit-of-production or straight-line method. Occidental performs impairment tests on its midstream and marketing assets whenever events or changes in circumstances lead to a reduction in the estimated useful lives or estimated future cash flows that would indicate that the carrying amount may not be recoverable, or when management’s plans change with respect to those assets. Any impairment loss would be calculated as the excess of the asset's net book value over its estimated fair value.
Fair Value MeasurementsOccidental has categorized its assets and liabilities
that are measured at fair value in a three-level fair value hierarchy, based on the inputs to the valuation techniques: Level 1 – using quoted prices in active markets for the assets or liabilities; Level 2 – using observable inputs other than quoted prices for the assets or liabilities; and Level 3 – using unobservable inputs. Transfers between levels, if any, are recognized at the end of each reporting period.
Fair Values - RecurringOccidental primarily applies the market approach for
recurring fair value measurements, maximizes its use of observable inputs and minimizes its use of unobservable inputs. Occidental utilizes the mid-point between bid and ask prices for valuing the majority of its assets and liabilities measured and reported at fair value. In addition to using market data, Occidental makes assumptions in valuing its assets and liabilities, including assumptions about the risks inherent in the inputs to the valuation technique. For assets and liabilities carried at fair value, Occidental measures fair value using the following methods:
Occidental values exchange-cleared commodity derivatives using closing prices provided by the exchange as of the balance sheet date. These derivatives are classified as Level 1. Over-the-Counter (OTC) bilateral financial commodity contracts, foreign exchange contracts, options and physical commodity forward purchase and sale contracts are generally classified as Level 2 and are generally valued using quotations provided by brokers or industry-standard models that consider various inputs, including quoted forward prices for commodities, time value, volatility factors, credit risk and current market and contractual prices for the underlying instruments, as well as other relevant economic measures. Substantially all of these inputs
33
are observable in the marketplace throughout the full term of the instrument, and can be derived from observable data or are supported by observable prices at which transactions are executed in the marketplace. Occidental values commodity derivatives based on a market approach that considers various assumptions, including quoted forward commodity prices and market yield curves. The assumptions used include inputs that are generally unobservable in the marketplace or are observable but have been adjusted based upon various assumptions and the fair value is designated as Level 3 within the valuation hierarchy.
Occidental generally uses an income approach to measure fair value when there is not a market-observable price for an identical or similar asset or liability. This approach utilizes management's judgments regarding expectations of projected cash flows, and discounts those cash flows using a risk-adjusted discount rate.
Environmental Liabilities and ExpendituresEnvironmental expenditures that relate to current
operations are expensed or capitalized as appropriate. Occidental records environmental reserves and related charges and expenses for estimated remediation costs that relate to existing conditions from past operations when environmental remediation efforts are probable and the costs can be reasonably estimated. In determining the reserves and the range of reasonably possible additional losses, Occidental refers to currently available information, including relevant past experience, remedial objectives, available technologies, applicable laws and regulations and cost-sharing arrangements. Occidental bases environmental reserves on management’s estimate of the most likely cost to be incurred, using the most cost-effective technology reasonably expected to achieve the remedial objective. Occidental periodically reviews reserves and adjusts them as new information becomes available. Occidental records environmental reserves on a discounted basis when it deems the aggregate amount and timing of cash payments to be reliably determinable at the time the reserves are established. The reserve methodology with respect to discounting for a specific site is not modified once it is established. Presently none of the environmental reserves are recorded on a discounted basis. Occidental generally records reimbursements or recoveries of environmental remediation costs in income when received, or when receipt of recovery is highly probable.
Many factors could affect Occidental’s future remediation costs and result in adjustments to its environmental reserves and range of reasonably possible additional losses. The most significant are: (1) cost estimates for remedial activities may be inaccurate; (2) the length of time, type or amount of remediation necessary to achieve the remedial objective may change due to factors such as site conditions, the ability to identify and control contaminant sources or the discovery of additional contamination; (3) a regulatory agency may ultimately reject or modify Occidental’s proposed remedial plan; (4) improved or alternative remediation technologies may change remediation costs; (5) laws and regulations may
change remediation requirements or affect cost sharing or allocation of liability; and (6) changes in allocation or cost-sharing arrangements may occur.
Certain sites involve multiple parties with various cost-sharing arrangements, which fall into the following three categories: (1) environmental proceedings that result in a negotiated or prescribed allocation of remediation costs among Occidental and other alleged potentially responsible parties; (2) oil and gas ventures in which each participant pays its proportionate share of remediation costs reflecting its working interest; or (3) contractual arrangements, typically relating to purchases and sales of properties, in which the parties to the transaction agree to methods of allocating remediation costs. In these circumstances, Occidental evaluates the financial viability of other parties with whom it is alleged to be jointly liable, the degree of their commitment to participate and the consequences to Occidental of their failure to participate when estimating Occidental's ultimate share of liability. Occidental records reserves at its expected net cost of remedial activities and, based on these factors, believes that it will not be required to assume a share of liability of such other potentially responsible parties in an amount materially above amounts reserved.
In addition to the costs of investigations and cleanup measures, which often take in excess of 10 years at NPL sites, Occidental's reserves include management's estimates of the costs to operate and maintain remedial systems. If remedial systems are modified over time in response to significant changes in site-specific data, laws, regulations, technologies or engineering estimates, Occidental reviews and adjusts its reserves accordingly.
If Occidental were to adjust the environmental reserve balance based on the factors described above, the amount of the increase or decrease would be recognized in earnings. For example, if the reserve balance were reduced by 10 percent, Occidental would record a pre-tax gain of $87 million. If the reserve balance were increased by 10 percent, Occidental would record an additional remediation expense of $87 million.
Other Loss ContingenciesOccidental is involved, in the normal course of
business, in lawsuits, claims and other legal proceedings and audits. Occidental accrues reserves for these matters when it is probable that a liability has been incurred and the liability can be reasonably estimated. In addition, Occidental discloses, in aggregate, its exposure to loss in excess of the amount recorded on the balance sheet for these matters if it is reasonably possible that an additional material loss may be incurred. Occidental reviews its loss contingencies on an ongoing basis.
Loss contingencies are based on judgments made by management with respect to the likely outcome of these matters and are adjusted as appropriate. Management’s judgments could change based on new information, changes in, or interpretations of, laws or regulations, changes in management’s plans or intentions, opinions regarding the outcome of legal proceedings, or other factors. See "Lawsuits, Claims and Contingencies" for additional information.

34
SIGNIFICANT ACCOUNTING AND DISCLOSURE CHANGES
See Note 3 in the Notes to Condensed Consolidated Financial Statements in Part II Item 8 of this Form 10-K. SAFE HARBOR DISCUSSION REGARDING OUTLOOK AND OTHER FORWARD-LOOKING DATA
Portions of this report, including Items 1 and 2, "Business and Properties," Item 3, "Legal Proceedings," Item 7 "Management's Discussion and Analysis of Financial Condition and Results of Operations," and Item 7A, "Quantitative and Qualitative Disclosures About Market Risk," contain forward-looking statements within the meaning of Section 27A of the Securities Act of 1933 and Section 21E of the Securities Exchange Act of 1934 and involve risks and uncertainties that could materially affect expected results of operations, liquidity, cash flows and business prospects. Words such as "estimate," "project," "predict," "will," "would," "should," "could," "may," "might," "anticipate," "plan," "intend," "believe," "expect," "aim," "goal," "target," "objective," "likely" or similar expressions that convey the prospective nature of events or outcomes generally indicate forward-looking statements. You should not place undue reliance on these forward-looking statements, which speak only as of the date of this report. Unless legally required, Occidental does not undertake any obligation to update any forward-looking statements as a result of new information, future events or otherwise. Factors that may cause Occidental’s results of operations and financial position to differ from expectations include the factors discussed in Item 1A, "Risk Factors" and elsewhere. ITEM 7A QUANTITATIVE AND QUALITATIVE DISCLOSURES ABOUT MARKET RISK Commodity Price RiskGeneral
Occidental’s results are sensitive to fluctuations in oil, NGLs and natural gas prices. Price changes at current global prices and levels of production affect Occidental’s pre-tax annual income by approximately $110 million for a $1 per barrel change in oil prices and $30 million for a $1 per barrel change in NGLs prices. If domestic natural gas prices varied by $0.50 per Mcf, it would have an estimated annual effect on Occidental's pre-tax income of approximately $20 million. These price-change sensitivities include the impact of PSC and similar contract volume changes on income. If production levels change in the future, the sensitivity of Occidental’s results to prices also will change. Marketing results are sensitive to price changes of oil, natural gas and, to a lesser degree, other commodities. These sensitivities are additionally dependent on marketing volumes and cannot be predicted reliably.
Occidental’s results are also sensitive to fluctuations in chemical prices. A variation in chlorine and caustic soda prices of $10 per ton would have a pre-tax annual effect on income of approximately $10 million and $30 million, respectively. A variation in PVC prices of $0.01 per lb. would
have a pre-tax annual effect on income of approximately $30 million. Historically, over time, product price changes have tracked raw material and feedstock product price changes, somewhat mitigating the effect of price changes on margins. According to IHS Chemical or Townsend, 2017average contract prices were: chlorine-$324 per ton; caustic soda-$635 per ton; and PVC-$0.40 per lb.
Occidental uses derivative instruments, including a combination of short-term futures, forwards, options and swaps, to obtain the average prices for the relevant production month and to improve realized prices for oil and gas.
Risk Management
Occidental conducts its risk management activities for marketing and trading under the controls and governance of its risk control policies. The controls under these policies are implemented and enforced by a risk management group which monitors risk by providing an independent and separate evaluation and check. Members of the risk management group report to the Corporate Vice President and Treasurer. Controls for these activities include limits on value at risk, limits on credit, limits on total notional trade value, segregation of duties, delegation of authority, daily price verifications, reporting to senior management of various risk measures and a number of other policy and procedural controls.
Fair Value of Marketing Derivative Contracts
Occidental carries derivative contracts it enters into in connection with its marketing activities at fair value. Fair values for these contracts are derived from Level 1 and Level 2 sources. The fair values in future maturity periods are insignificant.
The following table shows the fair value of Occidental's derivatives (excluding collateral), segregated by maturity periods and by methodology of fair value estimation:
Maturity Periods Source of Fair ValueAssets/(liabilities)(in millions) 2018
2019and
2020
2021and
2022 TotalPrices actively quoted $ (49) $ — $ — $ (49)Prices provided by other external
sources 7 (1) — 6Total $ (42) $ (1) $ — $ (43)
Cash-Flow Hedges
Occidental’s marketing operations, from time to time, store natural gas purchased from third parties at Occidental’s North American leased storage facilities. As of December 31, 2017, and 2016, Occidental had approximately 7 billion cubic feet (Bcf) of natural gas held in storage, and had cash-flow hedges for the forecasted sales, to be settled by physical delivery, of approximately 7 Bcf of stored natural gas.
Quantitative Information
Occidental uses value at risk to estimate the potential effects of changes in fair values of commodity contracts used in trading activities. This measure determines the maximum potential negative one day change in fair value

35
with a 95 percent level of confidence. Additionally, Occidental uses complementary trading limits including position and tenor limits and maintains liquid positions as a result of which market risk typically can be neutralized or mitigated on short notice. As a result of these controls, Occidental has determined that market risk of its trading activities is not reasonably likely to have a material adverse effect on its performance.
Interest Rate RiskGeneral
Occidental's exposure to changes in interest rates is not expected to be material and relates to its variable-rate long-term debt obligations. As of December 31, 2017, variable-rate debt constituted approximately 1 percent of Occidental's total debt.
Foreign Currency Risk
Occidental’s foreign operations have limited currency risk. Occidental manages its exposure primarily by balancing monetary assets and liabilities and limiting cash positions in foreign currencies to levels necessary for operating purposes. A vast majority of international oil sales are denominated in United States dollars. Additionally, all of Occidental’s consolidated foreign oil and gas subsidiaries have the United States dollar as the functional currency. As of December 31, 2017, the fair value of foreign currency derivatives used in the marketing operations was immaterial. The effect of exchange rates on transactions in foreign currencies is included in periodic income.
Tabular Presentation of Interest Rate RiskThe table below provides information about
Occidental's debt obligations. Debt amounts represent principal payments by maturity date.
Year of Maturity(in millions of U.S. dollars)
U.S. DollarFixed-Rate
Debt
U.S. DollarVariable-Rate
Debt Grand Total (a)
2018 500 — 5002019 116 — 1162020 — — —2021 1,249 — 1,2492022 1,213 1,213Thereafter 6,761 68 6,829Total $ 9,839 $ 68 $ 9,907Weighted-average
interest rate 3.67% 1.83% 3.66%Fair Value $ 10,332 $ 68 $ 10,400
(a) Excludes unamortized debt discounts of $32 million and debt issuance cost of $47 million.
Credit RiskThe majority of Occidental's counterparty credit risk is
related to the physical delivery of energy commodities to its customers and their inability to meet their settlement commitments. Occidental manages credit risk by selecting counterparties that it believes to be financially strong, by entering into netting arrangements with counterparties and by requiring collateral or other credit risk mitigants, as appropriate. Occidental actively evaluates the creditworthiness of its counterparties, assigns appropriate credit limits, and monitors credit exposures against those assigned limits. Occidental also enters into future contracts through regulated exchanges with select clearinghouses and brokers, which are subject to minimal credit risk as a significant portion of these transactions settle on a daily margin basis.
Certain of Occidental's OTC derivative instruments contain credit-risk-contingent features, primarily tied to credit ratings for Occidental or its counterparties, which may affect the amount of collateral that each would need to post. Occidental believes that if it had received a one-notch reduction in its credit ratings, it would not have resulted in a material change in its collateral-posting requirements as of December 31, 2017 and 2016.
As of December 31, 2017, the substantial majority of the credit exposures were with investment grade counterparties. Occidental believes its exposure to credit-related losses at December 31, 2017 was not material and losses associated with credit risk have been insignificant for all years presented.
36
ITEM 8 FINANCIAL STATEMENTS AND SUPPLEMENTARY DATAREPORT OF INDEPENDENT REGISTERED PUBLIC ACCOUNTING FIRM
To The Stockholders and Board of DirectorsOccidental Petroleum Corporation:
Opinion on the Consolidated Financial Statements
We have audited the accompanying consolidated balance sheets of Occidental Petroleum Corporation and subsidiaries (the “Company”) as of December 31, 2017 and 2016, the related consolidated statements of operations, comprehensive income, stockholders’ equity, and cash flows for each of the years in the three year period ended December 31, 2017, and the related notes and financial statement schedule II - valuation and qualifying accounts (collectively, the “consolidated financial statements”). In our opinion, the consolidated financial statements present fairly, in all material respects, the financial position of the Company as of December 31, 2017 and 2016, and the results of its operations and its cash flows for each of the years in the three year period ended December 31, 2017, in conformity with U.S. generally accepted accounting principles.
We also have audited, in accordance with the standards of the Public Company Accounting Oversight Board (United States) (“PCAOB”), the Company’s internal control over financial reporting as of December 31, 2017, based on criteria established in Internal Control - Integrated Framework (2013) issued by the Committee of Sponsoring Organizations of the Treadway Commission, and our report dated February 23, 2018 expressed an unqualified opinion on the effectiveness of the Company’s internal control over financial reporting.
Basis for Opinion
These consolidated financial statements are the responsibility of the Company’s management. Our responsibility is to express an opinion on these consolidated financial statements based on our audits. We are a public accounting firm registered with the PCAOB and are required to be independent with respect to the Company in accordance with the U.S. federal securities laws and the applicable rules and regulations of the Securities and Exchange Commission and the PCAOB.
We conducted our audits in accordance with the standards of the PCAOB. Those standards require that we plan and perform the audit to obtain reasonable assurance about whether the consolidated financial statements are free of material misstatement, whether due to error or fraud. Our audits included performing procedures to assess the risks of material misstatement of the consolidated financial statements, whether due to error or fraud, and performing procedures that respond to those risks. Such procedures included examining, on a test basis, evidence regarding the amounts and disclosures in the consolidated financial statements. Our audits also included evaluating the accounting principles used and significant estimates made by management, as well as evaluating the overall presentation of the consolidated financial statements. We believe that our audits provide a reasonable basis for our opinion.
/s/ KPMG LLP
We have served as the Company’s auditor since 2002.
Houston, Texas
February 23, 2018
37
REPORT OF INDEPENDENT REGISTERED PUBLIC ACCOUNTING FIRM
To The Stockholders and Board of DirectorsOccidental Petroleum Corporation:
Opinion on Internal Control Over Financial Reporting
We have audited Occidental Petroleum Corporation and subsidiaries’ (the “Company”) internal control over financial reporting as of December 31, 2017, based on criteria established in Internal Control - Integrated Framework (2013) issued by the Committee of Sponsoring Organizations of the Treadway Commission. In our opinion, the Company maintained, in all material respects, effective internal control over financial reporting as of December 31, 2017, based on criteria established in Internal Control - Integrated Framework (2013) issued by the Committee of Sponsoring Organizations of the Treadway Commission.
We also have audited, in accordance with the standards of the Public Company Accounting Oversight Board (United States) (“PCAOB”), the consolidated balance sheets of the Company as of December 31, 2017 and 2016, the related consolidated statements of operations, comprehensive income, stockholders’ equity, and cash flows for each of the years in the three-year period ended December 31, 2017, and the related notes and financial statement schedule II - valuation and qualifying accounts (collectively, the “consolidated financial statements’’), and our report dated February 23, 2018 expressed an unqualified opinion on those consolidated financial statements.
Basis for Opinion
The Company’s management is responsible for maintaining effective internal control over financial reporting and for its assessment of the effectiveness of internal control over financial reporting, included in the accompanying Management’s Annual Assessment of and Report on Internal Control over Financial Reporting. Our responsibility is to express an opinion on the Company’s internal control over financial reporting based on our audit. We are a public accounting firm registered with the PCAOB and are required to be independent with respect to the Company in accordance with the U.S. federal securities laws and the applicable rules and regulations of the Securities and Exchange Commission and the PCAOB.
We conducted our audit in accordance with the standards of the PCAOB. Those standards require that we plan and perform the audit to obtain reasonable assurance about whether effective internal control over financial reporting was maintained in all material respects. Our audit of internal control over financial reporting included obtaining an understanding of internal control over financial reporting, assessing the risk that a material weakness exists, and testing and evaluating the design and operating effectiveness of internal control based on the assessed risk. Our audit also included performing such other procedures as we considered necessary in the circumstances. We believe that our audit provides a reasonable basis for our opinion.
Definition and Limitations of Internal Control Over Financial Reporting
A company’s internal control over financial reporting is a process designed to provide reasonable assurance regarding the reliability of financial reporting and the preparation of financial statements for external purposes in accordance with generally accepted accounting principles. A company’s internal control over financial reporting includes those policies and procedures that (1) pertain to the maintenance of records that, in reasonable detail, accurately and fairly reflect the transactions and dispositions of the assets of the company; (2) provide reasonable assurance that transactions are recorded as necessary to permit preparation of financial statements in accordance with generally accepted accounting principles, and that receipts and expenditures of the company are being made only in accordance with authorizations of management and directors of the company; and (3) provide reasonable assurance regarding prevention or timely detection of unauthorized acquisition, use, or disposition of the company’s assets that could have a material effect on the financial statements.
Because of its inherent limitations, internal control over financial reporting may not prevent or detect misstatements. Also, projections of any evaluation of effectiveness to future periods are subject to the risk that controls may become inadequate because of changes in conditions, or that the degree of compliance with the policies or procedures may deteriorate.
/s/ KPMG LLP
Houston, Texas
February 23, 2018
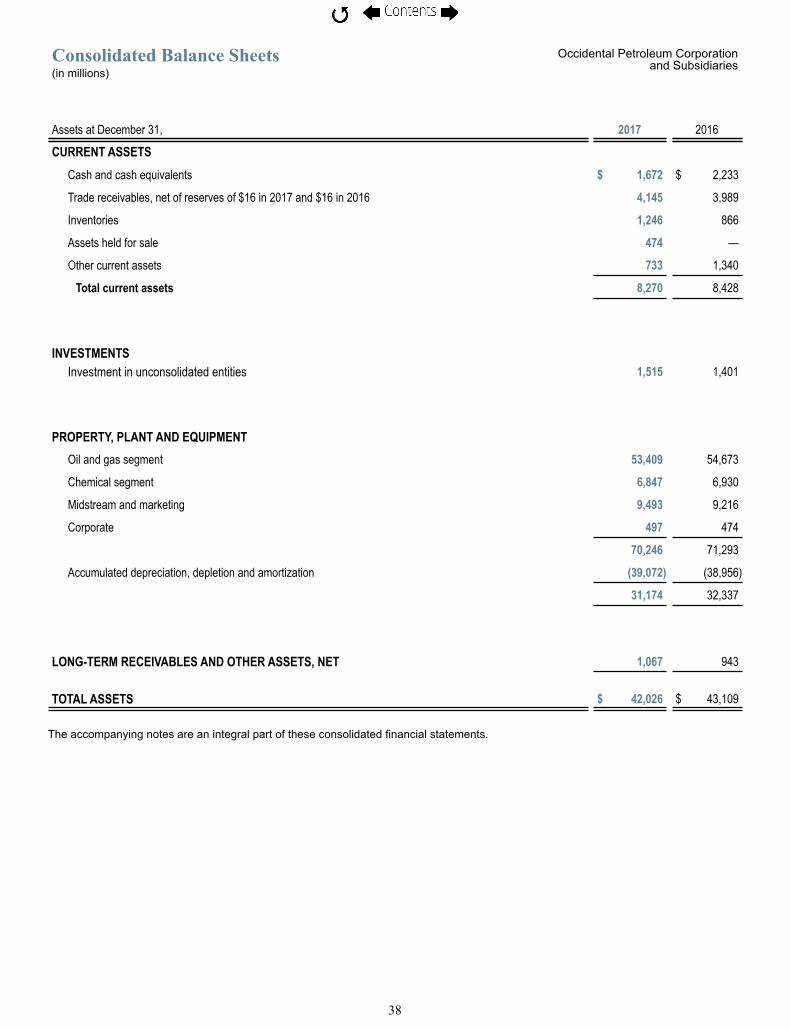
38
Consolidated Balance Sheets Occidental Petroleum Corporationand Subsidiaries(in millions)
Assets at December 31, 2017 2016
CURRENT ASSETS
Cash and cash equivalents $ 1,672 $ 2,233
Trade receivables, net of reserves of $16 in 2017 and $16 in 2016 4,145 3,989
Inventories 1,246 866
Assets held for sale 474 —
Other current assets 733 1,340
Total current assets 8,270 8,428
INVESTMENTS Investment in unconsolidated entities 1,515 1,401
PROPERTY, PLANT AND EQUIPMENT
Oil and gas segment 53,409 54,673
Chemical segment 6,847 6,930
Midstream and marketing 9,493 9,216
Corporate 497 474
70,246 71,293
Accumulated depreciation, depletion and amortization (39,072) (38,956)
31,174 32,337
LONG-TERM RECEIVABLES AND OTHER ASSETS, NET 1,067 943
TOTAL ASSETS $ 42,026 $ 43,109 The accompanying notes are an integral part of these consolidated financial statements.

39
Consolidated Balance Sheets Occidental Petroleum Corporationand Subsidiaries(in millions, except share and per-share amounts)
Liabilities and Stockholders’ Equity at December 31, 2017 2016
CURRENT LIABILITIES
Current maturities of long-term debt $ 500 $ —
Accounts payable 4,408 3,926
Accrued liabilities 2,492 2,436
Total current liabilities 7,400 6,362
LONG-TERM DEBT, NET 9,328 9,819
DEFERRED CREDITS AND OTHER LIABILITIES
Deferred domestic and foreign income taxes 581 1,132
Asset retirement obligations 1,241 1,245
Pension and postretirement obligations 1,005 963
Environmental remediation reserves 728 739
Other 1,171 1,352
4,726 5,431
STOCKHOLDERS' EQUITY Common stock, $0.20 per share par value, authorized shares: 1.1 billion, issued shares:2017 — 893,468,707 and 2016 — 892,214,604 179 178Treasury stock: 2017 — 128,364,195 shares and 2016 — 127,977,306 shares (9,168) (9,143)
Additional paid-in capital 7,884 7,747
Retained earnings 21,935 22,981
Accumulated other comprehensive loss (258) (266)
Total stockholders' equity 20,572 21,497
TOTAL LIABILITIES AND STOCKHOLDERS' EQUITY $ 42,026 $ 43,109 The accompanying notes are an integral part of these consolidated financial statements.
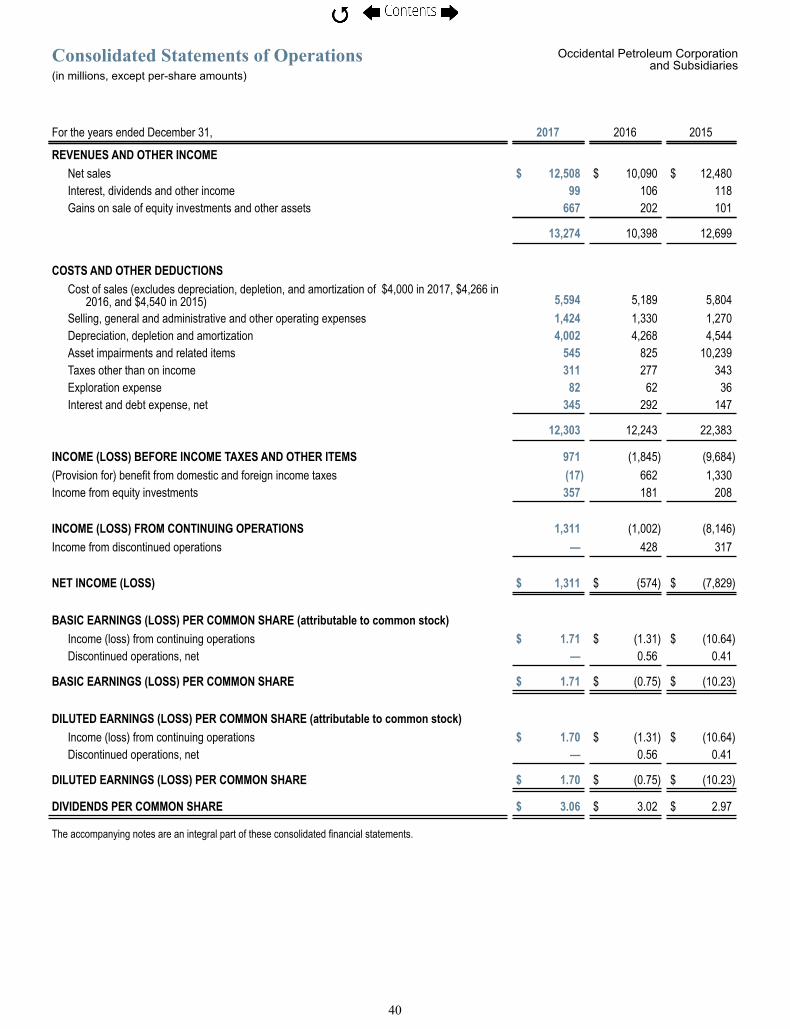
40
Consolidated Statements of Operations Occidental Petroleum Corporationand Subsidiaries
(in millions, except per-share amounts)
For the years ended December 31, 2017 2016 2015
REVENUES AND OTHER INCOME Net sales $ 12,508 $ 10,090 $ 12,480Interest, dividends and other income 99 106 118Gains on sale of equity investments and other assets 667 202 101
13,274 10,398 12,699
COSTS AND OTHER DEDUCTIONS Cost of sales (excludes depreciation, depletion, and amortization of $4,000 in 2017, $4,266 in
2016, and $4,540 in 2015) 5,594 5,189 5,804Selling, general and administrative and other operating expenses 1,424 1,330 1,270Depreciation, depletion and amortization 4,002 4,268 4,544Asset impairments and related items 545 825 10,239Taxes other than on income 311 277 343Exploration expense 82 62 36Interest and debt expense, net 345 292 147
12,303 12,243 22,383
INCOME (LOSS) BEFORE INCOME TAXES AND OTHER ITEMS 971 (1,845) (9,684)(Provision for) benefit from domestic and foreign income taxes (17) 662 1,330Income from equity investments 357 181 208
INCOME (LOSS) FROM CONTINUING OPERATIONS 1,311 (1,002) (8,146)Income from discontinued operations — 428 317
NET INCOME (LOSS) $ 1,311 $ (574) $ (7,829)
BASIC EARNINGS (LOSS) PER COMMON SHARE (attributable to common stock) Income (loss) from continuing operations $ 1.71 $ (1.31) $ (10.64)Discontinued operations, net — 0.56 0.41
BASIC EARNINGS (LOSS) PER COMMON SHARE $ 1.71 $ (0.75) $ (10.23)
DILUTED EARNINGS (LOSS) PER COMMON SHARE (attributable to common stock) Income (loss) from continuing operations $ 1.70 $ (1.31) $ (10.64)Discontinued operations, net — 0.56 0.41
DILUTED EARNINGS (LOSS) PER COMMON SHARE $ 1.70 $ (0.75) $ (10.23)
DIVIDENDS PER COMMON SHARE $ 3.06 $ 3.02 $ 2.97
The accompanying notes are an integral part of these consolidated financial statements.

41
Consolidated Statements of Comprehensive Income Occidental Petroleum Corporationand Subsidiaries(in millions)
For the years ended December 31, 2017 2016 2015Net income (loss) attributable to common stock $ 1,311 $ (574) $ (7,829)
Other comprehensive income (loss) items: Foreign currency translation (losses) gains 3 — (2)Unrealized gains (losses) on derivatives (a) 13 (14) 3Pension and postretirement gains (losses) (b) (7) 47 48Reclassification of realized losses (gains) on derivatives (c) (1) 8 1
Other comprehensive income, net of tax 8 41 50Comprehensive income (loss) $ 1,319 $ (533) $ (7,779)
(a) Net of tax of $(7), $8 and $(2) in 2017, 2016 and 2015, respectively. The 2015 amount includes a lower of cost or market inventory adjustment for hedged natural gas of $(2).
(b) Net of tax of $4, $(26) and $(27) in 2017, 2016 and 2015, respectively. See Note 13 for additional information.(c) Net of tax of zero, $(4) and $(1) in 2017, 2016 and 2015, respectively.
The accompanying notes are an integral part of these consolidated financial statements.

42
Consolidated Statements of Stockholders' Equity Occidental Petroleum Corporationand Subsidiaries(in millions)
Equity Attributable to Common Stock
Common
StockTreasury
Stock
AdditionalPaid-inCapital
RetainedEarnings
AccumulatedOther
ComprehensiveIncome (Loss) Total Equity
Balance, December 31, 2014 $ 178 $ (8,528) $ 7,599 $ 36,067 $ (357) $ 34,959
Net loss — — — (7,829) — (7,829)Other comprehensive income,
net of tax — — — — 50 50
Dividends on common stock — — — (2,278) — (2,278)Issuance of common stock and
other, net — — 41 — — 41
Purchases of treasury stock — (593) — — — (593)Balance, December 31, 2015 $ 178 $ (9,121) $ 7,640 $ 25,960 $ (307) $ 24,350
Net loss — — — (574) — (574)Other comprehensive income,
net of tax — — — — 41 41
Dividends on common stock — — — (2,405) — (2,405)Issuance of common stock and
other, net — — 107 — — 107
Purchases of treasury stock — (22) — — — (22)Balance, December 31, 2016 $ 178 $ (9,143) $ 7,747 $ 22,981 $ (266) $ 21,497
Net income — — — 1,311 — 1,311Other comprehensive income,
net of tax — — — — 8 8
Dividends on common stock — — — (2,357) — (2,357)Issuance of common stock and
other, net 1 — 137 — — 138
Purchases of treasury stock — (25) — — — (25)Balance, December 31, 2017 $ 179 $ (9,168) $ 7,884 $ 21,935 $ (258) $ 20,572
The accompanying notes are an integral part of these consolidated financial statements.
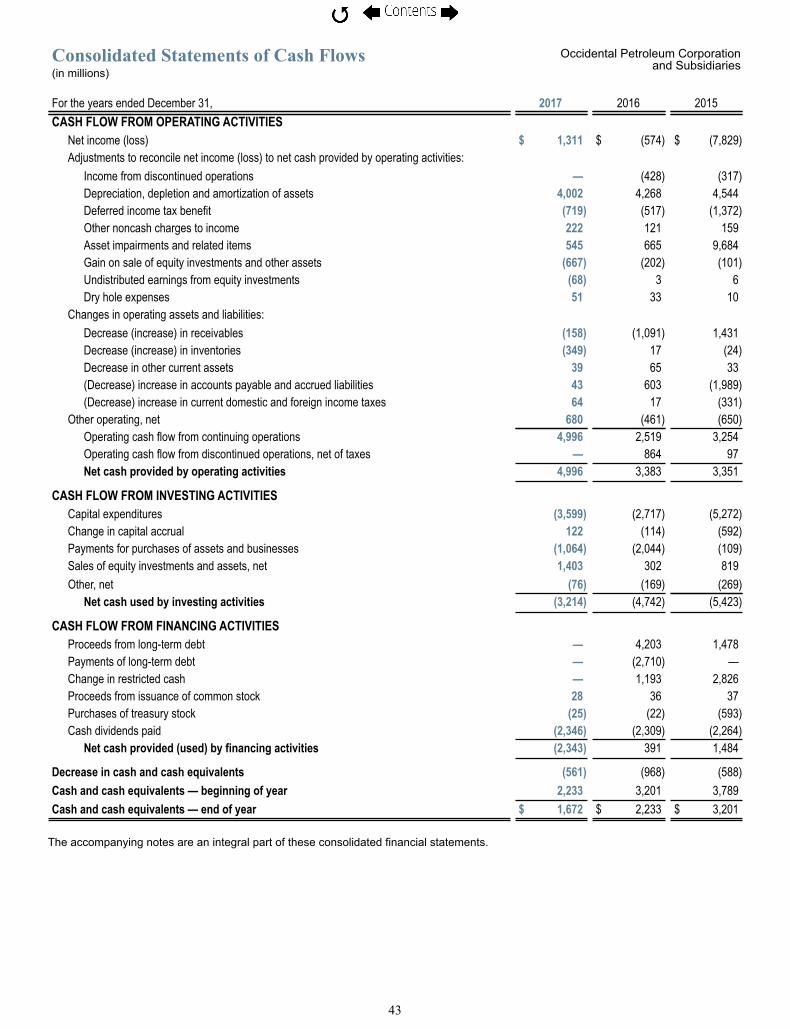
43
Consolidated Statements of Cash Flows Occidental Petroleum Corporationand Subsidiaries(in millions)
For the years ended December 31, 2017 2016 2015CASH FLOW FROM OPERATING ACTIVITIES
Net income (loss) $ 1,311 $ (574) $ (7,829)Adjustments to reconcile net income (loss) to net cash provided by operating activities:
Income from discontinued operations — (428) (317)Depreciation, depletion and amortization of assets 4,002 4,268 4,544Deferred income tax benefit (719) (517) (1,372)Other noncash charges to income 222 121 159Asset impairments and related items 545 665 9,684Gain on sale of equity investments and other assets (667) (202) (101)Undistributed earnings from equity investments (68) 3 6Dry hole expenses 51 33 10
Changes in operating assets and liabilities: Decrease (increase) in receivables (158) (1,091) 1,431Decrease (increase) in inventories (349) 17 (24)Decrease in other current assets 39 65 33(Decrease) increase in accounts payable and accrued liabilities 43 603 (1,989)(Decrease) increase in current domestic and foreign income taxes 64 17 (331)
Other operating, net 680 (461) (650)Operating cash flow from continuing operations 4,996 2,519 3,254Operating cash flow from discontinued operations, net of taxes — 864 97Net cash provided by operating activities 4,996 3,383 3,351
CASH FLOW FROM INVESTING ACTIVITIES Capital expenditures (3,599) (2,717) (5,272)Change in capital accrual 122 (114) (592)Payments for purchases of assets and businesses (1,064) (2,044) (109)Sales of equity investments and assets, net 1,403 302 819Other, net (76) (169) (269)
Net cash used by investing activities (3,214) (4,742) (5,423)
CASH FLOW FROM FINANCING ACTIVITIES Proceeds from long-term debt — 4,203 1,478Payments of long-term debt — (2,710) —Change in restricted cash — 1,193 2,826Proceeds from issuance of common stock 28 36 37Purchases of treasury stock (25) (22) (593)Cash dividends paid (2,346) (2,309) (2,264)
Net cash provided (used) by financing activities (2,343) 391 1,484
Decrease in cash and cash equivalents (561) (968) (588)Cash and cash equivalents — beginning of year 2,233 3,201 3,789Cash and cash equivalents — end of year $ 1,672 $ 2,233 $ 3,201
The accompanying notes are an integral part of these consolidated financial statements.

44
Notes to Consolidated Financial Statements Occidental Petroleum Corporationand Subsidiaries
NOTE 1 SUMMARY OF SIGNIFICANT ACCOUNTING POLICIES
NATURE OF OPERATIONSIn this report, "Occidental" means Occidental Petroleum Corporation, a Delaware corporation (OPC), or OPC and one or
more entities in which it owns a controlling interest (subsidiaries). Occidental conducts its operations through various subsidiaries and affiliates. Occidental's principal businesses consist of three segments. The oil and gas segment explores for, develops and produces oil and condensate, natural gas liquids (NGLs) and natural gas. The chemical segment (OxyChem) mainly manufactures and markets basic chemicals and vinyls. The midstream and marketing segment gathers, processes, transports, stores, purchases and markets oil, condensate, NGLs, natural gas, carbon dioxide (CO2) and power. It also trades around its assets, including transportation and storage capacity. Additionally, the midstream and marketing segment operates a crude oil export terminal, as well as invests in entities that conduct similar activities.
PRINCIPLES OF CONSOLIDATIONThe consolidated financial statements have been prepared in conformity with United States generally accepted accounting
principles (GAAP) and include the accounts of OPC, its subsidiaries and its undivided interests in oil and gas exploration and production ventures. Occidental accounts for its share of oil and gas exploration and production ventures, in which it has a direct working interest, by reporting its proportionate share of assets, liabilities, revenues, costs and cash flows within the relevant lines on the balance sheets, income statements and cash flow statements.
Certain financial statements, notes and supplementary data for prior years have been reclassified to conform to the 2017presentation.
INVESTMENTS IN UNCONSOLIDATED ENTITIESOccidental’s percentage interest in the underlying net assets of affiliates as to which it exercises significant influence
without having a controlling interest (excluding oil and gas ventures in which Occidental holds an undivided interest) are accounted for under the equity method. Occidental reviews equity-method investments for impairment whenever events or changes in circumstances indicate that an other-than-temporary decline in value may have occurred. The amount of impairment, if any, is based on quoted market prices, when available, or other valuation techniques, including discounted cash flows.
REVENUE RECOGNITIONRevenue is recognized from oil and gas production when title has passed to the customer, which occurs when the product
is shipped. Where oil is shipped by tanker, title passes when the tanker is loaded or product is received by the customer, depending on the shipping terms. This process occasionally causes a difference between actual production in a reporting period and sales volumes that have been recognized as revenue. Revenues from the production of oil and gas properties in which Occidental has an interest with other producers are recognized on the basis of Occidental’s net revenue interest.
Revenue from chemical product sales is recognized when the product is shipped and title has passed to the customer. Certain incentive programs may provide for payments or credits to be made to customers based on the volume of product purchased over a defined period. Total customer incentive payments over a given period are estimated and recorded as a reduction to revenue ratably over the contract period. Such estimates are evaluated and revised as warranted.
Revenue from marketing activities is recognized on net settled transactions upon completion of contract terms and, for physical deliveries, upon title transfer. For unsettled transactions, contracts are recorded at fair value and changes in fair value are reflected in net sales. Revenue from all marketing activities is reported on a net basis.
Occidental records revenue net of any taxes, such as sales taxes, that are assessed by governmental authorities on Occidental's customers.
RISKS AND UNCERTAINTIESThe process of preparing consolidated financial statements in conformity with GAAP requires Occidental's management
to make informed estimates and judgments regarding certain types of financial statement balances and disclosures. Such estimates primarily relate to unsettled transactions and events as of the date of the consolidated financial statements and judgments on expected outcomes as well as the materiality of transactions and balances. Changes in facts and circumstances or discovery of new information relating to such transactions and events may result in revised estimates and judgments and actual results may differ from estimates upon settlement. Management believes that these estimates and judgments provide a reasonable basis for the fair presentation of Occidental’s financial statements. Occidental establishes a valuation allowance against net operating losses and other deferred tax assets to the extent it believes the future benefit from these assets will not be realized in the statutory carryforward periods. Realization of deferred tax assets is dependent upon Occidental generating sufficient future taxable income and reversal of temporary differences in jurisdictions where such assets originate.
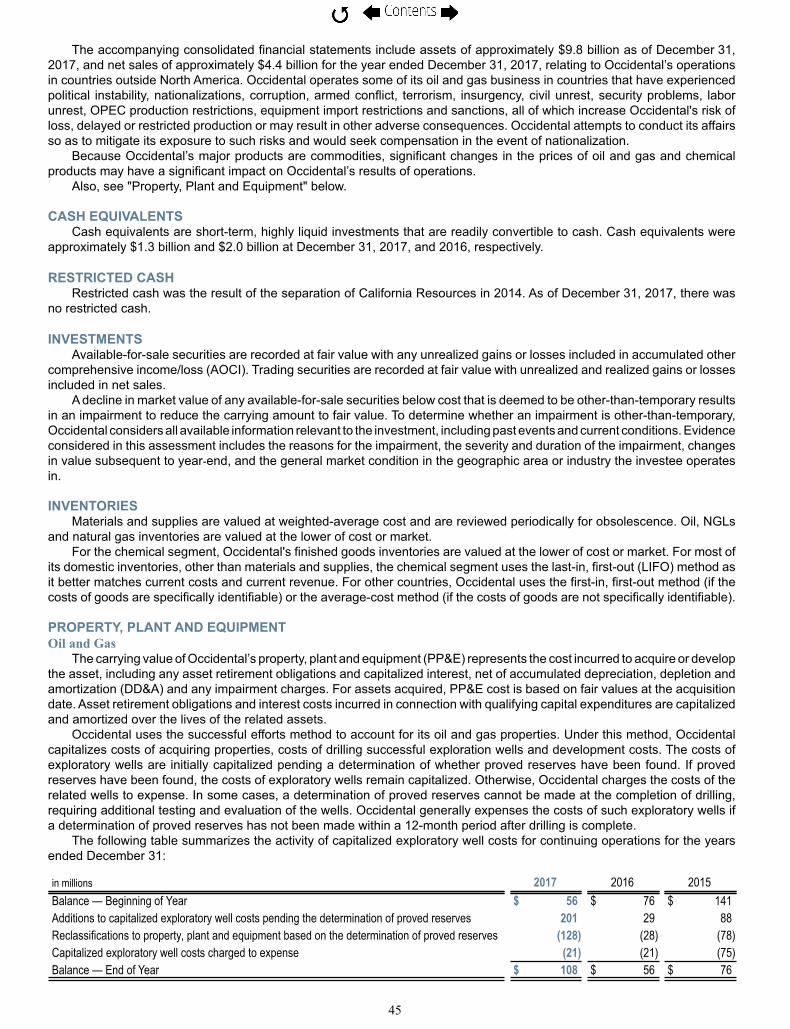
45
The accompanying consolidated financial statements include assets of approximately $9.8 billion as of December 31, 2017, and net sales of approximately $4.4 billion for the year ended December 31, 2017, relating to Occidental’s operations in countries outside North America. Occidental operates some of its oil and gas business in countries that have experienced political instability, nationalizations, corruption, armed conflict, terrorism, insurgency, civil unrest, security problems, labor unrest, OPEC production restrictions, equipment import restrictions and sanctions, all of which increase Occidental's risk of loss, delayed or restricted production or may result in other adverse consequences. Occidental attempts to conduct its affairs so as to mitigate its exposure to such risks and would seek compensation in the event of nationalization.
Because Occidental’s major products are commodities, significant changes in the prices of oil and gas and chemical products may have a significant impact on Occidental’s results of operations.
Also, see "Property, Plant and Equipment" below.
CASH EQUIVALENTSCash equivalents are short-term, highly liquid investments that are readily convertible to cash. Cash equivalents were
approximately $1.3 billion and $2.0 billion at December 31, 2017, and 2016, respectively.
RESTRICTED CASHRestricted cash was the result of the separation of California Resources in 2014. As of December 31, 2017, there was
no restricted cash.
INVESTMENTSAvailable-for-sale securities are recorded at fair value with any unrealized gains or losses included in accumulated other
comprehensive income/loss (AOCI). Trading securities are recorded at fair value with unrealized and realized gains or losses included in net sales.
A decline in market value of any available-for-sale securities below cost that is deemed to be other-than-temporary results in an impairment to reduce the carrying amount to fair value. To determine whether an impairment is other-than-temporary, Occidental considers all available information relevant to the investment, including past events and current conditions. Evidence considered in this assessment includes the reasons for the impairment, the severity and duration of the impairment, changes in value subsequent to year end, and the general market condition in the geographic area or industry the investee operates in.
INVENTORIESMaterials and supplies are valued at weighted-average cost and are reviewed periodically for obsolescence. Oil, NGLs
and natural gas inventories are valued at the lower of cost or market.For the chemical segment, Occidental's finished goods inventories are valued at the lower of cost or market. For most of
its domestic inventories, other than materials and supplies, the chemical segment uses the last-in, first-out (LIFO) method as it better matches current costs and current revenue. For other countries, Occidental uses the first-in, first-out method (if the costs of goods are specifically identifiable) or the average-cost method (if the costs of goods are not specifically identifiable).
PROPERTY, PLANT AND EQUIPMENTOil and Gas
The carrying value of Occidental’s property, plant and equipment (PP&E) represents the cost incurred to acquire or develop the asset, including any asset retirement obligations and capitalized interest, net of accumulated depreciation, depletion and amortization (DD&A) and any impairment charges. For assets acquired, PP&E cost is based on fair values at the acquisition date. Asset retirement obligations and interest costs incurred in connection with qualifying capital expenditures are capitalized and amortized over the lives of the related assets.
Occidental uses the successful efforts method to account for its oil and gas properties. Under this method, Occidental capitalizes costs of acquiring properties, costs of drilling successful exploration wells and development costs. The costs of exploratory wells are initially capitalized pending a determination of whether proved reserves have been found. If proved reserves have been found, the costs of exploratory wells remain capitalized. Otherwise, Occidental charges the costs of the related wells to expense. In some cases, a determination of proved reserves cannot be made at the completion of drilling, requiring additional testing and evaluation of the wells. Occidental generally expenses the costs of such exploratory wells if a determination of proved reserves has not been made within a 12-month period after drilling is complete.
The following table summarizes the activity of capitalized exploratory well costs for continuing operations for the years ended December 31:
in millions 2017 2016 2015Balance — Beginning of Year $ 56 $ 76 $ 141Additions to capitalized exploratory well costs pending the determination of proved reserves 201 29 88Reclassifications to property, plant and equipment based on the determination of proved reserves (128) (28) (78)Capitalized exploratory well costs charged to expense (21) (21) (75)Balance — End of Year $ 108 $ 56 $ 76

46
Occidental expenses annual lease rentals, the costs of injectants used in production and geological, geophysical and seismic costs as incurred.
Occidental determines depreciation and depletion of oil and gas producing properties by the unit-of-production method. It amortizes leasehold costs over total proved reserves, and capitalized development and successful exploration costs over proved developed reserves.
Proved oil and gas reserves are those quantities of oil and gas which, by analysis of geoscience and engineering data, can be estimated with reasonable certainty to be economically producible—from a given date forward, from known reservoirs, and under existing economic conditions, operating methods, and government regulations—prior to the time at which contracts providing the right to operate expire, unless evidence indicates that renewal is reasonably certain, regardless of whether deterministic or probabilistic methods are used for the estimation. Occidental has no proved oil and gas reserves for which the determination of economic producibility is subject to the completion of major additional capital expenditures.
Occidental performs impairment tests with respect to its proved properties whenever events or circumstances indicate that the carrying value of property may not be recoverable. If there is an indication the carrying amount of the asset may not be recovered due to declines in current and forward prices, significant changes in reserve estimates, changes in management's plans, or other significant events, management will evaluate the property for impairment. Under the successful efforts method, if the sum of the undiscounted cash flows is less than the carrying value of the proved property, the carrying value is reduced to estimated fair value and reported as an impairment charge in the period. Individual proved properties are grouped for impairment purposes at the lowest level for which there are identifiable cash flows. The fair value of impaired assets is typically determined based on the present value of expected future cash flows using discount rates believed to be consistent with those used by market participants. The impairment test incorporates a number of assumptions involving expectations of future cash flows which can change significantly over time. These assumptions include estimates of future product prices, contractual prices, estimates of risk-adjusted oil and gas reserves and estimates of future operating and development costs. See Note 15 and below for further discussion of asset impairments.
A portion of the carrying value of Occidental’s oil and gas properties is attributable to unproved properties. Net capitalized costs attributable to unproved properties were $1.0 billion and $1.4 billion at December 31, 2017, and 2016, respectively. The unproved amounts are not subject to DD&A until they are classified as proved properties. Capitalized costs attributable to the properties become subject to DD&A when proved reserves are assigned to the property. If the exploration efforts are unsuccessful, or management decides not to pursue development of these properties as a result of lower commodity prices, higher development and operating costs, contractual conditions or other factors, the capitalized costs of the related properties would be expensed. The timing of any writedowns of these unproved properties, if warranted, depends upon management's plans, the nature, timing and extent of future exploration and development activities and their results.
ChemicalOccidental’s chemical assets are depreciated using either the unit-of-production or the straight-line method, based upon
the estimated useful lives of the facilities. The estimated useful lives of Occidental’s chemical assets, which range from threeyears to fifty years, are also used for impairment tests. The estimated useful lives for the chemical facilities are based on the assumption that Occidental will provide an appropriate level of annual expenditures to ensure productive capacity is sustained. Such expenditures consist of ongoing routine repairs and maintenance, as well as planned major maintenance activities (PMMA). Ongoing routine repairs and maintenance expenditures are expensed as incurred. PMMA costs are capitalized and amortized over the period until the next planned overhaul. Additionally, Occidental incurs capital expenditures that extend the remaining useful lives of existing assets, increase their capacity or operating efficiency beyond the original specification or add value through modification for a different use. These capital expenditures are not considered in the initial determination of the useful lives of these assets at the time they are placed into service. The resulting revision, if any, of the asset’s estimated useful life is measured and accounted for prospectively.
Without these continued expenditures, the useful lives of these assets could decrease significantly. Other factors that could change the estimated useful lives of Occidental’s chemical assets include sustained higher or lower product prices, which are particularly affected by both domestic and foreign competition, demand, feedstock costs, energy prices, environmental regulations and technological changes.
Occidental performs impairment tests on its chemical assets whenever events or changes in circumstances lead to a reduction in the estimated useful lives or estimated future cash flows that would indicate that the carrying amount may not be recoverable, or when management’s plans change with respect to those assets. Any impairment loss would be calculated as the excess of the asset’s net book value over its estimated fair value.
Midstream and MarketingOccidental’s midstream and marketing PP&E is depreciated over the estimated useful lives of the assets, using either
the unit-of-production or straight-line method.Occidental performs impairment tests on its midstream and marketing assets whenever events or changes in
circumstances lead to a reduction in the estimated useful lives or estimated future cash flows that would indicate that the carrying amount may not be recoverable, or when management’s plans change with respect to those assets. Any impairment loss would be calculated as the excess of the asset’s net book value over its estimated fair value.

47
IMPAIRMENTS AND RELATED ITEMSIn 2017, Occidental recorded net impairment and related charges of $397 million related to proved and unproved non-
core Permian acreage and $120 million related to idled midstream and marketing facilities. In 2016, Occidental recorded net impairment and related charges of $61 million related to the sale of Libya and exit from
Iraq and the termination of crude oil supply contracts at a cost of $160 million. The corporate amount included an allowance for doubtful accounts. The allowance for doubtful accounts recorded during 2016 includes a reserve against the long-term receivable related to environmental sites indemnified by Maxus described in Note 8. Occidental recorded a reserve against this receivable due to the uncertainty of collection as a result of the Maxus bankruptcy.
In 2015, Occidental recorded impairment and related charges on oil and gas assets due to the decline in oil and gas prices, the decision to sell or exit non-core assets and changes in development plans for its non-producing assets. In November 2015, Occidental sold its Williston Basin assets in North Dakota and in December 2015, Occidental entered into an agreement to sell its Piceance Basin operations in Colorado. In Iraq, Occidental issued a notice of withdrawal and reassigned its interest in the Zubair Field in accordance with the contract terms. In Bahrain, Occidental issued a notice of withdrawal, reassigning its interest, and completed the exit in 2016. In Yemen, Occidental’s non-operated interest in Block 10 East Shabwa Field expired in December 2015, and in February 2016, Occidental sold its interests in Block S-1, An Nagyah Field.
In 2015, the midstream and marketing segment recorded an impairment charge for the Century gas processing plant as a result of our partner's inability to provide volumes to the plant and meet its contractual obligations to deliver CO2.
For the years ended December 31, (in millions) 2017 2016 2015OIL AND GASUnited States
Impairments and related charges of exiting operations $ — $ (44) $ 1,862 (a)
Impairments related to decline in commodity prices and changes in future development plans 397 15 1,428Rig termination charges — — 192Other asset impairment related charges — 5 204
Latin AmericaImpairments related to decline in commodity prices and other 4 9 559
Middle East and North AfricaImpairments of exiting operations — 61 1,658Impairments related to decline in commodity prices — — 2,833
CHEMICALImpairments of assets — — 121
MIDSTREAM AND MARKETINGCentury gas processing plant — — 814Other asset impairment related charges 120 160 216
CORPORATEOther-than-temporary impairment of investment in California Resources — 78 227Severance, spin-off and allowance for doubtful accounts — 541 125
$ 521 $ 825 $ 10,239(a) A portion of the 2015 charges are reported in the Midstream and Marketing segment.
It is reasonably possible that prolonged declines in commodity prices, reduced capital spending in response to lower prices or increases in operating costs could result in additional impairments.
FAIR VALUE MEASUREMENTSOccidental has categorized its assets and liabilities that are measured at fair value in a three-level fair value hierarchy,
based on the inputs to the valuation techniques: Level 1 – using quoted prices in active markets for the assets or liabilities; Level 2 – using observable inputs other than quoted prices for the assets or liabilities; and Level 3 – using unobservable inputs. Transfers between levels, if any, are reported at the end of each reporting period.
Fair Values - RecurringOccidental primarily applies the market approach for recurring fair value measurements, maximizes its use of observable
inputs and minimizes its use of unobservable inputs. Occidental utilizes the mid-point between bid and ask prices for valuing the majority of its assets and liabilities measured and reported at fair value. In addition to using market data, Occidental makes
48
assumptions in valuing its assets and liabilities, including assumptions about the risks inherent in the inputs to the valuation technique. For assets and liabilities carried at fair value, Occidental measures fair value using the following methods:
Occidental values exchange-cleared commodity derivatives using closing prices provided by the exchange as of the balance sheet date. These derivatives are classified as Level 1.
Over-the-Counter (OTC) bilateral financial commodity contracts, foreign exchange contracts, options and physical commodity forward purchase and sale contracts are generally classified as Level 2 and are generally valued using quotations provided by brokers or industry-standard models that consider various inputs, including quoted forward prices for commodities, time value, volatility factors, credit risk and current market and contractual prices for the underlying instruments, as well as other relevant economic measures. Substantially all of these inputs are observable in the marketplace throughout the full term of the instrument, and can be derived from observable data or are supported by observable prices at which transactions are executed in the marketplace.
Occidental values commodity derivatives based on a market approach that considers various assumptions, including quoted forward commodity prices and market yield curves. The assumptions used include inputs that are generally unobservable in the marketplace, or are observable but have been adjusted based upon various assumptions and the fair value is designated as Level 3 within the valuation hierarchy.
Occidental generally uses an income approach to measure fair value when there is not a market-observable price for an identical or similar asset or liability. This approach utilizes management's judgments regarding expectations of projected cash flows, and discounts those cash flows using a risk-adjusted discount rate.
ACCRUED LIABILITIES—CURRENT Accrued liabilities include accrued payroll, commissions and related expenses of $412 million and $341 million at
December 31, 2017, and 2016, respectively.
ENVIRONMENTAL LIABILITIES AND EXPENDITURESEnvironmental expenditures that relate to current operations are expensed or capitalized as appropriate. Occidental
records environmental reserves and related charges and expenses for estimated remediation costs that relate to existing conditions from past operations when environmental remediation efforts are probable and the costs can be reasonably estimated. In determining the reserves and the range of reasonably possible additional losses, Occidental refers to currently available information, including relevant past experience, remedial objectives, available technologies, applicable laws and regulations and cost-sharing arrangements. Occidental bases environmental reserves on management’s estimate of the most likely cost to be incurred, using the most cost-effective technology reasonably expected to achieve the remedial objective. Occidental periodically reviews reserves and adjusts them as new information becomes available. Occidental records environmental reserves on a discounted basis when it deems the aggregate amount and timing of cash payments to be reliably determinable at the time the reserves are established. The reserve methodology with respect to discounting for a specific site is not modified once it is established. Presently none of the environmental reserves are recorded on a discounted basis. Occidental generally records reimbursements or recoveries of environmental remediation costs in income when received, or when receipt of recovery is highly probable.
Many factors could affect Occidental's future remediation costs and result in adjustments to its environmental reserves and range of reasonably possible additional losses. The most significant are: (1) cost estimates for remedial activities may be inaccurate; (2) the length of time, type or amount of remediation necessary to achieve the remedial objective may change due to factors such as site conditions, the ability to identify and control contaminant sources or the discovery of additional contamination; (3) a regulatory agency may ultimately reject or modify Occidental’s proposed remedial plan; (4) improved or alternative remediation technologies may change remediation costs; (5) laws and regulations may change remediation requirements or affect cost sharing or allocation of liability; and (6) changes in allocation or cost-sharing arrangements may occur.
Certain sites involve multiple parties with various cost-sharing arrangements, which fall into the following three categories: (1) environmental proceedings that result in a negotiated or prescribed allocation of remediation costs among Occidental and other alleged potentially responsible parties; (2) oil and gas ventures in which each participant pays its proportionate share of remediation costs reflecting its working interest; or (3) contractual arrangements, typically relating to purchases and sales of properties, in which the parties to the transaction agree to methods of allocating remediation costs. In these circumstances, Occidental evaluates the financial viability of the other parties with whom it is alleged to be jointly liable, the degree of their commitment to participate and the consequences to Occidental of their failure to participate when estimating Occidental's ultimate share of liability. Occidental records reserves at its expected net cost of remedial activities and, based on these factors, believes that it will not be required to assume a share of liability of such other potentially responsible parties in an amount materially above amounts reserved.
In addition to the costs of investigations and cleanup measures, which often take in excess of 10 years at Comprehensive Environmental Response, Compensation, and Liability Act (CERCLA) National Priorities List (NPL) sites, Occidental's reserves include management's estimates of the costs to operate and maintain remedial systems. If remedial systems are modified over time in response to significant changes in site-specific data, laws, regulations, technologies or engineering estimates, Occidental reviews and adjusts its reserves accordingly.

49
ASSET RETIREMENT OBLIGATIONSOccidental recognizes the fair value of asset retirement obligations in the period in which a determination is made that a
legal obligation exists to dismantle an asset and reclaim or remediate the property at the end of its useful life and the cost of the obligation can be reasonably estimated. The liability amounts are based on future retirement cost estimates and incorporate many assumptions such as time to abandonment, technological changes, future inflation rates and the risk-adjusted discount rate. When the liability is initially recorded, Occidental capitalizes the cost by increasing the related PP&E balances. If the estimated future cost of the asset retirement obligations changes, Occidental records an adjustment to both the asset retirement obligations and PP&E. Over time, the liability is increased and expense is recognized for accretion, and the capitalized cost is depreciated over the useful life of the asset.
At a certain number of its facilities, Occidental has identified conditional asset retirement obligations that are related mainly to plant decommissioning. Occidental does not know or cannot estimate when it may settle these obligations. Therefore, Occidental cannot reasonably estimate the fair value of these liabilities. Occidental will recognize these conditional asset retirement obligations in the periods in which sufficient information becomes available to reasonably estimate their fair values.
The following table summarizes the activity of the asset retirement obligations, of which $1.2 billion is included in deferred credits and other liabilities - asset retirement obligations, with the remaining current portion in accrued liabilities at both December 31, 2017, and 2016.
For the years ended December 31, (in millions) 2017 2016Beginning balance $ 1,369 $ 1,124Liabilities incurred – capitalized to PP&E 46 46Liabilities settled and paid (39) (38)Accretion expense 67 59Acquisitions, dispositions and other – changes in PP&E (136) 11Revisions to estimated cash flows – changes in PP&E 5 167Ending balance $ 1,312 $ 1,369
DERIVATIVE INSTRUMENTSDerivatives are carried at fair value and on a net basis when a legal right of offset exists with the same counterparty.
Occidental applies hedge accounting when transactions meet specified criteria for cash-flow hedge treatment and management elects and documents such treatment. Otherwise, any fair value gains or losses are recognized in earnings in the current period. For cash-flow hedges, the gain or loss on the effective portion of the derivative is reported as a component of other comprehensive income (OCI) with an offsetting adjustment to the basis of the item being hedged. Realized gains or losses from cash-flow hedges, and any ineffective portion, are recorded as a component of net sales in the consolidated statements of operations. Ineffectiveness is primarily created by a lack of correlation between the hedged item and the hedging instrument due to location, quality, grade or changes in the expected quantity of the hedged item. Gains and losses from derivative instruments are reported net in the consolidated statements of operations. There were no fair value hedges as of and during the years ended December 31, 2017, 2016 and 2015.
A hedge is regarded as highly effective such that it qualifies for hedge accounting if, at inception and throughout its life, it is expected that changes in the fair value or cash flows of the hedged item will be offset by 80 to 125 percent of the changes in the fair value or cash flows, respectively, of the hedging instrument. In the case of hedging a forecast transaction, the transaction must be probable and must present an exposure to variations in cash flows that could ultimately affect reported net income or loss. Occidental discontinues hedge accounting when it determines that a derivative has ceased to be highly effective as a hedge; when the hedged item matures or is sold or repaid; or when a forecasted transaction is no longer deemed probable.
STOCK-BASED INCENTIVE PLANSOccidental has established several stockholder-approved stock-based incentive plans for certain employees and directors
(Plans) that are more fully described in Note 12. A summary of Occidental’s accounting policy for awards issued under the Plans is as follows.
For cash- and stock-settled restricted stock units or incentive award shares (RSU) and capital employed incentive awards and return on assets (ROCEI/ROAI), compensation value is initially measured on the grant date using the quoted market price of Occidental’s common stock and the estimated payout at the grant date. For total shareholder return incentives (TSRIs), compensation value is initially measured on the grant date using estimated payout levels derived from a Monte Carlo valuation model. Compensation expense for RSUs, ROCEI/ROAI and TSRIs is recognized on a straight-line basis over the requisite service periods, which is generally over the awards’ respective vesting or performance periods. Compensation expense for the dividends accrued on unvested awards is adjusted quarterly for any changes in stock price and the number of share equivalents expected to be paid based on the relevant performance and market criteria, if applicable. All such performance or stock-price-related changes are recognized in periodic compensation expense. The stock-settled portion of these awards is expensed using the initially measured compensation value.

50
EARNINGS PER SHAREOccidental's instruments containing rights to nonforfeitable dividends granted in stock-based awards are considered
participating securities prior to vesting and, therefore, have been deducted from earnings in computing basic and diluted EPS under the two-class method.
Basic EPS was computed by dividing net income attributable to common stock, net of income allocated to participating securities, by the weighted-average number of common shares outstanding during each period, net of treasury shares and including vested but unissued shares and share units. The computation of diluted EPS reflects the additional dilutive effect of stock options and unvested stock awards.
RETIREMENT AND POSTRETIREMENT BENEFIT PLANSOccidental recognizes the overfunded or underfunded amounts of its defined benefit pension and postretirement plans,
which are more fully described in Note 13, in its financial statements using a December 31 measurement date.Occidental determines its defined benefit pension and postretirement benefit plan obligations based on various
assumptions and discount rates. The discount rate assumptions used are meant to reflect the interest rate at which the obligations could effectively be settled on the measurement date. Occidental estimates the rate of return on assets with regard to current market factors but within the context of historical returns. Occidental funds and expenses negotiated pension increases for domestic union employees over the terms of the applicable collective bargaining agreements.
Pension and any postretirement plan assets are measured at fair value. Common stock, preferred stock, publicly registered mutual funds, U.S. government securities and corporate bonds are valued using quoted market prices in active markets when available. When quoted market prices are not available, these investments are valued using pricing models with observable inputs from both active and non-active markets. Common and collective trusts are valued at the fund units' net asset value (NAV) provided by the issuer, which represents the quoted price in a non-active market. Short-term investment funds are valued at the fund units' NAV provided by the issuer.
SUPPLEMENTAL CASH FLOW INFORMATIONOccidental paid United States federal, state and foreign income taxes for continuing operations of approximately $0.8
billion, $0.6 billion and $1 billion during the years ended December 31, 2017, 2016 and 2015, respectively. Occidental received refunds of $0.8 billion and $0.3 billion during the years ended December 31, 2017, and 2016, respectively. Occidental also paid production, property and other taxes of approximately $375 million, $345 million and $445 million during the years ended December 31, 2017, 2016 and 2015, respectively, substantially all of which was in the United States. Interest paid totaled $351 million, $312 million and $246 million, net of capitalized interest of $52 million, $64 million and $138 million, for the years 2017, 2016 and 2015, respectively.
FOREIGN CURRENCY TRANSACTIONS The functional currency applicable to all of Occidental’s foreign oil and gas operations is the U.S. dollar since cash flows
are denominated principally in U.S. dollars. In Occidental's other operations, Occidental's use of non-United States dollar functional currencies was not material for all years presented. The effect of exchange rates on transactions in foreign currencies is included in periodic income. Occidental reports the exchange rate differences arising from translating foreign-currency-denominated balance sheet accounts to the United States dollar as of the reporting date in other comprehensive income. Exchange-rate gains and losses for continuing operations were not material for all years presented.
NOTE 2 ACQUISITIONS, DISPOSITIONS AND OTHER TRANSACTIONS
2017In the third quarter of 2017, Occidental closed on two divestitures of non-core acreage in the Permian Basin for proceeds
of approximately $0.6 billion, resulting in a pre-tax gain of approximately $81 million. Concurrently, Occidental purchased additional ownership interests and assumed operatorship in CO2 enhanced oil recovery (EOR) properties located in the Seminole-San Andres Unit for approximately $0.6 billion, which was primarily allocated to proved property. In the fourth quarter of 2017, Occidental sold other non-core proved and unproved acreage in the Permian Basin for approximately $90 million, resulting in a pre-tax gain of approximately $55 million. Occidental also classified approximately $0.5 billion in non-core proved and unproved Permian acreage to assets held for sale at December 31, 2017.
In April 2017, Occidental completed the sale of its South Texas operations for net proceeds of $0.5 billion resulting in pre-tax gain of $0.5 billion.
2016In 2016, Occidental completed its exit of non-core operations in Bahrain, Iraq, Libya and Yemen. In November 2016, Occidental issued $1.5 billion of senior notes, comprised of $750 million of 3.0-percent senior notes
due 2027 and $750 million of 4.1-percent senior notes due 2047. Occidental received net proceeds of $1.49 billion. Interest

51
on the senior notes is payable semi-annually in arrears in February and August each year for each series of senior notes beginning August 15, 2017. Occidental used the proceeds for general corporate purposes.
In October 2016, Occidental acquired producing and non-producing leasehold acreage in the Permian Basin. This acquisition included 35,000 net acres in Reeves and Pecos counties, Texas in the Southern Delaware Basin, in areas where Occidental currently operates or has working interests. Separately, Occidental also acquired working interests in several producing oil and gas CO2 floods and related EOR infrastructure, increasing Occidental's ownership in several properties where it is currently the operator or an existing working interest partner. The total purchase price for these transactions was approximately $2.0 billion which was allocated between unproved and proved property.
In September 2016, Occidental completed the sale of its South Texas Eagle Ford non-operated properties for $63 million resulting in a pre-tax gain of $59 million.
In August 2016, Occidental terminated crude oil supply contracts at a cost of $160 million. In the second quarter of 2016, Occidental received $330 million as final payment from the settlement with the Republic of
Ecuador. In January 2016, Occidental reached an understanding on the terms of payment for the approximate $1.0 billion payable to Occidental by the Republic of Ecuador under a November 2015 International Center for Settlement of Investment Disputes arbitration award. This award relates to Ecuador's 2006 expropriation of Occidental's Participation Contract for Block 15. Occidental recorded a pre-tax gain of $681 million in 2016. The results related to Ecuador were presented as discontinued operations.
In May and June 2016, respectively, Occidental utilized part of the proceeds from the April 2016 senior notes offering (described below) to exercise the early redemption option on $1.25 billion of 1.75-percent senior notes due in the first quarter of 2017 and to retire all $750 million of 4.125-percent senior notes that matured in June 2016.
In April 2016, Occidental issued $2.75 billion of senior notes, comprised of $0.4 billion of 2.6-percent senior notes due 2022, $1.15 billion of 3.4-percent senior notes due 2026 and $1.2 billion of 4.4-percent senior notes due 2046. Occidental received net proceeds of approximately $2.72 billion. Interest on the senior notes is payable semi-annually in arrears in April and October of each year for each series of senior notes, beginning on October 15, 2016. Occidental used a portion of the proceeds to retire debt in May and June 2016, and used the remaining proceeds for general corporate purposes.
In March 2016, Occidental distributed its remaining shares of California Resources Corporation (California Resources) through a special stock dividend to stockholders of record as of February 29, 2016. Upon distribution, Occidental recorded a $78 million loss to reduce the investment to its fair market value, and Occidental no longer owns any shares of California Resources common stock.
In March 2016, Occidental completed the sale of its Piceance Basin operations in Colorado for $153 million resulting in a pre-tax gain of $121 million. The assets and liabilities related to these operations were presented as held for sale at December 31, 2015, and primarily included property, plant and equipment and current accrued liabilities and asset retirement obligations.
In February 2016, Occidental repaid $700 million of 2.5-percent senior notes that matured.In January 2016, Occidental completed the sale of its Occidental Tower building in Dallas, Texas, for net proceeds of
approximately $85 million, resulting in a pre-tax gain of $57 million. The building was classified as held for sale as of December 31, 2015.
2015In January 2016, Occidental reached an understanding on the terms of payment for the approximate $1.0 billion payable
to Occidental by the Republic of Ecuador under a November 2015 International Center for the Settlement of Investment Disputes arbitration award. This award relates to Ecuador's 2006 expropriation of Occidental's Participation Contract for Block 15. As of December 31, 2015, Occidental recorded a pre-tax gain of $322 million. The result of this settlement with Ecuador has been presented as discontinued operations.
In December 2015, Occidental entered a sales agreement to sell its Piceance Basin operations in Colorado for approximately $155 million. The transaction was completed in March 2016. As a result of exiting the Piceance Basin operations Occidental recorded certain contractual liabilities which are included in deferred credits and other liabilities - other on the consolidated balance sheet. The assets and liabilities related to these operations are presented as held for sale at December 31, 2015 and primarily included property, plant and equipment and current accrued liabilities and asset retirement obligations.
In November 2015, Occidental sold its Williston Basin assets in North Dakota for approximately $590 million.In October 2015, Occidental completed the sale of its Westwood building in Los Angeles, California for net proceeds of
$65 million. In June 2015, Occidental issued $1.5 billion of debt that was comprised of $750 million of 3.50-percent senior unsecured
notes due 2025 and $750 million of 4.625-percent senior unsecured notes due 2045. Occidental received net proceeds of approximately $1.48 billion. Interest on the notes is payable semi-annually in arrears in June and December of each year for both series of notes, beginning on December 15, 2015.

52
NOTE 3 ACCOUNTING AND DISCLOSURE CHANGES
RECENTLY ADOPTED ACCOUNTING AND DISCLOSURE CHANGES
In August 2017, the Financial Accounting Standards Board ("FASB") released targeted improvements to hedge accounting standards that will expand hedge accounting for nonfinancial and financial risk components and amend measurement methodologies to more closely align hedge accounting with a company's risk management activities. These rules also decrease the cost and complexity of hedge accounting. The new rules are effective for fiscal years beginning after December 15, 2018. Occidental is currently evaluating the effect of the new rules on its hedges.
In March 2017, FASB issued guidance related to presentation of net periodic pension cost and net periodic postretirement benefit cost. The rules become effective for annual periods beginning after December 15, 2017. These rules are not expected to have a material impact to Occidental's financial statements upon adoption.
In January 2017, the FASB issued new guidance clarifying the definition of a business under the topic Business Combinations. The new rules are effective for fiscal years beginning after December 15, 2017, and are not expected to have a material change on Occidental's financial statements upon adoption.
In November 2016, FASB issued new guidance related to the cash flow classification and presentation of the changes in restricted cash on the statement of cash flows. The rules become effective for the interim and annual periods beginning after December 15, 2017 and must be applied retrospectively. Occidental did not have restricted cash as of December 31, 2017 or 2016.
In October 2016, the FASB issued new guidance related to the income tax consequences of intra-entity transfers of assets other than inventory. The rules become effective for the interim and annual periods beginning after December 15, 2017. The rules do not have a material impact on Occidental's financial statements upon adoption.
In August 2016, the FASB issued new guidance related to the classification of certain cash receipts and payments on the statement of cash flows. The rules become effective for the interim and annual periods beginning after December 15, 2017. The rules will be adopted for the first quarter of 2018 and will result in the retrospective reclassification of certain cash receipts and payments within the Statement of Cash Flows.
In 2016, the FASB issued rules clarifying several aspects of the new revenue recognition standard Topic 606 - Revenue from Contracts with Customers, previously issued in May 2014. Under the new standard, an entity will recognize revenue when it transfers promised goods or services to customers in an amount that reflects what it expects to receive in exchange for the goods and services. The new standard also requires more detailed disclosures related to the nature, amount, timing and uncertainty of revenue and cash flows arising from contracts with customers. Occidental will adopt the standard using the modified retrospective approach and recognize a cumulative effect adjustment to Retained Earnings as of January 1, 2018. The cumulative-effect adjustment to retained earnings upon adoption is not material. Occidental stratified all revenue streams within each operating segment and compiled an inventory of all contracts from which a sample of customer contracts was reviewed to assess the required accounting under the new standard The review consisted of identifying whether such contracts are in scope of the new standard; whether there will be material changes in the timing or amount of revenue recognized from our historical accounting policies and practices; whether processes and controls are in place to evaluate new contracts for revenue recognition and to assemble any additional required disclosures. Occidental has reviewed and considered interpretations and published guidelines from The Entities with Oil and Gas Producing Activities Revenue Recognition Task Force of the American Institute of Certified Public Accountants and certain public accounting firms, respectively. Occidental has completed its review of the sample contracts and does not expect any material change to the pattern or timing of revenue recognition and earnings as a result of adopting the new standard. Additionally, Occidental has assessed the disclosure requirements under the new standard and anticipates disclosing additional information, as necessary, to supplement the historical disaggregated revenue disclosures, including qualitative disclosures regarding the nature of its customer contracts and performance obligations. Occidental is coordinating the data collection needs to meet those disclosure requirements. Occidental continues to conduct training for accounting staff on the new standard.
In February 2016, the FASB issued rules which require Occidental to recognize most leases, including operating leases, on the balance sheet. The new rules require lessees to recognize a right-of-use asset and lease liability for all leases with lease terms of more than 12 months. The lease liability represents the discounted obligation to make future minimum lease payments. The corresponding right-of-use asset includes the discounted obligation in addition to any upfront payment or cost incurred during contract execution of the lease. The guidance retains the current accounting for lessors and does not make significant changes to the recognition, measurement and presentation of expenses and cash flows by a lessee. Recognition, measurement and presentation of expenses and cash flows arising from a lease will depend on classification as a finance or operating lease. Occidental is the lessee under various agreements for real estate, equipment, plants and facilities, aircraft, information technology hardware and vehicles that are currently accounted for as operating leases, refer to Note 6. As a result, these new rules will increase reported assets and liabilities. Occidental will not be an early adopter of this standard. Occidental will apply the revised lease rules for its interim and annual reporting periods starting January 1, 2019, using a modified retrospective approach, including several optional practical expedients related to leases commenced before the effective date. Occidental is currently evaluating the effect of these rules on its financial statements, training accounting staff and developing an internal interim software solution for the identification, documentation and tracking of leases in order to create an adoption plan based on Occidental's population of leases under the revised definition of leases. The quantitative impacts of the new standard are
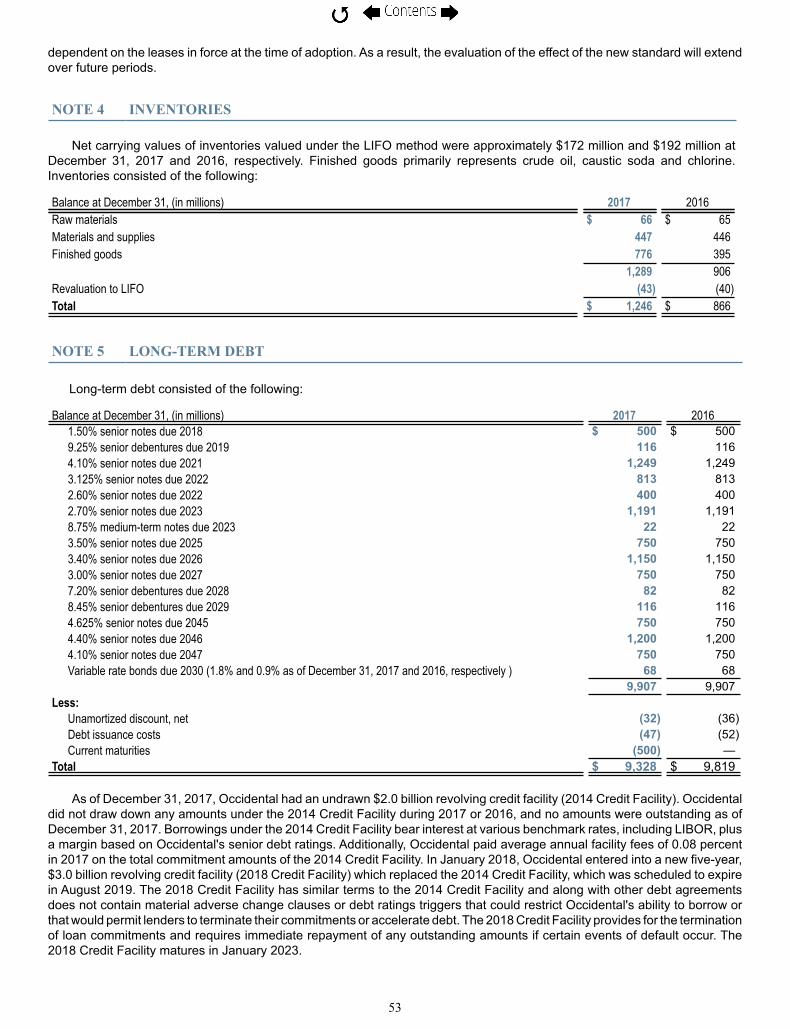
53
dependent on the leases in force at the time of adoption. As a result, the evaluation of the effect of the new standard will extend over future periods.
NOTE 4 INVENTORIES
Net carrying values of inventories valued under the LIFO method were approximately $172 million and $192 million at December 31, 2017 and 2016, respectively. Finished goods primarily represents crude oil, caustic soda and chlorine. Inventories consisted of the following:
Balance at December 31, (in millions) 2017 2016Raw materials $ 66 $ 65Materials and supplies 447 446Finished goods 776 395 1,289 906Revaluation to LIFO (43) (40)Total $ 1,246 $ 866
NOTE 5 LONG-TERM DEBT
Long-term debt consisted of the following:
Balance at December 31, (in millions) 2017 20161.50% senior notes due 2018 $ 500 $ 5009.25% senior debentures due 2019 116 1164.10% senior notes due 2021 1,249 1,2493.125% senior notes due 2022 813 8132.60% senior notes due 2022 400 4002.70% senior notes due 2023 1,191 1,1918.75% medium-term notes due 2023 22 223.50% senior notes due 2025 750 7503.40% senior notes due 2026 1,150 1,1503.00% senior notes due 2027 750 7507.20% senior debentures due 2028 82 828.45% senior debentures due 2029 116 1164.625% senior notes due 2045 750 7504.40% senior notes due 2046 1,200 1,2004.10% senior notes due 2047 750 750Variable rate bonds due 2030 (1.8% and 0.9% as of December 31, 2017 and 2016, respectively ) 68 68
9,907 9,907Less:
Unamortized discount, net (32) (36)Debt issuance costs (47) (52)Current maturities (500) —
Total $ 9,328 $ 9,819
As of December 31, 2017, Occidental had an undrawn $2.0 billion revolving credit facility (2014 Credit Facility). Occidental did not draw down any amounts under the 2014 Credit Facility during 2017 or 2016, and no amounts were outstanding as of December 31, 2017. Borrowings under the 2014 Credit Facility bear interest at various benchmark rates, including LIBOR, plus a margin based on Occidental's senior debt ratings. Additionally, Occidental paid average annual facility fees of 0.08 percent in 2017 on the total commitment amounts of the 2014 Credit Facility. In January 2018, Occidental entered into a new five-year, $3.0 billion revolving credit facility (2018 Credit Facility) which replaced the 2014 Credit Facility, which was scheduled to expire in August 2019. The 2018 Credit Facility has similar terms to the 2014 Credit Facility and along with other debt agreements does not contain material adverse change clauses or debt ratings triggers that could restrict Occidental's ability to borrow or that would permit lenders to terminate their commitments or accelerate debt. The 2018 Credit Facility provides for the termination of loan commitments and requires immediate repayment of any outstanding amounts if certain events of default occur. The 2018 Credit Facility matures in January 2023.
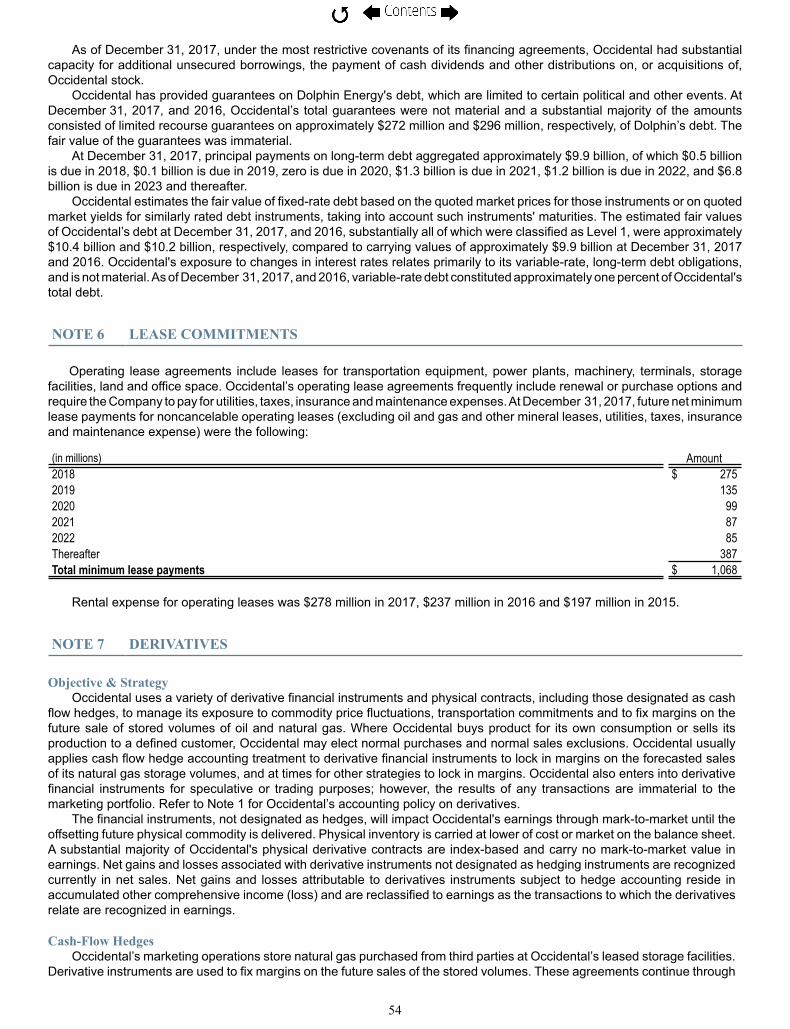
54
As of December 31, 2017, under the most restrictive covenants of its financing agreements, Occidental had substantial capacity for additional unsecured borrowings, the payment of cash dividends and other distributions on, or acquisitions of, Occidental stock.
Occidental has provided guarantees on Dolphin Energy's debt, which are limited to certain political and other events. At December 31, 2017, and 2016, Occidental’s total guarantees were not material and a substantial majority of the amounts consisted of limited recourse guarantees on approximately $272 million and $296 million, respectively, of Dolphin’s debt. The fair value of the guarantees was immaterial.
At December 31, 2017, principal payments on long-term debt aggregated approximately $9.9 billion, of which $0.5 billion is due in 2018, $0.1 billion is due in 2019, zero is due in 2020, $1.3 billion is due in 2021, $1.2 billion is due in 2022, and $6.8 billion is due in 2023 and thereafter.
Occidental estimates the fair value of fixed-rate debt based on the quoted market prices for those instruments or on quoted market yields for similarly rated debt instruments, taking into account such instruments' maturities. The estimated fair values of Occidental’s debt at December 31, 2017, and 2016, substantially all of which were classified as Level 1, were approximately $10.4 billion and $10.2 billion, respectively, compared to carrying values of approximately $9.9 billion at December 31, 2017 and 2016. Occidental's exposure to changes in interest rates relates primarily to its variable-rate, long-term debt obligations, and is not material. As of December 31, 2017, and 2016, variable-rate debt constituted approximately one percent of Occidental's total debt.
NOTE 6 LEASE COMMITMENTS
Operating lease agreements include leases for transportation equipment, power plants, machinery, terminals, storage facilities, land and office space. Occidental’s operating lease agreements frequently include renewal or purchase options and require the Company to pay for utilities, taxes, insurance and maintenance expenses. At December 31, 2017, future net minimum lease payments for noncancelable operating leases (excluding oil and gas and other mineral leases, utilities, taxes, insurance and maintenance expense) were the following:
(in millions) Amount2018 $ 2752019 1352020 992021 872022 85Thereafter 387Total minimum lease payments $ 1,068
Rental expense for operating leases was $278 million in 2017, $237 million in 2016 and $197 million in 2015.
NOTE 7 DERIVATIVES
Objective & StrategyOccidental uses a variety of derivative financial instruments and physical contracts, including those designated as cash
flow hedges, to manage its exposure to commodity price fluctuations, transportation commitments and to fix margins on the future sale of stored volumes of oil and natural gas. Where Occidental buys product for its own consumption or sells its production to a defined customer, Occidental may elect normal purchases and normal sales exclusions. Occidental usually applies cash flow hedge accounting treatment to derivative financial instruments to lock in margins on the forecasted sales of its natural gas storage volumes, and at times for other strategies to lock in margins. Occidental also enters into derivative financial instruments for speculative or trading purposes; however, the results of any transactions are immaterial to the marketing portfolio. Refer to Note 1 for Occidental’s accounting policy on derivatives.
The financial instruments, not designated as hedges, will impact Occidental's earnings through mark-to-market until the offsetting future physical commodity is delivered. Physical inventory is carried at lower of cost or market on the balance sheet. A substantial majority of Occidental's physical derivative contracts are index-based and carry no mark-to-market value in earnings. Net gains and losses associated with derivative instruments not designated as hedging instruments are recognized currently in net sales. Net gains and losses attributable to derivatives instruments subject to hedge accounting reside in accumulated other comprehensive income (loss) and are reclassified to earnings as the transactions to which the derivatives relate are recognized in earnings.
Cash-Flow HedgesOccidental’s marketing operations store natural gas purchased from third parties at Occidental’s leased storage facilities.
Derivative instruments are used to fix margins on the future sales of the stored volumes. These agreements continue through

55
2017. As of December 31, 2017, and 2016, Occidental had approximately 7 billion cubic feet (Bcf) of natural gas held in storage, and had cash-flow hedges for the forecasted sales, to be settled by physical delivery, of approximately 7 Bcf of stored natural gas. The amount of cash-flow hedges, including the ineffective portion, was immaterial for the years ended December 31, 2017 and 2016.
Derivatives Not Designated as Hedging InstrumentsThe following table summarizes the amounts reported in net sales related to the outstanding commodity derivative
instruments not designated as hedging instruments as of December 31, 2017, and 2016:
As of December 31, (in millions, except Long/(Short) volumes) 2017 2016Unrealized gain (loss) on derivatives not designated as hedges
Oil commodity contracts $ (47) $ (5)Natural gas commodity contracts $ 1 $ 1
Outstanding net volumes on derivatives not designated as hedgesOil Commodity Contracts
Volume (MMBOE) 61 67Price Per Bbl $ 57.38 $ 53.86
Natural gas commodity contractsVolume (Bcf) (47) (12)Price Per MMBTU $ 2.73 $ 3.19
Fair Value of DerivativesOccidental has categorized its assets and liabilities that are measured at fair value in a three-level fair value hierarchy,
based on the inputs to the valuation techniques: Level 1 - using quoted prices in active markets for the assets or liabilities; Level 2 - using observable inputs other than quoted prices for the assets or liabilities; and Level 3 - using unobservable inputs. Transfers between levels, if any, are reported at the end of each reporting period. The following summarizes the fair value of the Company’s derivative assets and liabilities by input level within the fair-value hierarchy:
As of December 31, 2017 Fair Value Measurements UsingNetting (b) Total Fair
Value(in millions) Balance Sheet Location Level 1 Level 2 Level 3
Assets:Cash-flow hedges (a)
Commodity contracts Other current assets — 3 — — 3Derivatives not designated as hedging instruments (a)
Commodity contracts
Other current assets 485 227 — (517) 195Long-term receivables andother assets, net 1 2 — (1) 2
Liabilities:Derivatives not designated as hedging instruments (a)
Commodity contracts
Accrued liabilities 535 222 — (517) 240Deferred credits andliabilities 1 3 — (1) 3
(a) Fair values are presented at gross amounts, including when the derivatives are subject to netting arrangements and presented on a net basis in the consolidated balance sheets.
(b) These amounts do not include collateral. As of December 31, 2017, no collateral received has been netted against derivative assets and collateral paid of $54 million has been netted against derivative liabilities. Select clearinghouses and brokers require Occidental to post an initial margin deposit. Collateral, mainly for initial margin, of $53 million as of December 31, 2017, deposited by Occidental, has not been reflected in these derivative fair value tables. This collateral is included in other current assets in the consolidated balance sheets.

56
As of December 31, 2016 Fair Value Measurements UsingNetting (b) Total Fair
Value(in millions) Balance Sheet Location Level 1 Level 2 Level 3
Assets:Cash-flow hedges (a)
Commodity contracts
Other current assets — 1 — — 1Long-term receivables andother assets, net — — — — —
Derivatives not designated as hedging instruments (a)
Commodity contracts
Other current assets 166 57 — (196) 27Long-term receivables andother assets, net 2 3 — (2) 3
Liabilities:Cash-flow hedges (a)
Commodity contracts
Accrued liabilities — 6 — — 6Deferred credits andliabilities — — — — —
Derivatives not designated as hedging instruments (a)
Commodity contracts
Accrued liabilities 172 51 — (196) 27Deferred credits andliabilities 1 6 — (2) 5
(a) Fair values are presented at gross amounts, including when the derivatives are subject to netting arrangements and presented on a net basis in the consolidated balance sheets.
(b) These amounts do not include collateral. As of December 31, 2016, collateral received of $4 million has been netted against derivative assets and collateral paid of $13 million has been netted against derivative liabilities. Select clearinghouses and brokers require Occidental to post an initial margin deposit. Collateral, mainly for initial margin, of $25 million as of December 31, 2016, deposited by Occidental, has not been reflected in these derivative fair value tables. This collateral is included in other current assets in the consolidated balance sheets.
Credit RiskThe majority of Occidental's counterparty credit risk is related to the physical delivery of energy commodities to its
customers and their inability to meet their settlement commitments. Occidental manages credit risk by selecting counterparties that it believes to be financially strong, by entering into netting arrangements with counterparties and by requiring collateral or other credit risk mitigants, as appropriate. Occidental actively evaluates the creditworthiness of its counterparties, assigns appropriate credit limits, and monitors credit exposures against those assigned limits. Occidental also enters into future contracts through regulated exchanges with select clearinghouses and brokers, which are subject to minimal credit risk as a significant portion of these transactions settle on a daily margin basis.
Certain of Occidental's OTC derivative instruments contain credit-risk-contingent features, primarily tied to credit ratings for Occidental or its counterparties, which may affect the amount of collateral that each would need to post. Occidental believes that if it had received a one-notch reduction in its credit ratings, it would not have resulted in a material change in its collateral-posting requirements as of December 31, 2017, and 2016. The aggregate fair value of derivative instruments with credit-risk-related contingent features for which a net liability position existed was immaterial for both December 31, 2017, and December 31, 2016.
NOTE 8 ENVIRONMENTAL LIABILITIES AND EXPENDITURES
Occidental’s operations are subject to stringent federal, state, local and foreign laws and regulations related to improving or maintaining environmental quality.
The laws that require or address environmental remediation, including CERCLA and similar federal, state, local and foreign laws, may apply retroactively and regardless of fault, the legality of the original activities or the current ownership or control of sites. OPC or certain of its subsidiaries participate in or actively monitor a range of remedial activities and government or private proceedings under these laws with respect to alleged past practices at operating, closed and third-party sites. Remedial activities may include one or more of the following: investigation involving sampling, modeling, risk assessment or monitoring; cleanup measures including removal, treatment or disposal; or operation and maintenance of remedial systems. The environmental proceedings seek funding or performance of remediation and, in some cases, compensation for alleged property damage, punitive damages, civil penalties, injunctive relief and government oversight costs.
ENVIRONMENTAL REMEDIATIONAs of December 31, 2017, Occidental participated in or monitored remedial activities or proceedings at 148 sites. The
following table presents Occidental’s current and non-current environmental remediation reserves as of December 31, 2017, 2016 and 2015, the current portion of which is included in accrued liabilities ($137 million in 2017, $131 million in 2016, and
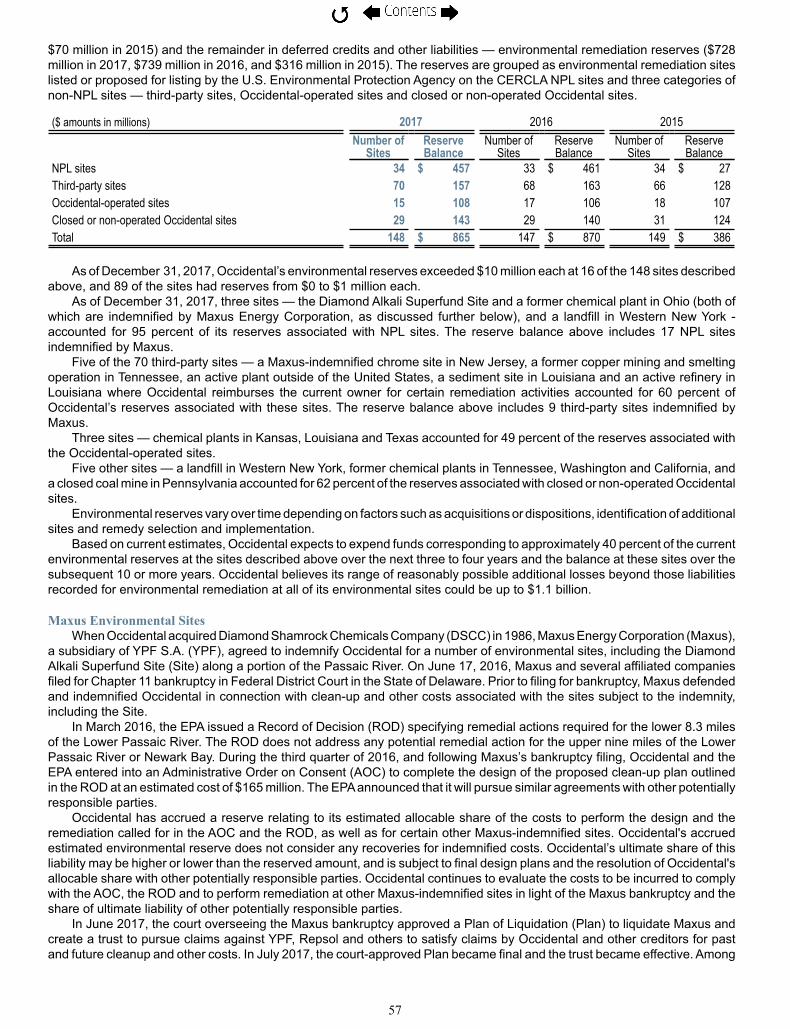
57
$70 million in 2015) and the remainder in deferred credits and other liabilities — environmental remediation reserves ($728 million in 2017, $739 million in 2016, and $316 million in 2015). The reserves are grouped as environmental remediation sites listed or proposed for listing by the U.S. Environmental Protection Agency on the CERCLA NPL sites and three categories of non-NPL sites — third-party sites, Occidental-operated sites and closed or non-operated Occidental sites.
($ amounts in millions) 2017 2016 2015Number of
SitesReserveBalance
Number ofSites
ReserveBalance
Number ofSites
ReserveBalance
NPL sites 34 $ 457 33 $ 461 34 $ 27Third-party sites 70 157 68 163 66 128Occidental-operated sites 15 108 17 106 18 107Closed or non-operated Occidental sites 29 143 29 140 31 124Total 148 $ 865 147 $ 870 149 $ 386
As of December 31, 2017, Occidental’s environmental reserves exceeded $10 million each at 16 of the 148 sites described above, and 89 of the sites had reserves from $0 to $1 million each.
As of December 31, 2017, three sites — the Diamond Alkali Superfund Site and a former chemical plant in Ohio (both of which are indemnified by Maxus Energy Corporation, as discussed further below), and a landfill in Western New York - accounted for 95 percent of its reserves associated with NPL sites. The reserve balance above includes 17 NPL sites indemnified by Maxus.
Five of the 70 third-party sites — a Maxus-indemnified chrome site in New Jersey, a former copper mining and smelting operation in Tennessee, an active plant outside of the United States, a sediment site in Louisiana and an active refinery in Louisiana where Occidental reimburses the current owner for certain remediation activities accounted for 60 percent of Occidental’s reserves associated with these sites. The reserve balance above includes 9 third-party sites indemnified by Maxus.
Three sites — chemical plants in Kansas, Louisiana and Texas accounted for 49 percent of the reserves associated with the Occidental-operated sites.
Five other sites — a landfill in Western New York, former chemical plants in Tennessee, Washington and California, and a closed coal mine in Pennsylvania accounted for 62 percent of the reserves associated with closed or non-operated Occidental sites.
Environmental reserves vary over time depending on factors such as acquisitions or dispositions, identification of additional sites and remedy selection and implementation.
Based on current estimates, Occidental expects to expend funds corresponding to approximately 40 percent of the current environmental reserves at the sites described above over the next three to four years and the balance at these sites over the subsequent 10 or more years. Occidental believes its range of reasonably possible additional losses beyond those liabilities recorded for environmental remediation at all of its environmental sites could be up to $1.1 billion.
Maxus Environmental SitesWhen Occidental acquired Diamond Shamrock Chemicals Company (DSCC) in 1986, Maxus Energy Corporation (Maxus),
a subsidiary of YPF S.A. (YPF), agreed to indemnify Occidental for a number of environmental sites, including the Diamond Alkali Superfund Site (Site) along a portion of the Passaic River. On June 17, 2016, Maxus and several affiliated companies filed for Chapter 11 bankruptcy in Federal District Court in the State of Delaware. Prior to filing for bankruptcy, Maxus defended and indemnified Occidental in connection with clean-up and other costs associated with the sites subject to the indemnity, including the Site.
In March 2016, the EPA issued a Record of Decision (ROD) specifying remedial actions required for the lower 8.3 miles of the Lower Passaic River. The ROD does not address any potential remedial action for the upper nine miles of the Lower Passaic River or Newark Bay. During the third quarter of 2016, and following Maxus’s bankruptcy filing, Occidental and the EPA entered into an Administrative Order on Consent (AOC) to complete the design of the proposed clean-up plan outlined in the ROD at an estimated cost of $165 million. The EPA announced that it will pursue similar agreements with other potentially responsible parties.
Occidental has accrued a reserve relating to its estimated allocable share of the costs to perform the design and the remediation called for in the AOC and the ROD, as well as for certain other Maxus-indemnified sites. Occidental's accrued estimated environmental reserve does not consider any recoveries for indemnified costs. Occidental’s ultimate share of this liability may be higher or lower than the reserved amount, and is subject to final design plans and the resolution of Occidental's allocable share with other potentially responsible parties. Occidental continues to evaluate the costs to be incurred to comply with the AOC, the ROD and to perform remediation at other Maxus-indemnified sites in light of the Maxus bankruptcy and the share of ultimate liability of other potentially responsible parties.
In June 2017, the court overseeing the Maxus bankruptcy approved a Plan of Liquidation (Plan) to liquidate Maxus and create a trust to pursue claims against YPF, Repsol and others to satisfy claims by Occidental and other creditors for past and future cleanup and other costs. In July 2017, the court-approved Plan became final and the trust became effective. Among

58
other responsibilities, the trust will pursue claims against YPF, Repsol and others and distribute assets to Maxus' creditors in accordance with the trust agreement and Plan.
ENVIRONMENTAL COSTSOccidental’s environmental costs, some of which include estimates, are presented below for each segment for each of the years
ended December 31:
(in millions) 2017 2016 2015Operating Expenses
Oil and Gas $ 68 $ 65 $ 93Chemical 78 75 74Midstream and Marketing 15 11 13
$ 161 $ 151 $ 180Capital Expenditures
Oil and Gas $ 77 $ 43 $ 122Chemical 18 25 41Midstream and Marketing 6 5 4
$ 101 $ 73 $ 167Remediation Expenses
Corporate $ 39 $ 61 $ 117
Operating expenses are incurred on a continual basis. Capital expenditures relate to longer-lived improvements in properties currently operated by Occidental. Remediation expenses relate to existing conditions from past operations.
NOTE 9 LAWSUITS, CLAIMS, COMMITMENTS AND CONTINGENCIES
Legal Matters
Occidental or certain of its subsidiaries are involved, in the normal course of business, in lawsuits, claims and other legal proceedings that seek, among other things, compensation for alleged personal injury, breach of contract, property damage or other losses, punitive damages, civil penalties, or injunctive or declaratory relief. Occidental or certain of its subsidiaries also are involved in proceedings under CERCLA and similar federal, state, local and foreign environmental laws. These environmental proceedings seek funding or performance of remediation and, in some cases, compensation for alleged property damage, punitive damages, civil penalties and injunctive relief. Usually Occidental or such subsidiaries are among many companies in these environmental proceedings and have to date been successful in sharing response costs with other financially sound companies. Further, some lawsuits, claims and legal proceedings involve acquired or disposed assets with respect to which a third party or Occidental retains liability or indemnifies the other party for conditions that existed prior to the transaction.
In accordance with applicable accounting guidance, Occidental accrues reserves for outstanding lawsuits, claims and proceedings when it is probable that a liability has been incurred and the liability can be reasonably estimated. In Note 8, Occidental has disclosed its reserve balances for environmental remediation matters that satisfy this criteria. Reserve balances for matters, other than environmental remediation matters that satisfy this criteria as of December 31, 2017 and December 31, 2016, were not material to Occidental's consolidated balance sheet.
In 2017, Andes Petroleum Ecuador Ltd. filed a demand for arbitration, claiming it is entitled to a 40 percent share of the settlement payments made by the Republic of Ecuador to Occidental for the 2006 expropriation of Occidental’s Participation Contract for Ecuador’s Block 15. Occidental intends to vigorously defend against this claim in arbitration.
The ultimate outcome and impact of outstanding lawsuits, claims and proceedings on Occidental cannot be predicted. Management believes that the resolution of these matters will not, individually or in the aggregate, have a material adverse effect on Occidental's consolidated balance sheet, statements of operations or cash flows after consideration of recorded accruals. Occidental’s estimates are based on information known about the legal matters and its experience in contesting, litigating and settling similar matters. Occidental reassesses the probability and estimability of contingent losses as new information becomes available.
Tax Matters
During the course of its operations, Occidental is subject to audit by tax authorities for varying periods in various federal, state, local and foreign tax jurisdictions. Although taxable years through 2009 for United States federal income tax purposes have been audited by the United States Internal Revenue Service (IRS) pursuant to its Compliance Assurance Program, subsequent taxable years are currently under review. Taxable years from 2002 through the current year remain subject to
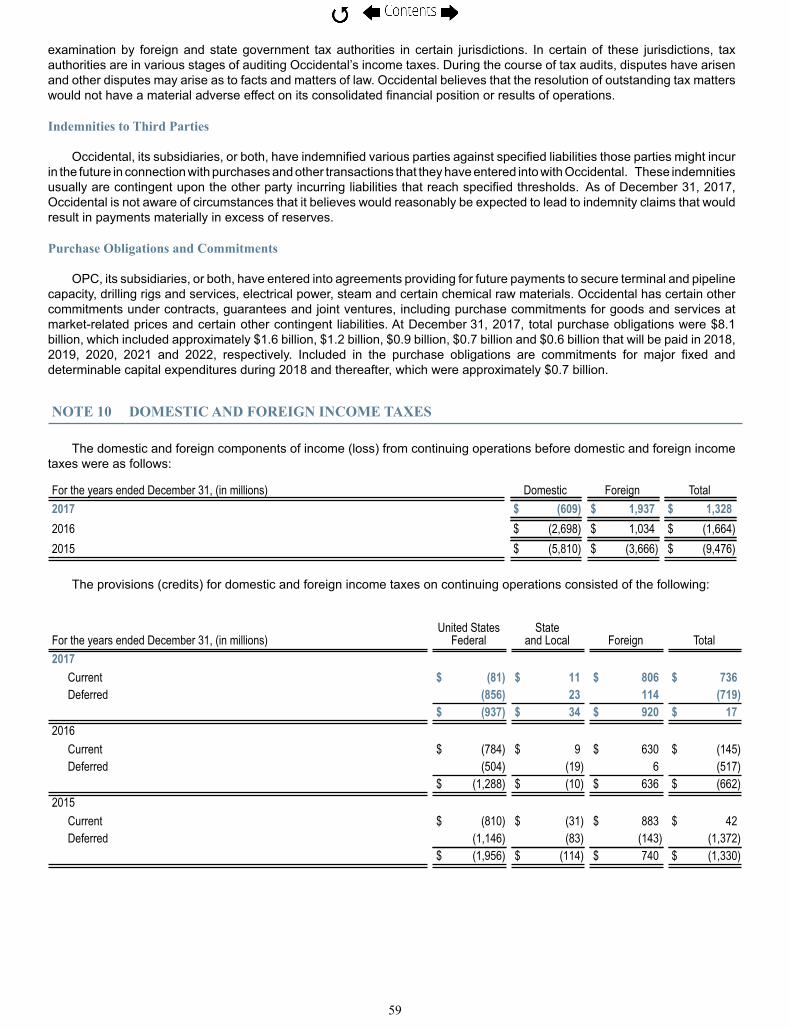
59
examination by foreign and state government tax authorities in certain jurisdictions. In certain of these jurisdictions, tax authorities are in various stages of auditing Occidental’s income taxes. During the course of tax audits, disputes have arisen and other disputes may arise as to facts and matters of law. Occidental believes that the resolution of outstanding tax matters would not have a material adverse effect on its consolidated financial position or results of operations.
Indemnities to Third Parties
Occidental, its subsidiaries, or both, have indemnified various parties against specified liabilities those parties might incur in the future in connection with purchases and other transactions that they have entered into with Occidental. These indemnities usually are contingent upon the other party incurring liabilities that reach specified thresholds. As of December 31, 2017, Occidental is not aware of circumstances that it believes would reasonably be expected to lead to indemnity claims that would result in payments materially in excess of reserves.
Purchase Obligations and Commitments
OPC, its subsidiaries, or both, have entered into agreements providing for future payments to secure terminal and pipeline capacity, drilling rigs and services, electrical power, steam and certain chemical raw materials. Occidental has certain other commitments under contracts, guarantees and joint ventures, including purchase commitments for goods and services at market-related prices and certain other contingent liabilities. At December 31, 2017, total purchase obligations were $8.1 billion, which included approximately $1.6 billion, $1.2 billion, $0.9 billion, $0.7 billion and $0.6 billion that will be paid in 2018, 2019, 2020, 2021 and 2022, respectively. Included in the purchase obligations are commitments for major fixed and determinable capital expenditures during 2018 and thereafter, which were approximately $0.7 billion.
NOTE 10 DOMESTIC AND FOREIGN INCOME TAXES
The domestic and foreign components of income (loss) from continuing operations before domestic and foreign income taxes were as follows:
For the years ended December 31, (in millions) Domestic Foreign Total2017 $ (609) $ 1,937 $ 1,3282016 $ (2,698) $ 1,034 $ (1,664)2015 $ (5,810) $ (3,666) $ (9,476)
The provisions (credits) for domestic and foreign income taxes on continuing operations consisted of the following:
For the years ended December 31, (in millions)United States
FederalState
and Local Foreign Total2017
Current $ (81) $ 11 $ 806 $ 736Deferred (856) 23 114 (719)
$ (937) $ 34 $ 920 $ 172016
Current $ (784) $ 9 $ 630 $ (145)Deferred (504) (19) 6 (517)
$ (1,288) $ (10) $ 636 $ (662)2015
Current $ (810) $ (31) $ 883 $ 42Deferred (1,146) (83) (143) (1,372)
$ (1,956) $ (114) $ 740 $ (1,330)

60
The following reconciliation of the United States federal statutory income tax rate to Occidental’s worldwide effective tax rate on income from continuing operations is stated as a percentage of pre-tax income:
For the years ended December 31, 2017 2016 2015United States federal statutory tax rate 35% 35% 35%Other than temporary loss on available for sale investment in California Resources stock — (2) (1)Enhanced oil recovery credit (9) 5 —Tax benefit due to write off of exploration blocks — 14 —Change in federal income tax rate (44) — —Tax expense due to reversal of indefinite reinvestment assertion 7 — —Operations outside the United States 12 (14) (21)State income taxes, net of federal benefit 2 — 1Other (2) 2 —Worldwide effective tax rate 1% 40% 14%
On December 22, 2017, the 2017 Tax Cuts and Jobs Act (Tax Reform) was enacted which made significant changes to the U.S. federal income tax law, including lowering the federal corporate income tax rate from 35 percent to 21 percent, repealing the corporate alternative minimum tax (AMT) and mandating a deemed repatriation of accumulated earnings and profits of U.S.-owned foreign corporations. In accordance with the guidance from the SEC, Occidental recorded a provisional estimate for the federal and state income tax associated with the mandatory deemed repatriation and the resulting impact to the net federal deferred tax liability. Tax Reform introduced a new tax on certain foreign income which the statute refers to as global intangible low-tax income (GILTI). GILTI is income of a U.S.-owned foreign corporation (net of allowed deductions) in excess of a 10 percent rate of return on the assets of the subsidiary. Tax Reform also introduced a base-erosion anti-abuse tax (BEAT) that aims to reduce the ability of multinational companies to use cross-border payments to shift income to affiliates in lower-taxed countries. Based on current analysis and interpretation of Tax Reform, Occidental does not anticipate a material GILTI or BEAT-related tax obligation and is recording no current or deferred tax impact with regards to GILTI or BEAT on a provisional basis. Further, pending definitive technical guidance from the states in which it is subject to income tax, Occidental has recorded a reasonable estimate of $10 million for the state tax associated with the mandatory deemed repatriation on a provisional basis. The ultimate impact of Tax Reform may differ from Occidental’s estimates due to changes in interpretations and assumptions, as well as additional regulatory guidance. Occidental will adjust provisional amounts as updated information is evaluated.
The tax effects of temporary differences resulting in deferred income taxes at December 31, 2017, and 2016 were as follows:
2017 2016
Tax effects of temporary differences (in millions)Deferred Tax
AssetsDeferred Tax
LiabilitiesDeferred Tax
AssetsDeferred Tax
LiabilitiesProperty, plant and equipment differences $ — $ 2,272 $ — $ 3,345Equity investments, partnerships and foreign subsidiaries — 134 — 58Environmental reserves 191 — 314 —Postretirement benefit accruals 145 — 342 —Deferred compensation and benefits 151 — 222 —Asset retirement obligations 228 — 406 —Foreign tax credit carryforwards 2,750 — 2,046 —Corporate alternative minimum tax credit carryforwards — — 226 —General business credit carryforwards 407 — 186 —Net operating loss carryforward 437 — — —Federal benefit of state income taxes 10 — 8 —All other 146 — 370 —
Subtotal 4,465 2,406 4,120 3,403Valuation allowance (2,640) — (1,849) —Total deferred taxes $ 1,825 $ 2,406 $ 2,271 $ 3,403
Total deferred tax assets, after valuation allowances, were $1.8 billion and $2.3 billion as of December 31, 2017, and 2016, respectively. Occidental expects to realize the recorded deferred tax assets, net of any allowances, through future operating income and reversal of temporary differences. The reduction in the net deferred tax liabilities is primarily related to

61
the reduction in the federal corporate income tax rate from 35 percent to 21 percent and the addition of $221 million of general business credits to the credit carryforward balance.
Occidental had, as of December 31, 2017, foreign tax credit carryforwards of $2.8 billion, which expire in varying amounts through 2027, $35 million of state operating loss carryforwards, which have varying carryforward periods through 2037, $402 million of federal operating loss carryforwards that expire in 2037, and $407 million of general business credit carryforwards that expire between 2033 and 2037. Occidental had, as of December 31, 2017, corporate AMT carryforwards of $221 million, that have been classified as non-current receivables due to Tax Reform. At December 31, 2017, Occidental reversed its indefinite re-investment assertion with regards to its investments in foreign subsidiaries and, as a result, a deferred foreign tax liability of $99 million was recorded. Occidental's valuation allowance provides for substantially all of the foreign tax credit carryforwards and approximately $4 million of the state net operating loss carryforwards.
Discontinued operations include income tax charges of $249 million and $1 million in 2016, and 2015, respectively.As of December 31, 2017, Occidental had liabilities for unrecognized tax benefits of approximately $22 million included
in deferred credits and other liabilities – other, all of which, if subsequently recognized, would favorably affect Occidental’s effective tax rate.
A reconciliation of the beginning and ending amount of unrecognized tax benefits is as follows:
For the years ended December 31, (in millions) 2017 2016 2015Balance at January 1, $ 22 $ 22 $ 61Reductions based on tax positions related to prior years and settlements — — (39)Balance at December 31, $ 22 $ 22 $ 22
Management believes it is unlikely that Occidental’s liabilities for unrecognized tax benefits related to existing matters would increase or decrease within the next 12 months by a material amount. Occidental cannot reasonably estimate a range of potential changes in such benefits due to the unresolved nature of the various audits.
Occidental has recognized $76 million and $761 million in income tax receivables at December 31, 2017, and 2016, respectively, which were recorded in other current assets.
Occidental is subject to audit by various tax authorities in varying periods. See Note 9 for a discussion of these matters.Occidental records estimated potential interest and penalties related to liabilities for unrecognized tax benefits in the
provisions for domestic and foreign income taxes and these amounts were not material for the years ended December 31, 2017, 2016 and 2015.
NOTE 11 STOCKHOLDERS' EQUITY
The following is a summary of common stock issuances:
Shares in thousands Common StockBalance, December 31, 2014 890,558
Issued 782Options exercised and other, net 20
Balance, December 31, 2015 891,360Issued 843Options exercised and other, net 12
Balance, December 31, 2016 892,215Issued 1,252Options exercised and other, net 2
Balance, December 31, 2017 893,469
TREASURY STOCKOn October 2, 2014, Occidental increased the total number of shares authorized for its share repurchase program by 60
million shares to 185 million shares total; however, the program does not obligate Occidental to acquire any specific number of shares and may be discontinued at any time. No shares were purchased under the program in 2017 and 2016. In 2015, Occidental purchased 7.4 million shares under the program at an average cost of $76.99 per share. Additionally, Occidental purchased shares from the trustee of its defined contribution savings plan during each year. As of December 31, 2017, 2016and 2015, treasury stock shares numbered 128.4 million, 128.0 million and 127.7 million, respectively.
NONREDEEMABLE PREFERRED STOCKOccidental has authorized 50,000,000 shares of preferred stock with a par value of $1.00 per share. At December 31,
2017, 2016 and 2015, Occidental had no outstanding shares of preferred stock.

62
EARNINGS PER SHAREThe following table presents the calculation of basic and diluted EPS for the years ended December 31:
(in millions, except per-share amounts) 2017 2016 2015
Income (loss) from continuing operations $ 1,311 $ (1,002) $ (8,146)Income (loss) from continuing operations attributable to common stock 1,311 (1,002) (8,146)Income from discontinued operations — 428 317Net income (loss) 1,311 (574) (7,829)Less: Net income allocated to participating securities (6) — —Net income (loss), net of participating securities $ 1,305 $ (574) $ (7,829)Weighted average number of basic shares 765.1 763.8 765.6
Basic earnings (loss) per common share $ 1.71 $ (0.75) $ (10.23)
Net income (loss), net of participating securities $ 1,305 $ (574) $ (7,829)Weighted average number of basic shares 765.1 763.8 765.6Dilutive securities 0.8 — —Total diluted weighted average common shares 765.9 763.8 765.6
Diluted earnings (loss) per common share $ 1.70 $ (0.75) $ (10.23)
ACCUMULATED OTHER COMPREHENSIVE LOSSAccumulated other comprehensive loss consisted of the following after-tax amounts:
Balance at December 31, (in millions) 2017 2016Foreign currency translation adjustments $ (7) $ (10)Unrealized losses on derivatives — (13)Pension and postretirement adjustments (a) (251) (243)Total $ (258) $ (266)
(a) See Note 13 for further information.
NOTE 12 STOCK-BASED INCENTIVE PLANS Occidental has established several plans that allow it to issue stock-based awards including in the form of RSUs, stock
options (Options), stock appreciation rights (SARs), ROCEI/ROAI and TSRIs. An aggregate of 35 million shares of Occidental common stock were authorized for issuance and approximately 6.1 million shares had been allocated to employee awards through December 31, 2017. In accordance with the terms of the shareholder approved 2015 Long-Term Incentive Plan (LTIP), awards issued under the superseded 2005 LTIP and subsequently forfeited after adoption of the 2015 LTIP increase the shares available for issuance under the 2015 LTIP. As of December 31, 2017, approximately 27.7 million shares were available for grants of future awards. The plan requires each share covered by an award (other than Options and SARs) to be counted as if three shares were issued in determining the number of shares that are available for future awards. Accordingly, the number of shares available for future awards may be less than 27.7 million depending on the type of award granted. Additionally, under the plan, the shares available for future awards may increase, depending on the award type, by the number of shares currently unvested or forfeitable, or three times that number as applicable, that (i) fail to vest, (ii) are forfeited or canceled, or (iii) correspond to the portion of any stock-based awards settled in cash, including awards that were issued under a previous plan that remain outstanding.
During 2017, non-employee directors were granted awards for 32,787 shares of common stock. Compensation expense for these awards was measured using the closing quoted market price of Occidental's common stock on the grant date and was fully recognized at that time.
The following table summarizes total share-based compensation expense recognized in income related to continuing and discontinued operations and the associated tax benefit for the years ended December 31:
For the years ended December 31, (in millions) 2017 2016 2015Compensation expense $ 150 $ 121 $ 49Income tax benefit recognized in the income statement 32 43 17

63
As of December 31, 2017, unrecognized compensation expense for all unvested stock-based incentive awards was $214 million. This expense is expected to be recognized over a weighted-average period of 1.7 years.
RSUsCertain employees are awarded the right to receive RSUs, some of which have performance criteria, and are in the form
of, or equivalent in value to, actual shares of Occidental common stock. Depending on their terms, RSUs are settled in cash or stock at the time of vesting. These awards vest from one to four years following the grant date, however, certain of the RSUs are forfeitable if performance objectives are not satisfied by the seventh anniversary of the grant date. For certain RSUs, dividend equivalents are paid during the vesting period. For those awards that cliff vest between one to three years, dividend equivalents are accumulated during the vesting or performance period, as appropriate, and are paid upon vesting or performance certification, as appropriate.
The weighted-average, grant-date fair values of cash-settled RSUs granted in 2017, 2016 and 2015 were $66.62, $75.57, and $72.64 per share, respectively. The weighted-average, grant-date fair values of the stock-settled RSUs granted in 2017, 2016, and 2015 were $67.21, $74.82, and $72.54, respectively. Cash-Settled RSUs resulted in payments of $22.5 million, $41 million, and $39 million during the years ended December 31, 2017, 2016 and 2015, respectively. The fair value of RSUs settled in shares during the years ended December 31, 2017, 2016 and 2015 was $64 million, $31 million, and $28 million, respectively.
A summary of changes in Occidental’s unvested cash- and stock-settled RSUs during the year ended December 31, 2017is presented below:
Cash-Settled Stock-Settled
RSUs(000's)
Weighted-AverageGrant-DateFair Value
RSUs(000's)
Weighted-AverageGrant-DateFair Value
Unvested at January 1 601 $ 78.70 3,500 $ 77.07Granted 62 66.62 1,683 67.21Vested (373) 81.94 (1,064) 76.51Forfeitures (21) 76.72 (168) 71.86Unvested at December 31 269 $ 71.58 3,951 $ 73.24
TSRIsCertain executives are awarded TSRIs that vest at the end of a three-year period following the grant date. Payout is based
upon Occidental's total shareholder return performance relative to its peers and the S&P 500. TSRIs have payouts that range from 0 to 200 percent of the target award and settle in stock once certified. Dividend equivalents for TSRIs are accumulated and paid upon certification of the award. The fair value of TSRIs settled in shares during the years ended December 31, 2017, 2016 and 2015 was $5 million, $8 million, and $14 million, respectively.
The fair values of TSRIs are initially determined on the grant date using a Monte Carlo simulation model based on Occidental's assumptions, noted in the following table, and the volatility from corresponding peer group companies. The expected life is based on the vesting period (Term). The risk-free interest rate is the implied yield available on zero coupon T-notes (U.S. Treasury Strip) at the time of grant with a remaining term equal to the Term. The dividend yield is the expected annual dividend yield over the Term, expressed as a percentage of the stock price on the grant date. Estimates of fair value may not accurately predict the value ultimately realized by the employees who receive the awards, and the ultimate value may not be indicative of the reasonableness of the original estimates of fair value made by Occidental.
The grant-date assumptions used in the Monte Carlo simulation models for the estimated payout level of TSRIs were as follows:
TSRIsYear Granted 2017 2016 2015Assumptions used:
Risk-free interest rate 1.5% 0.8% 0.9%Dividend yield 4.5% 3.9% 4.1%Volatility factor 25% 24% 37%Expected life (years) 3 3 3Grant-date fair value of underlying Occidental common stock $ 67.21 $ 76.83 $ 72.54
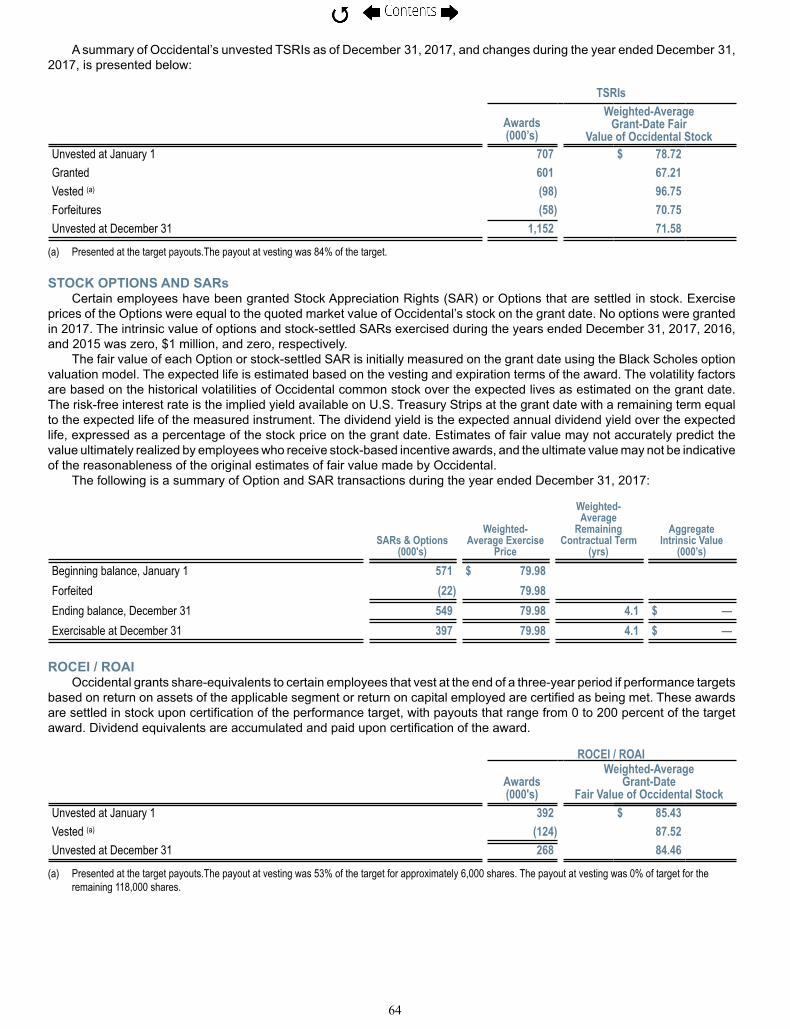
64
A summary of Occidental’s unvested TSRIs as of December 31, 2017, and changes during the year ended December 31, 2017, is presented below:
TSRIs
Awards(000’s)
Weighted-Average Grant-Date Fair
Value of Occidental StockUnvested at January 1 707 $ 78.72Granted 601 67.21Vested (a) (98) 96.75Forfeitures (58) 70.75Unvested at December 31 1,152 71.58
(a) Presented at the target payouts.The payout at vesting was 84% of the target.
STOCK OPTIONS AND SARsCertain employees have been granted Stock Appreciation Rights (SAR) or Options that are settled in stock. Exercise
prices of the Options were equal to the quoted market value of Occidental’s stock on the grant date. No options were granted in 2017. The intrinsic value of options and stock-settled SARs exercised during the years ended December 31, 2017, 2016, and 2015 was zero, $1 million, and zero, respectively.
The fair value of each Option or stock-settled SAR is initially measured on the grant date using the Black Scholes option valuation model. The expected life is estimated based on the vesting and expiration terms of the award. The volatility factors are based on the historical volatilities of Occidental common stock over the expected lives as estimated on the grant date. The risk-free interest rate is the implied yield available on U.S. Treasury Strips at the grant date with a remaining term equal to the expected life of the measured instrument. The dividend yield is the expected annual dividend yield over the expected life, expressed as a percentage of the stock price on the grant date. Estimates of fair value may not accurately predict the value ultimately realized by employees who receive stock-based incentive awards, and the ultimate value may not be indicative of the reasonableness of the original estimates of fair value made by Occidental.
The following is a summary of Option and SAR transactions during the year ended December 31, 2017:
SARs & Options(000's)
Weighted-Average Exercise
Price
Weighted-Average
RemainingContractual Term
(yrs)
AggregateIntrinsic Value
(000’s)Beginning balance, January 1 571 $ 79.98 Forfeited (22) 79.98Ending balance, December 31 549 79.98 4.1 $ —Exercisable at December 31 397 79.98 4.1 $ —
ROCEI / ROAIOccidental grants share-equivalents to certain employees that vest at the end of a three-year period if performance targets
based on return on assets of the applicable segment or return on capital employed are certified as being met. These awards are settled in stock upon certification of the performance target, with payouts that range from 0 to 200 percent of the target award. Dividend equivalents are accumulated and paid upon certification of the award.
ROCEI / ROAI
Awards(000's)
Weighted-AverageGrant-Date
Fair Value of Occidental StockUnvested at January 1 392 $ 85.43Vested (a) (124) 87.52Unvested at December 31 268 84.46
(a) Presented at the target payouts.The payout at vesting was 53% of the target for approximately 6,000 shares. The payout at vesting was 0% of target for the remaining 118,000 shares.

65
NOTE 13 RETIREMENT AND POSTRETIREMENT BENEFIT PLANS
Occidental has various benefit plans for its salaried, domestic union and nonunion hourly, and certain foreign national employees.
DEFINED CONTRIBUTION PLANSAll domestic employees and certain foreign national employees are eligible to participate in one or more of the defined
contribution retirement or savings plans that provide for periodic contributions by Occidental based on plan-specific criteria, such as base pay, level and employee contributions. Certain salaried employees participate in a supplemental retirement plan that restores benefits lost due to governmental limitations on qualified retirement benefits. The accrued liabilities for the supplemental retirement plan were $175 million and $163 million as of December 31, 2017 and 2016, respectively, and Occidental expensed $130 million in 2017, $113 million in 2016 and $136 million in 2015 under the provisions of these defined contribution and supplemental retirement plans.
DEFINED BENEFIT PLANSParticipation in defined benefit plans is limited and approximately 500 domestic and 900 foreign national employees,
mainly union, nonunion hourly and certain employees that joined Occidental from acquired operations with grandfathered benefits, are currently accruing benefits under these plans.
Pension costs for Occidental’s defined benefit pension plans, determined by independent actuarial valuations, are generally funded by payments to trust funds, which are administered by independent trustees.
POSTRETIREMENT AND OTHER BENEFIT PLANSOccidental provides medical and dental benefits and life insurance coverage for certain active, retired and disabled
employees and their eligible dependents. Occidental generally funds the benefits as they are paid during the year. These benefit costs, including the postretirement costs, were approximately $181 million in 2017, $182 million in 2016 and $200 million in 2015.
OBLIGATIONS AND FUNDED STATUSThe following tables show the amounts recognized in the consolidated balance sheets of Occidental related to its pension
and postretirement benefit plans:
(in millions) Pension Benefits Postretirement BenefitsAs of December 31, 2017 2016 2017 2016Amounts recognized in the consolidated balance sheet:
Other assets $ 82 $ 61 $ — $ —Accrued liabilities (5) (3) (59) (58)Deferred credits and other liabilities — pension and postretirementobligations (65) (71) (940) (892)
$ 12 $ (13) $ (999) $ (950)AOCI included the following after-tax balances:
Net loss $ 59 $ 76 $ 192 $ 169Prior service cost — — 1 1
$ 59 $ 76 $ 193 $ 170

66
The following tables show the funding status, obligations and plan asset fair values of Occidental related to its pension and postretirement benefit plans:
Pension Benefits Postretirement BenefitsFor the years ended December 31, 2017 2016 2017 2016Changes in the benefit obligation:Benefit obligation — beginning of year $ 399 $ 411 $ 950 $ 979
Service cost — benefits earned during the period 6 7 21 20Interest cost on projected benefit obligation 17 18 38 39Actuarial (gain) loss 14 (1) 61 (28)Foreign currency exchange rate (gain) loss — 1 — —Liability (gain) loss due to curtailment (2) — (9) —Special termination benefits 1 — — —Benefits paid (44) (37) (62) (60)Settlements — — — —
Benefit obligation — end of year $ 391 $ 399 $ 999 $ 950
Changes in plan assets:Fair value of plan assets — beginning of year $ 386 $ 384 $ — $ —
Actual return on plan assets 52 34 — —Foreign currency exchange rate loss — — — —Employer contributions 9 5 — —Benefits paid (44) (37) — —Settlements — — — —
Fair value of plan assets — end of year $ 403 $ 386 $ — $ —Funded/(Unfunded) status: $ 12 $ (13) $ (999) $ (950)
The following table sets forth details of the obligations and assets of Occidental's defined benefit pension plans:
(in millions)
Accumulated Benefit Obligation in Excess of
Plan Assets
Plan Assets in Excess of Accumulated
Benefit ObligationAs of December 31, 2017 2016 2017 2016Projected Benefit Obligation $ 287 $ 193 $ 104 $ 206Accumulated Benefit Obligation $ 283 $ 189 $ 104 $ 206Fair Value of Plan Assets $ 312 $ 119 $ 91 $ 267
Occidental does not expect any plan assets to be returned during 2018.
COMPONENTS OF NET PERIODIC BENEFIT COSTThe following table sets forth the components of net periodic benefit costs:
Pension Benefits Postretirement BenefitsFor the years ended December 31, (in millions) 2017 2016 2015 2017 2016 2015Net periodic benefit costs: Service cost — benefits earned during the period $ 6 $ 7 $ 7 $ 21 $ 20 $ 26
Interest cost on projected benefit obligation 17 18 18 38 39 40Expected return on plan assets (24) (24) (27) — — —Recognized actuarial loss 10 12 10 14 15 27Other costs and adjustments 3 4 (4) 1 — 1
Net periodic benefit cost $ 12 $ 17 $ 4 $ 74 $ 74 $ 94
The estimated net loss and prior service cost for the defined benefit pension plans that will be amortized from AOCI into net periodic benefit cost over the next fiscal year are $5 million and zero, respectively. The estimated net loss and prior service cost for the defined benefit postretirement plans that will be amortized from AOCI into net periodic benefit cost over the next fiscal year are $17 million and $1 million, respectively.

67
ADDITIONAL INFORMATIONThe following table sets forth the weighted-average assumptions used to determine Occidental's benefit obligation and
net periodic benefit cost for domestic plans:
Pension Benefits Postretirement BenefitsFor the years ended December 31, 2017 2016 2017 2016Benefit Obligation Assumptions:
Discount rate 3.45% 3.90% 3.61% 4.15%Net Periodic Benefit Cost Assumptions:
Discount rate 3.90% 4.14% 4.15% 4.36%Assumed long-term rate of return on assets 6.50% 6.50% — —
For domestic pension plans and postretirement benefit plans, Occidental based the discount rate on the Aon/Hewitt AA-AAA Universe yield curve in 2017 and 2016. The assumed long-term rate of return on assets is estimated with regard to current market factors but within the context of historical returns for the asset mix that exists at year end.
In 2017, Occidental adopted the Society of Actuaries 2017 Mortality Improvement Scale, which updated the mortality assumptions that private defined-benefit plans in the United States use in the actuarial valuations that determine a plan sponsor’s pension obligations. The new mortality improvement scale reflects additional data that the Social Security Administration has released since the MP-2016 scale released in 2016. This additional data shows a lower degree of mortality improvement than previously reflected. The changes in the mortality improvement scale results in a decrease of $2 million and $9 million in the pension and postretirement benefit obligation at December 31, 2017.
For pension plans outside the United States, Occidental based its discount rate on rates indicative of government or investment grade corporate debt in the applicable country, taking into account hyperinflationary environments when necessary. The discount rates used for the foreign pension plans ranged from 1.0 percent to 10.8 percent at December 31, 2017 and 2016. The average rate of increase in future compensation levels ranged from 1.0 percent to 8.0 percent in 2017, depending on local economic conditions.
The postretirement benefit obligation was determined by application of the terms of medical and dental benefits and life insurance coverage, including the effect of established maximums on covered costs, together with relevant actuarial assumptions and health care cost trend rates projected at an assumed U.S. Consumer Price Index (CPI) increase of 1.97 percent as of December 31, 2017 and 2016. Since 1993, participants other than certain union employees have paid for all medical cost increases in excess of increases in the CPI. For those union employees, Occidental projected that health care cost trend rates would decrease from 8.00 percent in 2017 until they reach 4.50 percent in 2025, and remain at 4.50 percent thereafter. A 1 percent increase or a 1 percent decrease in these assumed health care cost trend rates would result in an increase of $42 million or a reduction of $34 million, respectively, in the postretirement benefit obligation as of December 31, 2017. The annual service and interest costs would not be materially affected by these changes.
The actuarial assumptions used could change in the near term as a result of changes in expected future trends and other factors that, depending on the nature of the changes, could cause increases or decreases in the plan assets and liabilities.
FAIR VALUE OF PENSION PLAN ASSETSOccidental employs a total return investment approach that uses a diversified blend of equity and fixed-income investments
to optimize the long-term return of plan assets at a prudent level of risk. The investments are monitored by Occidental’s Pension and Retirement Trust and Investment Committee (Investment Committee) in its role as fiduciary. The Investment Committee, consisting of senior Occidental executives, selects and employs various external professional investment management firms to manage specific investments across the spectrum of asset classes. Equity investments are diversified across U.S. and non-U.S. stocks, as well as differing styles and market capitalizations. Other asset classes, such as private equity and real estate, may be used with the goals of enhancing long-term returns and improving portfolio diversification. The target allocation of plan assets is 65 percent equity securities and 35 percent debt securities. Investment performance is measured and monitored on an ongoing basis through quarterly investment portfolio and manager guideline compliance reviews, annual liability measurements and periodic studies.
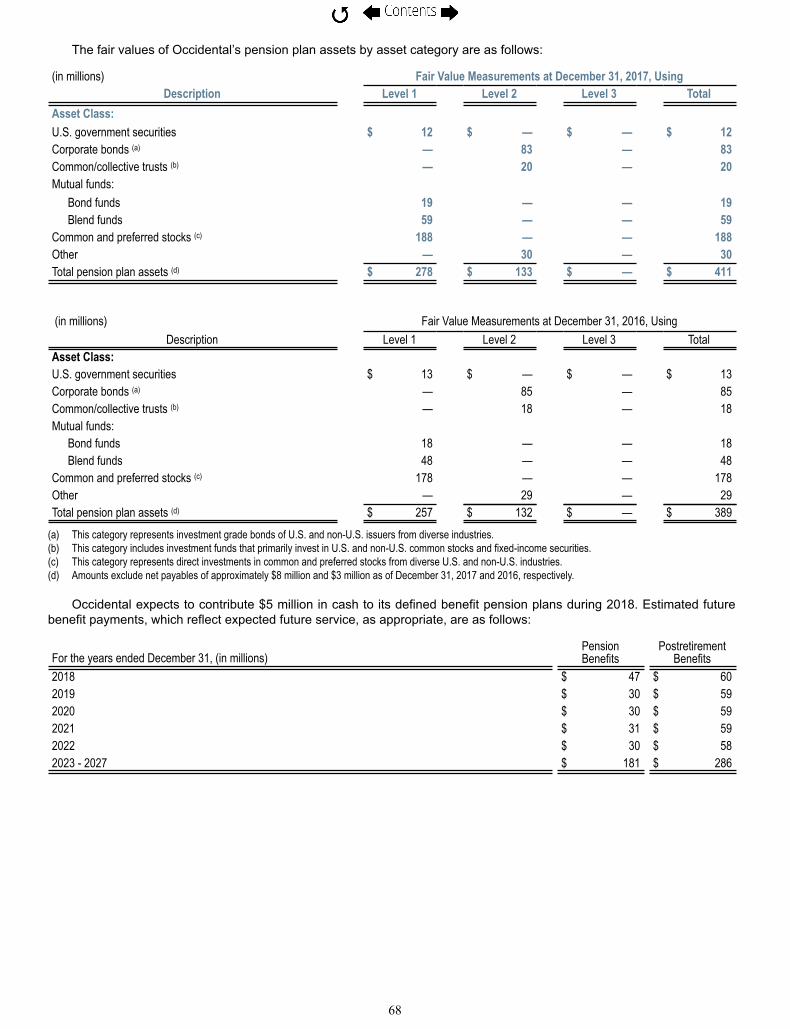
68
The fair values of Occidental’s pension plan assets by asset category are as follows:
(in millions) Fair Value Measurements at December 31, 2017, UsingDescription Level 1 Level 2 Level 3 Total
Asset Class: U.S. government securities $ 12 $ — $ — $ 12Corporate bonds (a) — 83 — 83Common/collective trusts (b) — 20 — 20Mutual funds:
Bond funds 19 — — 19Blend funds 59 — — 59
Common and preferred stocks (c) 188 — — 188Other — 30 — 30Total pension plan assets (d) $ 278 $ 133 $ — $ 411
(in millions) Fair Value Measurements at December 31, 2016, UsingDescription Level 1 Level 2 Level 3 Total
Asset Class: U.S. government securities $ 13 $ — $ — $ 13Corporate bonds (a) — 85 — 85Common/collective trusts (b) — 18 — 18Mutual funds:
Bond funds 18 — — 18Blend funds 48 — — 48
Common and preferred stocks (c) 178 — — 178Other — 29 — 29Total pension plan assets (d) $ 257 $ 132 $ — $ 389
(a) This category represents investment grade bonds of U.S. and non-U.S. issuers from diverse industries.(b) This category includes investment funds that primarily invest in U.S. and non-U.S. common stocks and fixed-income securities.(c) This category represents direct investments in common and preferred stocks from diverse U.S. and non-U.S. industries.(d) Amounts exclude net payables of approximately $8 million and $3 million as of December 31, 2017 and 2016, respectively.
Occidental expects to contribute $5 million in cash to its defined benefit pension plans during 2018. Estimated future benefit payments, which reflect expected future service, as appropriate, are as follows:
For the years ended December 31, (in millions)Pension Benefits
PostretirementBenefits
2018 $ 47 $ 602019 $ 30 $ 592020 $ 30 $ 592021 $ 31 $ 592022 $ 30 $ 582023 - 2027 $ 181 $ 286

69
NOTE 14 INVESTMENTS AND RELATED-PARTY TRANSACTIONS
EQUITY INVESTMENTSAs of December 31, 2017, and 2016, investments in unconsolidated entities comprised $1.5 billion and $1.4 billion of
equity-method investments, respectively.As of December 31, 2017, Occidental’s equity investments consisted mainly of an equity interest in Plains Pipeline, a
24.5-percent interest in the stock of Dolphin Energy, a 50-percent interest in OxyChem Ingleside facility, and various other partnerships and joint ventures. Equity investments paid dividends of $297 million, $224 million, and $438 million to Occidental in 2017, 2016 and 2015, respectively. As of December 31, 2017, cumulative undistributed earnings of equity-method investees since they were acquired was immaterial. As of December 31, 2017, Occidental's investments in equity investees exceeded the underlying equity in net assets by approximately $649 million, of which $464 million represented goodwill and the remainder comprised intangibles amortized over their estimated useful lives.
The following table presents Occidental’s interest in the summarized financial information of its equity-method investments:
For the years ended December 31, (in millions) 2017 2016 2015Revenues $ 1,252 $ 1,238 $ 1,050Costs and expenses 973 1,043 827Net income $ 279 $ 195 $ 223
As of December 31, (in millions) 2017 2016 Current assets $ 602 $ 914 Non-current assets $ 2,072 $ 3,605 Current liabilities $ 247 $ 577 Long-term debt $ 1,174 $ 1,957 Other non-current liabilities $ 66 $ 159 Stockholders’ equity $ 1,187 $ 1,826
Occidental’s investment in Dolphin, which was acquired in 2002, consists of two separate economic interests through which Occidental owns (i) a 24.5-percent undivided interest in the upstream operations under an agreement which is proportionately consolidated in the financial statements; and (ii) a 24.5-percent interest in the stock of Dolphin Energy, which operates a pipeline and is accounted for as an equity investment.
RELATED-PARTY TRANSACTIONSFrom time to time, Occidental purchases oil, NGLs, power, steam and chemicals from and sells oil, NGLs, natural gas,
chemicals and power to certain of its equity investees and other related parties. During 2017, 2016 and 2015, Occidental entered into the following related-party transactions and had the following amounts due from or to its related parties:
For the years ended December 31, (in millions) 2017 2016 2015Sales (a) $ 636 $ 602 $ 555Purchases (b) $ 387 $ 7 $ 26Services $ 38 $ 17 $ 32Advances and amounts due from $ 63 $ 59 $ 60Amounts due to $ 45 $ — $ 5
(a) In 2017, 2016 and 2015, sales of Occidental-produced oil and NGLs to Plains Pipeline affiliates accounted for 86 percent, 89 percent and 87 percent of these totals, respectively. Sales to Plains Pipeline affiliates related to Occidental's oil and gas production are disclosed above. In addition to these sales, Occidental conducts marketing activities with Plains Pipeline affiliates for oil, NGLs and transportation. Net margins associated with these marketing activities are negligible.
(b) In 2017, purchases of ethylene from the Ingleside ethylene cracker accounted for 98 percent of related-party purchases.

70
NOTE 15 FAIR VALUE MEASUREMENTS
FAIR VALUES – RECURRINGIn January 2012, Occidental entered into a long-term contract to purchase CO2. This contract contains a price adjustment
clause that is linked to changes in NYMEX crude oil prices. Occidental determined that the portion of this contract linked to NYMEX oil prices is not clearly and closely related to the host contract, and Occidental therefore bifurcated this embedded pricing feature from its host contract and accounts for it at fair value in the consolidated financial statements.
The following tables provide fair value measurement information for assets and liabilities that are measured on a recurring basis:
(in millions) Fair Value Measurements at December 31, 2017 Using
Netting andCollateral
TotalFair ValueDescription Level 1 Level 2 Level 3
Liabilities:
Embedded derivativeAccrued liabilities $ — $ 39 $ — $ — $ 39Deferred credits and liabilities $ — $ 147 $ — $ — $ 147
(in millions) Fair Value Measurements at December 31, 2016 Using
Netting andCollateral
TotalFair ValueDescription Level 1 Level 2 Level 3
Liabilities:
Embedded derivativeAccrued liabilities $ — $ 43 $ — $ — $ 43Deferred credits and liabilities $ — $ 178 $ — $ — $ 178
FAIR VALUES – NONRECURRINGDuring 2017, Occidental recognized pre-tax impairment charges of $397 million primarily related to held for sale non-
core proved and unproved Permian acreage. Assumptions for proved and unproved properties classified as held for sale include estimated third-party prices to be received based on recent transactions of similar acreage.
During 2016, Occidental recognized pre-tax impairment charges of $15 million related to proved oil and gas properties.As a result of the sharp decline of the forward price curve during 2015, as well as the decision to sell or exit non-core
operations, Occidental recognized approximately $6.5 billion in pre-tax impairment charges related to proved oil and gas properties. Internationally, Occidental recognized $4.7 billion in pre-tax impairment charges related to $1.8 billion in charges in Oman, $1.3 billion in Iraq and Libya, $1 billion in Qatar, and $550 million in Colombia and Bolivia. Domestically, Occidental recognized pre-tax impairment charges of approximately $763 million related to the sale of the Williston assets, $460 million for assets in the Piceance Basin and $554 million related to proved oil and gas properties in South Texas.
During 2015, Occidental recognized approximately $814 million in pre-tax impairment charges for a Midstream CO2treatment plant related to recurring CO2 shortfalls and unpaid penalty fees and approximately $121 million pre-tax charges related to the impairments of Chemical assets.
The impairment tests, including the fair value estimation, incorporated a number of assumptions involving expectations of future cash flows. These assumptions included estimates of future product prices, which Occidental based on forward price curves and, where applicable, contractual prices, estimates of oil and gas reserves, estimates of future expected operating and development costs and a risk-adjusted discount rate of 8 to 20 percent. These properties were impacted by persistently worldwide low oil and natural gas prices and management's changing development plans. Occidental used the income approach to measure the fair value of these properties, using inputs categorized as Level 3 in the fair value hierarchy.
FINANCIAL INSTRUMENTS FAIR VALUEThe carrying amounts of cash and cash equivalents and other on-balance sheet financial instruments, other than fixed-
rate debt, approximate fair value. See Note 5 for the fair value of Long-term Debt.

71
NOTE 16 INDUSTRY SEGMENTS AND GEOGRAPHIC AREAS
Occidental conducts its continuing operations through three segments: (1) Oil and gas; (2) Chemical; and (3) Midstream and marketing. The oil and gas segment explores for, develops and produces oil and condensate, NGLs, and natural gas. The chemical segment mainly manufactures and markets basic chemicals and vinyls. The midstream and marketing segment gathers, processes, transports, stores, purchases and markets oil, condensate, NGLs, natural gas, CO2 and power. It also trades around its assets, including transportation and storage capacity. Additionally, the midstream and marketing segment operates a crude oil export terminal, as well as invests in entities that conduct similar activities.
Results of industry segments and geographic areas exclude income taxes, interest income, interest expense, environmental remediation expenses, unallocated corporate expenses and discontinued operations, but include gains and losses from dispositions of segment and geographic area assets and income from the segments' equity investments. Intersegment sales eliminate upon consolidation and are generally made at prices approximating those that the selling entity would be able to obtain in third-party transactions.
Identifiable assets are those assets used in the operations of the segments. Corporate assets consist of cash and restricted cash, certain corporate receivables and PP&E.
Industry Segments (in millions)
Oil and Gas Chemical
Midstream and
Marketing
Corporateand
Eliminations Total Year ended December 31, 2017
Net sales $ 7,870 (a) $ 4,355 (b) $ 1,157 (c) $ (874) $ 12,508Pretax operating profit (loss) $ 1,111 (d) $ 822 $ 85 (e) $ (690) (f) $ 1,328Income taxes — — — (17) (g) (17)Net income (loss) attributable to common stock $ 1,111 $ 822 $ 85 $ (707) $ 1,311Investments in unconsolidated entities $ — $ 771 $ 739 $ 5 $ 1,515Property, plant and equipment additions, net (h) $ 2,968 $ 323 $ 296 $ 64 $ 3,651Depreciation, depletion and amortization $ 3,269 $ 352 $ 340 $ 41 $ 4,002Total assets $ 23,595 $ 4,364 $ 11,775 $ 2,292 $ 42,026
Year ended December 31, 2016 Net sales $ 6,377 (a) $ 3,756 (b) $ 684 (c) $ (727) $ 10,090Pretax operating profit (loss) $ (636) (d) $ 571 (i) $ (381) (e) $ (1,218) (f) $ (1,664)Income taxes — — — 662 (g) 662Discontinued operations, net — — — 428 (j) 428Net income (loss) attributable to common stock $ (636) $ 571 $ (381) $ (128) $ (574)Investments in unconsolidated entities $ — $ 730 $ 666 $ 5 $ 1,401Property, plant and equipment additions, net (h) $ 1,998 $ 353 $ 370 $ 59 $ 2,780Depreciation, depletion and amortization $ 3,575 $ 340 $ 313 $ 40 $ 4,268Total assets $ 24,130 $ 4,348 $ 11,059 $ 3,572 $ 43,109
Year ended December 31, 2015 Net sales $ 8,304 (a) $ 3,945 (b) $ 891 (c) $ (660) $ 12,480Pretax operating profit (loss) $ (8,060) (d) $ 542 (i) $ (1,194) (e) $ (764) (f) $ (9,476)Income taxes — — — 1,330 (g) 1,330Discontinued operations, net $ — — — 317 (j) 317Net income (loss) attributable to common stock $ (8,060) $ 542 $ (1,194) $ 883 $ (7,829)Investments in unconsolidated entities $ 4 $ 550 $ 708 $ 5 $ 1,267Property, plant and equipment additions, net (h) $ 4,485 $ 271 $ 611 $ 42 $ 5,409Depreciation, depletion and amortization $ 3,886 $ 371 $ 249 $ 38 $ 4,544Total assets $ 23,591 $ 3,982 $ 10,175 $ 5,661 $ 43,409
(See footnotes on next page)
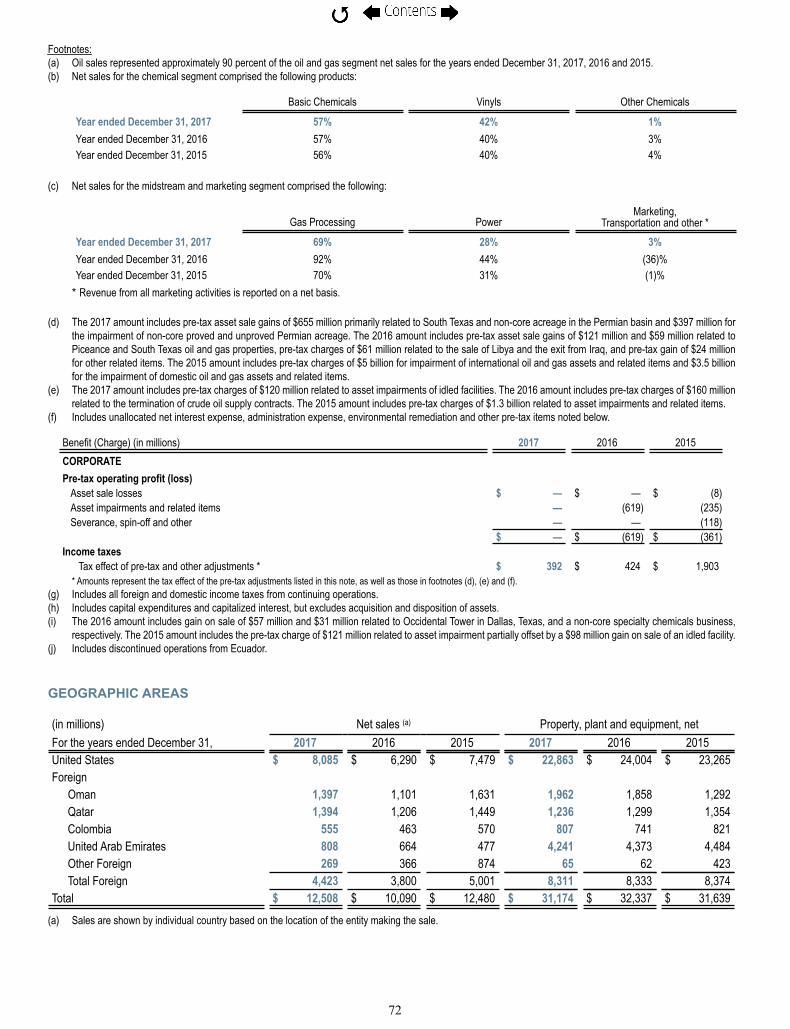
72
Footnotes:(a) Oil sales represented approximately 90 percent of the oil and gas segment net sales for the years ended December 31, 2017, 2016 and 2015.(b) Net sales for the chemical segment comprised the following products:
Basic Chemicals Vinyls Other Chemicals
Year ended December 31, 2017 57% 42% 1%Year ended December 31, 2016 57% 40% 3%Year ended December 31, 2015 56% 40% 4%
(c) Net sales for the midstream and marketing segment comprised the following:
Gas Processing PowerMarketing,
Transportation and other *Year ended December 31, 2017 69% 28% 3%Year ended December 31, 2016 92% 44% (36)%Year ended December 31, 2015 70% 31% (1)%
* Revenue from all marketing activities is reported on a net basis.
(d) The 2017 amount includes pre-tax asset sale gains of $655 million primarily related to South Texas and non-core acreage in the Permian basin and $397 million for the impairment of non-core proved and unproved Permian acreage. The 2016 amount includes pre-tax asset sale gains of $121 million and $59 million related to Piceance and South Texas oil and gas properties, pre-tax charges of $61 million related to the sale of Libya and the exit from Iraq, and pre-tax gain of $24 million for other related items. The 2015 amount includes pre-tax charges of $5 billion for impairment of international oil and gas assets and related items and $3.5 billion for the impairment of domestic oil and gas assets and related items.
(e) The 2017 amount includes pre-tax charges of $120 million related to asset impairments of idled facilities. The 2016 amount includes pre-tax charges of $160 million related to the termination of crude oil supply contracts. The 2015 amount includes pre-tax charges of $1.3 billion related to asset impairments and related items.
(f) Includes unallocated net interest expense, administration expense, environmental remediation and other pre-tax items noted below.
Benefit (Charge) (in millions) 2017 2016 2015CORPORATE Pre-tax operating profit (loss)
Asset sale losses $ — $ — $ (8)Asset impairments and related items — (619) (235)Severance, spin-off and other — — (118)
$ — $ (619) $ (361)Income taxes
Tax effect of pre-tax and other adjustments * $ 392 $ 424 $ 1,903* Amounts represent the tax effect of the pre-tax adjustments listed in this note, as well as those in footnotes (d), (e) and (f).
(g) Includes all foreign and domestic income taxes from continuing operations.(h) Includes capital expenditures and capitalized interest, but excludes acquisition and disposition of assets.(i) The 2016 amount includes gain on sale of $57 million and $31 million related to Occidental Tower in Dallas, Texas, and a non-core specialty chemicals business,
respectively. The 2015 amount includes the pre-tax charge of $121 million related to asset impairment partially offset by a $98 million gain on sale of an idled facility. (j) Includes discontinued operations from Ecuador.
GEOGRAPHIC AREAS
(in millions) Net sales (a) Property, plant and equipment, netFor the years ended December 31, 2017 2016 2015 2017 2016 2015United States $ 8,085 $ 6,290 $ 7,479 $ 22,863 $ 24,004 $ 23,265Foreign
Oman 1,397 1,101 1,631 1,962 1,858 1,292Qatar 1,394 1,206 1,449 1,236 1,299 1,354Colombia 555 463 570 807 741 821United Arab Emirates 808 664 477 4,241 4,373 4,484Other Foreign 269 366 874 65 62 423Total Foreign 4,423 3,800 5,001 8,311 8,333 8,374
Total $ 12,508 $ 10,090 $ 12,480 $ 31,174 $ 32,337 $ 31,639(a) Sales are shown by individual country based on the location of the entity making the sale.

73
2017 Quarterly Financial Data (Unaudited) Occidental Petroleum Corporationand Subsidiariesin millions, except per-share amounts
Three months ended March 31 June 30 September 30 December 31Segment net sales
Oil and gas $ 1,894 $ 1,848 $ 1,865 $ 2,263Chemical 1,068 1,156 1,071 1,060Midstream and marketing 211 270 266 410Eliminations (216) (214) (203) (241)
Net sales $ 2,957 $ 3,060 $ 2,999 $ 3,492
Gross profit $ 521 $ 508 $ 571 $ 1,001
Segment earnings Oil and gas $ 220 $ 627 (a) $ 220 (a) $ 44 (a)
Chemical 170 230 200 222Midstream and marketing (47) 119 (b) 4 9 (b)
343 976 424 275Unallocated corporate items
Interest expense, net (78) (81) (85) (80)Income taxes (78) (285) (85) 431Other (70) (103) (64) (129)
Income from continuing operations 117 507 190 497Discontinued operations, net — — — —Net income attributable to common stock $ 117 $ 507 $ 190 $ 497
Basic earnings per common share Income from continuing operations $ 0.15 $ 0.66 $ 0.25 $ 0.65Discontinued operations, net — — — —
Basic earnings per common share $ 0.15 $ 0.66 $ 0.25 $ 0.65
Diluted earnings per common share Income from continuing operations $ 0.15 $ 0.66 $ 0.25 $ 0.65Discontinued operations, net — — — —
Diluted earnings per common share $ 0.15 $ 0.66 $ 0.25 $ 0.65
Dividends per common share $ 0.76 $ 0.76 $ 0.77 $ 0.77
Market price per common share High $ 72.96 $ 65.73 $ 65.70 $ 74.06Low $ 61.01 $ 57.20 $ 57.84 $ 63.47
(a) Included pre-tax asset sale gains of $0.5 billion in the second quarter related to the sale of South Texas operations, $81 million in the third quarter related to the sale of non-core acreage in the Permian Basin, and approximately $55 million in the fourth quarter related to the sale of non-core proved and unproved acreage in the Permian Basin. The fourth quarter also included impairments of $397 million on non-core proved and unproved Permian acreage.
(b) Included second quarter pre-tax fair value gain of $94 million on Plains Pipeline equity investment and fourth quarter pre-tax charges of $120 million related to idled midstream facilities.

74
2016 Quarterly Financial Data (Unaudited) Occidental Petroleum Corporationand Subsidiariesin millions, except per-share amounts
Three months ended March 31 June 30 September 30 December 31Segment net sales
Oil and gas $ 1,275 $ 1,625 $ 1,660 $ 1,817Chemical 890 908 988 970Midstream and marketing 133 141 202 208Eliminations (175) (143) (202) (207)
Net sales $ 2,123 $ 2,531 $ 2,648 $ 2,788
Gross profit $ (335) $ 143 $ 203 $ 345
Segment earnings Oil and gas $ (485) (a) $ (117) $ (51) (a) $ 17 (a)
Chemical 214 (b) 88 117 152Midstream and marketing (95) (58) (180) (c) (48)
(366) (87) (114) 121Unallocated corporate items
Interest expense, net (57) (84) (62) (72)Income taxes 203 96 30 333Other (140) (d) (61) (92) (650) (d)
Income from continuing operations (360) (136) (238) (268)Discontinued operations, net 438 (e) (3) (3) (4)Net income (loss) $ 78 $ (139) $ (241) $ (272)
Basic earnings per common share Income (loss) from continuing operations $ (0.47) $ (0.18) $ (0.31) $ (0.35)Discontinued operations, net 0.57 — (0.01) (0.01)
Basic earnings per common share $ 0.10 $ (0.18) $ (0.32) $ (0.36)
Diluted earnings per common share Income (loss) from continuing operations $ (0.47) $ (0.18) $ (0.31) $ (0.35)Discontinued operations, net 0.57 — (0.01) (0.01)
Diluted earnings per common share $ 0.10 $ (0.18) $ (0.32) $ (0.36)
Dividends per common share $ 0.75 $ 0.75 $ 0.76 $ 0.76
Market price per common share High $ 72.19 $ 78.31 $ 78.48 $ 75.60Low $ 58.24 $ 66.94 $ 67.83 $ 64.37
(a) Included pre-tax asset sale gains of $48 million in the first quarter related to the sale of domestic oil and gas properties, and $59 million in the third quarter related to the sale of South Texas oil and gas properties. Included pre-tax charges of $25 million in the first quarter, $61 million in the third quarter, $9 million in the fourth quarter and a $24 million gain in the fourth quarter related to oil and gas asset impairments, related items, and other.
(b) Included first quarter pre-tax asset sale gain of $57 million from the sale of the Occidental Tower building in Dallas and a $31 million gain from the sale of a non-core specialty chemicals business.
(c) Included third quarter pre-tax charges of $160 million related to the termination of crude oil supply contracts. (d) Included first quarter pre-tax charges of $78 million and fourth quarter pre-tax charges of $541 million related to a reserve against a long-term receivable from Maxus
due the uncertainty of collection. (e) Included the gains related to the Ecuador settlement.

75
Supplemental Oil and Gas Information (Unaudited)
The following tables set forth Occidental’s net interests in quantities of proved developed and undeveloped reserves of oil (including condensate), NGLs and natural gas and changes in such quantities. Proved oil, NGLs and natural gas reserves were estimated using the unweighted arithmetic average of the first-day-of-the-month price for each month within the year, unless prices were defined by contractual arrangements. Oil, NGLs and natural gas prices used for this purpose were based on posted benchmark prices and adjusted for price differentials including gravity, quality and transportation costs. For the 2017, 2016 and 2015 disclosures, the calculated average West Texas Intermediate oil prices were $51.34, $42.75 and $50.28 per barrel, respectively. The calculated average Brent oil prices for 2017, 2016 and 2015 disclosures were $54.93, $44.49 and $55.57, per barrel, respectively. The calculated average Henry Hub natural gas prices for 2017, 2016 and 2015 were $3.08, $2.55 and $2.66 per MMBtu, respectively. Reserves are stated net of applicable royalties. Estimated reserves include Occidental's economic interests under production-sharing contracts (PSCs) and other similar economic arrangements. In addition, discussions of oil and gas production or volumes, in general, refer to sales volumes unless the context requires or it is indicated otherwise.
Prices for crude oil, natural gas and NGLs fluctuate widely. Historically, the markets for crude oil, natural gas, NGLs and refined products have been volatile and may continue to be volatile in the future. Prolonged or further declines in crude oil, natural gas and NGLs prices would continue to reduce Occidental's operating results and cash flows, and could impact its future rate of growth and further impact the recoverability of the carrying value of its assets.
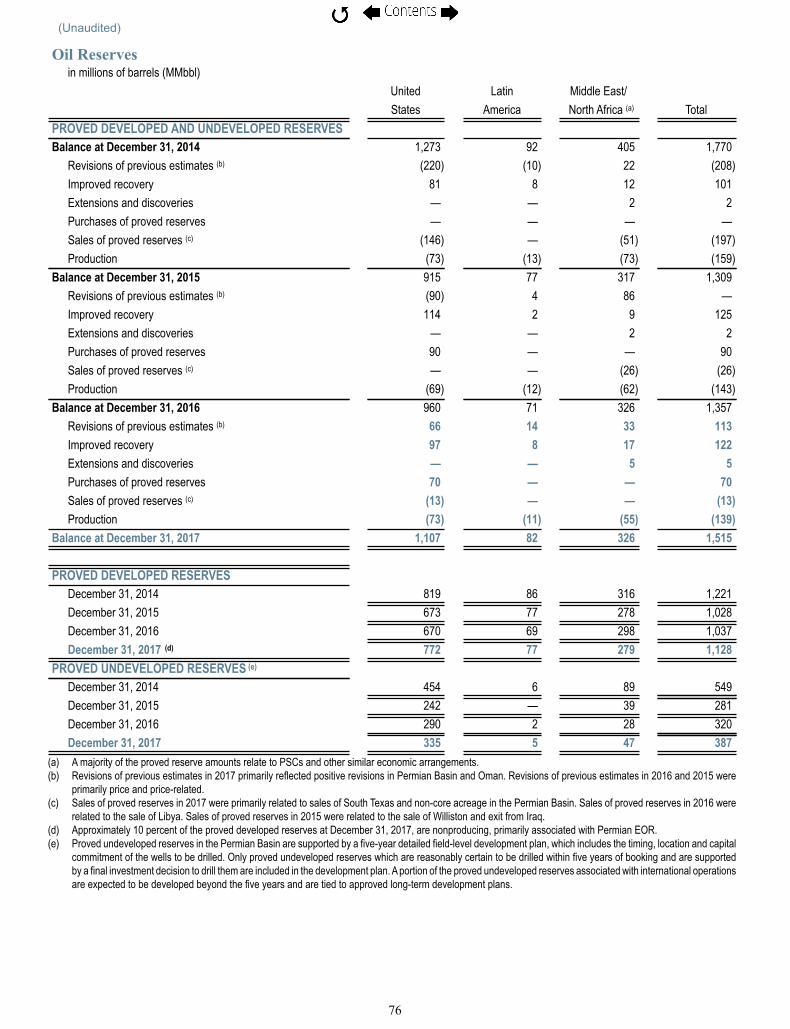
(Unaudited)
76
Oil Reserves in millions of barrels (MMbbl)
United Latin Middle East/ States America North Africa (a) TotalPROVED DEVELOPED AND UNDEVELOPED RESERVES Balance at December 31, 2014 1,273 92 405 1,770
Revisions of previous estimates (b) (220) (10) 22 (208)Improved recovery 81 8 12 101Extensions and discoveries — — 2 2Purchases of proved reserves — — — —Sales of proved reserves (c) (146) — (51) (197)Production (73) (13) (73) (159)
Balance at December 31, 2015 915 77 317 1,309Revisions of previous estimates (b) (90) 4 86 —Improved recovery 114 2 9 125Extensions and discoveries — — 2 2Purchases of proved reserves 90 — — 90Sales of proved reserves (c) — — (26) (26)Production (69) (12) (62) (143)
Balance at December 31, 2016 960 71 326 1,357Revisions of previous estimates (b) 66 14 33 113Improved recovery 97 8 17 122Extensions and discoveries — — 5 5Purchases of proved reserves 70 — — 70Sales of proved reserves (c) (13) — — (13)Production (73) (11) (55) (139)
Balance at December 31, 2017 1,107 82 326 1,515
PROVED DEVELOPED RESERVES December 31, 2014 819 86 316 1,221December 31, 2015 673 77 278 1,028December 31, 2016 670 69 298 1,037December 31, 2017 (d) 772 77 279 1,128
PROVED UNDEVELOPED RESERVES (e) December 31, 2014 454 6 89 549December 31, 2015 242 — 39 281December 31, 2016 290 2 28 320December 31, 2017 335 5 47 387
(a) A majority of the proved reserve amounts relate to PSCs and other similar economic arrangements.(b) Revisions of previous estimates in 2017 primarily reflected positive revisions in Permian Basin and Oman. Revisions of previous estimates in 2016 and 2015 were
primarily price and price-related. (c) Sales of proved reserves in 2017 were primarily related to sales of South Texas and non-core acreage in the Permian Basin. Sales of proved reserves in 2016 were
related to the sale of Libya. Sales of proved reserves in 2015 were related to the sale of Williston and exit from Iraq. (d) Approximately 10 percent of the proved developed reserves at December 31, 2017, are nonproducing, primarily associated with Permian EOR.(e) Proved undeveloped reserves in the Permian Basin are supported by a five-year detailed field-level development plan, which includes the timing, location and capital
commitment of the wells to be drilled. Only proved undeveloped reserves which are reasonably certain to be drilled within five years of booking and are supported by a final investment decision to drill them are included in the development plan. A portion of the proved undeveloped reserves associated with international operations are expected to be developed beyond the five years and are tied to approved long-term development plans.

(Unaudited)
77
NGLs Reserves in millions of barrels (MMbbl)
United Latin Middle East/ States America North Africa TotalPROVED DEVELOPED AND UNDEVELOPED RESERVES Balance at December 31, 2014 222 — 140 362
Revisions of previous estimates (a) (28) — 10 (18)Improved recovery 12 — 1 13Extensions and discoveries — — — —Purchases of proved reserves — — — —Sales of proved reserves — — — —Production (20) — (7) (27)
Balance at December 31, 2015 186 — 144 330Revisions of previous estimates (a) 1 — 70 71Improved recovery 28 — — 28Extensions and discoveries — — — —Purchases of proved reserves 26 — — 26Sales of proved reserves (3) — (2) (5)Production (19) — (11) (30)
Balance, December 31, 2016 219 — 201 420Revisions of previous estimates (a) 11 — (2) 9Improved recovery 23 — 10 33Extensions and discoveries — — — —Purchases of proved reserves 21 — — 21Sales of proved reserves (b) (7) — — (7)Production (20) — (11) (31)
Balance, December 31, 2017 247 — 198 445
PROVED DEVELOPED RESERVES December 31, 2014 147 — 109 256December 31, 2015 141 — 112 253December 31, 2016 149 — 164 313December 31, 2017 (c) 161 — 153 314
PROVED UNDEVELOPED RESERVES (d) December 31, 2014 75 — 31 106December 31, 2015 45 — 32 77December 31, 2016 70 — 37 107December 31, 2017 86 — 45 131
(a) Revisions of previous estimates were primarily price and price-related.(b) Sales of proved reserves in 2017 were primarily related to the sale of South Texas. (c) Approximately 5 percent of the proved developed reserves at December 31, 2017, are nonproducing, primarily associated with Permian EOR.(d) Proved undeveloped reserves in the Permian Basin are supported by a five-year detailed field-level development plan, which includes the timing, location and capital
commitment of the wells to be drilled. Only proved undeveloped reserves which are reasonably certain to be drilled within five years of booking and are supported by a final investment decision to drill them are included in the development plan. A portion of the proved undeveloped reserves associated with international operations are expected to be developed beyond the five years and are tied to approved long-term development plans.
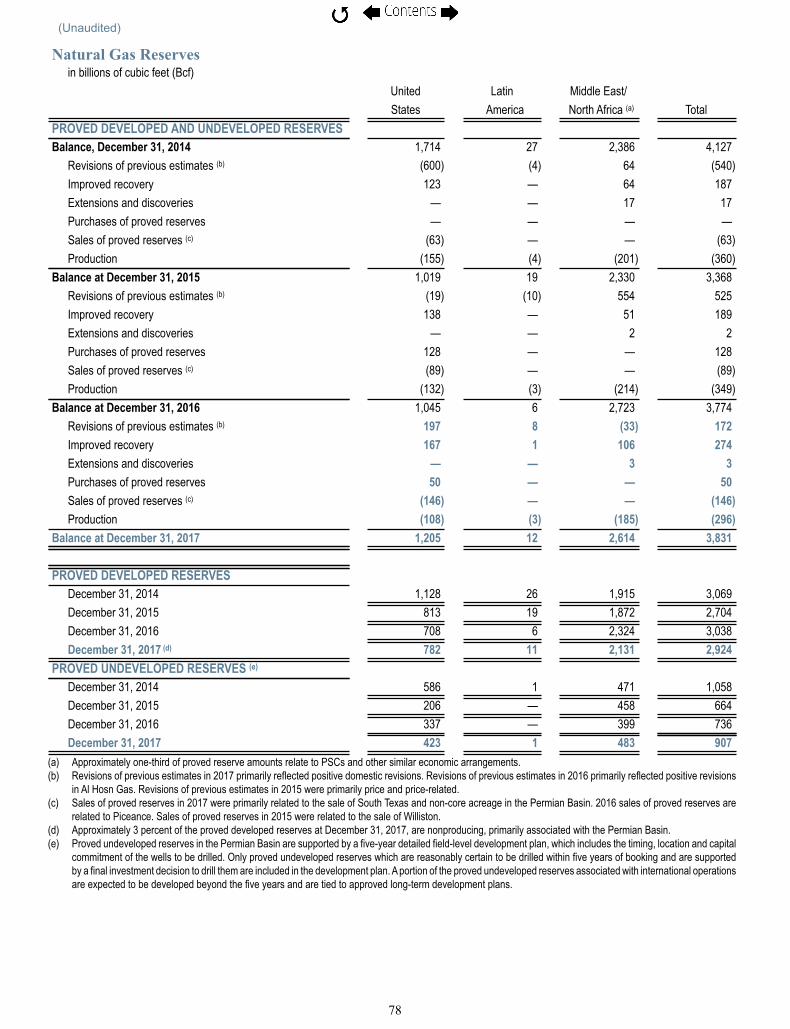
(Unaudited)
78
Natural Gas Reserves in billions of cubic feet (Bcf)
United Latin Middle East/States America North Africa (a) Total
PROVED DEVELOPED AND UNDEVELOPED RESERVES Balance, December 31, 2014 1,714 27 2,386 4,127
Revisions of previous estimates (b) (600) (4) 64 (540)Improved recovery 123 — 64 187Extensions and discoveries — — 17 17Purchases of proved reserves — — — —Sales of proved reserves (c) (63) — — (63)Production (155) (4) (201) (360)
Balance at December 31, 2015 1,019 19 2,330 3,368Revisions of previous estimates (b) (19) (10) 554 525Improved recovery 138 — 51 189Extensions and discoveries — — 2 2Purchases of proved reserves 128 — — 128Sales of proved reserves (c) (89) — — (89)Production (132) (3) (214) (349)
Balance at December 31, 2016 1,045 6 2,723 3,774Revisions of previous estimates (b) 197 8 (33) 172Improved recovery 167 1 106 274Extensions and discoveries — — 3 3Purchases of proved reserves 50 — — 50Sales of proved reserves (c) (146) — — (146)Production (108) (3) (185) (296)
Balance at December 31, 2017 1,205 12 2,614 3,831
PROVED DEVELOPED RESERVES December 31, 2014 1,128 26 1,915 3,069December 31, 2015 813 19 1,872 2,704December 31, 2016 708 6 2,324 3,038December 31, 2017 (d) 782 11 2,131 2,924
PROVED UNDEVELOPED RESERVES (e) December 31, 2014 586 1 471 1,058December 31, 2015 206 — 458 664December 31, 2016 337 — 399 736December 31, 2017 423 1 483 907
(a) Approximately one-third of proved reserve amounts relate to PSCs and other similar economic arrangements.(b) Revisions of previous estimates in 2017 primarily reflected positive domestic revisions. Revisions of previous estimates in 2016 primarily reflected positive revisions
in Al Hosn Gas. Revisions of previous estimates in 2015 were primarily price and price-related.(c) Sales of proved reserves in 2017 were primarily related to the sale of South Texas and non-core acreage in the Permian Basin. 2016 sales of proved reserves are
related to Piceance. Sales of proved reserves in 2015 were related to the sale of Williston. (d) Approximately 3 percent of the proved developed reserves at December 31, 2017, are nonproducing, primarily associated with the Permian Basin.(e) Proved undeveloped reserves in the Permian Basin are supported by a five-year detailed field-level development plan, which includes the timing, location and capital
commitment of the wells to be drilled. Only proved undeveloped reserves which are reasonably certain to be drilled within five years of booking and are supported by a final investment decision to drill them are included in the development plan. A portion of the proved undeveloped reserves associated with international operations are expected to be developed beyond the five years and are tied to approved long-term development plans.
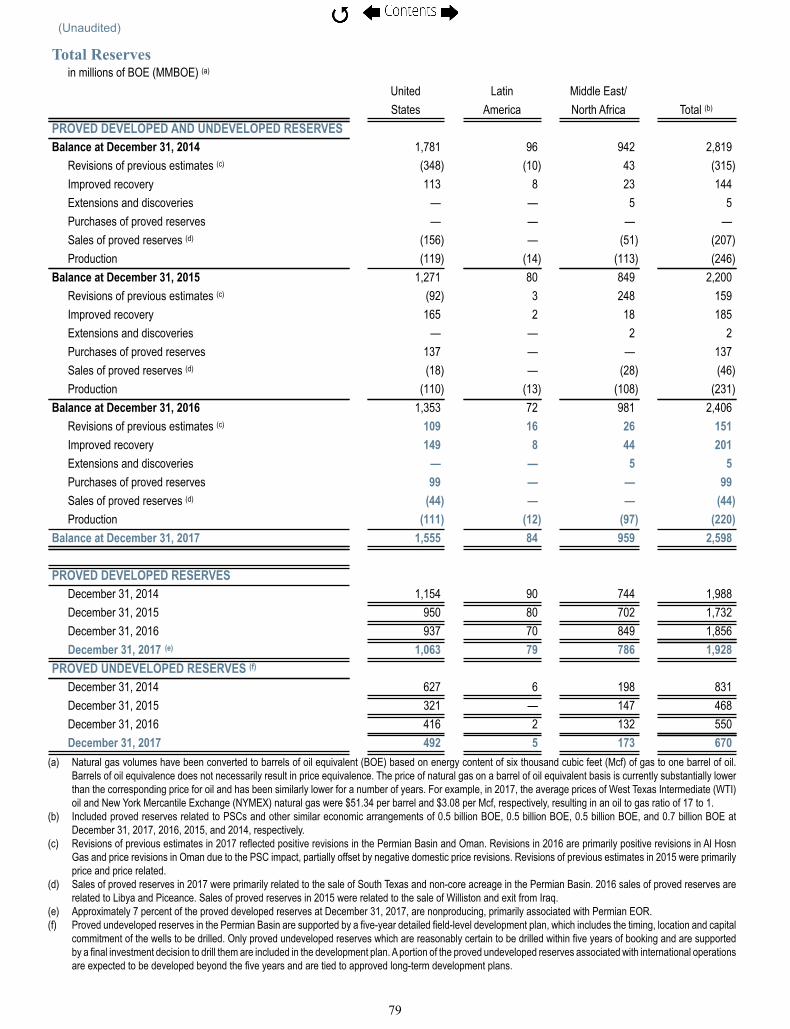
(Unaudited)
79
Total Reserves in millions of BOE (MMBOE) (a)
United Latin Middle East/States America North Africa Total (b)
PROVED DEVELOPED AND UNDEVELOPED RESERVES Balance at December 31, 2014 1,781 96 942 2,819
Revisions of previous estimates (c) (348) (10) 43 (315)Improved recovery 113 8 23 144Extensions and discoveries — — 5 5Purchases of proved reserves — — — —Sales of proved reserves (d) (156) — (51) (207)Production (119) (14) (113) (246)
Balance at December 31, 2015 1,271 80 849 2,200Revisions of previous estimates (c) (92) 3 248 159Improved recovery 165 2 18 185Extensions and discoveries — — 2 2Purchases of proved reserves 137 — — 137Sales of proved reserves (d) (18) — (28) (46)Production (110) (13) (108) (231)
Balance at December 31, 2016 1,353 72 981 2,406Revisions of previous estimates (c) 109 16 26 151Improved recovery 149 8 44 201Extensions and discoveries — — 5 5Purchases of proved reserves 99 — — 99Sales of proved reserves (d) (44) — — (44)Production (111) (12) (97) (220)
Balance at December 31, 2017 1,555 84 959 2,598
PROVED DEVELOPED RESERVES December 31, 2014 1,154 90 744 1,988December 31, 2015 950 80 702 1,732December 31, 2016 937 70 849 1,856December 31, 2017 (e) 1,063 79 786 1,928
PROVED UNDEVELOPED RESERVES (f) December 31, 2014 627 6 198 831December 31, 2015 321 — 147 468December 31, 2016 416 2 132 550December 31, 2017 492 5 173 670
(a) Natural gas volumes have been converted to barrels of oil equivalent (BOE) based on energy content of six thousand cubic feet (Mcf) of gas to one barrel of oil. Barrels of oil equivalence does not necessarily result in price equivalence. The price of natural gas on a barrel of oil equivalent basis is currently substantially lower than the corresponding price for oil and has been similarly lower for a number of years. For example, in 2017, the average prices of West Texas Intermediate (WTI) oil and New York Mercantile Exchange (NYMEX) natural gas were $51.34 per barrel and $3.08 per Mcf, respectively, resulting in an oil to gas ratio of 17 to 1.
(b) Included proved reserves related to PSCs and other similar economic arrangements of 0.5 billion BOE, 0.5 billion BOE, 0.5 billion BOE, and 0.7 billion BOE at December 31, 2017, 2016, 2015, and 2014, respectively.
(c) Revisions of previous estimates in 2017 reflected positive revisions in the Permian Basin and Oman. Revisions in 2016 are primarily positive revisions in Al Hosn Gas and price revisions in Oman due to the PSC impact, partially offset by negative domestic price revisions. Revisions of previous estimates in 2015 were primarily price and price related.
(d) Sales of proved reserves in 2017 were primarily related to the sale of South Texas and non-core acreage in the Permian Basin. 2016 sales of proved reserves are related to Libya and Piceance. Sales of proved reserves in 2015 were related to the sale of Williston and exit from Iraq.
(e) Approximately 7 percent of the proved developed reserves at December 31, 2017, are nonproducing, primarily associated with Permian EOR.(f) Proved undeveloped reserves in the Permian Basin are supported by a five-year detailed field-level development plan, which includes the timing, location and capital
commitment of the wells to be drilled. Only proved undeveloped reserves which are reasonably certain to be drilled within five years of booking and are supported by a final investment decision to drill them are included in the development plan. A portion of the proved undeveloped reserves associated with international operations are expected to be developed beyond the five years and are tied to approved long-term development plans.

(Unaudited)
80
CAPITALIZED COSTSCapitalized costs relating to oil and gas producing activities and related accumulated DD&A were as follows:
United Latin Middle East/in millions States America North Africa TotalDecember 31, 2017
Proved properties $ 31,091 $ 3,194 $ 16,921 $ 51,206Unproved properties 2,094 53 55 2,202Total capitalized costs (a) 33,185 3,247 16,976 53,408Proved properties depreciation, depletion and amortization (14,609) (2,412) (13,196) (30,217)Unproved properties valuation (1,166) (27) — (1,193)Total Accumulated depreciation, depletion and amortization (15,775) (2,439) (13,196) (31,410)
Net capitalized costs $ 17,410 $ 808 $ 3,780 $ 21,998December 31, 2016
Proved properties $ 32,220 $ 3,029 $ 16,792 $ 52,041Unproved properties 2,548 28 54 2,630Total capitalized costs (a) 34,768 3,057 16,846 54,671Proved properties depreciation, depletion and amortization (15,085) (2,285) (13,067) (30,437)Unproved properties valuation (1,178) (27) — (1,205)Total Accumulated depreciation, depletion and amortization (16,263) (2,312) (13,067) (31,642)
Net capitalized costs $ 18,505 $ 745 $ 3,779 $ 23,029December 31, 2015
Proved properties $ 30,200 $ 2,955 $ 19,290 $ 52,445Unproved properties 1,376 27 1,077 2,480Total capitalized costs (a) 31,576 2,982 20,367 54,925Proved properties depreciation, depletion and amortization (12,544) (2,119) (15,718) (30,381)Unproved properties valuation (1,204) (27) (961) (2,192)Total Accumulated depreciation, depletion and amortization (13,748) (2,146) (16,679) (32,573)
Net capitalized costs $ 17,828 $ 836 $ 3,688 $ 22,352(a) Includes acquisition costs, development costs, capitalized interest and asset retirement obligations.
COSTS INCURREDCosts incurred in oil and gas property acquisition, exploration and development activities, whether capitalized or expensed, were
as follows:
United Latin Middle East/in millions States America North Africa TotalFOR THE YEAR ENDED DECEMBER 31, 2017
Property acquisition costs Proved properties $ 880 $ — $ 1 $ 881Unproved properties 32 — — 32
Exploration costs 163 39 54 256Development costs 1,981 157 582 2,720
Costs incurred $ 3,056 $ 196 $ 637 $ 3,889FOR THE YEAR ENDED DECEMBER 31, 2016
Property acquisition costs Proved properties $ 797 $ — $ 367 $ 1,164Unproved properties 1,265 — — 1,265
Exploration costs 13 6 52 71Development costs 1,417 75 670 2,162
Costs incurred $ 3,492 $ 81 $ 1,089 $ 4,662FOR THE YEAR ENDED DECEMBER 31, 2015
Property acquisition costs Proved properties $ 37 $ — $ 47 $ 84Unproved properties 25 — — 25
Exploration costs 74 2 66 142Development costs 2,880 170 1,461 4,511
Costs incurred $ 3,016 $ 172 $ 1,574 $ 4,762

(Unaudited)
81
RESULTS OF OPERATIONS
Occidental’s oil and gas producing activities for continuing operations, which exclude items such as asset dispositions, corporate overhead, interest and royalties, were as follows:
United Latin Middle East/in millions States America North Africa TotalFOR THE YEAR ENDED DECEMBER 31, 2017
Revenues (a) $ 4,047 $ 570 $ 3,253 $ 7,870Production costs (b) 1,474 155 950 2,579Other operating expenses 585 51 166 802Depreciation, depletion and amortization 2,549 124 596 3,269Taxes other than on income 273 9 — 282Exploration expenses 28 7 47 82
Pretax income (loss) before impairments and related items (862) 224 1,494 856Asset impairments and related items 397 4 — 401
Pretax income (loss) (1,259) 220 1,494 455Income tax expense (benefit) (c) (695) 120 690 115
Results of operations $ (564) $ 100 $ 804 $ 340FOR THE YEAR ENDED DECEMBER 31, 2016
Revenues (a) $ 3,135 $ 476 $ 2,766 $ 6,377Production costs (b) 1,335 170 982 2,487Other operating expenses 426 36 218 680Depreciation, depletion and amortization 2,793 156 626 3,575Taxes other than on income 240 10 — 250Exploration expenses 8 5 49 62
Pretax income (loss) before impairments and related items (1,667) 99 891 (677)Asset impairments and related items 1 9 61 71
Pretax income (loss) (1,668) 90 830 (748)Income tax expense (benefit) (c) (784) 65 336 (383)
Results of operations $ (884) $ 25 $ 494 $ (365)FOR THE YEAR ENDED DECEMBER 31, 2015
Revenues (a) $ 3,809 $ 589 $ 3,906 $ 8,304Production costs (b) 1,571 160 1,113 2,844Other operating expenses 511 29 238 778Depreciation, depletion and amortization 2,109 196 1,581 3,886Taxes other than on income 307 16 — 323Exploration expenses 18 2 16 36
Pretax income (loss) before impairments and related items (707) 186 958 437Asset impairments and related items 3,447 559 4,491 8,497
Pretax income (loss) (4,154) (373) (3,533) (8,060)Income tax expense (benefit) (c) (1,606) (61) 787 (880)
Results of operations $ (2,548) $ (312) $ (4,320) $ (7,180)
(a) Revenues are net of royalty payments. (b) Production costs are the costs incurred in lifting the oil and gas to the surface and include gathering, primary processing and field storage, but do not include DD&A,
royalties, income taxes, interest, general and administrative and other expenses.(c) U.S. federal income taxes reflect certain expenses related to oil and gas activities allocated for United States income tax purposes only, including allocated interest
and corporate overhead. These amounts are computed using the statutory rate in effect during the period, and do not consider the effects of changes to the U.S. federal income tax law by Tax Reform.

(Unaudited)
82
RESULTS PER UNIT OF PRODUCTION FOR CONTINUING OPERATIONS
United Latin Middle East/$/BOE (a) States America North Africa TotalFOR THE YEAR ENDED DECEMBER 31, 2017
Revenues (b) $ 36.50 $ 47.79 $ 33.51 $ 35.79Production costs 13.29 12.99 9.79 11.73Other operating expenses 5.28 4.28 1.71 3.65Depreciation, depletion and amortization 22.99 10.37 6.14 14.87Taxes other than on income 2.47 0.75 — 1.28Exploration expenses 0.25 0.59 0.48 0.37
Pretax income (loss) before impairments and related items (7.78) 18.81 15.39 3.89Asset impairments and related items 3.58 0.34 — 1.82
Pretax income (loss) (11.36) 18.47 15.39 2.07Income tax expense (benefit) (c) (6.27) 10.06 7.11 0.52
Results of operations $ (5.09) $ 8.41 $ 8.28 $ 1.55FOR THE YEAR ENDED DECEMBER 31, 2016
Revenues (b) $ 28.36 $ 36.87 $ 25.67 $ 27.59Production costs 12.07 13.16 9.12 10.76Other operating expenses 3.86 2.76 2.02 2.94Depreciation, depletion and amortization 25.27 12.12 5.81 15.46Taxes other than on income 2.17 0.77 — 1.08Exploration expenses 0.07 0.39 0.45 0.27
Pretax income (loss) before impairments and related items (15.08) 7.67 8.27 (2.92)Asset impairments and related items 0.01 0.70 0.57 0.31
Pretax income (loss) (15.09) 6.97 7.70 (3.23)Income tax expense (benefit) (c) (7.09) 5.03 3.12 (1.66)
Results of operations $ (8.00) $ 1.94 $ 4.58 $ (1.57)FOR THE YEAR ENDED DECEMBER 31, 2015
Revenues (b) $ 31.84 $ 43.83 $ 34.64 $ 33.78Production costs 13.13 11.93 9.87 11.57Other operating expenses 4.27 2.18 2.11 3.15Depreciation, depletion and amortization 17.63 14.54 14.02 15.81Taxes other than on income 2.57 1.19 — 1.32Exploration expenses 0.15 0.15 0.14 0.15
Pretax income (loss) before impairments and related items (5.91) 13.84 8.50 1.78Asset impairments and related items 28.81 41.60 39.82 34.56
Pretax income (loss) (34.72) (27.76) (31.32) (32.78)Income tax expense (benefit) (c) (13.42) (4.54) 6.98 (3.58)
Results of operations $ (21.30) $ (23.22) $ (38.30) $ (29.20)(a) Natural gas volumes have been converted to barrels of oil equivalent (BOE) based on energy content of six thousand cubic feet (Mcf) of gas to one barrel of oil.
Barrels of oil equivalence does not necessarily result in price equivalence. The price of natural gas on a barrel of oil equivalent basis is currently substantially lower than the corresponding price for oil and has been similarly lower for a number of years. For example, in 2017, the average prices of West Texas Intermediate (WTI) oil and New York Mercantile Exchange (NYMEX) natural gas were $51.34 per barrel and $3.08 per Mcf, respectively, resulting in an oil to gas ratio of 17 to 1.
(b) Revenues are net of royalty payments.(c) United States federal income taxes reflect certain expenses related to oil and gas activities allocated for U.S. income tax purposes only, including allocated interest
and corporate overhead. These amounts are computed using the statutory rate in effect during the period, and do not consider the effects of changes to the U.S. federal income tax law by Tax Reform.

(Unaudited)
83
STANDARDIZED MEASURE, INCLUDING YEAR-TO-YEAR CHANGES THEREIN, OF DISCOUNTED FUTURE NET CASH FLOWS
For purposes of the following disclosures, future cash flows were computed by applying to Occidental's proved oil and gas reserves the unweighted arithmetic average of the first-day-of-the-month price for each month within the years ended December 31, 2017, 2016 and 2015, respectively, unless prices were defined by contractual arrangements, and exclude escalations based upon future conditions. For the 2017, 2016 and 2015 disclosures, the calculated average West Texas Intermediate oil prices were $51.34, $42.75 and $50.28 per barrel, respectively. The calculated average Brent oil prices for 2017, 2016 and 2015 disclosures were $54.93, $44.49 and $55.57, per barrel, respectively. The calculated average Henry Hub natural gas prices for 2017, 2016 and 2015 were $3.08, $2.55 and $2.66 per MMBtu, respectively. The realized prices used to calculate future cash flows vary by producing area and market conditions. Future operating and capital costs were forecast using the current cost environment applied to expectations of future operating and development activities to develop and produce proved reserves at year end. Future income tax expenses were computed by applying, generally, year-end statutory tax rates (adjusted for permanent differences, tax credits, allowances and foreign income repatriation considerations) to the estimated net future pre-tax cash flows. The discount was computed by application of a 10 percent discount factor. The calculations assumed the continuation of existing economic, operating and contractual conditions at December 31, 2017, 2016 and 2015. Such assumptions, which are required by regulation, have not always proven accurate in the past. Other valid assumptions would give rise to substantially different results.
Standardized Measure of Discounted Future Net Cash Flowsin millions
United Latin Middle East/States America North Africa Total
AT DECEMBER 31, 2017 Future cash inflows $ 59,289 $ 3,961 $ 25,662 $ 88,912Future costs
Production costs and other operating expenses (29,318) (1,915) (9,349) (40,582)Development costs (a) (7,986) (238) (2,199) (10,423)
Future income tax expense (1,838) (543) (2,906) (5,287)Future net cash flows 20,147 1,265 11,208 32,620Ten percent discount factor (10,951) (423) (5,026) (16,400)
Standardized measure of discounted future net cash flows $ 9,196 $ 842 $ 6,182 $ 16,220AT DECEMBER 31, 2016
Future cash inflows $ 42,289 $ 2,551 $ 21,079 $ 65,919Future costs
Production costs and other operating expenses (23,574) (1,418) (8,101) (33,093)Development costs (a) (7,204) (134) (1,900) (9,238)
Future income tax expense — (244) (2,349) (2,593)Future net cash flows 11,511 755 8,729 20,995Ten percent discount factor (6,676) (202) (4,404) (11,282)
Standardized measure of discounted future net cash flows $ 4,835 $ 553 $ 4,325 $ 9,713AT DECEMBER 31, 2015
Future cash inflows $ 47,290 $ 3,416 $ 22,994 $ 73,700Future costs
Production costs and other operating expenses (25,386) (1,852) (9,041) (36,279)Development costs (a) (7,245) (178) (2,672) (10,095)
Future income tax expense (759) (392) (4,045) (5,196)Future net cash flows 13,900 994 7,236 22,130Ten percent discount factor (7,446) (293) (2,996) (10,735)
Standardized measure of discounted future net cash flows $ 6,454 $ 701 $ 4,240 $ 11,395(a) Includes asset retirement costs.

(Unaudited)
84
Changes in the Standardized Measure of Discounted Future Net Cash Flows From Proved Reserve Quantities in millions
For the years ended December 31, 2017 2016 2015Beginning of year $ 9,713 $ 11,395 $ 30,149
Sales and transfers of oil and gas produced, net of production costs and other operatingexpenses (5,362) (3,830) (4,952)
Net change in prices received per barrel, net of production costs and other operating expenses 7,598 (3,714) (36,081)Extensions, discoveries and improved recovery, net of future production and development
costs 1,534 811 854Change in estimated future development costs (1,283) (227) 3,091Revisions of quantity estimates 966 868 (1,782)Previously estimated development costs incurred during the period 1,643 1,662 3,327Accretion of discount 922 1,034 3,220Net change in income taxes (528) 1,367 13,046Purchases and sales of reserves in place, net 688 178 (2,334)Changes in production rates and other 329 169 2,857
Net change 6,507 (1,682) (18,754)
End of year $ 16,220 $ 9,713 $ 11,395
Average Sales PricesThe following table sets forth, for each of the three years in the period ended December 31, 2017, Occidental’s approximate
average sales prices in continuing operations.
United Latin Middle East/States America North Africa Total
2017 Oil — Average sales price ($/bbl) $ 47.91 $ 48.50 $ 50.38 $ 48.93NGLs — Average sales price ($/bbl) $ 23.67 $ — $ 18.05 $ 21.63Gas — Average sales price ($/mcf) $ 2.31 $ 5.08 $ 1.52 $ 1.84
2016 Oil — Average sales price ($/bbl) $ 39.38 $ 37.48 $ 38.25 $ 38.73NGLs — Average sales price ($/bbl) $ 14.72 $ — $ 15.01 $ 14.82Gas — Average sales price ($/mcf) $ 1.90 $ 3.78 $ 1.27 $ 1.53
2015 Oil — Average sales price ($/bbl) $ 45.04 $ 44.49 $ 49.65 $ 47.10NGLs — Average sales price ($/bbl) $ 15.35 $ — $ 17.88 $ 15.96Gas — Average sales price ($/mcf) $ 2.15 $ 5.20 $ 0.91 $ 1.49
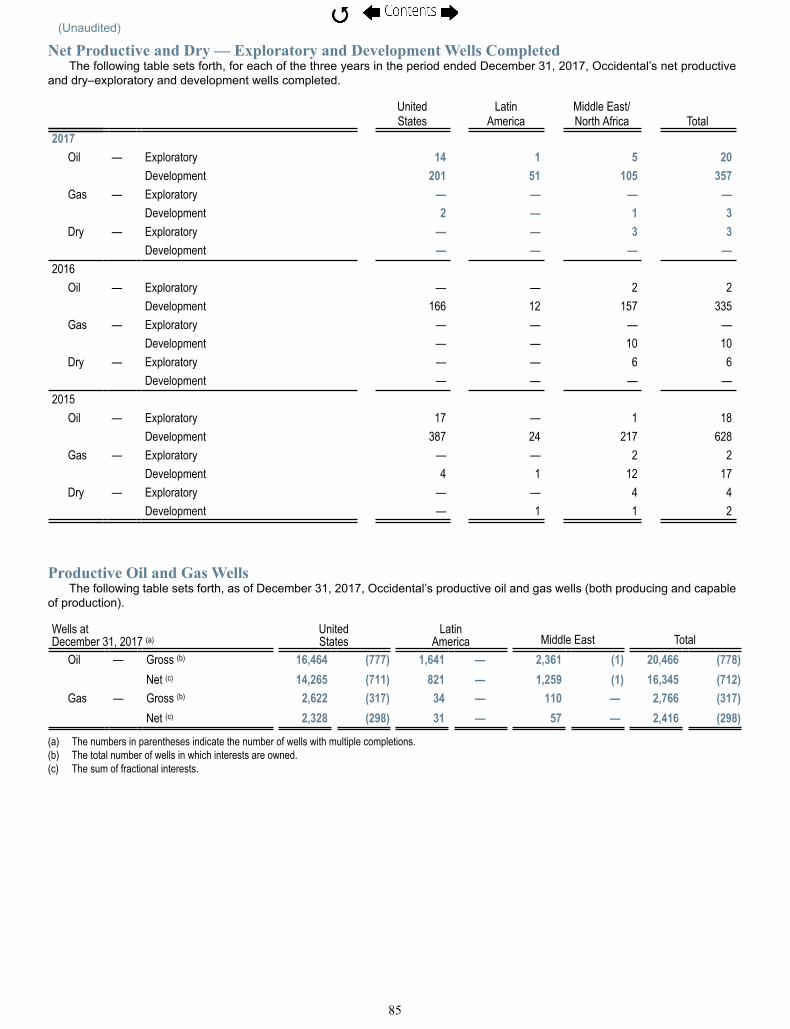
(Unaudited)
85
Net Productive and Dry — Exploratory and Development Wells CompletedThe following table sets forth, for each of the three years in the period ended December 31, 2017, Occidental’s net productive
and dry–exploratory and development wells completed.
United Latin Middle East/States America North Africa Total
2017 Oil — Exploratory 14 1 5 20
Development 201 51 105 357Gas — Exploratory — — — —
Development 2 — 1 3Dry — Exploratory — — 3 3
Development — — — —2016
Oil — Exploratory — — 2 2 Development 166 12 157 335
Gas — Exploratory — — — — Development — — 10 10
Dry — Exploratory — — 6 6 Development — — — —2015
Oil — Exploratory 17 — 1 18 Development 387 24 217 628
Gas — Exploratory — — 2 2 Development 4 1 12 17
Dry — Exploratory — — 4 4 Development — 1 1 2
Productive Oil and Gas WellsThe following table sets forth, as of December 31, 2017, Occidental’s productive oil and gas wells (both producing and capable
of production).
Wells atDecember 31, 2017 (a)
UnitedStates
LatinAmerica Middle East Total
Oil — Gross (b) 16,464 (777) 1,641 — 2,361 (1) 20,466 (778) Net (c) 14,265 (711) 821 — 1,259 (1) 16,345 (712)
Gas — Gross (b) 2,622 (317) 34 — 110 — 2,766 (317) Net (c) 2,328 (298) 31 — 57 — 2,416 (298)
(a) The numbers in parentheses indicate the number of wells with multiple completions.(b) The total number of wells in which interests are owned.(c) The sum of fractional interests.
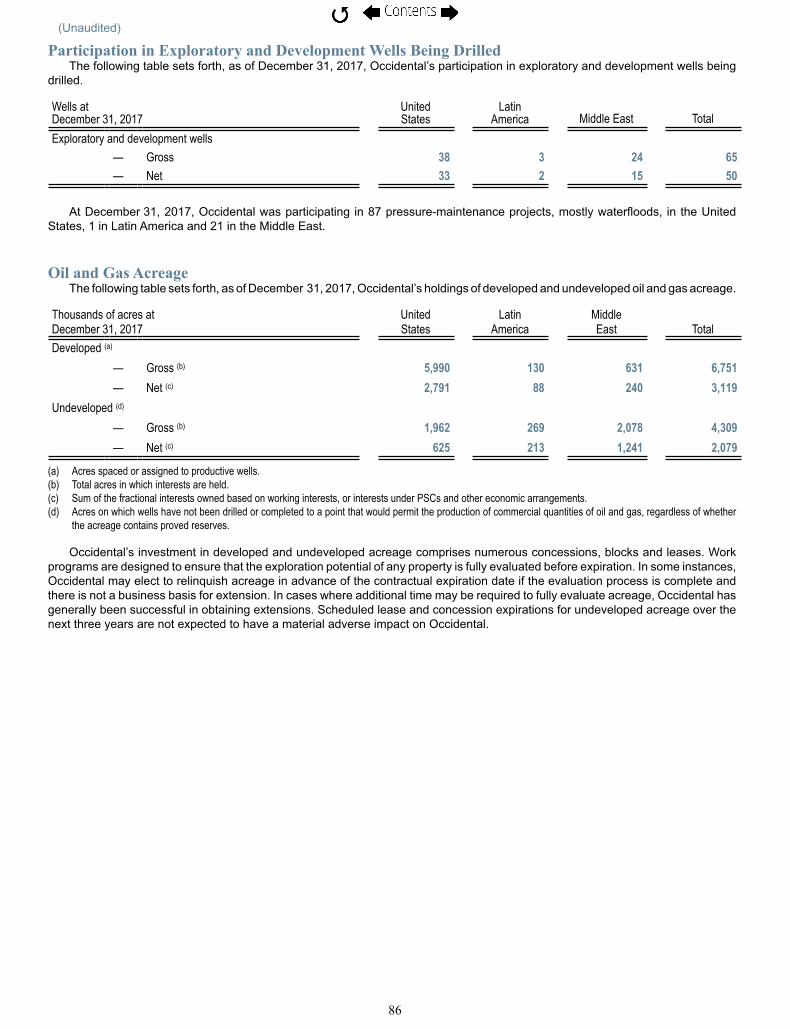
(Unaudited)
86
Participation in Exploratory and Development Wells Being DrilledThe following table sets forth, as of December 31, 2017, Occidental’s participation in exploratory and development wells being
drilled.
Wells atDecember 31, 2017
UnitedStates
LatinAmerica Middle East Total
Exploratory and development wells — Gross 38 3 24 65— Net 33 2 15 50
At December 31, 2017, Occidental was participating in 87 pressure-maintenance projects, mostly waterfloods, in the United States, 1 in Latin America and 21 in the Middle East.
Oil and Gas AcreageThe following table sets forth, as of December 31, 2017, Occidental’s holdings of developed and undeveloped oil and gas acreage.
Thousands of acres at United Latin MiddleDecember 31, 2017 States America East TotalDeveloped (a)
— Gross (b) 5,990 130 631 6,751— Net (c) 2,791 88 240 3,119
Undeveloped (d) — Gross (b) 1,962 269 2,078 4,309— Net (c) 625 213 1,241 2,079
(a) Acres spaced or assigned to productive wells.(b) Total acres in which interests are held.(c) Sum of the fractional interests owned based on working interests, or interests under PSCs and other economic arrangements.(d) Acres on which wells have not been drilled or completed to a point that would permit the production of commercial quantities of oil and gas, regardless of whether
the acreage contains proved reserves.
Occidental’s investment in developed and undeveloped acreage comprises numerous concessions, blocks and leases. Work programs are designed to ensure that the exploration potential of any property is fully evaluated before expiration. In some instances, Occidental may elect to relinquish acreage in advance of the contractual expiration date if the evaluation process is complete and there is not a business basis for extension. In cases where additional time may be required to fully evaluate acreage, Occidental has generally been successful in obtaining extensions. Scheduled lease and concession expirations for undeveloped acreage over the next three years are not expected to have a material adverse impact on Occidental.

(Unaudited)
87
Oil, NGLs and Natural Gas Production and Sales Volumes Per DayThe following tables set forth the production and sales volumes of oil, NGLs and natural gas per day for each of the three years
in the period ended December 31, 2017. The differences between the production and sales volumes per day are generally due to the timing of shipments at Occidental’s international locations where product is loaded onto tankers.
Production per Day (MBOE) 2017 2016 2015United States
Permian Resources 141 124 110Permian EOR 150 145 145South Texas and Other 13 33 73
Total 304 302 328Latin America 32 34 37Middle East/North Africa
Al Hosn Gas 71 64 35Dolphin 42 43 41Oman 95 96 89Qatar 58 65 66Other — 26 72
Total 266 294 303Total Production (MBOE) (a) 602 630 668(See footnote following the Sales Volumes from Ongoing Operations table)
Production per Day from Ongoing Operations (MBOE) 2017 2016 2015United States
Permian Resources 141 124 110Permian EOR 150 145 145Domestic and Other 5 4 6
Total 296 273 261Latin America 32 34 37Middle East
Al Hosn Gas 71 64 35Dolphin 42 43 41Oman 95 96 89Qatar 58 65 66
Total 266 268 231
Total Production Ongoing Operations (MBOE) (a) 594 575 529Sold domestic operations 8 29 67Sold or Exited MENA operations — 26 72
Total Production (MBOE) (a) 602 630 668(See footnote following the Sales Volumes from Ongoing Operations table)

(Unaudited)
88
Production per Day by Products 2017 2016 2015United States
Oil (MBBL)Permian Resources 85 77 71Permian EOR 113 108 110South Texas and Other 2 4 21
Total 200 189 202NGLs (MBBL)
Permian Resources 26 21 16Permian EOR 27 27 29South Texas and Other 2 5 10
Total 55 53 55Natural gas (MMCF)
Permian Resources 184 158 137Permian EOR 57 59 37South Texas and Other 53 144 250
Total 294 361 424Latin America
Oil (MBBL) 31 33 35Natural gas (MMCF) 7 8 10
Middle East/North AfricaOil (MBBL)
Al Hosn Gas 13 12 7Dolphin 7 7 7Oman 71 77 82Qatar 59 65 66Other — 7 32
Total 150 168 194NGLs (MBBL)
Al Hosn Gas 23 20 10Dolphin 8 8 8
Total 31 28 18Natural gas (MMCF)
Al Hosn Gas 211 190 109Dolphin 159 166 158Oman 138 115 44Other — 114 237
Total 508 585 548Total Production (MBOE) (a) 602 630 668(See footnote following the Sales Volumes from Ongoing Operations table)

(Unaudited)
89
Production per Day by Products from Ongoing Operations 2017 2016 2015United States
Oil (MBBL)Permian Resources 85 77 71Permian EOR 113 108 110Other Domestic 2 1 2
Total 200 186 183NGLs (MBBL)
Permian Resources 26 21 16Permian EOR 27 27 29
Total 53 48 45Natural gas (MMCF)
Permian Resources 184 158 137Permian EOR 57 59 37Other Domestic 18 18 23
Total 259 235 197Latin America
Oil (MBBL) 31 33 35Natural gas (MMCF) 7 8 10
Middle EastOil (MBBL)
Al Hosn Gas 13 12 7Dolphin 7 7 7Oman 71 77 82Qatar 59 65 66
Total 150 161 162NGLs (MBBL)
Al Hosn Gas 23 20 10Dolphin 8 8 8
Total 31 28 18Natural gas (MMCF)
Al Hosn Gas 211 190 109Dolphin 159 166 158Oman 138 115 44
Total 508 471 311
Total Production Ongoing Operations (MBOE) (a) 594 575 529Sold domestic operations 8 29 67Sold or Exited MENA operations — 26 72
Total Production (MBOE) (a) 602 630 668(See footnote following the Sales Volumes from Ongoing Operations table)

(Unaudited)
90
Sales Volumes per Day by Products 2017 2016 2015United States .
Oil (MBBL) 200 189 202NGLs (MBBL) 55 53 55Natural gas (MMCF) 294 361 424
Latin AmericaOil (MBBL) 32 34 35Natural gas (MMCF) 7 8 10
Middle East/North AfricaOil (MBBL)
Al Hosn Gas 13 12 7Dolphin 7 7 8Oman 72 77 82Qatar 58 66 67 Other — 7 36
Total 150 169 200NGLs (MBBL)
Al Hosn Gas 23 20 10Dolphin 8 8 8
Total 31 28 18Natural gas (MMCF) 508 585 548
Total Sales Volumes (MBOE) (a) 603 632 674(See footnote following the Sales Volumes from Ongoing Operations table)
Sales Volumes per Day by Products from Ongoing Operations 2017 2016 2015United States
Oil (MBBL) 200 186 183NGLs (MBBL) 53 48 45Natural gas (MMCF) 259 235 197
Latin AmericaOil (MBBL) 32 34 35Natural gas (MMCF) 7 8 10
Middle EastOil (MBBL)
Al Hosn Gas 13 12 7Dolphin 7 7 8Oman 72 77 82Qatar 58 66 67
Total 150 162 164NGLs (MBBL)
Al Hosn Gas 23 20 10Dolphin 8 8 8
Total 31 28 18Natural gas (MMCF) 508 471 311
Total Sales Ongoing Operations (MBOE) (a) 595 577 531Sold domestic operations 8 29 67Sold or Exited MENA operations — 26 76
Total Sales Volumes (MBOE) (a) 603 632 674
(a) Natural gas volumes have been converted to BOE based on energy content of six Mcf of gas to one barrel of oil. Barrels of oil equivalence does not necessarily result in price equivalence. The price of natural gas on a barrel of oil equivalent basis is currently substantially lower than the corresponding price for oil and has been similarly lower for a number of years. For example, in 2017, the average prices of WTI oil and NYMEX natural gas were $51.34 per barrel and $3.08, respectively, resulting in an oil to gas ratio of 17 to 1.

91
Schedule II – Valuation and Qualifying Accounts Occidental Petroleum Corporationand Subsidiaries
in millions
Additions
Balance atBeginningof Period
Charged toCosts andExpenses
Charged toOther
AccountsDeductions
(a)
Balance atEnd ofPeriod
2017 Allowance for doubtful accounts $ 558 $ 37 $ (2) $ 1 $ 594 (b)
Environmental, litigation, tax and other reserves $ 997 $ 45 $ 53 $ (160) $ 935 (c)
2016 Allowance for doubtful accounts $ 20 $ 543 $ (3) $ (2) $ 558 (b)
Environmental, litigation, tax and other reserves $ 479 $ 61 $ 531 $ (74) $ 997 (c)
2015 Allowance for doubtful accounts $ 19 $ 9 $ (3) $ (5) $ 20 (b)
Environmental, litigation, tax and other reserves $ 672 $ 119 $ 2 $ (314) $ 479 (c)
Note: The amounts presented represent continuing operations.(a) Primarily represents payments.(b) Of these amounts, $18 million, $17 million and $20 million in 2017, 2016 and 2015, respectively, are classified as current. (c) Of these amounts, $163 million, $197 million and $98 million in 2017, 2016 and 2015, respectively, are classified as current.
92
ITEM 9 CHANGES IN AND DISAGREEMENTS WITH ACCOUNTANTS ON ACCOUNTING AND FINANCIAL DISCLOSURE
Occidental had no changes in, and no disagreements with, Occidental's accountants on accounting and financial disclosure.
ITEM 9A CONTROLS AND PROCEDURESMANAGEMENT'S ANNUAL ASSESSMENT OF AND REPORT ON INTERNAL CONTROL OVER FINANCIAL REPORTING
The management of Occidental Petroleum Corporation and its subsidiaries (Occidental) is responsible for establishing and maintaining adequate internal control over financial reporting. Occidental’s system of internal control over financial reporting is designed to provide reasonable assurance regarding the reliability of financial reporting and the preparation of consolidated financial statements for external purposes in accordance with generally accepted accounting principles. Occidental’s internal control over financial reporting includes those policies and procedures that: (i) pertain to the maintenance of records that, in reasonable detail, accurately and fairly reflect the transactions and dispositions of Occidental’s assets; (ii) provide reasonable assurance that transactions are recorded as necessary to permit preparation of financial statements in accordance with generally accepted accounting principles, and that Occidental’s receipts and expenditures are being made only in accordance with authorizations of Occidental’s management and directors; and (iii) provide reasonable assurance regarding prevention or timely detection of unauthorized acquisition, use or disposition of Occidental’s assets that could have a material effect on the financial statements.
Because of its inherent limitations, internal control over financial reporting may not prevent or detect misstatements. Also, projections of any evaluation of effectiveness to future periods are subject to the risk that controls may become inadequate because of changes in conditions, or that the degree of compliance with the policies or procedures may deteriorate.
Management has assessed the effectiveness of Occidental’s internal control system as of December 31, 2017, based on the criteria for effective internal control over financial reporting described in Internal Control — Integrated Framework issued in 2013 by the Committee of Sponsoring Organizations of the Treadway Commission (COSO). Based on this assessment, management believes that, as of December 31, 2017, Occidental’s system of internal control over financial reporting is effective.
Occidental’s independent auditors, KPMG LLP, have issued an audit report on Occidental’s internal control over financial reporting.
DISCLOSURE CONTROLS AND PROCEDURESOccidental's President and Chief Executive Officer and its Senior Vice President and Chief Financial Officer supervised
and participated in Occidental's evaluation of its disclosure controls and procedures (as defined in Rules 13a-15(e) and 15d-15(e) under the Securities Exchange Act of 1934 (Exchange Act)) as of the end of the period covered by this report. Based upon that evaluation, Occidental's President and Chief Executive Officer and Senior Vice President and Chief Financial Officer concluded that Occidental's disclosure controls and procedures were effective as of December 31, 2017.
There has been no change in Occidental's internal control over financial reporting (as defined in Rules 13a-15(f) and 15d-15(f) under the Exchange Act) during the fourth quarter of 2017 that has materially affected, or is reasonably likely to materially affect, Occidental's internal control over financial reporting. The Report of Independent Registered Public Accounting Firm on Internal Control over Financial Reporting is set forth in Item 8. ITEM 9B OTHER INFORMATION
None.
Part III
ITEM 10 DIRECTORS, EXECUTIVE OFFICERS AND CORPORATE GOVERNANCEOccidental has adopted a Code of Business Conduct (Code). The Code applies to the President and Chief Executive
Officer; Senior Vice President and Chief Financial Officer; Vice President, Controller and Principal Accounting Officer; and persons performing similar functions (Key Personnel). The Code also applies to Occidental's directors, its employees and the employees of entities it controls. The Code is posted at www.oxy.com. Occidental will satisfy any disclosure requirement under Item 5.05 of Form 8-K regarding an amendment to, or waiver from, any provision of the Code with respect to its Key Personnel or directors by disclosing the nature of that amendment or waiver on its website.
The list of Occidental's executive officers and related information under "Executive Officers" set forth in Part I of this report is incorporated by reference herein. The information required by this Item 10 is incorporated herein by reference from Occidental’s definitive Proxy Statement, relating to its May 4, 2018, Annual Meeting of Stockholders, to be filed with the SEC pursuant to Regulation 14A within 120 days of December 31, 2017.

93
ITEM 11 EXECUTIVE COMPENSATIONThe information under the caption "Compensation Discussion and Analysis - Compensation Committee Report" shall not
be deemed to be "soliciting material," or to be "filed" with the SEC, or subject to Regulation 14A or 14C under the Exchange Act or to the liabilities of Section 18 of the Exchange Act, nor shall it be deemed incorporated by reference into any filing under the Securities Act of 1933. The information required by this Item 11 is incorporated herein by reference from Occidental’s definitive Proxy Statement, relating to its May 4, 2018, Annual Meeting of Stockholders, to be filed with the SEC pursuant to Regulation 14A within 120 days of December 31, 2017.
ITEM 12 SECURITY OWNERSHIP OF CERTAIN BENEFICIAL OWNERS AND MANAGEMENTThe information required by this Item 12 is incorporated herein by reference from Occidental’s definitive Proxy Statement,
relating to its May 4, 2018, Annual Meeting of Stockholders, to be filed with the SEC pursuant to Regulation 14A within 120 days of December 31, 2017.
ITEM 13 CERTAIN RELATIONSHIPS AND RELATED TRANSACTIONS AND DIRECTOR INDEPENDENCE
The information required by this Item 13 is incorporated herein by reference from Occidental’s definitive Proxy Statement, relating to its May 4, 2018, Annual Meeting of Stockholders, to be filed with the SEC pursuant to Regulation 14A within 120 days of December 31, 2017.
ITEM 14 PRINCIPAL ACCOUNTING FEES AND SERVICESThe information required by this Item 14 is incorporated herein by reference from Occidental’s definitive Proxy Statement,
relating to its May 4, 2018, Annual Meeting of Stockholders, to be filed with the SEC pursuant to Regulation 14A within 120 days of December 31, 2017.
Part IV ITEM 15 EXHIBITS AND FINANCIAL STATEMENT SCHEDULES
The agreements included as exhibits to this report are included to provide information about their terms and not to provide any other factual or disclosure information about Occidental or the other parties to the agreements. The agreements contain representations and warranties by each of the parties to the applicable agreement that were made solely for the benefit of the other agreement parties and:
• should not be treated as categorical statements of fact, but rather as a way of allocating the risk among the parties if those statements prove to be inaccurate;
• have been qualified by disclosures that were made to the other party in connection with the negotiation of the applicable agreement, which disclosures are not necessarily reflected in the agreement;
• may apply standards of materiality in a way that is different from the way investors may view materiality; and
• were made only as of the date of the applicable agreement or such other date or dates as may be specified in the agreement and are subject to more recent developments.
(a) (1) and (2). Financial Statements and Financial Statement ScheduleReference is made to Item 8 of the Table of Contents of this report, where these documents are listed.(a) (3). Exhibits
2.1*
Separation and Distribution Agreement by and between Occidental Petroleum Corporation and California Resources Corporation, dated November 25, 2014 (filed as Exhibit 2.1 to the Current Report on Form 8-K of Occidental dated November 25, 2014 (date of earliest event reported), filed December 1, 2014, File No. 1-9210).
3.(i)*
Restated Certificate of Incorporation of Occidental, dated November 12, 1999, and Certificates of Amendment thereto dated May 5, 2006, May 1, 2009, and May 2, 2014 (filed as Exhibit 4.1 to the Registration Statement on Form S-8 of Occidental dated May 1, 2015, File No. 333-203801).
3.(i)(a)*Certificate of Change of Location of Registered Office and of Registered Agent, dated July 6, 2001 (filed as Exhibit 3.1(i) to the Registration Statement on Form S-3 of Occidental dated February 6, 2002, File No. 333-82246).
3.(ii)*Bylaws of Occidental, as amended through October 8, 2015 (filed as Exhibit 3.(ii) to the Current Report on Form 8-K of Occidental dated October 8, 2015 (date of earliest event reported), filed October 14, 2015, File No. 1-9210).
4.1*Indenture, dated as of August 18, 2011, between Occidental Petroleum and The Bank of New York Mellon Trust Company, N.A. (filed as Exhibit 4.1 to the Current Report on Form 8-K of Occidental dated August 15, 2011 (date of earliest event reported), File No. 1-9210).
4.2*Indenture (Senior Debt Securities), dated as of April 1, 1998, between Occidental and The Bank of New York, as Trustee (filed as Exhibit 4 to the Registration Statement on Form S-3 of Occidental dated May 7, 1998, File No. 333-52053).
Instruments defining the rights of holders of other long-term debt of Occidental and its subsidiaries are not being filed since the total amount of securities authorized under each of such instruments does not exceed 10 percent of the total assets of Occidental and its subsidiaries on a consolidated basis. Occidental agrees to furnish a copy of any such instrument to the Commission upon request.

____________________________* Incorporated herein by reference
94
All of the Exhibits numbered 10.1 to 10.42 are management contracts and compensatory plans required to be identified specifically as responsive to Item 601(b)(10)(iii)(A) of Regulation S-K pursuant to Item 15(b) of Form 10-K.
10.1 Occidental Petroleum Corporation Savings Plan, Amended and Restated as of January 1, 2017.10.2 Occidental Petroleum Corporation Modified Deferred Compensation Plan, Amended and Restated as of January 1, 2018.10.3 Occidental Petroleum Corporation Supplemental Retirement Plan II, Amended and Restated as of January 1, 2018
10.4Form of Amendment to Occidental Petroleum Corporation 2015 Long-Term Incentive Plan Notice of Grant of Performance Retention Incentive Award.
10.5*Occidental Petroleum Corporation Executive Incentive Compensation Plan, Amended and Restated as of January 1, 2016. (filed as Exhibit 10.4 to the Annual Report on Form 10-K of Occidental for the fiscal year ended December 31, 2016, File No. 1-9210).
10.6*Form of Indemnification Agreement between Occidental and each of its directors and certain executive officers (filed as Exhibit B to the ProxyStatement of Occidental for its May 21, 1987, Annual Meeting of Stockholders, File No. 1-9210).
10.7*Occidental Petroleum Corporation Split Dollar Life Insurance Program and Related Documents (filed as Exhibit 10.2 to the Quarterly Reporton Form 10-Q of Occidental for the quarterly period ended September 30, 1994, File No. 1-9210).
10.8*Occidental Petroleum Corporation 2015 Long-Term Incentive Plan (filed as Exhibit 4.5 to the Registration Statement on Form S-8 of Occidental dated May 1, 2015, File No. 333-203801).
10.9*
Form of Occidental Petroleum Corporation Amendment to Senior Executive Supplemental Life Insurance Plan (Effective as of January 1, 1986, Amended and Restated Effective as of January 1, 1996) (filed as Exhibit 10.5 to the Quarterly Report on Form 10-Q of Occidental for the quarterly period ended September 30, 2008, File No. 1-9210).
10.10*
Form of Occidental Petroleum Corporation Amendment to Senior Executive Survivor Benefit Plan (Effective as of January 1, 1986, Amended and Restated Effective as of January 1, 1996) (filed as Exhibit 10.6 to the Quarterly Report on Form 10-Q of Occidental for the quarterly period ended September 30, 2008, File No. 1-9210).
10.11*Retention Payment and Separation Benefits Attachment (filed as Exhibit 10.6 to the Annual Report on Form 10-K of Occidental for the fiscal year ended December 31, 2012, File No. 1-9210).
10.12*First Amendment to the Occidental Petroleum Corporation 2015 Long-Term Incentive Plan (filed as Exhibit 10.1 to the Quarterly Report on Form 10-Q of Occidental for the quarterly period ended September 30, 2016, File No. 1-9210).
10.13*Form of 2016 Occidental Petroleum Corporation 2015 Long-Term Incentive Plan Common Stock Unit Award For Non-Employee Directors (filed as Exhibit 10.1 to the Quarterly Report on Form 10-Q of Occidental for the quarterly period ended June 30, 2016, File No. 1-9210).
10.14*Form of 2016 Occidental Petroleum Corporation 2015 Long-Term Incentive Plan Restricted Stock Unit Incentive Award (filed as Exhibit 10.3 to the Quarterly Report on Form 10-Q of Occidental for the quarterly period ended June 30, 2016, File No. 1-9210).
10.15*Form of 2016 Occidental Petroleum Corporation 2015 Long-Term Incentive Plan Total Shareholder Return Incentive Award (filed as Exhibit 10.4 to the Quarterly Report on Form 10-Q of Occidental for the quarterly period ended June 30, 2016, File No. 1-9210).
10.16*Occidental Petroleum Corporation 2015 Long-Term Incentive Plan Form of Notice of Grant of Restricted Stock Unit Incentive Award (filed as Exhibit 10.1 to the Quarterly Report on Form 10-Q of Occidental for the quarterly period ended March 31, 2016, File No. 1-9210).
10.17*Occidental Petroleum Corporation 2001 Incentive Compensation Plan (as amended through September 12, 2002) (filed as Exhibit 10.2 to the Quarterly Report on Form 10-Q of Occidental for the quarterly period ended September 30, 2002, File No. 1-9210).
10.18*Occidental Petroleum Corporation 2005 Long-Term Incentive Plan, as amended through October 13, 2010 (filed as Exhibit 10.1 to the Current Report on Form 8-K of Occidental dated October 13, 2010 (date of earliest event reported), filed October 14, 2010, File No. 1-9210).
10.19*Sign-on agreement with General Counsel (filed as Exhibit 10.4 to the Quarterly Report on Form 10-Q of Occidental for the quarterly period ended March 31, 2016, File No. 1-9210).
10.20*Description of financial counseling program (filed as Exhibit 10.50 to the Annual Report on Form 10-K of Occidental for the fiscal year ended December 31, 2003, File No. 1-9210).
10.21*Description of group excess liability insurance program (filed as Exhibit 10.51 to the Annual Report on Form 10-K of Occidental for the fiscal year ended December 31, 2003, File No. 1-9210).
10.22*
Description of Automatic Grant of Directors’ Restricted Stock Awards Pursuant to the Terms of the Occidental Petroleum Corporation 2005 Long-Term Incentive Plan (filed as Exhibit 10.37 to the Annual Report on Form 10-K of Occidental for the fiscal year ended December 31, 2013, File No. 1-9210).
10.23*Form of Restricted Stock Award for Non-Employee Directors under Occidental Petroleum Corporation 2005 Long-Term Incentive Plan (filed as Exhibit 10.1 to the Quarterly Report on Form 10-Q of Occidental for the fiscal quarter ended March 31, 2012, File No. 1-9210).
10.24*Form of Restricted Stock Unit Award for Non-Employee Directors under Occidental Petroleum Corporation 2005 Long-Term Incentive Plan (filed as Exhibit 10.2 to the Quarterly Report on Form 10-Q of Occidental for the fiscal quarter ended March 31, 2012, File No. 1-9210).
10.25*
Occidental Petroleum Corporation 2005 Long-Term Incentive Plan Restricted Stock Incentive Award Terms and Conditions (filed as Exhibit 10.1 to the Current Report on Form 8-K of Occidental dated July 10, 2013 (date of earliest event reported), filed July 16, 2013, File No. 1-9210).
10.26*
Occidental Petroleum Corporation 2005 Long-Term Incentive Plan Restricted Stock Incentive Award Terms and Conditions (Performance-Based) (filed as Exhibit 10.2 to the Current Report on Form 8-K of Occidental dated July 22, 2013 (date of earliest event reported), filed July 26, 2013, File No. 1-9210).
10.27*Occidental Petroleum Corporation Acknowledgment Letter dated April 29, 2013 (filed as Exhibit 10.8 to the Quarterly Report on Form 10-Q for the fiscal quarter ended June 30, 2013, File No. 1-9210).
10.28*Occidental Petroleum Corporation 2005 Long-Term Incentive Plan Restricted Stock Incentive Award Terms and Conditions (filed as Exhibit 10.9 to the Quarterly Report on Form 10-Q for the fiscal quarter ended June 30, 2013, File No. 1-9210).
10.29*Occidental Petroleum Corporation 2005 Long-Term Incentive Plan Common Stock Unit Award For Non-Employee Directors Grant Agreement (filed as Exhibit 10.1 to the Quarterly Report on Form 10-Q for the fiscal quarter ended March 31, 2014, File No. 1-9210).
10.30*Occidental Petroleum Corporation 2005 Long-Term Incentive Plan Common Stock Award For Non-Employee Directors Grant Agreement (filed as Exhibit 10.2 to the Quarterly Report on Form 10-Q for the fiscal quarter ended March 31, 2014, File No. 1-9210).
10.31*Form of Occidental Petroleum Corporation 2005 Long-Term Incentive Plan Nonstatutory Stock Option Award Terms and Conditions (filed as Exhibit 10.73 to the Annual Report on Form 10-K for the fiscal year ended December 31, 2014, File No. 1-9210).
____________________________* Incorporated herein by reference
95
10.32*Occidental Petroleum Corporation 2015 Long-Term Incentive Plan Form of Notice of Grant of Restricted Stock Unit Incentive Award (filed as Exhibit 10.4 to the Quarterly Report on Form 10-Q of Occidental for the fiscal quarter ended June 30, 2015, File No. 1-9210).
10.33*Occidental Petroleum Corporation 2015 Long-Term Incentive Plan Form of Notice of Grant of Performance Retention Incentive Award (filed as Exhibit 10.5 to the Quarterly Report on Form 10-Q of Occidental for the fiscal quarter ended June 30, 2015, File No. 1-9210).
10.34*Occidental Petroleum Corporation 2015 Long-Term Incentive Plan Form of Notice of Grant of Return on Assets Incentive Award (MENA) (filed as Exhibit 10.6 to the Quarterly Report on Form 10-Q of Occidental for the fiscal quarter ended June 30, 2015, File No. 1-9210).
10.35*Occidental Petroleum Corporation 2015 Long-Term Incentive Plan Form of Notice of Grant of Return on Assets Incentive Award (Total) (filed as Exhibit 10.7 to the Quarterly Report on Form 10-Q of Occidental for the fiscal quarter ended June 30, 2015, File No. 1-9210).
10.36*Occidental Petroleum Corporation 2015 Long-Term Incentive Plan Form of Notice of Grant of Return on Capital Employed Incentive Award (filed as Exhibit 10.8 to the Quarterly Report on Form 10-Q of Occidental for the fiscal quarter ended June 30, 2015, File No. 1-9210).
10.37*Occidental Petroleum Corporation 2015 Long-Term Incentive Plan Form of Notice of Grant of Total Shareholder Return Incentive Award (filed as Exhibit 10.9 to the Quarterly Report on Form 10-Q of Occidental for the fiscal quarter ended June 30, 2015, File No. 1-9210).
10.38*
Form of Occidental Petroleum Corporation 2015 Long-Term Incentive Plan Common Stock Unit Award For Non-Employee Directors Grant Agreement (filed as Exhibit 10.1 to the Quarterly Report on Form 10-Q of Occidental for the fiscal quarter ended June 30, 2015, File No. 1-9210).
10.39*
Form of Occidental Petroleum Corporation 2015 Long-Term Incentive Plan Common Stock Award For Non-Employee Directors Grant Agreement (filed as Exhibit 10.2 to the Quarterly Report on Form 10-Q of Occidental for the fiscal quarter ended June 30, 2015, File No. 1-9210).
10.40*Separation Agreement, effective June 27, 2017 (filed as Exhibit 10.3 to the Quarterly Report on Form 10-Q of Occidental for the quarterly period ended June 30, 2017, File No. 1-9210).
10.41*Sign-on agreement with Chief Financial Officer (filed as Exhibit 10.4 to the Quarterly Report on Form 10-Q of Occidental for the quarterly period ended June 30, 2017, File No. 1-9210).
10.42*Form of 2017 Occidental Petroleum Corporation 2015 Long-Term Incentive Plan Restricted Stock Unit Incentive Award (filed as Exhibit 10.1 to the Quarterly Report on Form 10-Q of Occidental for the quarterly period ended March 31, 2017, File No. 1-9210).
10.43*
Tax Sharing Agreement by and between Occidental Petroleum Corporation and California Resources Corporation, dated November 25, 2014 (filed as Exhibit 10.2 to the Current Report on Form 8-K of Occidental dated November 25, 2014 (date of earliest event reported), filed December 1, 2014, File No. 1-9210).
10.44*
Employee Matters Agreement by and between Occidental Petroleum Corporation and California Resources Corporation, dated November 25, 2014 (filed as Exhibit 10.3 to the Current Report on Form 8-K of Occidental dated November 25, 2014 (date of earliest event reported), filed December 1, 2014, File No. 1-9210).
10.45*
Transition Services Agreement by and between Occidental Petroleum Corporation and California Resources Corporation, dated November 25, 2014 (filed as Exhibit 10.4 to the Current Report on Form 8-K of Occidental dated November 25, 2014 (date of earliest event reported), filed December 1, 2014, File No. 1-9210).
10.46*
Area of Mutual Interest Agreement by and between Occidental Petroleum Corporation and California Resources Corporation, dated November 25, 2014 (filed as Exhibit 10.5 to the Current Report on Form 8-K of Occidental dated November 25, 2014 (date of earliest event reported), filed December 1, 2014, File No. 1-9210).
10.47*
Confidentiality and Trade Secret Protection Agreement by and between Occidental Petroleum Corporation and California Resources Corporation, dated November 25, 2014 (filed as Exhibit 10.6 to the Current Report on Form 8-K of Occidental dated November 25, 2014 (date of earliest event reported), filed December 1, 2014, File No. 1-9210).
10.48*
Intellectual Property License Agreement by and between Occidental Petroleum Corporation and California Resources Corporation, dated November 25, 2014 (filed as Exhibit 10.7 to the Current Report on Form 8-K of Occidental dated November 25, 2014 (date of earliest event reported), filed December 1, 2014, File No. 1-9210).
12Statement regarding computation of total enterprise ratios of earnings to fixed charges for each of the five years in the period ended December 31, 2017.
21 List of subsidiaries of Occidental at December 31, 2017.23.1 Consent of Independent Registered Public Accounting Firm.23.2 Consent of Independent Petroleum Engineers.31.1 Certification of CEO Pursuant to Section 302 of the Sarbanes-Oxley Act of 2002.31.2 Certification of CFO Pursuant to Section 302 of the Sarbanes-Oxley Act of 2002.32.1 Certifications of CEO and CFO Pursuant to Section 906 of the Sarbanes-Oxley Act of 2002.
99.1Ryder Scott Company Process Review of the Estimated Future Proved Reserves and Income Attributable to Certain Fee, Leasehold and Royalty Interests and Certain Economic Interests Derived Through Certain Production Sharing Contracts as of December 31, 2017.
ITEM 16 FORM 10-K SUMMARYNot applicable.

96
SIGNATURESPursuant to the requirements of Section 13 or 15(d) of the Securities Exchange Act of 1934, the registrant has duly caused this report to be signed on its behalf by the undersigned, thereunto duly authorized.
OCCIDENTAL PETROLEUM CORPORATION
By: /s/ Vicki Hollub Vicki Hollub President and Chief Executive Officer
Pursuant to the requirements of the Securities Exchange Act of 1934, this report has been signed below by the following persons on behalf of the registrant and in the capacities and on the dates indicated.
Title Date
/s/ Vicki Hollub President, Chief Executive OfficerFebruary 22, 2018Vicki Hollub and Director
/s/ Cedric W. Burgher Senior Vice President andFebruary 22, 2018Cedric W. Burgher Chief Financial Officer
/s/ Jennifer M. Kirk Vice President, ControllerFebruary 22, 2018Jennifer M. Kirk and Principal Accounting Officer
/s/ Spencer AbrahamDirector February 22, 2018Spencer Abraham
/s/ Howard I. AtkinsDirector February 22, 2018Howard I. Atkins
/s/ Eugene L. BatchelderChairman of the Board of Directors February 22, 2018Eugene L. Batchelder
/s/ John E. FeickDirector February 22, 2018John E. Feick
/s/ Margaret M. ForanDirector February 22, 2018Margaret M. Foran
/s/ Carlos M. GutierrezDirector February 22, 2018Carlos M. Gutierrez
/s/ William R. KlesseDirector February 22, 2018William R. Klesse
/s/ Jack B. MooreDirector February 22, 2018Jack B. Moore
/s/ Avedick B. PoladianDirector February 22, 2018Avedick B. Poladian
/s/ Elisse B. WalterDirector February 22, 2018Elisse B. Walter

(in millions, except per-share amounts)As of and for the years ended December 31, 2017 2016 2015 2014 2013
RESULTS OF OPERATIONS (a)
Net sales $ 12,508 $ 10,090 $ 12,480 $ 19,312 $ 20,170Income (loss) from continuing operations $ 1,311 $ (1,002 $ (8,146 $ (130 $ 4,932Net income (loss) attributable to common stock $ 1,311 $ (574 $ (7,829 $ 616 $ 5,903Basic earnings (loss) per common share from continuing operations $ 1.71 $ (1.31 $ (10.64 $ (0.18 $ 6.12Basic earnings (loss) per common share $ 1.71 $ (0.75 $ (10.23 $ 0.79 $ 7.33Diluted earnings (loss) per common share $ 1.70 $ (0.75 $ (10.23 $ 0.79 $ 7.32
FINANCIAL POSITION (a)
Total assets $ 42,026 $ 43,109 $ 43,409 $ 56,237 $ 69,415Long-term debt, net $ 9,328 $ 9,819 $ 6,855 $ 6,816 $ 6,911Stockholders’ equity $ 20,572 $ 21,497 $24,350 $34,959 $ 43,372
MARKET CAPITALIZATION (b) $ 56,357 $ 54,437 $ 51,632 $ 62,119 $ 75,699
CASH FLOW FROM CONTINUING OPERATIONS
Operating:Cash flow from continuing operations $ 4,996 $ 2,519 $ 3,254 $ 8,871 $ 10,229 Investing:Capital expenditures $ (3,599 $ (2,717 $ (5,272 $ (8,930 $ (7,357Cash provided (used) by all other investing activities, net $ 385 $ (2,025 $ (151 $ 2,686 $ 1,040Financing:Cash dividends paid $ (2,346 $ (2,309 $ (2,264 $ (2,210 $ (1,553Purchases of treasury stock $ (25 $ (22 $ (593 $ (2,500 $ (943Cash provided (used) by all other financing activities, net $ 28 $ 2,722 $ 4,341 $ 2,384 $ (437
DIVIDENDS PER COMMON SHARE $ 3.06 $ 3.02 $ 2.97 $ 2.88 $ 2.56
WEIGHTED AVERAGE BASIC SHARES OUTSTANDING (MILLIONS) 765 764 766 781 804
) ) ) ) )) ) ) ) ) ) )
) ) ) ) ) ) )
) ) ) ) ) ) ) ) ) )
)
Selected Financial Data
Note: The statements of income and cash flows related to California Resources have been treated as discontinued operations for all periods presented. The assets and liabilities of California Resources were removed from Occidental’s consolidated balance sheet as of November 30, 2014.(a) See the MD&A section of this report and the Notes to Consolidated Financial Statements for information regarding acquisitions and dispositions, discontinued operations
and other items affecting comparability.(b) Market capitalization is calculated by multiplying the year-end total shares of common stock outstanding, net of shares held as treasury stock, by the year-end closing stock price.
ON THE COVER: Occidental’s Permian Basin operations, Pecos County, Texas
Partner of Choice®
At Occidental, what we do is important — and how we do it is even more so. Our mission is to develop energy — safely, responsibly and profitably — to maximize shareholder value and remain a partner of choice for our stakeholders.
Occidental Petroleum Corporation (NYSE: OXY) is an international oil and gas exploration and production company with operations in the United States, Middle East and Latin America. Headquartered in Houston, Occidental is one of the largest U.S. oil and gas companies, based on equity market capitalization. Occidental’s midstream and marketing segment gathers, processes, transports, stores, purchases and markets hydrocarbons and other commodities. The company’s wholly owned subsidiary OxyChem manufactures and markets basic chemicals and vinyls.
Occidental is committed to safeguarding the environment, protecting the safety and health of employees and neighboring communities, and upholding high standards of social responsibility throughout its worldwide operations.
Auditors
KPMG LLP
Houston, Texas
Transfer Agent and Registrar
EQ Shareowner Services
P.O. Box 64874
St. Paul, MN 55164-0874
Toll free – (877) OXY-8166
International callers – (651) 450-4064
www.shareowneronline.com
Stock Exchange List ing
Occidental’s common stock is listed on the New York
Stock Exchange (NYSE). The symbol is OXY.
Div idend Reinvestment Plan
Occidental stockholders owning at least 25 shares
of common or preferred stock registered in their
name are eligible to purchase additional shares of
common stock under the Dividend Reinvestment
Plan by investing dividends on the greater of
25 shares or 10 percent of their share balance
of common or preferred stock and making optional
cash investments of up to $10,000 per month.
Information may be obtained from: EQ Shareowner
Services at www.shareowneronline.com.
Annual Cert i f icat ions
Occidental has filed the certifications of the chief
executive officer and chief financial officer required
by Section 302 of the Sarbanes-Oxley Act of 2002
as Exhibits 31.1 and 31.2 to its 2017 Annual Report on
Form 10-K filed with the Securities and Exchange
Commission. In addition, in 2017, Occidental
submitted to the NYSE a certificate of the chief
executive officer stating that she is not aware of
any violation by the company of the NYSE corporate
governance listing standards.
Current News and General Information
Information about Occidental, including news releases
and investor packages, is available at www.oxy.com.
twitter.com/Oxy_Petroleum
linkedin.com/company/Oxy
youtube.com/user/OxyUTube
This Annual Report is printed on Forest Stewardship
Council®-certified paper that contains wood from
well-managed forests, controlled sources and
recycled wood or fiber.
Additional Information
18030002_2_OXY_AR_2017_Cover_Flat_r18_EP1.indd 2 3/14/18 12:39 PM

Performance Innovation GrowthOccidental Petroleum Corporat ion 2017 Annual Report
OC
CID
EN
TAL
PE
TR
OL
EU
M C
OR
PO
RA
TIO
N | 2
01
7 A
NN
UA
L R
EP
OR
T
5 Greenway Plaza, Suite 110
Houston, Texas 77046-0521
(713) 215-7000
18030002_2_OXY_AR_2017_Cover_Flat_r18_EP1.indd 1 3/14/18 12:39 PM