performance improvement and cultural strategies for
TRANSCRIPT

Performance Improvement and
Cultural Strategies for Reducing
Healthcare Associated Infections
April 2012
Ottawa, Canada
Denise Murphy, RN, BSN, MPH, CIC
Vice President, Quality and Patient Safety
Main Line Health System
APIC President 2007

� Advanced facilitation, group process, team buildingand performance improvement skills
�Looking outside of healthcare (engineering) to understand how to hardwire process improvements
�Enhanced abilities to collaborate, negotiate and influence others at all levels of the organization
� Influence front line staff to see patient experience vs. task list!
Source: Excerpts from the Proceedings of APIC Futur e Summit 2007

D Murphy 4/2012Source: Don Wright, MD, MPH Deputy Assistant Secret ary for Healthcare Quality November 2010
D Murphy 4/2012
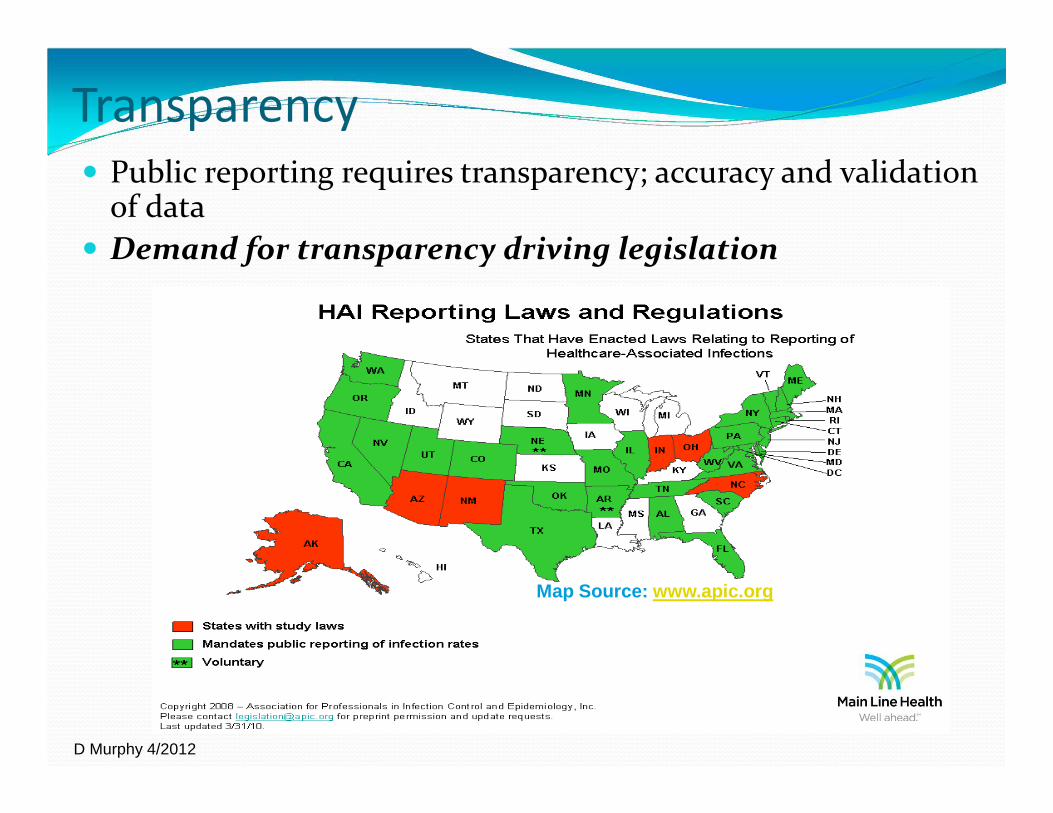
Transparency
� Public reporting requires transparency; accuracy and validation of data
� Demand for transparency driving legislation
Map Source: www.apic.org

D Murphy 4/2012
What is the role of culture in
improving performance (safety)?
� Culture is the set of beliefs , values and “norms” that shape the way organizations think and act…it’s the “way we do things around here.”
� Culture trumps strategy every time…so you must understand it before successful prevention measures can reduce harm.

D Murphy 4/2012
Power Distance is the extent to which
the less powerful expect and accept
that power is distributed unequally. PD
is a measure of interpersonal power or
influence superior-to-subordinate as
perceived by the subordinate.
Healthcare Perspective:
• Surgeons & anesthesiologists view low
• Nurses view as significantly higher
Actions:
Use organizational culture to reduce power distance found in professional cultures.
Source: from * Weick & Sutcliffe attribute of HRO’s:5. Deference to expertise.

D Murphy 4/2012
Creating a reliable culture means 3 things
1. Set clear expectations (about safety behaviors)
2. Educate and provide tools/skills needed to meet expectations
3. Hold everyone accountable
to work as a team focused on safety

D Murphy 4/2012
OptimizedOutcomes10-6
10-5
10-4
10-3
10-2
10-1
Reliability: Not By Process Design Alone
Process DesignEvidence-Based Best PracticesTechnology EnablersIntuitive Work EnvironmentResource AllocationContinuous Quality Improvement
Behavior AccountabilityBehavior ExpectationsKnowledge & SkillsReinforce & Build Accountability
Integrated With
© 2006 Healthcare Performance Improvement, LLC. ALL RIGHTS RESERVED.

D Murphy 4/2012
Focus on Implementation of and Compliance with Infection Prevention
bundles* with behavioral or “people” bundle
� CLABSI
� CAUTI
� VAP
� SSI
� PEOPLE BUNDLE (CULTURE)
“Bundles” are a group of evidence-based clinical measures or best practices proven to prevent harm.
Central LineInfections
HandHygiene
Surgical SiteInfections
Codes Outsidethe ICU
Culture��������������������������������������������

D Murphy 4/2012
“Clinical Bundle”
Process Design Behavioral Accountability
“People Bundle”
VAP Prevention
1. Elevation of the head of the bed to between 30 and 45 degrees
2. Daily “sedation vacation” and assessment of readiness to extubate
3. Peptic ulcer disease (PUD) prophylaxis
4. Deep venous thrombosis (DVT) prophylaxis (unless contraindicated)
© 2006 Healthcare Performance Improvement, LLC.
All rights reserved. Used with permission.

D Murphy 4/20120
10
20
30
40
50
60
70
80
90
100
% o
f re
spo
nd
ents
wit
hin
an
ICU
rep
ort
ing
go
od
tea
mw
ork
clim
ate
Teamwork Climate Across Michigan ICUs
No BSI 21% No BSI 44%No BSI 31%
No BSI = 5 months or more w/ zero
The strongest predictor of clinical excellence:caregivers feel comfortable speaking up if they perceive a problem with patient care
Source: CUSP Project PA 2010D. Murphy 4/2012

D Murphy 4/2012
PROCESS IMPROVEMENT

D Murphy 4/2012
Choosing your PI Initiatives
• Required Measures
�For accreditation: CMS Core Measures; Nat’l PS Goals
• Organizational Annual Operating Goals –� PI Initiatives for clinical effectiveness, efficiency
• Departmental Goals and Objectives

D Murphy 4/2012
Goals
� Must be SMART
�Specific
�Measurable
�Attainable
�Realistic
�Timely

D Murphy 4/2012
Team Roles
� Champion/Executive Sponsor: person who can remove barriers for team
� Leader: Process owner
� Facilitator: IP or person driving the improvement effort
� Member: key stakeholders, customers, front-line staff
� PI mentor: Assists the team in applying PI methodologies

D Murphy 4/2012
Performance Improvement
Methodology
FOCUS PDCA (PDSA) Model� Find a process to improve
� Organize a team (that knows the process)
� Clarify current knowledge of the process
� Understand sources of process variation
� Select the process improvement (solution)
� Plan the improvement and continue data collection
� Do: implement the improvement, collect data
� Check and study the results or impact of interventions
� Act to hold the gain and continue to improve the process
PA
DC
STD WORK
Perform
ance
Time
PA
DC
PA
DC
STD WORK
Perform
ance
Time

D Murphy 4/2012
Six Sigma =Six Sigma = VARIATIONVARIATION

D Murphy 4/2012
What is Lean/Six Sigma?
� Combination of Lean and Six Sigma methodologies for quality improvement
� A tool box of quality and performance improvement techniques
� Includes familiar tools such as
– Process mapping
– Voting on improvements
– FMEA: Failure Modes Effects Analysis
– Outcome & process measurement

D Murphy 4/2012
Six Sigma Basics
� Understanding the current process � Inputs>Activity>Outputs
� Identifying any variation in the process� Standard Deviation (Sigma)
� Identifying what is critical to quality of the product� As determined by customers
� Measuring the current process� Capability of the process to
create a positive outcome
� Identify where defects lie
� Re-defining the process to reduce defects and variation while meeting the customer’s expectations

D Murphy 4/2012
Methodology: DMAIC
� Define: Scope and align your project
� Measure: Establish the baseline
� Analyze: Determine the inputs that create your result Y= f (x)
� Improve: Optimize the process & input
� Control: Sustain the results

D Murphy 4/2012
�Y=f(x) � Understanding the function (f) of the combined
inputs (x) creates the output/result (Y)
� Inputs = steps in the process or process measures
� Y = the product/service the customer requires
�Example: Sterile technique(x1) + skin disinfection (x2) + hand hygiene (x3) = (Y) Infection free placement of a central venous catheter
D. Murphy 11/2011

D Murphy 4/2012
Introduction to Lean
� Lean is a business system devoted to continuous improvement.
� Lean focuses on managing processes and leading people in the workplace rather than traditional techniques of managing the business and leading from the back office.
D. Murphy 11/2011
D Murphy 4/2012
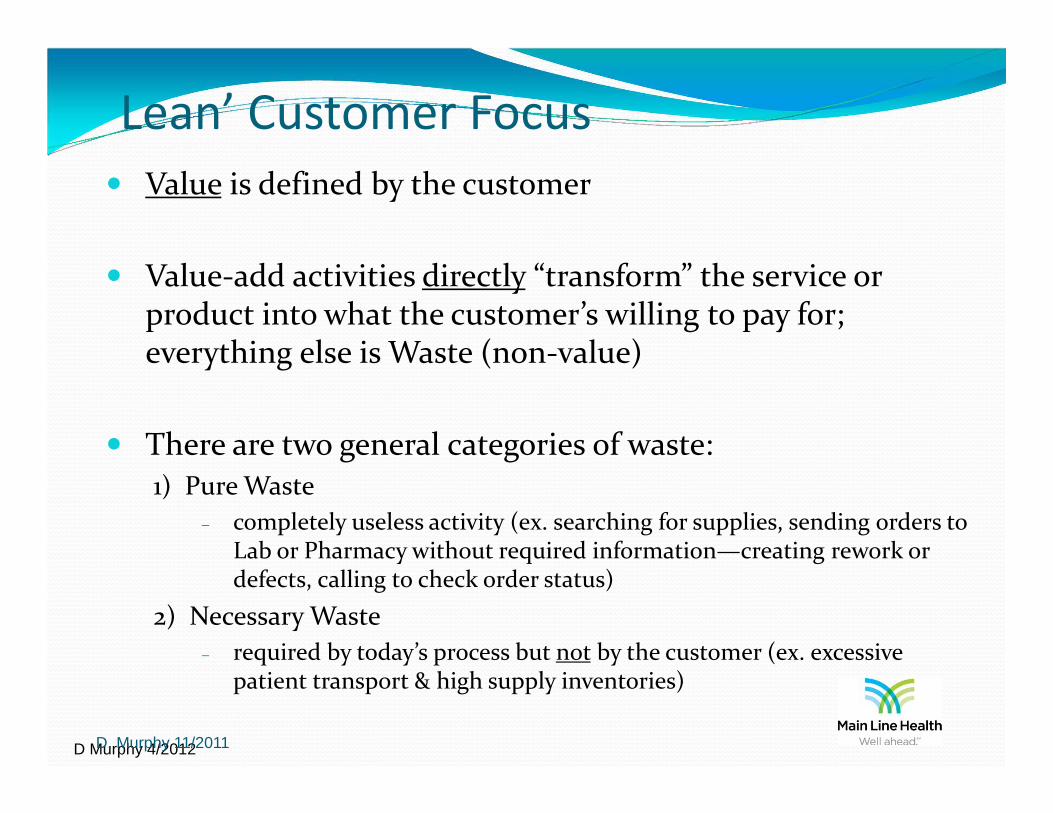
Lean’ Customer Focus
� Value is defined by the customer
� Value-add activities directly “transform” the service or product into what the customer’s willing to pay for; everything else is Waste (non-value)
� There are two general categories of waste:1) Pure Waste
– completely useless activity (ex. searching for supplies, sending orders to Lab or Pharmacy without required information—creating rework or defects, calling to check order status)
2) Necessary Waste
– required by today’s process but not by the customer (ex. excessive patient transport & high supply inventories)
D. Murphy 11/2011

D Murphy 4/2012
The 8 Operational Wastes
1. DEFECTS: (Wrong info. / Rework / Inaccurate information).
2. OVERPRODUCTION: (Duplication / Extra information).
3. WAITING: (Patients / Providers / Material).
4. NEGLECT OF HUMAN TALENT: (Unused Skills / Injuries / Unsafe Environment / Disrespect).
5. TRANSPORTATION: (Transactions / Transfer Moving)
6. INVENTORY: (Incomplete / Piles).
7. MOTION: (Finding Information / Double entry).
8. EXCESS PROCESSING: (Extra Steps / Quality Checks / Workarounds / Over processing / Inspection / Oversight) .
D. Murphy 11/2011

D Murphy 4/2012
Basic Lean Principles
• Flow: The continuous creation or delivery of value without interruption
• 5S: A complete system for workplace organization, including the process for sustainment
• Visual Management: Using visual signals for more effective communication
• Pull: Working or producing to downstream demand only
• Standard Work: Identifying the “best practice” and standardizing to it, stabilizing the process (predictability)
• 1 by 1: Reducing batch size to one whenever possible to support flow
• Zero Defects: Not sending product/service to downstream customer without meeting all requirements
D. Murphy 11/2011
D Murphy 4/2012
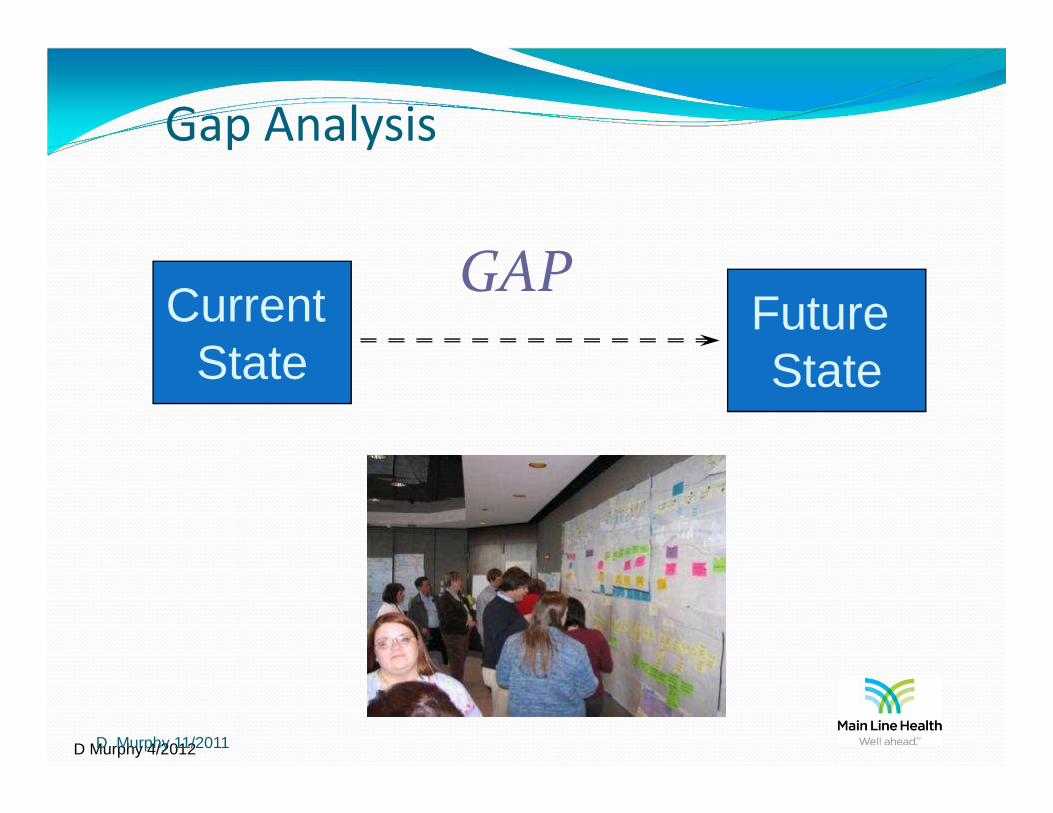
Gap Analysis
GAPCurrent
StateFuture State
D. Murphy 11/2011

D Murphy 4/2012
Process Mapping
� What is a process?�A series of steps or activities that transforms inputs into
outputs (desired result)
� Illustrates how steps and activities are linked
� Keeps focus on facts and actual process steps
� Assists with identifying waste, non-value added work
D. Murphy 11/2011

D Murphy 4/2012
Improve the Experience of a Patient with a
Central Venous Catheter
High Level Current State
Decision to Insert
Prep for Procedure
Insertion of Central
Line
Care & Maint.
Line Removal
Start IV support/
line?RN to page MD
NoWait
MD assessment of
periphrialsWait Choose MD
Communicate with person to
insert line
Walk and Search
WaitFind and
communicate with staff
Order for CLWait:
process order
Patient Education
AssessLOC
Patient sign paper consent
Wait: MD arrival
Evaluate patient
condition
Wait: Labs
Transport patient
Wait: staff
arrival
Gather supplies
Environmental prep
Patient prep
Wait: ultrasnd supplies
MD prepPatient Prep and Drape
Dry TimeMD prep: local
anesthesia
Wait for Local onset
Insertion TIME OUT
Secure catheter and
apply dressingCXRay
CXRVerification
Use or Not Use?
Documentation Checklist
Chart documentation
MD/RN
Monitor patient and site
Initial Dressing Applied (RN)
Documentation (RN)
Chest X-RayWait:
radiology
Wait: results
Wait for orders
Use of Line (lab draw, flush, med infusion)
WaitDaily
observation (dressing, cath)
Dressing changes
Infusion management
Decision for central
line removal
Wait for MD or Transport to IR
WaitAssemble equipment
New line placement if necessary (e.g. PICC)
Wait
Document assessment, placement, &
removal
Discontinue existing line
White = value added; Grey = non-value addedD. Murphy 11/2011
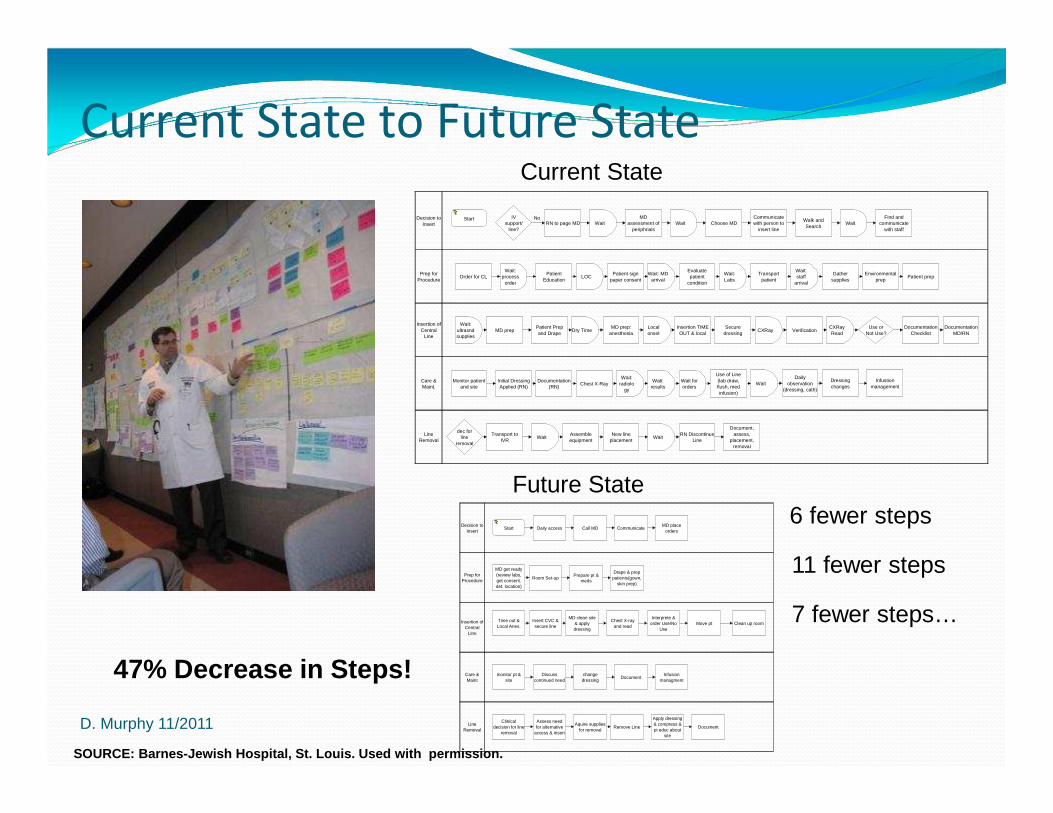
Current State to Future State
Decision to Insert
Prep for Procedure
Insertion of Central
Line
Care & Maint.
Line Removal
Start IV support/
line?RN to page MD
NoWait
MD assessment of
periphrialsWait Choose MD
Communicate with person to
insert line
Walk and Search
WaitFind and
communicate with staff
Order for CLWait:
process order
Patient Education
LOCPatient sign
paper consentWait: MD
arrival
Evaluate patient
condition
Wait: Labs
Transport patient
Wait: staff
arrival
Gather supplies
Environmental prep
Patient prep
Wait: ultrasnd supplies
MD prepPatient Prep and Drape
Dry TimeMD prep:
anesthesiaLocal onset
Insertion TIME OUT & local
Secure dressing
CXRay VerificationCXRay Read
Use or Not Use?
Documentation Checklist
Documentation MD/RN
Monitor patient and site
Initial Dressing Applied (RN)
Documentation (RN)
Chest X-RayWait:
radiology
Wati: results
Wait for orders
Use of Line (lab draw, flush, med infusion)
WaitDaily
observation (dressing, cath)
Dressing changes
Infustion management
dec for line
removal
Transport to IVR
WaitAssemble equipment
New line placement
WaitRN Discontinue
Line
Document, assess,
placement, removal
Current State
Future StateDecision to
Insert
Prep for Procedure
Insertion of Central
LIne
Care & Maint
Line Removal
Start Daily access Call MD CommunicateMD place
orders
MD get ready (review labs, get consent, det. location)
Room Set-upPrepare pt &
meds
Drape & prep patients(gown,
skin prep)
Time out & Local Anes.
Insert CVC & secure line
MD clean site & apply dressing
Chest X-ray and read
Interprete & order Use/No
UseMove pt Clean up room
monitor pt & site
Discuss continued need
change dressing
DocumentInfusion
managment
Clinical decision for line
removal
Assess need for alternative
access & insert
Aquire supplies for removal
Remove Line
Apply dressing & compress & pt educ about
site
Document
6 fewer steps
11 fewer steps
7 fewer steps…
47% Decrease in Steps!
D. Murphy 11/2011
SOURCE: Barnes-Jewish Hospital, St. Louis. Used wit h permission.

D Murphy 4/2012
Gap Analysis for Central Line VSA
� Lack of RN competency with peripheral sticks
� Lack of dedicated vascular access experts
� Lack of standard process for decision to insert and remove
� Lack of staff to assist physician with insertion
� Lack of standard work (SW) for line insertion/care� No SW for preparation/set up/break down
� No procedure checklist for line insertion
� No SW for documentation of line insertion, care and maintenance
� Supplies/Equipment not available as needed� Kits not standardized to contain what is needed
� Supplies not available at point of care
� Equipment (e.g. ultrasound) not readily available
D. Murphy 11/2011SOURCE: Barnes-Jewish Hospital, St. Louis. Used wit h permission.

D Murphy 4/2012
Gemba Walk
Observations
D. Murphy 11/2011SOURCE: Barnes-Jewish Hospital, St. Louis. Used wit h permission.

D Murphy 4/2012
Selecting Appropriate Goals (Targets)
� Start by evaluating how close you are to the chosen benchmark
� Targeting Zero:� Early on, may be theoretical goal to drive organization’s
commitment
� If at NHSN’s top quartile, aim for top decile (0.00)
� The decrease you select depends on your current rates� If worse than pooled mean a 50% decrease is reasonable
� If at top decile a 20% decrease is a real stretch
� Select a Realistic goal that stretches the team but is not completely unattainable
D. Murphy 11/2011

D Murphy 4/2012
Medical ICU
Primary Bloodstream Infection Rates Femoral Line Utilization % and
(2004-2005)
0
5
10
15
20
25
30
35
40
Jan
Feb
Mar
Apr
May Jun
Jul
Aug
Sep Oct
Nov
Dec Jan
Feb
Mar
Apr
May Jun
Jul
Aug
Sep Oct
Nov
Dec
2004 2005
BS
I Rat
e (p
er 1
000
line
days
)
0
2
4
6
8
10
12
14
16
18
20
Fem
oral
Lin
e U
tiliz
atio
n P
erce
nt
BSI Mean Fem Line % Mean
Femoral Line Tracking
Use your data to tell a story…demonstrate the need f or process change …
D. Murphy 11/2011
SOURCE: Barnes-Jewish Hospital, St. Louis. Used wit h permission.
OBSERVATION!!

D Murphy 4/2012
SCIP: Pre-intervention state: colorectal service
250200150100500-50-100-150
USLLSLAntibiotic Timing in Minutes
Process Capability Analysis for
Prophylactic antibiotic received within one hour pr ior to surgical incision
BJH SIP Colorectal Procedures vs. BJH Overall SIP P rocedures
40
50
60
70
80
90
100
JULY AUG SEPT OCT NOV DEC JAN FEB
2004 2005
Month
% o
f com
plia
nce
OVERALL COLON
COLORECTALSERVICE
Six Sigma: reducing variationSix Sigma: reducing variationSix Sigma: reducing variationSix Sigma: reducing variation
SOURCE: Barnes-Jewish Hospital, St. LouisD. Murphy 11/2011

D Murphy 4/2012Minutes
Frequency
250200150100500-50-100-150
7
6
5
4
3
2
1
0
Normal
Colorectal Surgical Service Antibiotic Timing August -Oct 2005
SCIP: Post-intervention state
Interventions:
• Colorectal pre-op and post-op standing orders were revised to reflect SCIP guidelines• Roles were clarified
�Surgeons are responsible for writing pre-op antibiotic orders�Anesthesia staff responsible for administration of pre-op antibiotics
• Antibiotic question was added to the surgical “time out”• A method was developed for rapid electronic feedback of individual service compliance rates to surgeons/anesthesiology
SIP 1 Prophylactic antibiotic received within one h our prior to surgical incision
40
50
60
70
80
90
100
JULY AUG SEPT OCT NOV DEC JAN FEB MAR APR MAY JUNE JULY AUG SEPT OCT
2004 2005
Month
% o
f com
plia
nce
OVERALL COLON
COLORECTALSERVICE
SOURCE: Barnes-Jewish Hospital, St. Louis
D. Murphy 11/2011
D Murphy 4/2012
What about HUMAN FACTORS?
� People
� Tools
� Work
� Environment
D. Murphy 11/2011

A Typical Patient Care Unit
Solution: Noise Reduction
ENVIRONMENT
Noise, Lighting,
Workflow, Equipment
DOBUTamineDOPamine
Solution: Visual Management
Solution: Workflow redesign

D Murphy 4/2012
ORANGE = CVC supplies and equipment
in all storerooms, carts, and bins! Barnes-Jewish Hospital. Used with permission.
Visual Management and
Workflow Redesign
D. Murphy 11/2011

D Murphy 4/2012
STOP INTERRUPTIONSDURING CVC INSERTION!
Barnes-Jewish Hospital. Used with permission.
HUMAN FACTORS ENGINEERING!D. Murphy 11/2011

D Murphy 4/2012
So, what’s myreal return oninvestment?
D. Murphy 11/2011

D Murphy 4/2012
CLABSI Rate Chart and Associated Process Improvements
0
2
4
6
8
10
12
14
1999 2000 2001 2002 2003 2004 2005 2006 2007
CLA
BS
I rat
e pe
r 10
00 c
athe
ter
days 2002
Gap analysis practice vs. guidelines
2003 Hand hygiene
2005 Dressing care Femoral line tracking SIR added to BIC scorecard
2006 BIC scorecard SIR goals lowered
2001 Point prevalence study CHG for line insertion
1999-2000BSI Module
2006 NHSN Pooled Mean
2007Scrub the Hub MRSA campaign
D. Murphy 11/2011
SOURCE: Barnes-Jewish Hospital, St. Louis. Used wit h permission.

D Murphy 4/2012
Healthcare Associated InfectionsBJC Excess Cost 1998 - 2006
$6,523,450
$7,940,969$8,396,472
$6,746,131
$5,969,464
$4,434,821$4,045,785
$3,297,882
$2,293,791
$0
$1,000,000
$2,000,000
$3,000,000
$4,000,000
$5,000,000
$6,000,000
$7,000,000
$8,000,000
$9,000,000
1998 1999 2000 2001 2002 2003 2004 2005 2006
Year
Exc
ess
Cos
t
D. Murphy 11/2011
SOURCE: Barnes-Jewish Hospital, St. Louis. Used wit h permission.

Process Improvement Project Results
Item Current annual cost Estimated annual future cost
CL catheter $14,938 $14,938*
CL Kit $15,732.64 + (single supplies $25.54 ea)
$21,560
CL Carts N/A $39,521.88
Ultrasound N/A $92,000
Cost of CA-BSI $2,088,000 (58 BSIs over 12 mos) $1,368,000 (38 BSIs, 1/3 reduction)
TOTAL $2,118,670 $1,536,019
Savings of $582,651
SOURCE: Barnes-Jewish Hospital, St. Louis. Used wit h permission.

Metric Baseline PostExperiment
Target
Standardized CL Kits
ICU 0%Nursing Division 0%
100% 100%
POC CL Supplies – Procedure Cart
ICU = 100%Nursing Division = 4.5%
100% 100%
# Types of CL kits >3 1 1
Motion (ft) toGather Supplies
Nursing Division = 3810 ft (.72 mi)
283 Ft Decrease by 25%
Time to Gather Supplies
Nursing Division = 30-45 min(~.5 FTE/year)
2.2 min(8 min to restock cart)
5 min
# Items to Gather 17 2 Decrease by 50%
Metrics for CVC Rapid Improvement Event
SOURCE: Barnes-Jewish Hospital, St. Louis. Used wit h permission.

D Murphy 4/2012
Main Line Health System (*All Patients)
CLABSI (#) April 2008 - March 2011
28
22
12
97
10
7
17
2623
18
10
Apr-Jun2008
Jul-Sep Oct-Dec
Jan-Mar
2009
Apr-Jun Jul-Sep Oct-Dec
Jan-Mar
2010
Apr-Jun Jul-Sep Oct-Dec
Jan-Mar
2011
*All Patients = all patients in house with central line
Data Source: NHSN via DMA Infection Control Database
75% decrease from second quarter of 2008 to first quarter 2011
Trend line: p< .001, R2 = 0.71
D. Murphy 11/2011

D Murphy 4/2012
Main Line Health System (Med/Surg/Tele Units)
CAUTI (#) April 2008 - March 2011
Data Source: NHSN via DMA Infection Control Database
22
26
16
11
7
1113
10
13
8
7
10
Apr-Jun'08
Jul-Sep Oct-Dec Jan-Mar'09
Apr-Jun Jul-Sep Oct-Dec Jan-Mar'10
Apr-Jun Jul-Sep Oct-Dec Jan-Mar'11
68% decrease from second quarter of 2008 to first quarter 2011
Trend line: not significant, R2 = 0.29
D. Murphy 11/2011

D Murphy 4/2012
Main Line Health System (Critical Care Units)
Ventilator Associated Pneumonia (#)
April 2008 through March 2011
18
30
4 3
63
6
3
15
2 5
5
Apr-Jun2008
Jul-Sep Oct-Dec
Jan-Mar
2009
Apr-Jun Jul-Sep Oct-Dec
Jan-Mar
2010
Apr-Jun Jul-Sep Oct-Dec
Jan-Mar
2011
67% decrease from second quarter of 2008 to first quarter 2011
Trend line: p< .05, R2 = 0.45
Data Source: NHSN via DMA Infection Control Database
D. Murphy 11/2011
D Murphy 4/2012
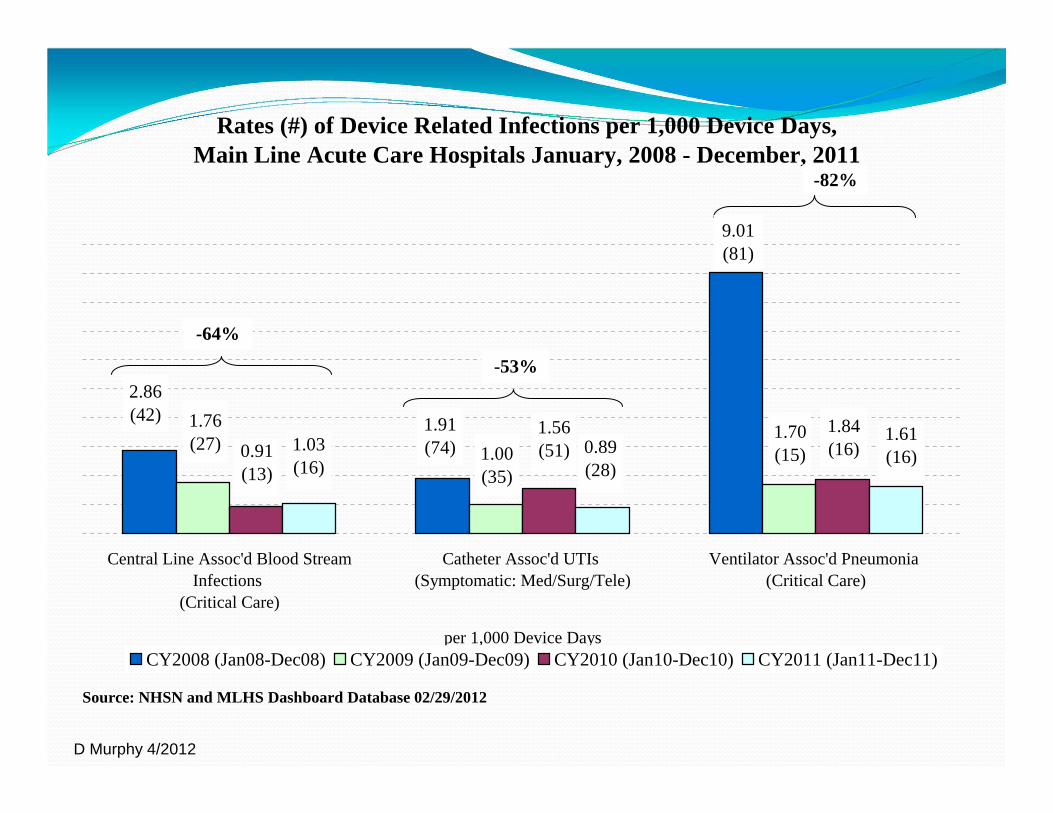
Rates (#) of Device Related Infections per 1,000 Device Days,Main Line Acute Care Hospitals January, 2008 - December, 2011
Central Line Assoc'd Blood StreamInfections
(Critical Care)
Catheter Assoc'd UTIs (Symptomatic: Med/Surg/Tele)
Ventilator Assoc'd Pneumonia (Critical Care)
per 1,000 Device DaysCY2008 (Jan08-Dec08) CY2009 (Jan09-Dec09) CY2010 (Jan10-Dec10) CY2011 (Jan11-Dec11)
Source: NHSN and MLHS Dashboard Database 02/29/2012
1.76(27) 0.91
(13)
1.70(15)
1.84(16)
-64%
-82%
2.86(42)
9.01(81)
1.00(35)
1.56(51)
-53%
1.91(74)1.03
(16)0.89(28)
1.61(16)

D Murphy 4/2012
Performance Improvement and Cultural Solutions:
� Performance is improved through good process design and behavioral accountability
� Understand role of PROCESS DESIGN and BEHAVIORAL ACCOUNTABILITY: there are different solution approaches
� Promote transparency and continuous learning; this allows for mistakes to be openly discussed without fear of penalty (culture of safety).
� Select process improvement tools and methods easy for teams to embrace
� View problems and solutions from a cultural and human factors perspective (People, Tools, Work, Environment).
� Provide real time data to leaders and front-line staff for the purpose of driving improvement.
� Demonstrate return on investment – ROI!
In summary…..