performance evaluation of a depth-of-interaction detector by use of position-sensitive pmt with a...
TRANSCRIPT

Performance evaluation of a depth-of-interaction detector by useof position-sensitive PMT with a super-bialkali photocathode
Yoshiyuki Hirano • Munetaka Nitta •
Naoko Inadama • Fumihiko Nishikido •
Eiji Yoshida • Hideo Murayama • Taiga Yamaya
Received: 28 January 2013 / Revised: 2 August 2013 / Accepted: 4 August 2013 / Published online: 21 August 2013
� Japanese Society of Radiological Technology and Japan Society of Medical Physics 2013
Abstract Our purpose in this work was to evaluate the
performance of a 4-layer depth-of-interaction (DOI)
detector composed of GSO crystals by use of a position-
sensitive photomultiplier tube (PMT) with a super-bialkali
photocathode (SBA) by comparing it with a standard bi-
alkali photocathode (BA) regarding the ability to identify
the scintillating crystals, energy resolution, and timing
resolution. The 4-layer DOI detector was composed of a
16 9 16 array of 2.9 9 2.9 9 7.5 mm3 GSO crystals for
each layer and an 8 9 8 multi-anode array type position-
sensitive PMT. The DOI was achieved by a reflector con-
trol method, and the Anger method was used for calcu-
lating interacting points. The energy resolution in full
width at half-maximum (FWHM) at 511 keV energy for
the top layer (the farthest from the PMT) was improved and
was 12.0 % for the SBA compared with the energy reso-
lution of 12.7 % for the BA. As indicators of crystal
identification ability, the peak-to-valley ratio and distance-
to-width ratio were calculated; the latter was defined as the
average of the distance between peaks per the average of
the peak width. For both metrics, improvement of several
percent was obtained; for example, the peak-to-valley ratio
was increased from 1.78 (BA) to 1.86 (SBA), and the
distance-to-width ratio was increased from 1.47 (BA) to
1.57 (SBA). The timing resolution (FWHM) in the bottom
layer was improved slightly and was 2.4 ns (SBA) com-
pared with 2.5 ns (BA). Better performance of the DOI
detector is expected by use of a super bialkali
photocathode.
Keywords DOI � Super bialkali photocathode �PET � GSO � In-beam PET
1 Introduction
Position-sensitive detectors composed of a scintillator
array and photomultiplier tubes (PMTs) are commonly
used for positron emission tomography (PET). In addition
to the X–Y plane, the interacting points between a scintil-
lator and gamma-rays in the Z direction can be identified by
depth-of-interaction (DOI) techniques. Many DOI methods
have been proposed based on the stagger arrangement [1–
3], pulse-shape discrimination [4–9], reflector control [10–
13], dual-end readout [14–19], individual readout [20], and
monolithic scintillators [21–26]. We developed a DOI
detector which consists of the LGSO scintillator array and
a multi-anode type, position-sensitive PMT (PS-PMT)
(H8500, Hamamatsu Photonics K.K., Hamamatsu, Japan)
[11]. This detector was designed for the small OpenPET
prototype. Yamaya et al. [27] proposed the concept of
OpenPET, which is able to visualize a physically opened
space between two detector rings and has in-beam PET as
one of its applications. We demonstrated the proof of
concept [28], and Yoshida et al. [29] have reported the
system performance.
In-beam PET is one technique for dose verification in
particle therapy. In in-beam PET, a target positron distri-
bution is generated by nuclear interactions between pri-
mary particles and irradiated tissue, and the activity of the
Y. Hirano (&) � N. Inadama � F. Nishikido � E. Yoshida �H. Murayama � T. Yamaya
Department of Biophysics Molecular Imaging Center,
National Institute of Radiological Sciences, 4-9-1 Anagawa,
Inage-ku, Chiba 263-8555, Japan
e-mail: [email protected]; [email protected]
M. Nitta
Chiba University, 1-33 Yayoicho, Inage-ku,
Chiba 263-8522, Japan
Radiol Phys Technol (2014) 7:57–66
DOI 10.1007/s12194-013-0231-4

positron emitters is very low compared with that in com-
mon PET scans using radioisotope tracers. Because of the
low radioactivity, natural radioactivity originating from176Lu (natural abundance: 2.59 %) [30–32] is dominant
among true coincidences in small OpenPET scanning.176Lu emits gamma rays with three energies, 307, 202, and
88 keV, followed by b- disintegration with a maximum
energy of 597 keV. The b- and one of the gamma rays
causes background coincidences. To avoid the background
coincidences, we intend to replace the LGSO scintillators
with GSO scintillators for a better OpenPET because the
latter has much less radioactive contamination. However,
using GSO scintillators is expected to the lower energy
resolution and spatial resolution due to the smaller quantity
of scintillation photons of GSO. Therefore, we decided to
employ the PS-PMT with a super-bialkali photocathode,
which has higher quantum efficiency than does a conven-
tional bialkali PS-PMT to compensate for the reduced
number of scintillation photons. Performance comparisons
between the super-bialkali type and the regular bialkali
type PMT were done for a DOI based on phoswich detector
[33] and several kinds of scintillators [34], where
improvements were observed.
Our purpose in this work was to evaluate the perfor-
mance of the DOI detectors composed of a 4-layer GSO
scintillator array with attached super bialkali (SBA) and
bialkali (BA) type PS-PMTs. The performance items
selected were the ability to identify the scintillating crys-
tals, the energy resolution, and the timing resolution for a
combination of GSO and SBA and a combination of GSO
and BA.
2 Materials and methods
2.1 The four-layer DOI detector
The four-layer DOI detector was composed of an array of
GSO scintillators (Hitachi Chemical Co., Tokyo, Japan) and
a PS-PMT (Fig. 1a). Each layer was a 16 9 16 array of
2.9 9 2.9 9 7.5 mm3 crystals. The DOI identification was
performed by a reflector control method. Specular reflectors
(Sumitomo 3 M, Ltd., Tokyo, Japan) were inserted at a
border of the scintillators, with different patterns for each
layer to project 3-dimensionally (3D) distributed interacting
points onto a 2D flood histogram. At the borders without the
reflector, crystals were glued in place by optical adhesive
(KE420, Shin-Etsu Chemical Co. Ltd., Tokyo, Japan). The
reflector patterns and the expected 2D position histograms
are depicted in Fig. 1b–j. The entire 4-layer scintillator array
was also covered with the specular reflector. The PS-PMT
was a multi-anode type (8 9 8 channels) H8500 PMT
(Hamamatsu Photonics K.K., Hamamatsu, Japan), and the
effective area was 49 9 49 mm2. The photocathodes were
super bialkali and bialkali types, with respective quantum
efficiencies at the GSO emission peak of about 30 and 20 %.
Quantum efficiencies and GSO emission spectra are shown
in Fig. 2, as obtained from the manufacturer’s specification
sheet and [35]. The geometric configurations for these two
types of PS-PMTs were equivalent except for the numbers of
dynodes: 8 dynodes for the super-bialkali type and 12
dynodes for the bialkali type. An interacting point was cal-
culated by a conventional method, an Anger method by the
use of a resistor chain, which provided signals at four cor-
ners, A, B, C, and D. Thus, interacting points in (X,Y) coor-
dinates were derived from the following formulas:
X ¼ �ðAþ CÞ þ ðBþ DÞðAþ Bþ C þ DÞ ;
Y ¼ �ðAþ BÞ þ ðC þ DÞðAþ Bþ C þ DÞ :
We evaluated the energy resolution, peak-to-valley
ratio, distance-to-width ratio, and timing resolution for
DOI detectors composed of GSO with the super-bialkali
type PS-PMT (SBA) and the bialkali type PS-PMT (BA).
2.2 Measurement of the detector performance
2.2.1 Experimental setups
We measured the energy spectra of each crystal, i.e., 1024
(4 layers 9 16 9 16) spectra, and we calculated the energy
resolutions for energies of 511, 662, 835, and 1275 keV for
both SBA and BA. The DOI detector was irradiated by
point sources of 22Na (511 and 1275 keV), 137Cs
(662 keV), and 54Mn (835 keV) placed at 10 cm from the
surface of the crystal array. The data for 22Na were used for
evaluation of the crystal separation ability, that is, the
peak-to-valley ratio and the distance-to-width ratio.
For timing resolution measurement, we employed a
BaF2 scintillator with a fast rise time (about 10 ns) as a
reference. The 22Na point source was placed between the
DOI and the BaF2 scintillator at 10 cm from the crystal
array surface and 3 cm from the BaF2 surface.
2.2.2 Acquisition systems
The data acquisition system consisted mainly of the nuclear
instrument modules (NIM) and the computer-automated
measurement and control system (Fig. 3). A dynode signal,
inverted and amplified linearly, entered the constant-fraction
discriminator (CFD), which provided a trigger signal for a
gate generator. A charge-sensitive analog-to-digital con-
vertor (ADC) was used for four anode signals, i.e., A, B, C,
and D in Sect. 2.1, and their incoming timings were adjusted
58 Y. Hirano et al.

by cable delays to be coincident with an incoming gate sig-
nal. During the conversion and ADC readout with a network
crate controller CC/NET (TOYO Corporation, Tokyo,
Japan), the trigger logic pulses were vetoed by the busy
signal coming from the crate controller. The anode signals
were amplified linearly to compensate for the low gain of the
SBA due to its small number of dynodes. For the BA, because
saturation of the ADCs was observed, the four corner signals
were attenuated before reaching the amplifier. Because
fluctuation of amplifier gain influences energy resolution, we
still used the amplifier even with the BA to get a fair com-
parison of the energy resolution. The voltage supplied to the
PS-PMTs was -1000 V.
As to the timing resolution measurement, we added a set
of NIM modules for the BaF2 scintillator with an attached
PMT (H6610, Hamamatsu Photonics K.K., Hamamatsu,
Japan). The anode output was divided into two signals: one
entered the CFD, and the other entered the ADC. A coin-
cidence between the BaF2 scintillator and the DOI detector
provided a trigger. Also, the trigger logic pulse was the
common start signal of a time-to-digital converter (TDC)
with 25 ps resolution time (C009, HOSHIN, Kawasaki,
Japan). The TDC stop signals were delayed CFD outputs of
the BaF2 scintillator and the DOI detector. A histogram of
subtraction of the two TDC outputs represented the timing
spectrum.
(c) 1st layer
(g) (h) (i) (j)
(d) 2nd layer (e) 3rd layer (f) 4th layer
Air
Optical adhesionReflector
PS-PMT (H8500)8 x 8 anode array
Expected 2D flood histogram
1st
2nd
3rd
4th
(b)(a)
Reflector
GSO:2.9 x 2.9 x 5.0mm3
16x16 array x 4 layers
Fig. 1 Conceptual scheme of the DOI detector (a). Expected pattern diagram of the DOI detector (b) and expected pattern diagrams of each
layer (c–f). Reflector arrangements of each layer (g–j)
0
5
10
15
20
25
30
35
40
200 300 400 500 600 700 800
Qua
ntum
Eff
icie
ncy
[%]
Wavelength [nm]
1.0
0.8
0.6
0.4
0.2
0.0
intensity [a.u]
QE (bialkali)QE (super bialkali)
emission spectrum (GSO)
Fig. 2 Quantum efficiencies (QEs) of super bialkali and standard
bialkali photocathodes (as specified by the Electron Tube Division,
Hamamatsu Photonics K.K.) and the emission spectrum of the GSO
scintillator [35]
A DOI detector with super bialkali photocathode 59

2.2.3 Analysis
Procedures for extracting the energy spectra of each crystal
were as follows: we gated an energy spectrum of all
acquired events for 511 keV, and we made a 2D flood
histogram with 512 9 512 matrix size. Then, we defined
the circular regions of interest (ROIs) within a 10-pixel
radius on each hot spot. We subsequently constructed
energy spectra inside these ROIs. Finally, the 511-keV
photopeaks were fitted by use of a Gaussian function and
an exponential function assumed as the background, and
the full width at half-maximum (FWHM) was calculated
for individual crystals. These ROIs were also used for
energies of 662, 835, and 1275 keV. The mean and stan-
dard deviation (SD) of each layer were evaluated; peak-to-
valley ratios were defined as
peak-to-valley ratio ¼ peak height
valley height;
and were calculated by the following process: we defined
polygon of ROIs including a row of 1st and 2nd (3rd and
4th) layer crystals. In this detector, crystal responses
originating from two different layers were aligned in a row.
From the profiles of 16 rows, the peak-to-valley ratio, a
ratio between the peak value and the minimum value
between neighboring peaks, was calculated. In addition, to
evaluate the crystal separation ability, we employed
another metric described in [36]: the distance-to-width
ratio, defined by the following formula:
distance -to -width ratio =average of distance between peaks
average of width ðFWHM):
A higher value of the distance-to-width ratio means
better separation ability. This metric includes two
parameters, distance and width. The distance and width
were derived from fitting of multi-Gaussian functions to a
profile. Distance-to-width and peak-to-valley ratios of SBA
and BA were compared for each row. Also, the total mean
and SD were evaluated.
Timing spectra for individual crystals were constructed
by use of events inside the circular ROI and the 3-sigma
energy window for 511 keV, determined by fits in the
energy spectra analysis. We calculated the timing resolu-
tion in FWHM (ns) by fitting with a Gaussian function to
the timing spectrum, and the mean and SD for each layer
were evaluated.
3 Results
3.1 2D flood histograms
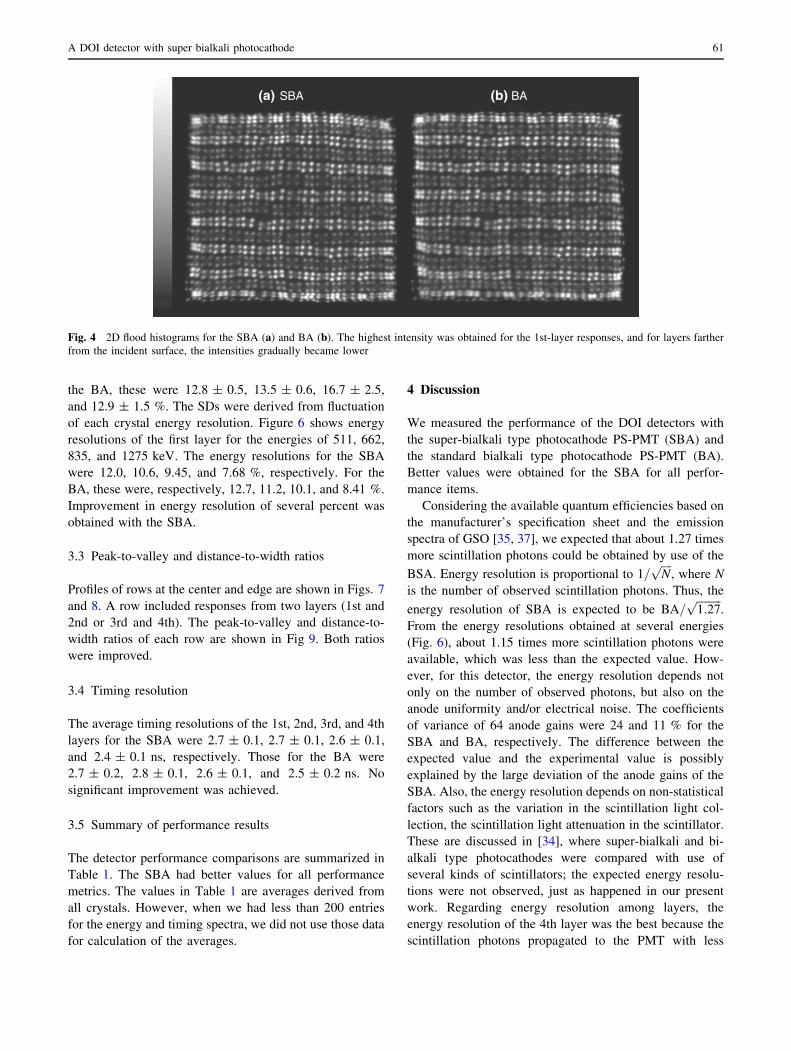
The 2D flood histograms of the SBA and BA are shown in
Fig. 4. Clear separation of hot spots corresponding to
crystals was obtained for both types. Each spot for the SBA
was slightly sharper than that for the BA, especially at the
edges. The highest intensity was obtained for the first layer
responses, and for layers farther from the incident surface,
the intensities gradually became lower.
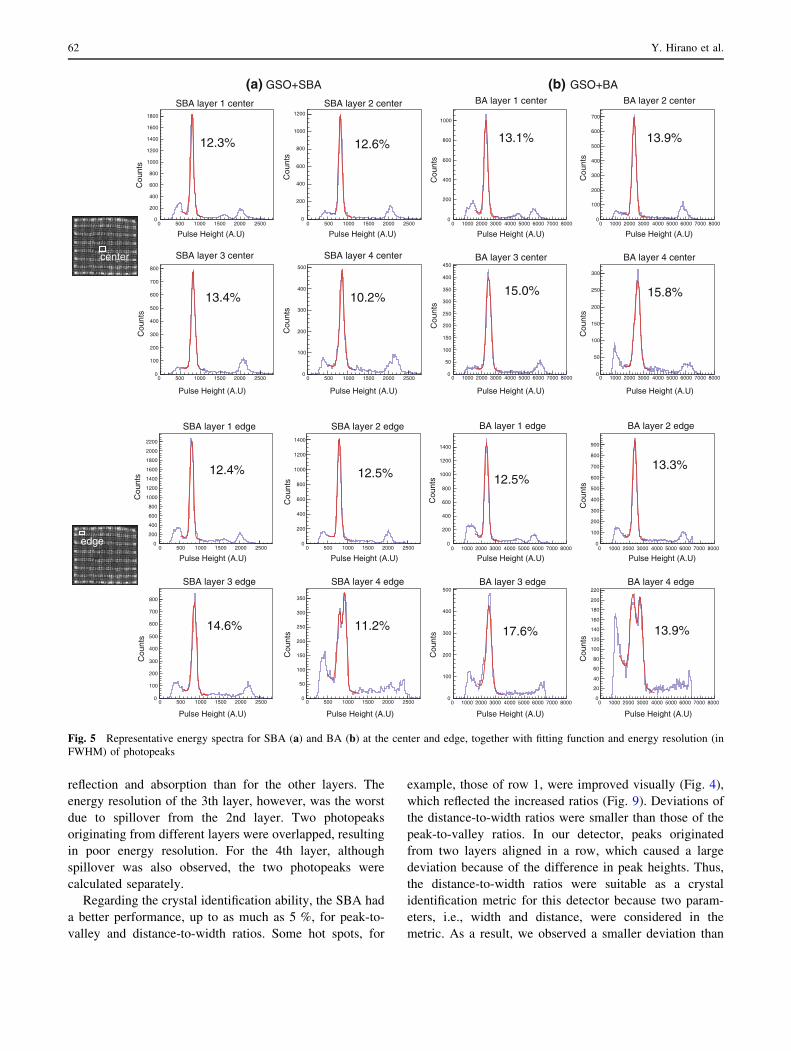
3.2 Energy spectrum and resolution
Representative 22Na energy spectra of each layer together
with fit results are shown in Fig. 5. The energy resolutions
in FWHM (%) are also described on the photopeaks.
Energy resolutions (mean ± SD) at 511 keV of the 1st,
2nd, 3rd and 4th layers for the SBA were 12.1 ± 0.4,
12.7 ± 0.4, 15.5 ± 1.8, and 11.5 ± 1.1, respectively. For
AmplifierAttenuator(for BA)
Attenuator(for BA)
ADC
GateGenerator
InvertedAmplifier
DOIdetector
CC/NETCFD
veto
dynode
anode delay
gate
Amplifier ADC
Coincidence
InvertedAmplifier
DOIdetector
CC/NET
TDCCFD
CFDDividerBaF2
veto
dynode
anode delay
gate
startstopstop
GateGenerator
Na-22
Na-22
(a) Measurment of energy resolution, peak-to-valley ratios, and distance-to-width ratios
(b) Measurment of timing resolution
10cm
10cm
3cm
Fig. 3 Electrical setups for
measurements of energy
resolution and crystal
identification performance
(a) and timing resolution (b).
The difference between the
measurement systems for the
SBA and for the BA was the
installation of an attenuator for
measurements of the latter
60 Y. Hirano et al.
the BA, these were 12.8 ± 0.5, 13.5 ± 0.6, 16.7 ± 2.5,
and 12.9 ± 1.5 %. The SDs were derived from fluctuation
of each crystal energy resolution. Figure 6 shows energy
resolutions of the first layer for the energies of 511, 662,
835, and 1275 keV. The energy resolutions for the SBA
were 12.0, 10.6, 9.45, and 7.68 %, respectively. For the
BA, these were, respectively, 12.7, 11.2, 10.1, and 8.41 %.
Improvement in energy resolution of several percent was
obtained with the SBA.
3.3 Peak-to-valley and distance-to-width ratios
Profiles of rows at the center and edge are shown in Figs. 7
and 8. A row included responses from two layers (1st and
2nd or 3rd and 4th). The peak-to-valley and distance-to-
width ratios of each row are shown in Fig 9. Both ratios
were improved.
3.4 Timing resolution
The average timing resolutions of the 1st, 2nd, 3rd, and 4th
layers for the SBA were 2.7 ± 0.1, 2.7 ± 0.1, 2.6 ± 0.1,
and 2.4 ± 0.1 ns, respectively. Those for the BA were
2.7 ± 0.2, 2.8 ± 0.1, 2.6 ± 0.1, and 2.5 ± 0.2 ns. No
significant improvement was achieved.
3.5 Summary of performance results
The detector performance comparisons are summarized in
Table 1. The SBA had better values for all performance
metrics. The values in Table 1 are averages derived from
all crystals. However, when we had less than 200 entries
for the energy and timing spectra, we did not use those data
for calculation of the averages.
4 Discussion
We measured the performance of the DOI detectors with
the super-bialkali type photocathode PS-PMT (SBA) and
the standard bialkali type photocathode PS-PMT (BA).
Better values were obtained for the SBA for all perfor-
mance items.
Considering the available quantum efficiencies based on
the manufacturer’s specification sheet and the emission
spectra of GSO [35, 37], we expected that about 1.27 times
more scintillation photons could be obtained by use of the
BSA. Energy resolution is proportional to 1=ffiffiffiffi
Np
, where N
is the number of observed scintillation photons. Thus, the
energy resolution of SBA is expected to be BA=ffiffiffiffiffiffiffiffiffi
1:27p
.
From the energy resolutions obtained at several energies
(Fig. 6), about 1.15 times more scintillation photons were
available, which was less than the expected value. How-
ever, for this detector, the energy resolution depends not
only on the number of observed photons, but also on the
anode uniformity and/or electrical noise. The coefficients
of variance of 64 anode gains were 24 and 11 % for the
SBA and BA, respectively. The difference between the
expected value and the experimental value is possibly
explained by the large deviation of the anode gains of the
SBA. Also, the energy resolution depends on non-statistical
factors such as the variation in the scintillation light col-
lection, the scintillation light attenuation in the scintillator.
These are discussed in [34], where super-bialkali and bi-
alkali type photocathodes were compared with use of
several kinds of scintillators; the expected energy resolu-
tions were not observed, just as happened in our present
work. Regarding energy resolution among layers, the
energy resolution of the 4th layer was the best because the
scintillation photons propagated to the PMT with less
(a) SBA (b) BA
Fig. 4 2D flood histograms for the SBA (a) and BA (b). The highest intensity was obtained for the 1st-layer responses, and for layers farther
from the incident surface, the intensities gradually became lower
A DOI detector with super bialkali photocathode 61
reflection and absorption than for the other layers. The
energy resolution of the 3th layer, however, was the worst
due to spillover from the 2nd layer. Two photopeaks
originating from different layers were overlapped, resulting
in poor energy resolution. For the 4th layer, although
spillover was also observed, the two photopeaks were
calculated separately.
Regarding the crystal identification ability, the SBA had
a better performance, up to as much as 5 %, for peak-to-
valley and distance-to-width ratios. Some hot spots, for
example, those of row 1, were improved visually (Fig. 4),
which reflected the increased ratios (Fig. 9). Deviations of
the distance-to-width ratios were smaller than those of the
peak-to-valley ratios. In our detector, peaks originated
from two layers aligned in a row, which caused a large
deviation because of the difference in peak heights. Thus,
the distance-to-width ratios were suitable as a crystal
identification metric for this detector because two param-
eters, i.e., width and distance, were considered in the
metric. As a result, we observed a smaller deviation than
0 500 1000 1500 2000 2500
0 500 1000 1500 2000 2500
0 500 1000 1500 2000 2500
0 500 1000 1500 2000 2500
0
200
400
600
800
1000
1200
1400
1600
1800
SBA layer 1 center SBA layer 2 center
SBA layer 3 center SBA layer 4 center
BA layer 1 center BA layer 2 center
BA layer 3 center BA layer 4 center
SBA layer 1 edge SBA layer 2 edge
SBA layer 3 edge SBA layer 4 edge
0
200
400
600
800
1000
1200
0
100
200
300
400
500
600
700
800
0
100
200
300
400
500
0 1000 2000 3000 4000 5000 6000 7000 8000 0 1000 2000 3000 4000 5000 6000 7000 8000
0 1000 2000 3000 4000 5000 6000 7000 8000 0 1000 2000 3000 4000 5000 6000 7000 8000
0
200
400
600
800
1000
0
100
200
300
400
500
600
700
0
50
100
150
200
250
300
350
400
450
0
50
100
150
200
250
300
(a) GSO+SBA (b) GSO+BA
0
200
400
600
800
1000
1200
1400
1600
1800
2000
2200
0
200
400
600
800
1000
1200
1400
0
100
200
300
400
500
600
700
800
0
50
100
150
200
250
300
350
0
200
400
600
800
1000
1200
1400
0
100
200
300
400
500
600
700
800
900
0
100
200
300
400
500
0
20
40
60
80
100
120
140
160
180
200
220
12.3% 13.1%
13.4% 15.0%10.2% 15.8%
12.6% 13.9%
12.5%13.3%
17.6% 13.9%
12.4% 12.5%
14.6% 11.2%
0 500 1000 1500 2000 2500
0 500 1000 1500 2000 2500
0 500 1000 1500 2000 2500
0 500 1000 1500 2000 2500
0 1000 2000 3000 4000 5000 6000 7000 8000
0 1000 2000 3000 4000 5000 6000 7000 8000
0 1000 2000 3000 4000 5000 6000 7000 8000
0 1000 2000 3000 4000 5000 6000 7000 8000
BA layer 1 edge BA layer 2 edge
BA layer 3 edge BA layer 4 edge
Pulse Height (A.U) Pulse Height (A.U)
Pulse Height (A.U) Pulse Height (A.U) Pulse Height (A.U) Pulse Height (A.U)
Pulse Height (A.U) Pulse Height (A.U)
Pulse Height (A.U) Pulse Height (A.U)
Pulse Height (A.U) Pulse Height (A.U)
Pulse Height (A.U) Pulse Height (A.U)
Pulse Height (A.U) Pulse Height (A.U)
Cou
nts
Cou
nts
Cou
nts
Cou
nts
Cou
nts
Cou
nts
Cou
nts
Cou
nts
Cou
nts
Cou
nts
Cou
nts
Cou
nts
Cou
nts
Cou
nts
Cou
nts
Cou
nts
center
edge
Fig. 5 Representative energy spectra for SBA (a) and BA (b) at the center and edge, together with fitting function and energy resolution (in
FWHM) of photopeaks
62 Y. Hirano et al.

for the peak-to-valley ratio. However, the distance-to-
width ratio depends on the accuracy of the multi-Gaussian
fits. In some peaks, the fitting curves were not consistent
with the experimental histograms.
Because of the smaller number of dynodes for the SBA
than for the BA, we expected that the SBA would have
better timing resolution. However, almost the same reso-
lution was observed. There might not have been a suffi-
ciently fast rise time for the GSO scintillator to allow an
effect from the difference in the number of dynodes to be
seen. Also, the smaller gain in PMT possibly caused fluc-
tuation of the timing. Similar to the energy resolution, the
timing resolution of the 4th layer was the best. Because the
4th-layer scintillators were closest to the photocathode,
fluctuation of the time for the scintillation photons to reach
the photocathode could be suppressed.
We confirmed advantages for the SBA in the DOI
detector. However, the improvements were minor. One of
the reasons is the larger deviation of anode gains of SBA
than that of BA. An anode gain correction for PS-PMTs
will be needed to enhance the advantage of SBA. In
addition, the emission peak of the GSO scintillators did not
match the 400-nm wavelength, which was the maximum
quantum efficiency (35 %) of the SBA. The wavelength
also gives a large difference between the SBA and BA. A
scintillator with a short emission wavelength would be
expected to give a better performance. For example,
LaBr3(Ce), YAP, and BaF2 have suitable emission spectra.
These maximum emission wavelengths are 380 [38], 370
[39], and 310 nm [40], respectively. Considering their
6
7
8
9
10
11
12
13
14
300 500 700 900 1100 1300
Energy [keV]
Ene
rgy
Res
olut
ion
[%]
835
662
511
1275
GSO+SBA
GSO+BA
Fig. 6 Energy resolutions of the 1st layer for energies of 511 keV
(22Na), 662 keV (137Cs), 835 keV (54Mn) and 1275 keV (22Na); their
respective energy resolutions were 12.0, 10.6, 9.45, and 7.68 % for
the SBA and 12.7, 11.2, 10.1, and 8.41 % for the BA. Energy
resolutions were better with the SBA because more scintillation
photons were observed
-0.8 -0.6 -0.4 -0.2 0.0 0.2 0.4 0.6 0.80
500
1000
1500
2000
2500
3000
3500
4000
0
500
1000
1500
2000
2500
3000
3500
0
500
1000
1500
2000
2500
3000
3500
4000
0
500
1000
1500
2000
2500
3000
3500
4000
4500
X-coordinate(A.U)-0.8 -0.6 -0.4 -0.2 0.0 0.2 0.4 0.6 0.8
X-coordinate(A.U)
-0.8 -0.6 -0.4 -0.2 0.0 0.2 0.4 0.6 0.8
X-coordinate(A.U)
-0.8 -0.6 -0.4 -0.2 0.0 0.2 0.4 0.6 0.8
X-coordinate(A.U)
Cou
nts
Cou
nts
Cou
nts
Cou
nts
GSO+SBA layers 1-2 row 1 GSO+BA layers 1-2 row 1
GSO+SBA layers 1-2 row 8 GSO+BA layers 1-2 row 8
row 8
row 1
layers 1-2
(a)
(c)
(b)
(d)
Fig. 7 Representative profiles of the layers 1–2. Row 1 of SBA (a), row 1 of BA (b), row 8 of SBA (c), and row 8 of BA (d) are shown together
with fitting lines of multi-Gaussian functions
A DOI detector with super bialkali photocathode 63

emission spectra, about 1.4, 1.4, and 1.5 times more scin-
tillation photons will be available. In addition, these scin-
tillators have fast decay constants of less than 30 ns (YAP:
30 n, BaF2: 0.6–0.7 ns, LaBr3(Cs): 16 n). For these scin-
tillators, a better performance would be obtained by use of
SBA instead of BA.
0
200
400
600
800
1000
1200
1400
1600
1800
2000
0
200
400
600
800
1000
1200
1400
1600
1800
2000p5
0
200
400
600
800
1000
1200
1400
1600
1800
0
200
400
600
800
1000
1200
1400
1600
1800
p5
-0.8 -0.6 -0.4 -0.2 0.0 0.2 0.4 0.6 0.8
X-coordinate(A.U)
-0.8 -0.6 -0.4 -0.2 0.0 0.2 0.4 0.6 0.8
X-coordinate(A.U)
-0.8 -0.6 -0.4 -0.2 0.0 0.2 0.4 0.6 0.8
X-coordinate(A.U)
-0.8 -0.6 -0.4 -0.2 0.0 0.2 0.4 0.6 0.8
X-coordinate(A.U)C
ount
sC
ount
s
Cou
nts
Cou
nts
GSO+SBA layers 3-4 row 1 GSO+BA layers 3-4 row 1
GSO+SBA layers 3-4 row 8 GSO+BA layers 3-4 row 8row 8
row 1
layers 3-4
(a)
(c)
(b)
(d)
Fig. 8 Representative profiles of layers 3–4. Row 1 of SBA (a), row 1 of BA (b), row 8 of SBA (c), and row 8 of BA (d) are shown together
with fitting lines of multi-Gaussian functions
0 1 2 3 4 5 6 7 8 9 10 11 12 13 14 15 16
0 1 2 3 4 5 6 7 8 9 10 11 12 13 14 15 160.0
0.5
1.0
1.5
3.0
2.5
3.0
3.5
4.0
0.0
0.5
1.0
1.5
3.0
2.5
3.0
3.5
4.0
peak
-to-
valle
y ra
tiope
ak-t
o-va
lley
ratio
row
row
layers 1-2 layers 1-2
layers 3-4layers 3-4
(b)(a)
(d)(c)
0.0
0.5
1.0
1.5
3.0
2.5
3.0
3.5
4.0
0 1 2 3 4 5 6 7 8 9 10 11 12 13 14 15 16
row
0.0
0.5
1.0
1.5
3.0
2.5
3.0
3.5
4.0
0 1 2 3 4 5 6 7 8 9 10 11 12 13 14 15 16
row
Dis
tanc
e-to
-wid
th r
atio
Dis
tanc
e-to
-wid
th r
atio
row12
layers 1-2
3579
111315
468
10121416
row12
layers 3-4
3579
111315
468
10121416
GSO+SBAGSO+BA
GSO+SBAGSO+BA
GSO+SBAGSO+BA
GSO+SBAGSO+BA
Fig. 9 Metrics of crystal identification ability; distance-to-width ratios for the layers 1–2 (a), layers 3–4 (c), and peak-to-valley ratios for layers
1–2 (b) and layers 3–4 (d)
64 Y. Hirano et al.

5 Conclusions
The performance of SBA and BA by use of the 4-layer DOI
detector with a GSO scintillator array was compared.
Although improvements in the performance with SBA
instead of BA were observed for all items, energy resolu-
tion, timing resolution, and crystal identification abilities,
these improvements were minor. Combination of scintil-
lators with short emission wavelength and SBA would give
more improvements.
Acknowledgments The authors thank Dr. H. Ishibashi of Hitachi
Chemical and Mr. M. Nakamura of the Electron Tube Division,
Hamamatsu Photonics K.K., for providing data on emission spectra
and quantum efficiencies, respectively.
Conflict of interest The authors declare that they have no conflict
of interest.
References
1. Yamashita T, Watanabe M, Shimizu K, Uchida H. High resolu-
tion block detectors for PET. IEEE Trans Nucl Sci. 1990;37:
589–93.
2. Liu H, Omura T, Watanabe M, Yamashita T. Development of a
depth of interaction detector for c-rays. Nucl Instrum Methods A.
2001;459:182–90.
3. Fremout AAR, Chen R, Bruyndonckx P, Tavernier SPK. Spatial
resolution and depth-of-interaction studies with a pet detector
module composed of LSO and an APD array. IEEE Trans Nucl
Sci. 2002;49:31–8.
4. Carrier C, Martel C, Schmitt D, Lecomte R. Design of a high
resolution positron emission tomograph using solid state scintil-
lation detectors. IEEE Trans Nucl Sci. 1988;35:685–90.
5. Schmand M, Eriksson L, Casey ME, Andreaco MS, Melcher C,
Wienhard K, Flugge G, Nutt R. Performance results of a new
DOI detector block for a high resolution PET—LSO research
tomograph HRRT. IEEE Trans Nucl Sci. 1998;45:3000–6.
6. Yamamoto S, Ishibashi H. A GSO depth of interaction detector
for PET. IEEE Trans Nucl Sci. 1998;45:1078–82.
7. Saoudi A, Pepin CM, Dion F, Bentourkia M, Lecomte R, Andreaco
M, Casey M, Nutt R, Dautet H. Investigation of depth-of-interac-
tion by pulse shape discrimination in multicrystal detectors read out
by avalanche photodiodes. IEEE Trans Nucl Sci. 1999;46:462–7.
8. Seidel J, Vaquero JJ, Siegel S, Gandler WR, Green MV. Depth
identification accuracy of a three layer phoswich PET detector
module. IEEE Trans Nucl Sci. 1999;46:485–90.
9. Ohi J, Tonami H. Investigation of a whole-body DOI-PET sys-
tem. Nucl Instrum Methods A. 2007;571:223–6.
10. Murayama H, Ishibashi H, Uchida H, Omura T, Yamashita T.
Depth encoding multicrystal detectors for PET. IEEE Trans Nucl
Sci. 1998;45:1152–7.
11. Tsuda T, Murayama H, Kitamura K, Yamaya T, Yoshida E,
Omura T, Kawai H, Inadama N, Orita N. A four-layer depth of
interaction detector block for small animal PET. IEEE Trans Nucl
Sci. 2004;51:2537–42.
12. Ito M, Lee JS, Park M-J, Sim K-W, Hong SJ. Design and sim-
ulation of a novel method for determining depth-of-interaction in
a PET scintillation crystal array using a single-ended readout by a
multi-anode PMT. Phys Med Biol. 2010;55:3827–41.
13. Nishikido F, Inadama N, Oda I, Shibuya K, Yoshida E, Yamaya T,
Kitamura K, Murayama H. Four-layer depth-of-interaction PET
detector for high resolution PET using a multi-pixel S8550 ava-
lanche photodiode. Nucl Instrum Methods A. 2010;621:570–5.
14. Moses WW, Derenzos SE, Melchert CL, Manentet RA. A room
temperature LSO/PIN photodiode PET detector module that mea-
sures depth of interaction. IEEE Trans Nucl Sci. 1995;42:1085–9.
15. Miyaoka RS, Lewellen TK, Yu H, McDaniel DL. Design of a
depth of interaction (DOI) PET detector module. IEEE Trans
Nucl Sci. 1998;45:1069–73.
16. Shao Y, Silverman RW, Farrell R, Cirignano L, Grazioso R, Shah
KS, Vissel G, Clajus M, Tumer TO, Cherry SR. Design studies of
a high resolution PET detector using APD arrays. IEEE Trans
Nucl Sci. 2000;47:1051–7.
17. Dokhale PA, Silverman RW, Shah KS, Grazioso R, Farrell R,
Glodo J, McClish MA, Entine G, Tran V-H, Cherry SR. Perfor-
mance measurements of a depth-encoding PET detector module
based on position-sensitive avalanche photodiode read-out. Phys
Med Biol. 2004;49:4293–304.
18. Salvador S, Huss D, Brasse D. Design of a high performances
small animal PET system with axial oriented crystals and DOI
capability. IEEE Trans Nucl Sci. 2009;56:17–23.
19. Delfino EP, Majewski S, Raylman RR, Stolin A. Towards 1 mm
PET resolution using DOI modules based on dual-sided SiPM
readout. IEEE Nucl Sci Symp Conf Rec. 2010:3442–49.http://
ieeexplore.ieee.org/xpl/login.jsp?tp=&arnumber=5874446&url=
http%3A%2F%2Fieeexplore.ieee.org%2Fxpls%2Fabs_all.jsp%
3Farnumber%3D5874446.
20. Levin CS. Design of a high-resolution and high-sensitivity scin-
tillation crystal array for PET with nearly complete light collec-
tion. IEEE Trans Nucl Sci. 2002;49:2236–43.
21. Clement D, Frei R, Loude J-F, Morel C. Development of a 3D
position sensitive scintillation detector using neural networks.
IEEE Nucl Sci Symp Conf Rec. 1998;3:1448–52.
22. Bruyndonckx P, L0eonard S, Tavernier S, Lemaıtre C, Devroede
O, Wu Y, Krieguer M. Neural network-based position estimators
for PET detectors using monolithic LSO blocks. IEEE Trans Nucl
Sci. 2004;51:2520–5.
23. Lerche WC. Depth of interaction detection for c-ray imaging.
Nucl Instrum Methods A. 2004;600:624–34.
24. Maas MC, Schaart DR, van der Laan DJ, Bruyndonckx P,
Lemaıtre C, Beekman FJ, van Eijk CWE. Monolithic scintillator
Table 1 Comparison of SBA and BA performance values
1st layer 2nd layer 3rd layer 4th layer
Energy resolution (%) (FWHM)
SBA 12.1 ± 0.4 12.7 ± 0.4 15.5 ± 1.8 11.5 ± 1.1
BA 12.8 ± 0.5 13.5 ± 0.6 16.7 ± 2.5 12.9 ± 1.5
Timing resolution (ns) (FWHM)
SBA 2.7 ± 0.1 2.7 ± 0.1 2.6 ± 0.1 2.4 ± 0.1
BA 2.7 ± 0.2 2.8 ± 0.1 2.6 ± 0.1 2.5 ± 0.2
1st and 2nd layers 3rd and 4th layers
Peak-to-valley ratio
SBA 1.86 ± 1.13 1.54 ± 0.85
BA 1.78 ± 1.05 1.52 ± 0.82
Distance-to-width ratio
SBA 1.57 ± 0.49 1.41 ± 0.51
BA 1.47 ± 0.59 1.33 ± 0.51
A DOI detector with super bialkali photocathode 65

PET detectors with intrinsic depth-of-interaction correction. Phys
Med Biol. 2009;54:1893–908.
25. Schaart DR, van Dam HT, Seifert S, Vinke R, Dendooven P,
Lohner H, Beekman FJ. A novel, SiPM-array-based, monolithic
scintillator detector for PET. Phys Med Biol. 2009;54:3501–12.
26. van Dam SS, Vinke R, Dendooven P, Lohner H, Beekman FJ,
Schaart DR. A practical method for depth of interaction deter-
mination in monolithic scintillator PET detectors. Phys Med Biol.
2011;56:4135–45.
27. Yamaya T, Inaniwa T, Minohara S, Yoshida E, Inadama N,
Nishikido F, Shibuya K, Lam C-F, Murayama H. A proposal of
an open PET geometry. Phys Med Biol. 2011;53:757–73.
28. Yamaya T, et al. Development of a small prototype for a proof-
of-concept of OpenPET imaging. Phys Med Biol. 2011;56:
1123–37.
29. Yoshida E, Kinouchi S, Tashima H, Nishikido F, Inadama N,
Murayama H, Yamaya T. System design of a small OpenPET
prototype with 4-layer DOI detectors. Radiol Phys Technol.
2012;29:92–7.
30. Bircher C, Shao Y. Use of internal scintillator radioactivity to
calibrate DOI function of a PET detector with a dual-ended-
scintillator readout. Med Phys. 2012;39:777–87.
31. Yamamoto S, Horii H, Hurutani M, Matsumoto K, Senda M.
Investigation of single, random, and true counts from natural
radioactivity in LSO-based clinical PET. Ann Nucl Med.
2005;12:109–14.
32. Watson CC, Casey ME, Eriksson L, Mulnix T, Adams D,
Bendriem B. NEMA NU 2 performance tests for scanners with
intrinsic radioactivity. J Nucl Med. 2004;45:822–6.
33. Vaquero JJ, Udlas JM, Seidel J, Espana S, Desco M. Effects of
the super bialkali photocathode on the performance
characteristics of a position-sensitive depth-of-interaction PET
detector module. IEEE Trans Nucl Sci. 2010;57:2437–41.
34. Yamamoto S, Watabe H, Kato K, Hatazawa J. Performance
comparison of high quantum efficiency and normal quantum
efficiency photomultiplier tubes and position sensitive photo-
multiplier tubes for high resolution PET and SPECT detectors.
Med Phys. 2012;39:6900–7.
35. Shimizu S, Sumiya K, Ishibashi H, Senguttvan N, Redkin BS,
Ishii M, Kobayashi M, Susa K, Murayama H. Effect of Mg-, Zr-,
and Ta-doping on scintillation properties of Gd2SiO5:Ce crystal.
IEEE Trans Nucl Sci. 2003;50:7149–74.
36. Lau FW, Vandenbroucke A, Reynolds PD, Olcott PD, Horowitz
MA, Levin CS. Analog signal multiplexing for PSAPD-based
PET detectors: simulation and experimental validation. Phys Med
Biol. 2010;55:7149–74.
37. Valais I, Michail C, David S, Nomicos CD, Panayiotakis GS,
Kandarakis I. A comparative study of the luminescence proper-
ties of LYSO:Ce, LSO:Ce, GSO:Ce and BGO single crystal
scintillators for use in medical X-ray imaging. Physica Med.
2008;24:122–5.
38. Saint-Goban BrilanCeTM data sheet. http://www.detectors.saint-
gobain.com/uploadedFiles/SGdetectors/Documents/Product_
Data_Sheets/BrilLanCe380-data-sheet.pdf. Accessed 14 Aug
2013.
39. Moszynski M, Kapusta M, Wolski D, Klamra W, Cederwall B.
Properties of the YAP:Ce scintillator. Nucl Instrum Methods A.
1998;404:157–65.
40. Saint-Goban BaF2 data sheet http://www.detectors.saint-gobain.
com/uploadedFiles/SGdetectors/Documents/Product_Data_Sheets/
BaF2-Data-Sheet.pdf. Accessed 1 Aug 2013.
66 Y. Hirano et al.