performance evaluation guidance - sensitive predecisional data 1 performance evaluation board...
TRANSCRIPT

Performance Evaluation Guidance - Sensitive Predecisional Data
1
Performance Evaluation Board Recommendation to theFee Determination Official
Contract NameContract Number
Award Fee Period XXMonth Day, Year

Performance Evaluation Guidance - Sensitive Predecisional Data
2
PEB/FDO Template Components
Purpose Contract Overview Award Fee Overview Overview of 6 months mission/Performance
Areas of Emphasis *Technical Performance Evaluation
Metrics Subjective Performance
*Management Performance Evaluation *Safety Evaluation *Small Business Subcontracting Evaluation *Cost Evaluation PEB Recommendation for Period XX Back Up Information
* Can also be arranged using Areas of Emphasis

Performance Evaluation Guidance - Sensitive Predecisional Data
3
Purpose
Provide overview of the Contractor’s performance for the 6-month period ending _________
Recommend an Adjective Rating and Numerical Score
Assure communications and understanding of the award fee criteria between the Government and Contractor
Obtain FDO Adjective Rating and Numerical Score

Performance Evaluation Guidance - Sensitive Predecisional Data
4
Insert Contract Name
Contract Features Prime Contractor: Insert Contractor Name Key Subcontractors: Insert Subcontractor Name & Type Period of Performance: Contract Start Date – Contract
End Date Contract Type: Insert Contract Type Options: Insert Term & Value
Contract Scope: Insert brief paragraph
Contract Work Breakdown Structure or Functional Areas
Performance Evaluation Guidance - Sensitive Predecisional Data
5
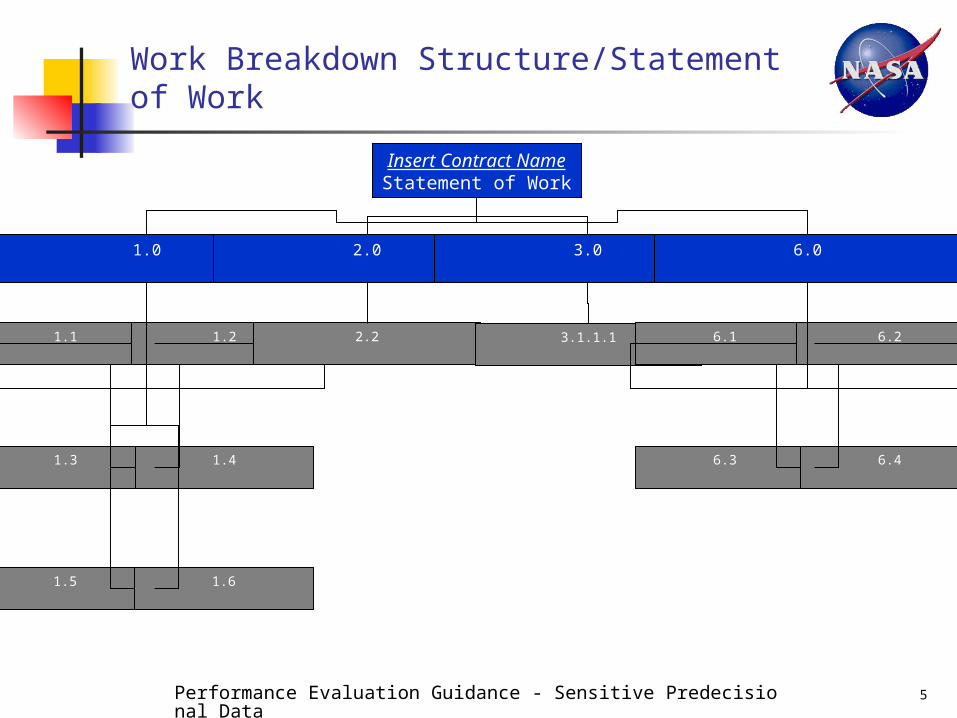
Work Breakdown Structure/Statement of Work
Insert Contract NameStatement of Work
1.0
2.0
3.0
6.0
1.1
1.2
1.3
1.4
1.5
1.6
2.2
3.1.1.1
6.1
6.2
6.3
6.4

Performance Evaluation Guidance - Sensitive Predecisional Data
6
Insert Contract Name
Award Fee Period XX Summary Evaluation Period: Period Start Date – Period End Date
Maximum Award Fee Value: Insert Max Available Award Fee for Period

Performance Evaluation Guidance - Sensitive Predecisional Data
7
Award Fee Process Overview
Evaluators/Surveillance Structure Performance Evaluation Board Members Areas of Emphasis for the Period Scoring Summary by Evaluation Factor, including
weightings

Performance Evaluation Guidance - Sensitive Predecisional Data
8
Evaluators/Surveillance Structure
COTR
Insert Name
TMR
Insert Name
TMR
Insert Name
TMR
Insert Name
TMR
Insert Name
Insert SOW Responsibility Insert SOW Responsibility Insert SOW Responsibility
TM
Insert Name
TM
Insert Name
Insert SOW Responsibility
TM
Insert Name
TMR
Insert Name
Insert SOW Responsibility
Insert SOW Responsibility
Insert SOW Responsibility
TM
Insert Name
Insert SOW Responsibility Insert SOW Responsibility
DCMA
Insert Name
Contracting Officer
Insert Name
Insert SOW Responsibility
TM
Per TO

Performance Evaluation Guidance - Sensitive Predecisional Data
9
Performance Evaluation Board Members
Performance Evaluation Board
Insert Name, Chair Insert Name Insert NameInsert Name Insert NameInsert Name Insert Name Insert Name Insert NameInsert Name Insert NameInsert Name
Fee Determination Official
Insert Name
PEB Integration Team
Insert Name, Chair (COTR)Insert Name (CO)Insert NameInsert NameInsert NameInsert Name
PEB Recorder
Insert Name

Performance Evaluation Guidance - Sensitive Predecisional Data
10
Areas of Emphasis for Period XX
Insert each Area of Emphasis for the period

Performance Evaluation Guidance - Sensitive Predecisional Data
11
Period XX Scoring Summary
Evaluation Element
AdjectiveCriteriaRating
Numerical
Score XWeightScore
A – Technical
1. Safety
B – Management 1. Small Business
C. Cost
Cumulative Score

Performance Evaluation Guidance - Sensitive Predecisional Data
12
Technical Performance Evaluation

Performance Evaluation Guidance - Sensitive Predecisional Data
13
Technical Evaluation - Metrics
Insert statement as to how the contract metrics were used in the evaluation.

Performance Evaluation Guidance - Sensitive Predecisional Data
14
Metrics - Example
WBS/ Number Title Org. OPR WeightingCurrent Status
Metric Score
Weighted Score
Program Management (X%) [5.0]4.0 G 100% 4.01.0 G 100% 1.0
Business Management (X%) [4.0]4.0 G 100% 4.0
Configuration Management/Data Integration (X%) [9]2.0 G 100% 2.02.0 G 100% 2.02.0 G 100% 2.01.5 G 100% 1.51.5 G 100% 1.5
Information Technology (X%) [12.5]4.5 G 100% 4.54.0 G 100% 4.04.0 G 100% 4.0
Systems Analysis and Integration (X%) [14]2.5 G 100% 2.52.0 G 100% 2.03.0 G 100% 3.03.5 G 100% 3.53.0 Y 75% 2.3
Safety and Mission Assurance (X%) [5.5]1.0 G 100% 1.01.0 G 100% 1.00.5 G 100% 0.51.0 G 100% 1.01.0 G 100% 1.01.0 G 100% 1.0
Total 50 49
IDIQ Metrics
Performance Evaluation Guidance - Sensitive Predecisional Data
15
Technical Evaluation – Subjective Write-ups
Identify Strengths in Evaluation Factor, WBS, or AOE order STRENGTHS
WEAKNESSES

Performance Evaluation Guidance - Sensitive Predecisional Data
16
Management Performance Evaluation

Performance Evaluation Guidance - Sensitive Predecisional Data
17
Management Evaluation – Subjective Write-ups
STRENGTHS
WEAKNESSES

Performance Evaluation Guidance - Sensitive Predecisional Data
18
Safety Evaluation

Performance Evaluation Guidance - Sensitive Predecisional Data
19
Safety & Health Requirements
Category Expectation Strengths Weaknesses
Leadership “Safety” is an integral part of great leadership – “leadership” is an integral
part of an effective safety & health program
Provided by S&MA TMR and COTR
Provided by S&MA TMR and COTR
Prevention You must have a S&H Program that meets the requirement of the JSC S&H
Handbook
(i.e. a pro-active, leadership and employee involvement based S&H
Program)
Provided by S&MA TMR and COTR
Provided by S&MA TMR and COTR
Reaction
(Trailing Indicators)
NOTE: Zero injuries/illnesses may only mean that you are either lucky
or under-reporting. Zero by itself has no meaning – it does have meaning, however, if there is a proactive S&H
Program
You are expected to achieve injury/illness rates below the industry average and to keep trying to reduce
them to zero
Provided by NS - based on metrics as compared to industry averages and other metric factors (e.g. type A mishaps)
Provided by NS - based on metrics as compared to industry averages and other metric factors (e.g. type A mishaps)
Issues Manage “issues” and implement appropriate risk mitigation/control and
corrective action.
Provided by S&MA TMR and COTR
Provided by S&MA TMR and COTR

Performance Evaluation Guidance - Sensitive Predecisional Data
20
Safety & Health Requirements OSHA Safety Summary
CONTRACTOR - XYZCONTRACT NUMBER- NAS9-012344
DATA THROUGH - 7/1/99 - 12/31/99 **Example**SIC CODE (from 1997) - 8711
MISHAP SUMMARIES CONTRACTOR RATING DOES NOT MEET MEETSTYPE A 0 MEETS greater than 1 0TYPE B 0 MEETS greater than 1 0TYPE C 2INCIDENT 5
COUNTS CONTRACTOR RATE HISTORY (3 Previous Years)LWDC - DAYS AWAY 2 LWDC Days Away LWDC D.A & R.D. OSHA RecordableLWDC - RESTRICTED 2 Year 3 1 2 4
LWDC - TOTAL 4 Year 2 0.9 1.8 3MED. TREAT. - TOTAL 3 Year 1 0.85 1.7 2.5
HOURS 500000 Avg (3 year) 0.91 1.8 3.2
PROPERTY DAMAGE CONTRACTOR# CASES 0DOLLARS $0.00
| ---------------------------------------RATING CRITERIA--------------------------------------- |CONTRACTOR RATING DOES NOT MEET MEETS EXCEEDS
LWDC (Days Away Only)
INDUSTRIAL AVERAGE 0.90FREQUENCY RATE 0.80 DNM
LWDC (Days Away & Restricted)
INDUSTRIAL AVERAGE 1.70FREQUENCY RATE 1.60 MEETS
OSHA RECORDABLEINDUSTRIAL AVERAGE 6.00CONTRACTOR RATE 2.80 EXCEEDS
OSHA / EPA CONTRACTOR RATING DOES NOT MEET MEETS EXCEEDSVIOLATIONS 0 MEETS greater than or equal to 1 0 N/A
ADDITIONAL COMMENTS:
__3__ of ___6__ 288 Reports were submitted on-time. FALSE - Data submitted was regularly accurate.
50% below the Industrial Average
above the Industrial Average below the Industrial Average
above the Industrial Average below the Industrial Average50% below the Industrial
Average
50% to 25% of the Industrial Average
less than 25% of the Industrial Average
greater than 50% of the Industrial Average

Performance Evaluation Guidance - Sensitive Predecisional Data
21
Small Business Subcontracting Evaluation

Performance Evaluation Guidance - Sensitive Predecisional Data
22
Small Business Subcontracting Goals
Category Goal Period X* Cum to Date
Strength/Meets/
Weakness
Small Business (SB) XX% XX% XX% S/M/W
Small Disadvantaged Business (SDB) XX% XX% XX% S/M/W
Woman-Owned Small Business (WOSB) XX% XX% XX% S/M/W
Hub-Zone Small Business XX% XX% XX% S/M/W
Veteran-Owned Small Business (VOSB) XX% XX% XX% S/M/W
Service Disabled VOSB (SDVO) XX% XX% XX% S/M/W
Historically Black Colleges or Universities (HBCU)
XX% XX% XX% S/M/W
Percentage of Total Contract Dollars
* - Use invoiced expenditures or SF 294 data

Performance Evaluation Guidance - Sensitive Predecisional Data
23
Small Business Subcontracting Goals
Insert Strengths for Mentor-Protégé Program or other means to promote small businesses
A summary of any extenuating circumstances should be provided.

Performance Evaluation Guidance - Sensitive Predecisional Data
24
Cost Evaluation

Performance Evaluation Guidance - Sensitive Predecisional Data
25
Level-of-Effort Cost Evaluation – Example
Rate Total Rate Total Rate Total
Hours
Cost ElementsLabor Overhead/FringeFacilitiesTravelTrainingOT PremiumOther
SubtotalG&ASubsMaterial
Total
Grand TotalLess Maint & TravelSubs TravelG&A Travel Evaluated Total
$0 $0 $0 0.00%
COST EVALUATION PERIOD NO. X
Contract Baseline Actuals Delta

Performance Evaluation Guidance - Sensitive Predecisional Data
26
Level-of-Effort Cost Analysis – Example
Variances: Labor Dollars: Facilities: OT Premium: Wrap Rate:
Narrative would address which variances considered within contractor’s control and contractor’s overall performance based on total cost (cost per hour for hours delivered).

Performance Evaluation Guidance - Sensitive Predecisional Data
27
Performance Based Contract Cost Evaluation with no EVMS

Performance Evaluation Guidance - Sensitive Predecisional Data
28
Variance Detail Chart
Cost Element Actual Baseline Variance $ Variance Variance Narrative
Direct Labor ($)
Direct Labor (Hrs)
Materials/Equipment
Subcontractor
Other Direct Costs
Travel
Overhead
G&A $0

Performance Evaluation Guidance - Sensitive Predecisional Data
29
Cost Summary & Write-up
Summary : The Contractor’s actual cost for this 6-month period was under
the negotiated contract baseline by xx%. Underrun experienced in direct labor, materials/equipment, other
direct costs, and G&A costs. Overrun experienced in subcontract costs, travel costs, and overhead
costs.
Assessment: Contractor was able to keep costs in check while performing at a
high quality level meeting all critical schedules. Factors to consider:
A majority of the overruns in the cost elements were NASA-driven. Subcontract costs and overhead were the significant overruns. They were the result of work done that was not specifically included in the baseline.
Underruns were the result of contractor efficiencies and deferral of ISS purchases
Recommended Score: XX

Performance Evaluation Guidance - Sensitive Predecisional Data
30
Performance Based Contract Cost Evaluation Using Performance Measurement (EVM)
Example

Performance Evaluation Guidance - Sensitive Predecisional Data
31
Sample I PBC with EV Graph with Write-up
Based on cum period CPI of 1.049 Excellent – Initial grade: 100 Contractor exhibited outstanding
cost control Cost variance indicates ACWP
was $300k (about 7%) less than planned. This translates to actual savings to the program that will be realized this year if current contractor performance is sustained.
SPI: 0.994
CPI: 0.976
SPI: 1.001
CPI: 0.989
G
Y
R
1.2
1.1
1.0
0.9
0.80.8 0.9 1.0 1.1 1.2
CP
I
SPI
Prev. mo.
Proj. EOY
Monthly
FY start
Per. end
Per. cum.
EOY est.
TCPI
TCPI0.939
3.7%
Behind Schedule Ahead of Schedule
Ove
rspe
nt
Und
ersp
ent
CPIcum: 0.973 CPIper: 1.049

Performance Evaluation Guidance - Sensitive Predecisional Data
32
Example of PBC with EV Graph (CPI only)
AF Period Cum CPI
0.00
1.00
2.00
AF Period Cum CPI 1.25 1.06 1.05 1.03 1.03 1.05
1 2 3 4 5 6
> 1.0 Underspent< 1.0 Overspent

Performance Evaluation Guidance - Sensitive Predecisional Data
33
PEB Recommendation for Period XX
Evaluation Factors/AOEs
Str
engt
hs
Wea
knes
ses
Rating
Wei
ghtin
g
Per
cent
ile S
core
Wei
ghte
d S
core
A. Performance, Compliance with S&H, and Subcontracting Goals X X XX 70% XX XXB. Cost Performance X X XX 30% XX XX
EXVGGOODSATPOOR/UNSATISFACTORY0 60 70 80 100%90
XX%
RECOMMENDED ADJECTIVE RATING = EXCELLENT
RECOMMENDED NUMERICAL SCORE = XX
.XX x $Y,YYY,YYY (available fee pool for the period) = $Z,ZZZ,ZZZ
Performance Evaluation Guidance - Sensitive Predecisional Data
34
FDO Presentation Back-up

Performance Evaluation Guidance - Sensitive Predecisional Data
35
Award Fee Pool for Period XX
Numerical Score Percent Earned Fee100 100% $5,000,00099 99% 4,950,00098 98% 4,900,00097 97% 4,850,00096 96% 4,800,00095 95% 4,750,00094 94% 4,700,00093 93% 4,650,00092 92% 4,600,00091 91% 4,550,00090 90% 4,500,00089 89% 4,450,00088 88% 4,400,00087 87% 4,350,00086 86% 4,300,00085 85% 4,250,00084 84% 4,200,00083 83% 4,150,00082 82% 4,100,00081 81% 4,050,00080 80% 4,000,00079 79% 3,950,00078 78% 3,900,00077 77% 3,850,00076 76% 3,800,00075 75% 3,750,00074 74% 3,700,00073 73% 3,650,00072 72% 3,600,00071 71% 3,550,00070 70% 3,500,00069 69% 3,450,00068 68% 3,400,00067 67% 3,350,00066 66% 3,300,00065 65% 3,250,00064 64% 3,200,00063 63% 3,150,00062 62% 3,100,00061 61% 3,050,00060 0 0
$5,000,000Award Fee Pool:

Performance Evaluation Guidance - Sensitive Predecisional Data
36
Historical Performance Comparison
Award Fee Period 1 2 3 4 5 6 7 8 9 10 11 12 13 14
Quality
Business Management
Safety
SB Goals
Program Provisioning
PEB Recommended Score
FDO Final Score