asset maintenance contractor performance evaluation · pdf filemaintenance contractor...
TRANSCRIPT

INSTRUCTIONS & GUIDANCE
For Using and Determining Scores for
the
ASSET MAINTENANCE
CONTRACTOR
PERFORMANCE
EVALUATION REPORT
(AMPER version 2.2)
Volume I & II
August 2017

INSTRUCTIONS & GUIDANCE
For Using the
ASSET MAINTENANCE
CONTRACTOR
PERFORMANCE
EVALUATION REPORT
(AMPER version 2.2)
Volume I
August 2017

Table of Content
Glossary ......................................................................................................................................................................... 1
Introduction .................................................................................................................................................................. 2
Purpose and Principals of the AMPER .......................................................................................................................... 3
Purpose and General Content of the AMPER ........................................................................................................... 3
Principals Governing AMPER Evaluations................................................................................................................. 4
Overall Structure of the AMPER ................................................................................................................................... 6
4 Viewable Tabs ......................................................................................................................................................... 6
Link among Tabs ........................................................................................................................................................ 7
AM Summary Sheet Tab ............................................................................................................................................... 8
Performance Evaluation Report Tab ...................................................................................................................... 9
Section I – Standard Performance Indicators ........................................................................................................... 9
Section II - Facilities ................................................................................................................................................. 11
Section III – Bridges and Ancillary Structures ......................................................................................................... 12
Customization of Section II, III to enhance Contract .............................................................................................. 13
Included sections ................................................................................................................................................. 13
Section II and III Imbalances ................................................................................................................................ 13
Section IV - MRP ...................................................................................................................................................... 14
Examples .............................................................................................................................................. 15 MRP relates scores explanation .......................................................................................................... 16
MRP scores from MRP Scorecard Archive on Share-point .................................................................. 17
Section V – Performance Intangibles and Bonus Opportunities ........................................................................ 19
I, II, III Detail Tab ............................................................................................................................................... 20
Review Types .............................................................................................................................................................. 20
Compliance indicators ................................................................................................................................................ 22

Table of Content
Additional Compliance Indicators Specifically Developed for Contract .................................................................... 24
Choice of Evaluation Results....................................................................................................................................... 25
Section V Detail ................................................................................................................................................... 26

Glossary
1
AASHTO: American Association of State Highway Transportation Officials
AMPER: Asset Maintenance Contractor Performance Evaluation Report
BrM: AASHTOWARE Bridge Management Database (formerly PONTIS)
CBT: Computer Based Training
CI: Compliance Indicator
CIDR: Comprehensive Inventory Data Report generated by BrM
DBE: Disadvantaged Business Enterprise
FAC: Florida Administrative Code
FARC: Feasible Action Review Committee
FDOT: Florida Department of Transportation
HML: High Mast Light Pole
MOT: Maintenance of Traffic
MRP: Maintenance Rating Program
O/H: Overhead Sign
QA: Quality Assurance
QC: Quality Control
RCI: Roadway Characteristics Inventory
RFP: Request for Proposal
WO: Work Order

Introduction
2
The Volume I of this guide intends to inform and train FDOT District personnel in filling the Asset
Maintenance Contractor Performance Evaluation Report (AMPER version 2.1). The information
presented allows the user to better understand the purpose, principles, structure and logic of the AMPER.

Purpose and Principles of the AMPER
3
Purpose and Principles of the AMPER
Purpose and general content of the AMPER The Asset Maintenance Contractor Performance Evaluation Report (or AMPER) is a means to
periodically assess an asset maintenance (AM) contractor’s performance in predetermined contract
areas. The contract areas and sub-areas targeted are:
General and Contract Specific Performance areas:
- Administration (e.g. DBE Usage, Permits, etc…)
- Safety Features
- Field Operations (e.g. Customer Service, Emergency Response, etc…)
- Non-Standard & Project-Specific Compliance Indicators
Facilities: Rest areas, truck comfort stations
- Number of Facilities inspected and scores
- Facility Customer Comments
- Rest Area Security
Bridges and Ancillary Structures
- Ancillary Structures (High Mast Light Pole, Overhead Signs, etc…),
- Bridges
- General Structures and Bridges (Maintenance WO, Structure Inspection)
MRP Data
- Period scores (Maximum 3 periods): Overall, Element and Characteristics
- Interim scores
Performance Intangibles
- Interface with Customers and the Public
- Cooperation with Department Personnel
- Quality Control & Contract Compliance
- Department Contract Administrative Efforts required

Purpose and Principles of the AMPER
4
Principles governing AMPER evaluations:
1- The goal for the AMPER is to foster quality, not to check everything. Different types of evaluation
are performed. One of the type is to use random sampling and a sample size depending upon
past performance. While used in several contract areas in the AMPER, the random sampling
approach is especially used in the evaluation of the “MRP” Section. The Determination of the
sampling method and size is left with the District. Even in cases of MRP interim review, while
specific facility types and characteristics are targeted for review, the MRP Random Point
Generator (MRP-RPG) ensures that random sampling is performed.
2- The AMPER is designed to be comprehensive and accurately assess an AM contractor’s overall
performance. Several options exist to adjust the report to fit the evaluation needs of each
contract:
a- Up to 7 additional project specific, user defined performance indicators can be
selected in the Section I, II, III Detail Tab. The performance indicators scores are
summarized in Section I. These user defined performance indicators must be
approved by the Office of Maintenance according to the Performance Based
Maintenance Contracting Procedure (Ref: No.: 375-000-005-d, Section 4.5.2)
b- Users can specify a reduced Weighting Percentage for Section II (facilities) and/or
Section III (structures) of the “Performance Evaluation Report” Tab. The District
can therefore assign a percentage for each of these sections at the inception of
the contract based on numerous factors and existing imbalances. These reduced
weighting percentage(s) must be approved by the Office of Maintenance
according to the Performance Based Maintenance Contracting Procedure (Ref:
No.: 375-000-005-d, Section 4.5.2)
c- The AMPER allows the District to report any interim inspection that the District may have elected to perform.
d- Overall MRP score (80) and rest areas minimum (85) and average 6-month (90) targets scores have been developed. Adjustment to these scores and other performance scores may be adjusted in the Contract Scope, as needed.
e- Checkboxes/Descriptions have been provided to assist the user in filling out the
evaluation and customized to fit the contract.
f- 2 bonus opportunity are provided (DBE and Youth work experience)

Purpose and Principles of the AMPER
5
3- The AMPER has been designed to be comprehensive. Because performance measure are either
pass or fail, there is some level of AMPER forgiveness reflected in the scoring in case of a few
failures but exponentially penalize the scoring for multiple failures.
4- The AMPER is a guide for inspection and administration of AM contracts.
5- The AMPER is a record used to help selecting future contracts.

Overall Structure of the AMPER
6
Overall Structure of the AMPER
The AMPER has 4 Viewable Tabs
The AMPER includes four viewable tabs. Below is a snapshot of all four tabs shown at the bottom of the
screen and a brief description for each tab:
Performance Evaluation Report
Sheet:
Section 1: is a summary of many of the performance indicators evaluated in the “Section, I, II, III Detail” Sheet. Section 2: is a summary of field QAs of facilities, customer comments and facility security performance indicators evaluation. Section 3: is a summary of structure and bridge related Performance Indicators evaluated in the “Section, I, II, III Detail” Sheet. Field QAs score of WOs are also included. Section 4: includes, for each period the MRP score for Overall, elements and Characteristics. Section 5: includes the summary of
the Performance Intangibles Bonus for Youth Work and DBE Utilization
Section I, II, III Detail Sheet
This tab includes detailed
evaluations of CI and
comments for Section I, II and
III.
Section V Detail Sheet
This tab includes overall
contractor performance
intangibles
AM Summary Sheet:
This is the “Title” Sheet. No
information is entered. Hard copy
signatures of the following personnel
are required:
1- Project Manager
2- Unit Manager
3- District Maintenance
Engineer
The Contractor’s signature
should be obtained as well.

Overall Structure of the AMPER
7
Link among Tabs
The diagram above show the information flowing from the “Section I, II, III Detail” tab and “Section V
Detail” Tab to the “Performance Evaluation” tab and ultimately to the “AM Summary Sheet” tab.
Therefore, the first tab of the AMPER is the last one where all information flow to.

AM Summary Sheet Tab
8
AM Summary Sheet Tab This is the “Title” Sheet. No information is entered. All data for this sheet reflect data entered in the
“Performance Evaluation Tab”. This sheet is used as an overall summary. Hard copy signatures of the
following personnel are required:
1- Project Manager
2- Unit Manager
3- District Maintenance Engineer
The Contractor’s signature should be obtained as well. The AM contractor’s signature does not
necessarily indicate concurrence from his (her) part.
Section I overall score
Section III overall
weight
All sections combined
score. Includes possible
Bonus points
All required signatures

Performance Evaluation Tab
9
Performance Evaluation Report Tab
Section I – Standard Performance Indicators
Section I evaluates 46 standard (plus up to 7 user-defined) pass/fail performance indicators. Indicators
are divided into 4 main performance categories for convenience. Each indicator is equally weighted. The
indicators are evaluated in the “Sections I, II, III Detail” Tab and summarized in the Performance
Evaluation Report Tab. Indicators include many, but not all, contractor responsibilities. Some indicators
are based on contractual performance measures, while other indicators are based on general
procedural/policy requirements. Section I must be completed for all Asset Maintenance Contracts.
General Tabulation Summary
Click on any of the blue hyperlinks
(they turn purple after clicking) to
take you straight to the associated
compliance indicators on the
“Sections I, II, III Detail” tab
All indicators evaluated as
“Performance Met” or “No
Known Deficiencies” in the
“Sections I, II, III Detail” Tab are
tabulated as “Performance Met”
in the “Performance Evaluation
Report” Tab.
When evaluating this performance
indicator in the “Sections I, II, III Detail”
tab, choose “Not in Contract” ONLY if
your contractor is never required to
perform this task per contract language
Choose “Does Not Meet” in the “Sections I, II,
III Detail” tab only if it is known that the
contractor has failed to meet performance

Performance Evaluation Tab
10
Edit Checks
Throughout the AMPER report, edit checks are provided to improve data reliability. For Instance, below,
the data turns red when the sum of the numbers in columns 3, 4 and 5 is not equal to the number in
column 2. Obviously, the absence of red does not necessarily indicate that an evaluation result is
accurate (e.g. Using “Does not meet contract” when “Not in contract” should have been used in the
evaluation).
For each indicator category, the
number for indicators shown must
equal the sum of the 3 columns to the
right of this column. If unequal, cells
will turn red indicating that some data
in the AMPER sheet is missing
Each green colored cell uses 70 as a
baseline for “minimum acceptable”
performance. Compare this Section
Score to a “minimum acceptable” 70 to
gauge Section I performance.

Performance Evaluation Tab
11
Section II – Facilities
Version 2.1 explicitly includes 2 target scores for rest areas and facilities. Per procedure:
1- A score of 85 minimum is required for each monthly inspection (unless modified by contract
scope).
2- A score of 90 minimum is required for a continuous period of 6 months. For that purpose,
the first day and the last day of the AMPER period are used to determine this 6 month period.
3- Target score may be changed based on Contractual requirements.
4- The “Target 6-Month Average Score” field is included for information only (used for
determining the No. of facilities meeting the target, not used in calculating the score.)
Enter the total number of Rest
Area inspections (Form# 850-
045-002) that were performed
by Contractor and
Department, jointly and
separately, during the review
period.
Enter here what procedure/
contract requires as a
minimum acceptable Rest
Area monthly inspection
score. This is usually 85.
Average together all
inspection scores that “failed”
(were less than target). Enter
result here. Decimals are ok.
If all inspections passed, this
entire row is removed from
view.
Comment card related
information is retrieved using
the “OPINIATOR” software

Performance Evaluation Tab
12
Section III – Bridges and Ancillary Structures
Section III combines pass/fail performance indicators from the Section I, II, III Tab, with results from
Quality Assurance Reviews of field inspection and work order repairs. Section III is completed if your
contract includes inspection or maintenance of bridges or any other ancillary structure listed in any of the
checkbox. For example, if your contract does not include bridges, but does include high-mast light poles,
then this section WILL be included as a part of your AMPER. Data for the inspection results is entered
here, but data for the indicators is entered on the “Sections I, II, III Detail” tab. Add paragraph about
excellent; established by bridge team beyond what inspection
The top row indicates
Inspection (I). The row below
indicates Maintenance (M)
For Structures Inspection QAs,
the “UNACCEPTABLE”,
“ACCEPTABLE” and
“EXCELLENT” categories are
mutually exclusive
For this and the next 2 rows,
this number is the sum of the
2 columns to the right and is
reflecting the quality of the
work order.
For this row, this number is
the sum of the 2 columns to
the right and is reflecting the
timeliness of the work order.

Performance Evaluation Tab
13
Customization of Section II, III and IV to enhance contract
Included sections
Sections II, III, & IV are optional and should be checked based on what your contract included. At least
one of these three Sections MUST be checked, otherwise red error indicators will appear.
Sections II and III imbalances
Due to potential imbalance among Sections II and III and other sections, the AMPER includes an option
to adjust the percentage for those two sections. Checkboxes may be used if the District feels there is an
imbalance of few structures and/or facilities. After checking the box, the user can offer a reduced
Weighting Percentage for Section II (facilities) and/or Section III (structures). The District can therefore
assign a percentage for each of these sections at the inception of the contract based on numerous factors
and existing imbalances. These reduced percentages should stay the same for the entire duration of the
contract. Percentage changes for Section II or III may be discussed with the OOM and must be
approved by the OOM according to procedure 375-000-005.
Check here if your contract
includes facilities
Check here if your contract includes
Bridges or Ancillary Structures
Check here if your contract
includes MRP evaluated items
Check here if an alternate % for facilities is to be used
in this and all subsequent AMPER evaluations
Enter the alternate percentage selected. This number
is ignored if the checkbox is unchecked. It is required if
the checkbox is checked.

Performance Evaluation Tab
14
Section IV – MRP
Section IV uses results from periodic MRP evaluations and Interim MRP evaluations to generate a
performance score. No additional QA/inspection work is performed for this section – it is simply a
summary of results already collected. All data for the MRP results are entered here; you will not need the
other tabs to complete this section.
There are usually three MRP cycles (see examples below) each year while the AMPER is completed
twice per year. Consequently, every other AMPER may cover one to three MRP cycles, depending upon
the starting date. MRP overall scores, Element and Characteristic scores have to be provided for each
period.
Target scores for each applicable period is set as default: MRP overall score (80), Number of Element (5)
and Number of Characteristic (35). The MRP overall score target may only be changed if the contract
stipulates a different target. The number of elements and characteristics may only be reduced if the
contract expressly exclude one or more of them (rare). The District may elect to do an optional interim
evaluation. Target score for characteristics meeting a minimum score is usually 70 unless otherwise
indicated in contract. The specific characteristic reviewed is determined by the District at the inception
of the contract.
The user should list all periods covered by this AMPER in chronological order. The first row shown on
the AMPER may not necessarily be MRP Period one. For example, if your AMPER covers MRP periods
2 and 3, period 2 will be on the first row and period 3 on the second row. For another example, if your
AMPER covers MRP periods 3 and 1, period 3 will be on the first row and period 1 on the second row.
To avoid confusion, the following rules need to be followed when determining periods reported:
1- MRP periods cover 4 months and may only start on July 1st, November 1st or March 1st.
2- AMPER periods cover six months and Periods may start at any time provided the
starting dates are always the same for the duration of the contract, with rare
exceptions.
3- MRP field evaluations shall be completed by the last day of each MRP period. The date
the MRP report is finalized is:
a. when the field evaluation report is complete and the field report is
signed/concurred by the contractor
or
b. the Contractor’s review period has expired.
4- At least one MRP period must be reported during an AMPER period.

Performance Evaluation Tab
15
Here is an example of MRP section report with 1 period only:
Here is an example of MRP section report with 2 periods:
Here is an example of MRP section report with 3 periods:

Performance Evaluation Tab
16
MRP related scores explanation:
Default target MRP score.
Usually 80 (can be
changed if contract
documents show a
different target score)
Total number of
MRP elements.
Almost always 5
Total number of MRP
characteristics. If a characteristic
does not exist within the project
limits, or a characteristic is not
randomly selected for a specific
period, it still should be counted
unless expressly excluded in the
contract language.
Overall MRP score
for specific period.
Number of interim characteristics reviewed. Facility
types are reviewed separately. For example, if 2
characteristics were reviewed over 3 Facility types, a
“6” would be entered
Number of MRP
characteristics meeting
a 70 score. Contract
may require a different
score
Number of MRP
elements meeting a
75 score. Contract
may require a
different passing score
3 periods are
possible. Usually 1 or
2 periods are the
norm
17
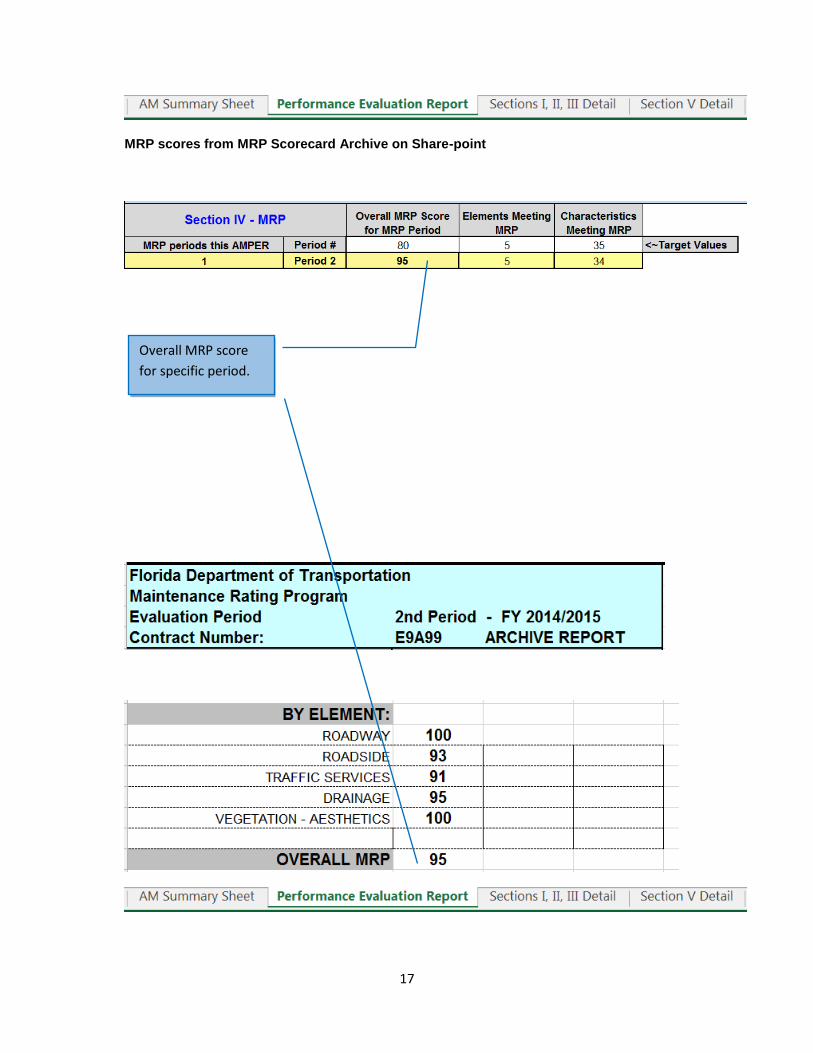
MRP scores from MRP Scorecard Archive on Share-point
Overall MRP score
for specific period.

18
Warning when MRP sequences are not possible:
A warning showing that 2 consecutives sequences are not possible is included in this section. In the
example included below, if period 3 is the first selected period, then period 1 should follows (as shown).
However, period 2 and not period 3 should follow.

19
Section V – Performance Intangibles and Bonus Opportunities
Performance Intangibles
The user should also refer to the tab labeled “Section V Detail” to understand this section. The table
below is basically summarizing Section V Detail.
Bonus Opportunities
This section also includes a bonus opportunity for using the Youth Work Experience Program and DBE
Usage. A maximum of 2 points added to the Semi-Annual Contractor Performance Score is possible.
The bonus is determined based upon a minimum percentage of the yearly contract amount spent on the
program:
1 Bonus point is earned when DBE Usage
Goals are achieved
If more than 0.25 % of Annual Contract
Amount (prorated to the number of
months covered by the AMPER, e.g. half
for a six month period) is spent on
program, 1 Bonus point is gained. If more
than 1 % of Annual Contract Amount
(prorated) is spent on program, 2 Bonus
points are gained.

20
Sections I, II, III Detail A spell check has been introduced in this section:
General Notes - Review Types: There are 3 types of Department’s review used in the AMPER:
Quality Assurance (QA) Inspection of Records
Review Type 1 will be an office review of records/work orders /reports /corrective action(s) taken. This
review will look at the AM Contractor records and may look at District records. All reviews will be office
only (no field work or additional inspections required). A very important concept behind this type of
review is the District’s trust of AM contractor records. The District will trust that contractor records &
reports are accurate. This concept makes the District’s QA task easier and builds trust and partnering
with the contractor. However, if a contractor ever breaches this trust with misleading or inaccurate
documents/reports, it is a serious offense to the contracting relationship and should be dealt with sternly.
Make a point to inform your contractor of this trust concept and caution against a breach of trust. If a
District suspects inaccurate contractor data or doubts report validity, a field inspection may be performed
to verify records, but only with close coordination with the Contractor as to why the District is performing
the field review. Note that Type 1 compliance indicators require 100% compliance unless otherwise
indicated.
Quality Assurance (QA) Inspection – Field Review
Review Type 2 will be a field review of randomly selected locations. Location randomization is left to the
District. The District must pre-establish a sample size on which to perform a Type 2 review. The sample
size must be set at the start of the AMPER evaluation period and made known to the contractor. The
sample size can be a set number of samples or a percent of samples or some other way to identify a
sample set. The sample size should be based on the District’s confidence in contract performance –

21
more samples (or sample size) for less confidence, fewer or no samples for high confidence. The sample
locations should not be pre-determined, but should be established at the time or field review. Note that
Type 2 compliance indicators indicate a specific percent compliance the contractor must achieve to
receive a “Performance Met” rating.
Field/Record Discovery
Review Type 3 will be a summary of deficiencies the District discovers or becomes aware of during the 6-month AMPER evaluation period. It is VERY important that the District shall not actively seek out deficiencies. Some examples as to how a district may find an indicator as “Performance Not Met” would be if a 3rd party called to complain about improper M.O.T. setup (and the violation was verified) or the Coast Guard calls due to failure to open a movable bridge or the District notices that a guardrail or attenuator has remained damaged beyond the time allowed to repair. All Type 3 review items will be rated as “Performance Met” unless there is some evidence that performance standards were not met. This means, that if the District does not know if the contractor met all performance standards for a compliance indicator, then the contractor is assumed to have met performance. Here is a good way to think of Review Type 3:
The Department assumes that our contractors are putting forth a good-faith effort to meet performance measures, thus the Department assumes that the Contractor will always meet performance requirements. Therefore, there is no need to spend Department resources to verify performance has been met. However, if the District discovers the contractor did not meet performance requirements, the District has an avenue (the AMPER) to reflect this failure to perform.
Note that a single discovery of failure to meet a Review Type 3 performance measure is grounds for a
“Does Not Meet” rating.

22
Compliance Indicators
Sections I, II and III have been organized in subsections for clarity. Each compliance indicator presents
the features below:
In addition, certain compliance indicators require that a number of samples (or percent of total sample) to
review must be established at the beginning of the period as shown on next page. Enter the pre-
determined sample size (with corresponding unit of measure) here and share this data with your
contractor. Random locations should be selected when the QA review is performed. The process to
randomly select QA locations is at the District’s discretion. The location selection process should be
openly shared with the AM contractor.
Critical requirements
are organized in
sections and
subsections for clarity
See previous
paragraphs for review
type explanations
Enter details of QA
results in these boxes
See next paragraph for
choice of evaluation
results

23
For type 2 reviews, if you choose to not perform a review, leave the box blank if no inspections are to be
performed during the AMPER period. The QA Sample Size box should be left blank from the start, and
nothing should be evaluated in this field for this AMPER period. The result of “PERFORMANCE MET”
then is recorded in the AMPER.
Number of samples (or percent of total
sample) must be established at the
beginning of the period. The number of
samples must have units, e.g. 5
attenuators or 10 guardrail reports

24
Additional Compliance Indicators Specifically Developed for Contract
The Districts have the option of developing criteria requirements and compliance indicators for seven (or
fewer) areas that they think are necessary for their AM Contract. The District will also specify a required
Review Type using a drop-down box. These user-defined compliance indicators must be approved by
the Office of Maintenance before use on your AMPER.
For Type 1 & 3 reviews, the user
should (but not required to)
merge these two cells together to
match the format of the rest of
the AMPER.
Enter specific, measurable
performance criteria here. The
criteria must be based on contract
document requirements.
the rest of the AMPER.

25
Choice of Evaluation Results
The District may elect to use the label “NO KNOWN DEFICIENCIES” for cases where no checks were
performed and the District is uncomfortable in using the label “PERFORMANCE MET” (implies some level of checking). Nonetheless, calculation-wise, the label “NO KNOWN DEFICIENCIES” is equivalent to the label “PERFORMANCE MET”.
Drop Down Menu allows user to
choose an evaluation result

26
Section V Detail
A spell check has been introduced in this section:
This part of the AMPER evaluation is based upon the District evaluation of the AM Contractor’s
cooperation with the Department and other entities (Government Agencies, other contractors, Public,
etc…), the easiness the Department had in administering the contract and innovative and forthcoming
effort from the AM contractor to occasionally interpret contract requirements and accomplish them. This
part is necessarily based upon the Department’s judgment and therefore a bit more subjective.
The methodology used to determine the scores should be explained: Was the score selected by an
individual, a group consensus, a vote, a management escalation process, or some other way? If different
methods were used for each question, include more specifics in each Notes/Comments area for each
question. Here is an example of a project methodology:
“The Project Manager met with 4 others involved with the contract. Each analyzed the 4
questions below separately and presented their thoughts to the group. After discussion, a
consensus rating for each of the questions was reached. These results were then presented to
the DME who agreed with the 3 first comments and scores and slighted adjusted the 4th.”
Enter a score between 4 and 10 using the
drop down menu and the recommended
score based upon contractor’s performance
This column is for the AM Project Manager to state
facts/document actions taken during this 6-month Evaluation
period. Since this Section V is subjective, you are encouraged
to provide plenty of supportive notes & comments.

INSTRUCTIONS & GUIDANCE
For Determining Scores for the
ASSET MAINTENANCE
CONTRACTOR
PERFORMANCE
EVALUATION REPORT
(AMPER version 2.2)
Volume II

August 2017
Glossary ....................................................................................................................................................... 1
Introduction ................................................................................................................................................ 2
Calculation of the Raw score for each of the 5 Sections.................................................................... 3
Section I Raw Score Calculation ............................................................................................................... 3
Section II Sub-scores and Raw Score Calculation .................................................................................... 4
First Sub-score ...................................................................................................................................... 4
Second Sub-score .................................................................................................................................. 5
Third Sub-score ..................................................................................................................................... 7
Sub-score Weights ................................................................................................................................ 8
Section III Sub-scores and Raw Score Calculation ................................................................................. 10
First Sub-score .................................................................................................................................... 10
Second Sub-score ................................................................................................................................ 10
Third Sub-score ................................................................................................................................... 11
Sub-score Weights .............................................................................................................................. 12
Section IV Raw Score Calculation........................................................................................................... 14
Step 1 – Average Overall Sub-score .................................................................................................... 14
Step 2 – Average Characteristics and Interim combined Sub-score ................................................... 15
Step 3 – MRP Raw Score ..................................................................................................................... 16
Section V Raw Score Calculation ............................................................................................................ 18
Overall AMPER Score Calculation – Bonus Points ............................................................................. 19
Step 1 – Selection of unadjusted Weight Factors .................................................................................. 19
Step 2 – Selection of unadjusted percentage that will be affected by boxes checked ........................ 19
Step 3 – Percentage changed according to boxes checked .................................................................. 20
Step 4 - Final Adjustment for Low Volume Asset ................................................................................. 22
Step 5 – Final calculation and bonus points .......................................................................................... 23
Appendix A ................................................................................................................................................ 25

Glossary
1
AASHTO: American Association of State Highway Transportation Officials
AMPER: Asset Maintenance Contractor Performance Evaluation Report
BrM: AASHTOWARE Bridge Management Database (formerly PONTIS)
CBT: Computer Based Training
CI: Compliance Indicator
CIDR: Comprehensive Inventory Data Report generated by BrM
DBE: Disadvantaged Business Enterprise
FAC: Florida Administrative Code
FARC: Feasible Action Review Committee
FDOT: Florida Department of Transportation
HML: High Mast Light Pole
MOT: Maintenance of Traffic
MRP: Maintenance Rating Program
O/H: Overhead Sign
QA: Quality Assurance
QC: Quality Control
RCI: Roadway Characteristics Inventory
RFP: Request for Proposal
WO: Work Order

Introduction
2
The Volume II of this guide provides information about how to calculate section scores in each Section of
the AMPER in the “Performance Evaluation Tab”. The guide also shows how the overall AMPER score is
evaluated.
The first part of this guide explains how the raw score for each section is calculated. In Sections II and III,
the raw scores are calculated based upon intermediate Sub-scores using specific weighing factors. The
calculation of those Sub-scores and weighing factors are provided. The sub scores are always evaluated
to more or equal to 0.
The Second part explains, after the Section Raw Score are calculated, how each section is weighed, how
bonus point(s) are attributed for “youth work experience” and “Goals Achieved for DBE Usage” and how
the overall AMPER score is calculated.
Here are the rules used in the guide to clarify the use of equations:
1- If the equation is used as a formula, the equation is not highlighted.
𝐹𝑖𝑟𝑠𝑡 𝑆𝑢𝑏𝑠𝑐𝑜𝑟𝑒
=
2 ∗ (70 + 6 ∗ (100 ∗ 𝑁𝑜. 𝑜𝑓 𝐼𝑛𝑠𝑝𝑒𝑐𝑡. 𝑇𝑎𝑟𝑔𝑒𝑡 𝑆𝑐𝑜𝑟𝑒
𝑁𝑜. 𝑜𝑓 𝐹𝑎𝑐𝑖𝑙𝑖𝑡𝑦 𝐼𝑛𝑠𝑝𝑒𝑐𝑡𝑖𝑜𝑛− 95)) + 100 − 6 ∗ (𝐴𝑣𝑔 𝑜𝑓 𝑆𝑢𝑏 − 𝑇𝑎𝑟𝑔𝑒𝑡 𝐼𝑛𝑠𝑝𝑒𝑐𝑡𝑖𝑜𝑛𝑠)
3
2- If the equation is an example of the formula using specific AMPER numbers, the equation
is highlighted.
𝐹𝑖𝑟𝑠𝑡 𝑆𝑢𝑏𝑠𝑐𝑜𝑟𝑒 =
2 ∗ (70 + 6 ∗ (100 ∗ 57
58− 95)) + 100 − 6 ∗ (85 − 79)
3= 81.1

Section I Raw Score Calculation
3
Calculation of the Raw Score for each of the 5 Sections:
For each section, a raw score is directly calculated or alternatively, the Raw Score is evaluated as:
𝑅𝑎𝑤 𝑆𝑐𝑜𝑟𝑒 = ∑𝑆𝑢𝑏𝑡𝑜𝑡𝑎𝑙 = ∑𝑆𝑢𝑏𝑠𝑐𝑜𝑟𝑒 ∗ 𝑊𝑒𝑖𝑔ℎ𝑡
Section I Raw Score calculation
Each of the 16 numbers in the table shown below is the tally of the number of indicators included in the
“Section I,II,III Detail Tab” meeting simultaneously both columns and row descriptions. For instance,
there are 4 compliance indicators that do not meet the “Field Operations” requirement in the “Section
I,II,III Detail Tab”.
Raw Score =
100 ∗𝑇𝑜𝑡𝑎𝑙 𝑁𝑜. 𝑜𝑓 𝐼𝑛𝑑𝑖𝑐𝑎𝑡𝑜𝑟𝑠 − 𝑇𝑜𝑡𝑎𝑙 𝑁𝑜. 𝑁𝑜𝑡 𝑖𝑛 𝐶𝑜𝑛𝑡𝑟𝑎𝑐𝑡 − 𝑇𝑜𝑡𝑎𝑙 𝑁𝑜. 𝑡ℎ𝑎𝑡 𝐷𝑜𝑒𝑠 𝑁𝑜𝑡 𝑀𝑒𝑒𝑡1.3
𝑇𝑜𝑡𝑎𝑙 𝑁𝑜. 𝑜𝑓 𝐼𝑛𝑑𝑖𝑐𝑎𝑡𝑜𝑟𝑠 − 𝑇𝑜𝑡𝑎𝑙 𝑁𝑜. 𝑁𝑜𝑡 𝑖𝑛 𝐶𝑜𝑛𝑡𝑟𝑎𝑐𝑡
In the example above, the Raw Score is:
𝑅𝑎𝑤 𝑆𝑐𝑜𝑟𝑒 = 100 ∗53 − 13 − 61.3
53 − 13= 74.32
The Raw score is always positive or equal to 0.

Section II Raw Score Calculation
4
Section II Sub-scores and Raw Score calculation
First Sub-score
There are 4 Sub-Scores for this section. All the Sub-scores can vary between 0 and 100. The First Sub-
Score is evaluated as:
If:
100 ∗ 𝑁𝑜. 𝑜𝑓 𝐼𝑛𝑠𝑝𝑒𝑐𝑡𝑖𝑜𝑛𝑠 𝑚𝑒𝑒𝑡𝑖𝑛𝑔 𝑇𝑎𝑟𝑔𝑒𝑡 𝑆𝑐𝑜𝑟𝑒
𝑁𝑜. 𝑜𝑓 𝐹𝑎𝑐𝑖𝑙𝑖𝑡𝑦 𝐼𝑛𝑠𝑝𝑒𝑐𝑡𝑖𝑜𝑛≥ 95
𝐹𝑖𝑟𝑠𝑡 𝑆𝑢𝑏𝑠𝑐𝑜𝑟𝑒
=
2 ∗ (70 + 6 ∗ (100 ∗ 𝑁𝑜. 𝑜𝑓 𝐼𝑛𝑠𝑝𝑒𝑐𝑡. 𝑇𝑎𝑟𝑔𝑒𝑡 𝑆𝑐𝑜𝑟𝑒
𝑁𝑜. 𝑜𝑓 𝐹𝑎𝑐𝑖𝑙𝑖𝑡𝑦 𝐼𝑛𝑠𝑝𝑒𝑐𝑡𝑖𝑜𝑛− 95)) + 100 − 6 ∗ (𝐴𝑣𝑔 𝑜𝑓 𝑆𝑢𝑏 − 𝑇𝑎𝑟𝑔𝑒𝑡 𝐼𝑛𝑠𝑝𝑒𝑐𝑡𝑖𝑜𝑛𝑠)
3
𝐹𝑖𝑟𝑠𝑡 𝑆𝑢𝑏𝑠𝑐𝑜𝑟𝑒 =
2 ∗ (70 + 6 ∗ (100 ∗ 57
58− 95)) + 100 − 6 ∗ (85 − 79)
3= 81.1
Shown as 81 in the AMPER.
_________________________

Section II Raw Score Calculation
5
If:
100 ∗ 𝑁𝑜. 𝑜𝑓 𝐼𝑛𝑠𝑝𝑒𝑐𝑡𝑖𝑜𝑛𝑠 𝑚𝑒𝑒𝑡𝑖𝑛𝑔 𝑇𝑎𝑟𝑔𝑒𝑡 𝑆𝑐𝑜𝑟𝑒
𝑁𝑜. 𝑜𝑓 𝐹𝑎𝑐𝑖𝑙𝑖𝑡𝑦 𝐼𝑛𝑠𝑝𝑒𝑐𝑡𝑖𝑜𝑛≤ 95
𝐹𝑖𝑟𝑠𝑡 𝑆𝑢𝑏𝑠𝑐𝑜𝑟𝑒
= 2 ∗ (
100 ∗ 𝑁𝑜. 𝑜𝑓 𝐼𝑛𝑠𝑝𝑒𝑐𝑡. 𝑚𝑒𝑒𝑡𝑖𝑛𝑔 𝑇𝑎𝑟𝑔𝑒𝑡 𝑆𝑐𝑜𝑟𝑒𝑁𝑜. 𝑜𝑓 𝐹𝑎𝑐𝑖𝑙𝑖𝑡𝑦 𝐼𝑛𝑠𝑝𝑒𝑐𝑡𝑖𝑜𝑛
− 25) + 100 − 6 ∗ (𝐴𝑣𝑔 𝑜𝑓 𝑆𝑢𝑏 − 𝑇𝑎𝑟𝑔𝑒𝑡 𝐼𝑛𝑠𝑝𝑒𝑐𝑡. )
3
Below is another example:
𝐹𝑖𝑟𝑠𝑡 𝑆𝑢𝑏𝑠𝑐𝑜𝑟𝑒 = 2 ∗ (
100 ∗ 5058
− 25) + 100 − 6 ∗ (85 − 79)
3= 62.14
_________________________
Shown as 62 in the AMPER.
Second Sub-score
The second Sub-Score is evaluated as:
If:
100 ∗ 𝑁𝑜. 𝑜𝑓 𝐹𝑎𝑐𝑖𝑙𝑖𝑡𝑖𝑒𝑠 𝑚𝑒𝑒𝑡𝑖𝑛𝑔 6 𝑚𝑜𝑛𝑡ℎ 𝑇𝑎𝑟𝑔𝑒𝑡 𝑆𝑐𝑜𝑟𝑒
𝑇𝑜𝑡𝑎𝑙 𝑁𝑜. 𝑜𝑓 𝐹𝑎𝑐𝑖𝑙𝑖𝑡𝑖𝑒𝑠≥ 95

Section II Raw Score Calculation
6
𝑆𝑒𝑐𝑜𝑛𝑑 𝑆𝑢𝑏𝑠𝑐𝑜𝑟𝑒
= 70 + 6 ∗ (100 ∗ 𝑁𝑜. 𝑜𝑓 𝐹𝑎𝑐𝑖𝑙𝑖𝑡𝑖𝑒𝑠 𝑚𝑒𝑒𝑡𝑖𝑛𝑔 6 𝑚𝑜𝑛𝑡ℎ 𝑇𝑎𝑟𝑔𝑒𝑡 𝑆𝑐𝑜𝑟𝑒
𝑇𝑜𝑡𝑎𝑙 𝑁𝑜. 𝑜𝑓 𝐹𝑎𝑐𝑖𝑙𝑖𝑡𝑖𝑒𝑠− 95)
Example:
𝑆𝑒𝑐𝑜𝑛𝑑 𝑆𝑢𝑏𝑠𝑐𝑜𝑟𝑒 = 70 + 6 ∗ (100 ∗ 96
100− 95) = 76
_________________________
If:
100 ∗ 𝑁𝑜. 𝑜𝑓 𝐼𝑛𝑠𝑝𝑒𝑐𝑡𝑖𝑜𝑛𝑠 𝑚𝑒𝑒𝑡𝑖𝑛𝑔 𝑇𝑎𝑟𝑔𝑒𝑡 𝑆𝑐𝑜𝑟𝑒
𝑁𝑜. 𝑜𝑓 𝐹𝑎𝑐𝑖𝑙𝑖𝑡𝑦 𝐼𝑛𝑠𝑝𝑒𝑐𝑡𝑖𝑜𝑛≤ 95
𝑆𝑢𝑏𝑠𝑐𝑜𝑟𝑒 = 2 ∗ (100 ∗ 𝑁𝑜. 𝑜𝑓 𝐹𝑎𝑐𝑖𝑙𝑖𝑡𝑖𝑒𝑠 𝑚𝑒𝑒𝑡𝑖𝑛𝑔 6 𝑚𝑜𝑛𝑡ℎ 𝑇𝑎𝑟𝑔𝑒𝑡 𝑆𝑐𝑜𝑟𝑒
𝑇𝑜𝑡𝑎𝑙 𝑁𝑜. 𝑜𝑓 𝐹𝑎𝑐𝑖𝑙𝑖𝑡𝑖𝑒𝑠− 60)
Example:
𝑆𝑢𝑏𝑠𝑐𝑜𝑟𝑒 = 2 ∗ (100 ∗ 89
100− 60) = 58
_________________________

Section II Raw Score Calculation
7
Third Sub-score
The third Sub-Score is evaluated as:
If: 100 ∗ 𝑁𝑜. 𝑜𝑓 𝐶𝑢𝑠𝑡𝑜𝑚𝑒𝑟𝑠 𝑐𝑜𝑛𝑡𝑎𝑐𝑡𝑒𝑑 𝑜𝑛 𝑡𝑖𝑚𝑒
𝑁𝑜. 𝑜𝑓 𝑐𝑢𝑠𝑡𝑜𝑚𝑒𝑟𝑠 𝑟𝑒𝑞𝑢𝑒𝑠𝑡𝑖𝑛𝑔 𝑐𝑜𝑛𝑡𝑎𝑐𝑡≥ 95
𝑆𝑢𝑏𝑠𝑐𝑜𝑟𝑒 = 70 + 6 ∗ (100 ∗ 𝑁𝑜. 𝑜𝑓 𝐶𝑢𝑠𝑡𝑜𝑚𝑒𝑟𝑠 𝑐𝑜𝑛𝑡𝑎𝑐𝑡𝑒𝑑 𝑜𝑛 𝑡𝑖𝑚𝑒
𝑁𝑜. 𝑜𝑓 𝑐𝑢𝑠𝑡𝑜𝑚𝑒𝑟𝑠 𝑟𝑒𝑞𝑢𝑒𝑠𝑡𝑖𝑛𝑔 𝑐𝑜𝑛𝑡𝑎𝑐𝑡− 95)
_________________________
If: 100 ∗ 𝑁𝑜. 𝑜𝑓 𝐶𝑢𝑠𝑡𝑜𝑚𝑒𝑟𝑠 𝑐𝑜𝑛𝑡𝑎𝑐𝑡𝑒𝑑 𝑜𝑛 𝑡𝑖𝑚𝑒
𝑁𝑜. 𝑜𝑓 𝑐𝑢𝑠𝑡𝑜𝑚𝑒𝑟𝑠 𝑟𝑒𝑞𝑢𝑒𝑠𝑡𝑖𝑛𝑔 𝑐𝑜𝑛𝑡𝑎𝑐𝑡≤ 95
𝑆𝑢𝑏𝑠𝑐𝑜𝑟𝑒 = 2 ∗ (100 ∗ 𝑁𝑜. 𝑜𝑓 𝐶𝑢𝑠𝑡𝑜𝑚𝑒𝑟𝑠 𝑐𝑜𝑛𝑡𝑎𝑐𝑡𝑒𝑑 𝑜𝑛 𝑡𝑖𝑚𝑒
𝑁𝑜. 𝑜𝑓 𝑐𝑢𝑠𝑡𝑜𝑚𝑒𝑟𝑠 𝑟𝑒𝑞𝑢𝑒𝑠𝑡𝑖𝑛𝑔 𝑐𝑜𝑛𝑡𝑎𝑐𝑡− 60)
_________________________
Fourth Subscore
The fourth Sub-Score is evaluated as:
𝑆𝑢𝑏𝑠𝑐𝑜𝑟𝑒 = (𝑁𝑜. 𝑜𝑓 𝐼𝑛𝑑𝑖𝑐𝑎𝑡𝑜𝑟𝑠 − 𝑁𝑜. 𝑁𝑜𝑡 𝑖𝑛 𝐶𝑜𝑛𝑡𝑟𝑎𝑐𝑡 − 𝑁𝑜. 𝐷𝑜𝑒𝑠 𝑛𝑜𝑡 𝑀𝑒𝑒𝑡1.3
𝑁𝑜. 𝑜𝑓 𝐼𝑛𝑑𝑖𝑐𝑎𝑡𝑜𝑟𝑠 − 𝑁𝑜. 𝑁𝑜𝑡 𝑖𝑛 𝐶𝑜𝑛𝑡𝑟𝑎𝑐𝑡)

Section II Raw Score Calculation
8
Example:
𝑆𝑢𝑏𝑠𝑐𝑜𝑟𝑒 = Integer (100 ∗ (6 − 1 − 21.3
6 − 1)) = Integer(50.75) = 50
_________________________
Section II Sub-Score Weights
Shown in the red box below is an example of specific Subscore weights:
Those specific Sub-score weights are evaluated using the rules and formula in the table below.
Weight - Item measured Name in
Equations
Facility Security is included in
contract
Facility Security is not included
in contract No. of Inspections Meeting Target
Score FI FI = 100 % - F6 – FC - FS
No. of Facilities Meeting 6-month Average Score
F6 F6 = (100 % - FC –FS) / 2
Facility Customer Comments FC FC = 22 % FC = 27 %
Facility Security FS FS = 18 % FS = 0 %

Section II Raw Score Calculation
9
Using the specific AMPER data above:
Weight - Item measured Name in
Equations
Facility Security is included in
contract
Facility Security is not included in
contract No. of Inspections Meeting Target
Score FI FI = 100 % - 30 % – 22 % - 18 % = 30 %
No. of Facilities Meeting 6-month Average Score
F6 F6 = (100 % - 22 % –18 %) / 2 = 30 %
Facility Customer Comments FC FC = 22 %
Facility Security FS FS = 18 %
The overall section II Raw Score is calculated as:
𝑅𝑎𝑤 𝑆𝑐𝑜𝑟𝑒 = ∑ 𝑆𝑢𝑏𝑆𝑐𝑜𝑟𝑒 ∗ 𝑊𝑒𝑖𝑔ℎ𝑡 = ∑ 𝑆𝑢𝑏𝑡𝑜𝑡𝑎𝑙
Example:
𝑅𝑎𝑤 𝑆𝑐𝑜𝑟𝑒 = (100 ∗ 30%) + (40 ∗ 30%) + (90 ∗ 22%) + (100 ∗ 18%) = 79.9
Shown as 80 in the AMPER

Section III Raw Score Calculation
10
Section III Sub-scores and Raw Score calculation
Each of the 12 numbers in the table shown below is the tally of the number of indicators included in the
“Section I, II, III Detail Tab” meeting simultaneously both columns and row descriptions. For instance,
there is 1 compliance indicator that does not meet the “Bridges” requirement in the “Section I, II, III Detail”
Tab.
𝐹𝑖𝑟𝑠𝑡 𝑆𝑢𝑏𝑠𝑐𝑜𝑟𝑒 =
𝑇𝑜𝑡𝑎𝑙 𝑁𝑜. 𝑜𝑓 𝐼𝑛𝑑𝑖𝑐𝑎𝑡𝑜𝑟𝑠 − 𝑇𝑜𝑡𝑎𝑙 𝑁𝑜. 𝑁𝑜𝑡 𝑖𝑛 𝐶𝑜𝑛𝑡𝑟𝑎𝑐𝑡 − 𝑇𝑜𝑡𝑎𝑙 𝑁𝑜. 𝑡ℎ𝑎𝑡 𝐷𝑜𝑒𝑠 𝑁𝑜𝑡 𝑀𝑒𝑒𝑡1.3
𝑇𝑜𝑡𝑎𝑙 𝑁𝑜. 𝑜𝑓 𝐼𝑛𝑑𝑖𝑐𝑎𝑡𝑜𝑟𝑠 − 𝑇𝑜𝑡𝑎𝑙 𝑁𝑜. 𝑁𝑜𝑡 𝑖𝑛 𝐶𝑜𝑛𝑡𝑟𝑎𝑐𝑡
In the example above, the First Sub-score is:
𝐹𝑖𝑟𝑠𝑡 𝑆𝑢𝑏𝑠𝑐𝑜𝑟𝑒 =23 − 3 − 11.3
23 − 3= 95
The Raw score is always positive or equal to 0.
_________________________
The Second Sub-score for “Field QA of Structures Inspections” is evaluated as:
𝑆𝑒𝑐𝑜𝑛𝑑 𝑆𝑢𝑏𝑠𝑐𝑜𝑟𝑒 = 80 − 150 ∗𝑁𝑜. 𝑈𝑛𝑎𝑐𝑐𝑒𝑝𝑡𝑎𝑏𝑙𝑒
𝑁𝑜. 𝑜𝑓 𝑅𝑒𝑣𝑖𝑒𝑤𝑠+ 20 ∗
𝑁𝑜. 𝐸𝑥𝑐𝑒𝑙𝑙𝑒𝑛𝑡
𝑁𝑜. 𝑜𝑓 𝑅𝑒𝑣𝑖𝑒𝑤𝑠
Example:

Section III Raw Score Calculation
11
In the example above, the Sub-score is:
𝑆𝑒𝑐𝑜𝑛𝑑 𝑆𝑢𝑏𝑠𝑐𝑜𝑟𝑒 = 80 − 150 ∗0
14+ 20 ∗
0
14= 80
_________________________
The third Sub-score for Field QA of completed WOs:
𝑇ℎ𝑖𝑟𝑑 𝑆𝑢𝑏𝑆𝑐𝑜𝑟𝑒
= (100 ∗ 𝑁𝑜. 𝐴𝑐𝑐𝑒𝑝𝑡𝑃𝑟𝑖𝑜𝑟1 + 1
(𝑁𝑜. 𝑈𝑛𝑎𝑐𝑐𝑒𝑝𝑡𝑃𝑟𝑖𝑜𝑟1) ∗ ((𝑁𝑜. 𝑜𝑓 𝑅𝑒𝑣𝑖𝑒𝑤𝑠𝑃𝑟𝑖𝑜𝑟1) ∗ 1.5 + 20) + 𝑁𝑜. 𝐴𝑐𝑐𝑒𝑝𝑡𝑃𝑟𝑖𝑜𝑟1 + 1)
∗ (𝑁𝑜. 𝐴𝑐𝑐𝑒𝑝𝑡𝑃𝑟𝑖𝑜𝑟2 + 1
(𝑁𝑜. 𝑈𝑛𝑎𝑐𝑐𝑒𝑝𝑡𝑃𝑟𝑖𝑜𝑟2) ∗ (𝑁𝑜. 𝑜𝑓 𝑅𝑒𝑣𝑖𝑒𝑤𝑠𝑃𝑟𝑖𝑜𝑟2
4+ 5) + 𝑁𝑜. 𝐴𝑐𝑐𝑒𝑝𝑡𝑃𝑟𝑖𝑜𝑟2 + 1
) ∗
𝑁𝑜. 𝐴𝑐𝑐𝑒𝑝𝑡𝑃𝑟𝑖𝑜𝑟3 + 2 (𝑁𝑜. 𝐴𝑐𝑐𝑒𝑝𝑡𝑃𝑟𝑖𝑜𝑟3 + 1)⁄
(𝑁𝑜. 𝑈𝑛𝑎𝑐𝑐𝑒𝑝𝑡𝑃𝑟𝑖𝑜𝑟3)2 + 𝑁𝑜. 𝐴𝑐𝑐𝑒𝑝𝑡𝑃𝑟𝑖𝑜𝑟3 +2
𝑁𝑜. 𝐴𝑐𝑐𝑒𝑝𝑡𝑃𝑟𝑖𝑜𝑟3 + 1
Below is an example using specific data:
𝑇ℎ𝑖𝑟𝑑 𝑆𝑢𝑏𝑠𝑐𝑜𝑟𝑒 = (100 ∗33 + 1
1 ∗ ((34) ∗ 1.5 + 20) + 33 + 1) ∗ (
0 + 1
(0) ∗ (04 + 5) + 0 + 1
) ∗
(33 + 2 (33 + 1)⁄
(1)2 + 33 +2
33 + 1
)

Section III Raw Score Calculation
12
𝑇ℎ𝑖𝑟𝑑 𝑆𝑢𝑏𝑠𝑐𝑜𝑟𝑒 = (100 ∗ 32.38) ∗ (1) ∗ (0.97) = 31.43
Shown as 31 in the AMPER
_________________________
Section III Sub-score Weights
In the red box below, the Sub-score weights are shown:
Those specific Sub-score weights are evaluated using the rules and formula in the table below.
Weight - Item measured Name in
Equations Condition
Sub-score Weighing Factor Value
General – Bridges – Ancillary Structures
GBA No condition GBA = 100 % - FQA - WO
Field QA of Structures Inspection
FQA
No Structures Inspections performed
(with or without Maintenance)
FQA = 0%
Some Inspections performed but no
Maintenance performed FQA = 70%
Some Inspection and some Maintenance
performed FQA = 35%
Field QA of completed work orders
WO
IF FQA equals 35% 45%
IF FQA not equals 35 % WO = ABS(70 % - FQA)

Section III Raw Score Calculation
13
Using the specific AMPER data above:
Weight - Item measured Name in
Equations Condition
Sub-score Weighing Factor Value
General – Bridges – Ancillary Structures
GBA No condition GBA = 100 - 35 – 45 = 20 %
Field QA of Structures Inspection
FQA
No Structures Inspections performed
(with or without Maintenance)
Some Inspections performed but no
Maintenance performed
Some Inspection and some Maintenance
performed FQA = 35%
Field QA of completed work orders
WO
IF FQA equals 35% 45%
IF FQA not equals 35 %
Section III Raw Score
If there are no more than 1 unacceptable WO for either priority 1 or priority 2 combined, each priority
factor is equal to 1:
If there are more than 1 unacceptable WO for both priority 1 and priority 2 combined, the priority factors
are evaluated as:
𝑃𝑟𝑖𝑜𝑟𝑖𝑡𝑦 1 𝐴𝑑𝑗𝑢𝑠𝑡𝑚𝑒𝑛𝑡 𝐹𝑎𝑐𝑡𝑜𝑟 = (𝑇𝑜𝑡𝑎𝑙 𝑁𝑜. 𝑜𝑓 𝐴𝑐𝑐𝑒𝑝𝑡𝑎𝑏𝑙𝑒 𝑊𝑂 1)/(𝑇𝑜𝑡𝑎𝑙 𝑁𝑜. 𝑜𝑓 𝑊𝑂 1)
𝑃𝑟𝑖𝑜𝑟𝑖𝑡𝑦 2 𝐴𝑑𝑗𝑢𝑠𝑡𝑚𝑒𝑛𝑡 𝐹𝑎𝑐𝑡𝑜𝑟 = (𝑇𝑜𝑡𝑎𝑙 𝑁𝑜. 𝑜𝑓 𝐴𝑐𝑐𝑒𝑝𝑡𝑎𝑏𝑙𝑒 𝑊𝑂 2)/(𝑇𝑜𝑡𝑎𝑙 𝑁𝑜. 𝑜𝑓 𝑊𝑂 2)
If there are more than 1 unacceptable WO for either priority 1 or priority 2 combined and the No. of
acceptable WO is 0, the priority factors are evaluated as:
𝑃𝑟𝑖𝑜𝑟𝑖𝑡𝑦 1 𝑜𝑟 2 𝐴𝑑𝑗𝑢𝑠𝑡𝑚𝑒𝑛𝑡 𝐹𝑎𝑐𝑡𝑜𝑟 = 0.5/𝑇𝑜𝑡𝑎𝑙 𝑁𝑜. 𝑜𝑓 𝑊𝑂 1 𝑜𝑟 2

Section IV Raw Score Calculation
14
Section IV Raw Score Calculation
To ensure that all sub-scores are considered, the score for section IV is calculated in the following 3
steps:
1- An overall sub-score for each period is calculated and an average of those for the number of periods considered is calculated.
2- 3 additional Subscores are calculated for: a- Averaged Element Subscore b- Averaged Characteristics Subscore c- Characteristics and Interim combined Subscore
3- Calculate the MRP Section Raw Score
The MRP Overall, Element and Characteristics Scores shown on the AMPER below are used throughout
Section IV paragraph.
Step 1
Overall sub-score for each period when the subscore for the period exceeds 80:
𝑆𝑢𝑏𝑆𝑐𝑜𝑟𝑒 𝑓𝑜𝑟 𝑝𝑒𝑟𝑖𝑜𝑑 = 100 + ((𝑂𝑣𝑒𝑟𝑎𝑙𝑙 𝑠𝑢𝑏 − 𝑠𝑐𝑜𝑟𝑒) − 80)1.3
𝑆𝑢𝑏𝑆𝑐𝑜𝑟𝑒 𝑓𝑜𝑟 𝑝𝑒𝑟𝑖𝑜𝑑 1 = 100 + ((85) − 80)1.3
= 108.1
𝑆𝑢𝑏𝑆𝑐𝑜𝑟𝑒 𝑓𝑜𝑟 𝑝𝑒𝑟𝑖𝑜𝑑 2 = 100 + ((82) − 80)1.3
= 102.5
_________________________
Overall sub-score for each period when the subscore for the period does not exceed 80:
𝑆𝑢𝑏𝑆𝑐𝑜𝑟𝑒 𝑓𝑜𝑟 𝑝𝑒𝑟𝑖𝑜𝑑 = 69 − (80 − (𝑂𝑣𝑒𝑟𝑎𝑙𝑙 𝑠𝑢𝑏 − 𝑠𝑐𝑜𝑟𝑒) − 1)1.3
𝑆𝑢𝑏𝑆𝑐𝑜𝑟𝑒 𝑓𝑜𝑟 𝑝𝑒𝑟𝑖𝑜𝑑 3 = 69 − ((80) − 75 − 1)1.3
= 62.9

Section IV Raw Score Calculation
15
_________________________
Average Overall sub-score:
𝐴𝑣𝑒𝑟𝑎𝑔𝑒 𝑂𝑣𝑒𝑟𝑎𝑙𝑙 𝑆𝑢𝑏𝑆𝑐𝑜𝑟𝑒 𝑓𝑜𝑟 𝑝𝑒𝑟𝑖𝑜𝑑 =∑ 𝑆𝑢𝑏𝑆𝑐𝑜𝑟𝑒 𝑓𝑜𝑟 𝑝𝑒𝑟𝑖𝑜𝑑
𝑁𝑜. 𝑜𝑓 𝑃𝑒𝑟𝑖𝑜𝑑𝑠
𝐴𝑣𝑒𝑟𝑎𝑔𝑒 𝑂𝑣𝑒𝑟𝑎𝑙𝑙 𝑆𝑢𝑏𝑆𝑐𝑜𝑟𝑒 𝑓𝑜𝑟 𝑝𝑒𝑟𝑖𝑜𝑑 =108.1 + 102.5 + 62.9
3= 91.17
Step 2
Calculate all MRP Sub-score:
Average Overall Sub-scores
This value is 91.2 (from previous step)
_________________________
Average Element Subscore:
𝐴𝑣𝑒𝑟𝑎𝑔𝑒 𝐸𝑙𝑒𝑚𝑒𝑛𝑡 𝑆𝑢𝑏𝑆𝑐𝑜𝑟𝑒 𝑓𝑜𝑟 𝑝𝑒𝑟𝑖𝑜𝑑 = 150 ∗∑ 𝐸𝑙𝑒𝑚𝑒𝑛𝑡 𝑀𝑒𝑒𝑡𝑖𝑛𝑔 𝑀𝑅𝑃
𝑁𝑜. 𝑜𝑓 𝑃𝑒𝑟𝑖𝑜𝑑𝑠 ∗ 𝑁𝑜. 𝑜𝑓 𝐸𝑙𝑒𝑚𝑒𝑛𝑡𝑠− 50
𝐴𝑣𝑒𝑟𝑎𝑔𝑒 𝐸𝑙𝑒𝑚𝑒𝑛𝑡 𝑆𝑢𝑏𝑆𝑐𝑜𝑟𝑒 𝑓𝑜𝑟 𝑝𝑒𝑟𝑖𝑜𝑑 = 150 ∗4 + 4 + 4
3 ∗ 5− 50 = 70
_________________________
Average Characteristics Subscore:
𝐴𝑣𝑒𝑟𝑎𝑔𝑒 𝐶ℎ𝑎𝑟𝑎𝑐𝑡𝑒𝑟𝑖𝑠𝑡𝑖𝑐𝑠 𝑓𝑜𝑟 𝑝𝑒𝑟𝑖𝑜𝑑 = 200 ∗∑ 𝐶ℎ𝑎𝑟𝑎𝑐𝑡𝑒𝑟𝑖𝑠𝑡𝑖𝑐𝑠 𝑀𝑒𝑒𝑡𝑖𝑛𝑔 𝑀𝑅𝑃
𝑁𝑜. 𝑜𝑓 𝑃𝑒𝑟𝑖𝑜𝑑𝑠 ∗ 𝑁𝑜. 𝑜𝑓 𝐶ℎ𝑎𝑟𝑎𝑐𝑡.− 100

Section IV Raw Score Calculation
16
𝐴𝑣𝑒𝑟𝑎𝑔𝑒 𝐶ℎ𝑎𝑟𝑎𝑐𝑡𝑒𝑟𝑖𝑠𝑡𝑖𝑐𝑠 𝑓𝑜𝑟 𝑝𝑒𝑟𝑖𝑜𝑑 = 200 ∗25 + 30 + 35
3 ∗ 35− 100 = 71.43
_________________________
Characteristics and Interim combined sub-score
If no interim MRP have been performed, this value is 100. When an interim has been performed, the
sub-score is calculated as:
𝐼𝑛𝑡𝑒𝑟𝑖𝑚 𝐶𝑜𝑚𝑏𝑖𝑛𝑒𝑑 𝑆𝑢𝑏𝑠𝑐𝑜𝑟𝑒
= 100
∗∑ 𝐶ℎ𝑎𝑟𝑎𝑐𝑡𝑒𝑟𝑖𝑠𝑡𝑖𝑐𝑠 𝑀𝑒𝑒𝑡. 𝑀𝑅𝑃 + 5 ∗ (𝑁𝑜. 𝑜𝑓 𝑃𝑒𝑟𝑖𝑜𝑑𝑠 ∗ 𝑁𝑜. 𝐼𝑛𝑡𝑒𝑟𝑖𝑚 𝑀𝑒𝑒𝑡𝑖𝑛𝑔 𝑀𝑅𝑃)
𝑁𝑜. 𝑜𝑓 𝑃𝑒𝑟𝑖𝑜𝑑𝑠 ∗ 𝑁𝑜. 𝑜𝑓 𝐶ℎ𝑎𝑟𝑎𝑐𝑡. +𝑁𝑜. 𝑜𝑓 𝑃𝑒𝑟𝑖𝑜𝑑𝑠 ∗ 𝑁𝑜. 𝑜𝑓 𝐼𝑛𝑡𝑒𝑟𝑖𝑚 𝑅𝑒𝑣𝑖𝑒𝑤𝑠
𝐼𝑛𝑡𝑒𝑟𝑖𝑚 𝐶𝑜𝑚𝑏𝑖𝑛𝑒𝑑 𝑆𝑢𝑏 − 𝑠𝑐𝑜𝑟𝑒 = 100 ∗25 + 30 + 35 + 5 ∗ (3 ∗ 0)
3 ∗ 35 + 5 ∗ 3 ∗ 6
:
𝐼𝑛𝑡𝑒𝑟𝑖𝑚 𝐶𝑜𝑚𝑏𝑖𝑛𝑒𝑑 𝑆𝑢𝑏 − 𝑠𝑐𝑜𝑟𝑒 = 46.15
_________________________
Step 3
Calculate MRP section raw score:
Subscore 1 = Average Overall Sub-scores
Subscore 2 = Average Element Subscore
Subscore 3 = Average Characteristics Subscore
Subscore 4 = Characteristics and Interim combined sub-score
𝑀𝑅𝑃 𝑅𝑎𝑤 𝑆𝑐𝑜𝑟𝑒
= 50% ∗ (𝑀𝑖𝑛𝑖𝑚𝑢𝑚 (Subscore 1 + Subscore 2 + Subscore 3 + Subscore 4 ) + 20%
∗ 𝑀𝑎𝑥𝑖𝑚𝑢𝑚(Subscore 1 + Subscore 2 + Subscore 3 + Subscore 4 ) + 30%
∗ (2𝑛𝑑 𝑙𝑎𝑟𝑔𝑒𝑠𝑡 𝑠𝑐𝑜𝑟𝑒 ∗ 3𝑟𝑑 𝐿𝑎𝑟𝑔𝑒𝑠𝑡 𝑠𝑐𝑜𝑟𝑒)/100
In the table above:
Subscore 1 = 91.17
Subscore 2 = 70
Subscore 3 = 71.43

Section IV Raw Score Calculation
17
Subscore 4 = 46.15
𝑀𝑅𝑃 𝑅𝑎𝑤 𝑆𝑐𝑜𝑟𝑒 = 50% ∗ (46.15) + 20% ∗ (91.17) + 30% ∗(71.43 ∗ 70)
100
𝑀𝑅𝑃 𝑅𝑎𝑤 𝑆𝑐𝑜𝑟𝑒 = 56.31
Shown as 56 in the AMPER below

Section V Raw Score Calculation
18
Section V Raw Score Calculation
The score for section V is calculated as follows:
𝐼𝑛𝑡𝑎𝑛𝑔𝑖𝑏𝑙𝑒𝑠 𝑅𝑎𝑤 𝑆𝑐𝑜𝑟𝑒 =∑ 𝑅𝑎𝑡𝑖𝑛𝑔 𝐴𝑐ℎ𝑖𝑒𝑣𝑒𝑑
∑ 𝑀𝑎𝑥𝑖𝑚𝑢𝑚 𝑅𝑎𝑡𝑖𝑛𝑔
𝐼𝑛𝑡𝑎𝑛𝑔𝑖𝑏𝑙𝑒𝑠 𝑅𝑎𝑤 𝑆𝑐𝑜𝑟𝑒 = 100 ∗9 + 9 + 8.5 + 6
10 + 10 + 10 + 10= 81.25
Shown as 81 in the AMPER above

Overall AMPER Score Calculation – Standard AMPER
19
Overall AMPER Score Calculation – Bonus Points:
Section Weight Factors (different from Subscore Weight Factors above) depend upon the following
factors:
1- The section is being used in the AMPER (Sections I and V are always used). If a section is not
used, the weights of other section(s) may be increased.
2- Weighting Adjustments for Low-Volume Assets are being used (Applicable only to Sections II or
III).
3- The boxes for High Mast Light Poles (HML Poles), Overhead Signs (O/H Signs), Bridges and
Mast Arms are checked for Inspection or Maintenance.
4- Minor adjustment are made to ensure that the total sum of all Section Weight Factors are equal to
100%.
Here are the steps used in the final calculation:
Step 1 - Selection of unadjusted weight factors
Unadjusted Section Weight Factors are assigned for each section depending upon which section is being
used:
For instance, if sections II and III are used but section IV is not, the unadjusted weight factors are
highlighted below:
Step 2 - Selection of unadjusted percentage that will be affected by checked boxes
The values in the table below are not adjusted yet based upon whether or not a box is checked. For
instance, if sections II, III and IV are used, the unadjusted weight factors corresponding to checked boxes
are highlighted below:

Overall AMPER Score Calculation – Standard AMPER
20
Step 3 - Percentage changed according to boxes checked and adjustment
In determining how much the % needs to be distributed among all sections, the total unadjusted
percentages (see table above) need to be adjusted depending which boxes are checked. All checked
boxes except for the the “Bridges” boxes have a value of one. The values for the “bridges” boxes are as
follows:
- No bridges boxes are checked: % is 0 - Either Bridge Inspection or Bridge Maintenance is checked: percentage is 15 % for bridges - Both Bridge Inspection or Bridge Maintenance are checked: percentage is 20 % total for
bridges Here is an example how these percentages are selected and adjusted according to specific boxes being
checked:

Overall AMPER Score Calculation – Standard AMPER
21
In the table below, the weight calculated in the step 2 above are adjusted for specific boxes being
checked. The comments describe how the adjustment is performed.

Overall AMPER Score Calculation – Adjustment for Low Volume Asset
22
Step 4 – Final Adjustment for Low Volume Assets.
If the District elects not to adjust the section weight for low volume Asset, the weights obtained in step 3
are finald. If instead the District elects to adjust down its section II and/or III for weights, further
adjustment is needed to account for lower volume asset, good balance between sections and the need to
have the sum of all section weights equal to 100%.
For example, if section II is adjusted as below:
The final adjustment will be as follows, using the weights obtained in the previous step:
Incidentally, by procedure, any weight percentage reduction proposed by the District must be approved
by the OOM. If no changes for Sections II or III are needed, do not check the box without entering an
alternate number. This will cause inaccurate AMPER results.

Overall AMPER Score Calculation – Bonus Points
23
Step 5 – Final Calculation and bonus point
At this point, Sections scores can be calculated as shown below (A complete copy of a “Performance
Evaluation Report” example tab is included as an appendix).

Overall AMPER Score Calculation – Bonus Points
24
Bonus Points
The Bonus points are added to the overall calculated score, therefore a maximum score of 103 is
possible (2 maximum possible points for “Youth Work Experience” and 1 point maximum for “DBE
Utilization”. In the example below, the total bonus is 0 + 1 = 1 point
𝐹𝑖𝑛𝑎𝑙 𝑆𝑐𝑜𝑟𝑒 = ∑(𝑅𝑎𝑤 𝑆𝑐𝑜𝑟𝑒) ∗ (𝑆𝑒𝑐𝑡𝑖𝑜𝑛 𝑊𝑒𝑖𝑔ℎ𝑡) + 𝐵𝑜𝑛𝑢𝑠 𝑃𝑜𝑖𝑛𝑡𝑠
When evaluating the expression above, numbers are not rouded in the calculation even if shown rounded
off in the AMPER. For example 56.3 and 81.3 in shown in the AMPER as 56 and 81 but 56.3 and 81.3
are used in the evaluation.
𝐹𝑖𝑛𝑎𝑙 𝑆𝑐𝑜𝑟𝑒 = (74 ∗ 24%) + (97.9 ∗ 11%) + (93 ∗ 21%) + (56.3 ∗ 25%) + (81.3 ∗ 19%) + 0 + 1
𝐹𝑖𝑛𝑎𝑙 𝑆𝑐𝑜𝑟𝑒 = 78.6
See Appendix A

Sections I, II, III Detail Tab
25

Sections I, II, III Detail Tab
26