performance analysis of sweep3d on bluegene/p with … · performance analysis of sweep3d ... (12...
TRANSCRIPT
2010-04-23 |
Mitg
lied
der H
elm
holtz
-Gem
eins
chaf
t
Performance analysis of Sweep3D on Blue Gene/P with Scalasca
Brian J. N. Wylie, David Böhme, Bernd Mohr, Zoltán Szebenyi & Felix WolfJülich Supercomputing Centre
2010-04-23 | IPDPS-LSPP'10 2Brian J. N. Wylie, Jülich Supercomputing Centre
Overview
Introduction
■ Scalasca performance analysis toolset■ Blue Gene/P supercomputer■ Sweep3D compact application
Measurements & Analyses
■ Default & improved Sweep3D configurations■ Refined instrumentation & analyses
Scalasca scalability Conclusions

2010-04-23 | IPDPS-LSPP'10 3Brian J. N. Wylie, Jülich Supercomputing Centre
Scalasca project
Overview
■ Helmholtz Initiative & Networking Fund project started in 2006■ Headed by Prof. Felix Wolf (RWTH Aachen, GRS & JSC)
■ Follow-up to pioneering KOJAK project (started 1998)■ Automatic pattern-based trace analysis
Objective
■ Development of a scalable performance analysis toolset■ Specifically targeting large-scale parallel applications
Status
■ Scalasca v1.3 released in March 2010■ Available for download from www.scalasca.org

2010-04-23 | IPDPS-LSPP'10 4Brian J. N. Wylie, Jülich Supercomputing Centre
Supercomputers at Jülich Supercomputing Centre
Period Machine #Cores■ 2003-8 “jump” IBM p690 cluster 1,312■ 2006-8 “jubl” IBM Blue Gene/L 16,384
■ 2009- “juropa” Bull/Sun/Intel blades 26,304■ 2009- “jugene” IBM Blue Gene/P 294,912
[jugene is the largest system in the Top500 list, Jun/Nov 2009]
2010-04-23 | IPDPS-LSPP'10 5Brian J. N. Wylie, Jülich Supercomputing Centre
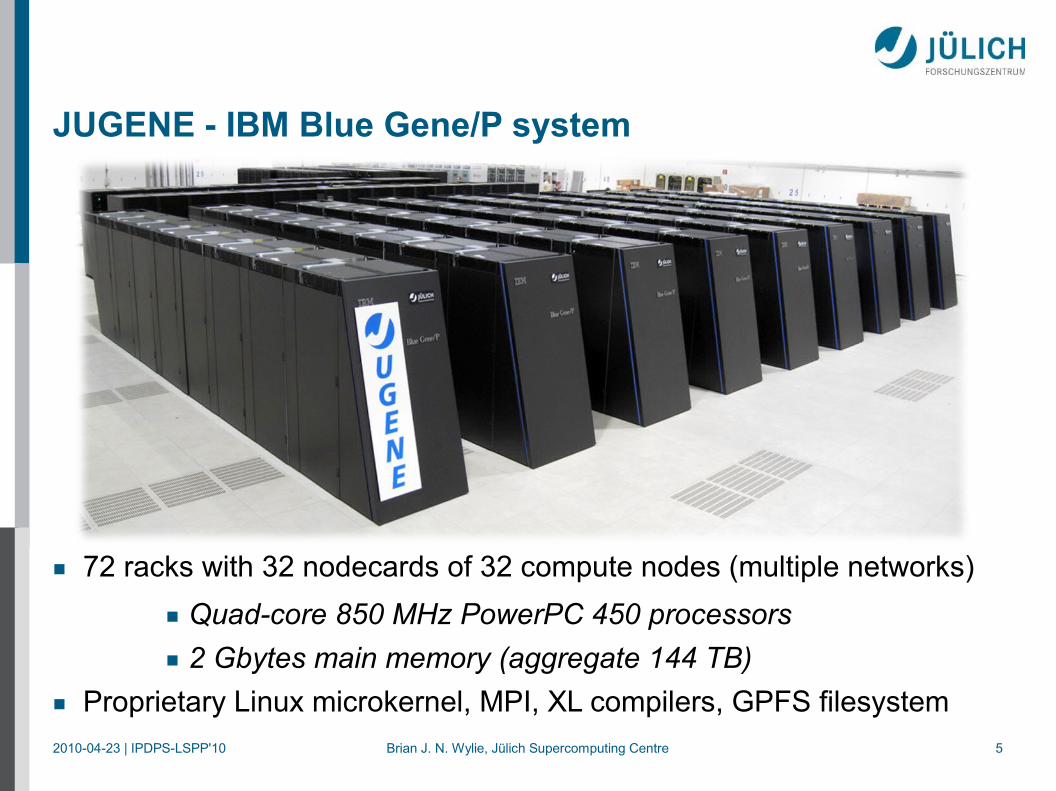
JUGENE - IBM Blue Gene/P system
■ 72 racks with 32 nodecards of 32 compute nodes (multiple networks)■ Quad-core 850 MHz PowerPC 450 processors■ 2 Gbytes main memory (aggregate 144 TB)
■ Proprietary Linux microkernel, MPI, XL compilers, GPFS filesystem
2010-04-23 | IPDPS-LSPP'10 6Brian J. N. Wylie, Jülich Supercomputing Centre
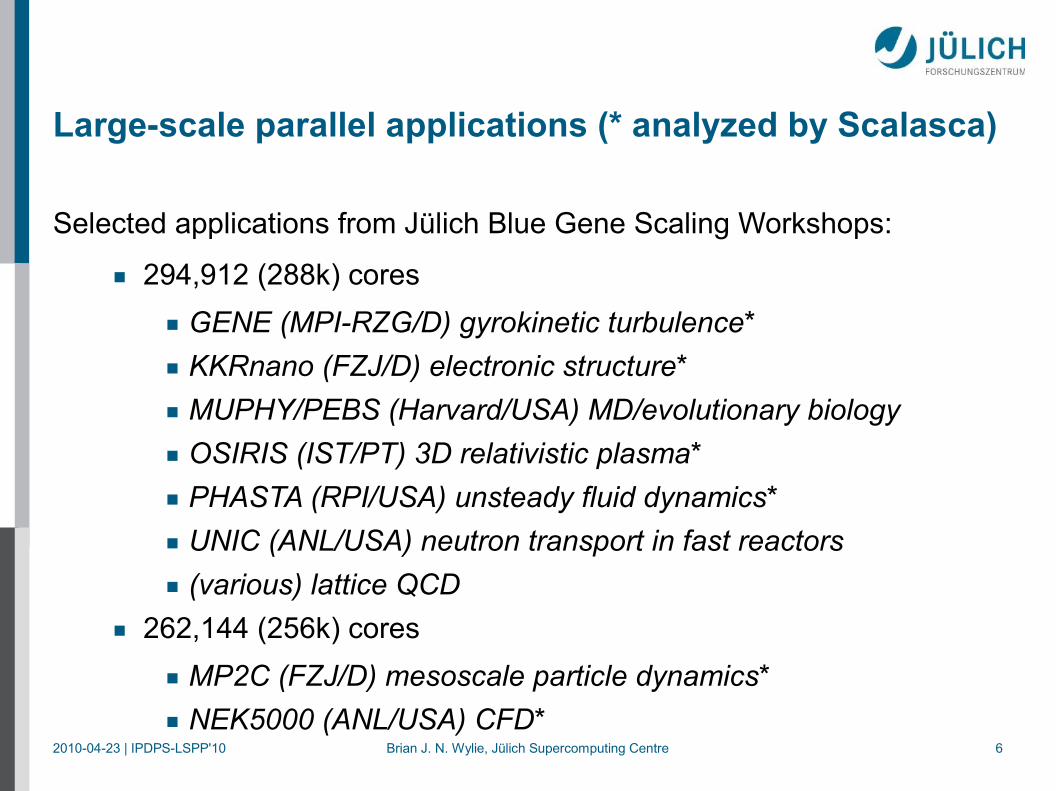
Large-scale parallel applications (* analyzed by Scalasca)
Selected applications from Jülich Blue Gene Scaling Workshops:
■ 294,912 (288k) cores■ GENE (MPI-RZG/D) gyrokinetic turbulence*■ KKRnano (FZJ/D) electronic structure*■ MUPHY/PEBS (Harvard/USA) MD/evolutionary biology■ OSIRIS (IST/PT) 3D relativistic plasma*■ PHASTA (RPI/USA) unsteady fluid dynamics*■ UNIC (ANL/USA) neutron transport in fast reactors■ (various) lattice QCD
■ 262,144 (256k) cores■ MP2C (FZJ/D) mesoscale particle dynamics*■ NEK5000 (ANL/USA) CFD*

2010-04-23 | IPDPS-LSPP'10 7Brian J. N. Wylie, Jülich Supercomputing Centre
Sweep3D
Ubiquitous ASCI benchmark code from Los Alamos National Laboratory
■ 3-dimensional neutron transport simulation■ direct order solve uses diagonal wavefront sweeps over grid cells
combined with pipelining of blocks of k-planes and octants■ execution performance extensively modeled & analyzed
MPI parallel version using 2D domain decomposition
■ ~2,000 lines of code (12 source modules), mostly Fortran77■ very portable, and highly scalable■ tunable via input deck, e.g., number of k-planes in blocks (MK)■ benchmark configuration does 12 iterations
■ flux correction 'fixups' applied after 7th iteration
2010-04-23 | IPDPS-LSPP'10 8Brian J. N. Wylie, Jülich Supercomputing Centre
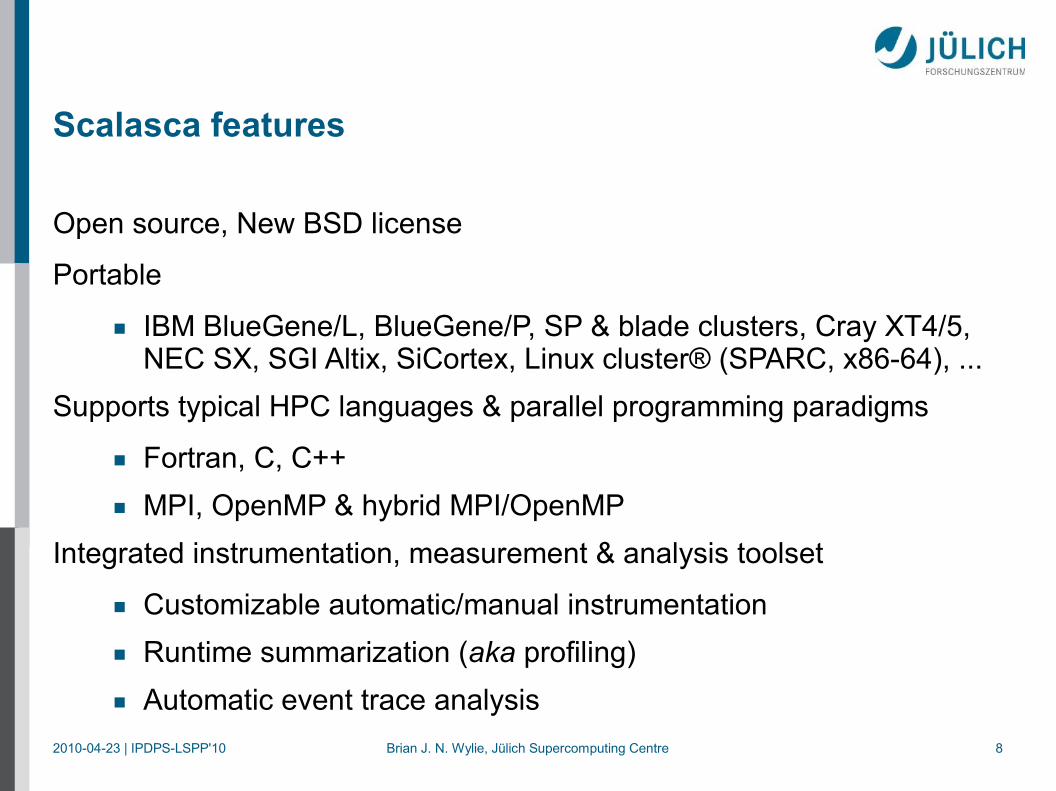
Scalasca features
Open source, New BSD license
Portable
■ IBM BlueGene/L, BlueGene/P, SP & blade clusters, Cray XT4/5,NEC SX, SGI Altix, SiCortex, Linux cluster® (SPARC, x86-64), ...
Supports typical HPC languages & parallel programming paradigms
■ Fortran, C, C++■ MPI, OpenMP & hybrid MPI/OpenMP
Integrated instrumentation, measurement & analysis toolset
■ Customizable automatic/manual instrumentation■ Runtime summarization (aka profiling)■ Automatic event trace analysis

2010-04-23 | IPDPS-LSPP'10 9Brian J. N. Wylie, Jülich Supercomputing Centre
Scalasca components
■ Automatic program instrumenter creates instrumented executable
■ Unified measurement library supports both
■ runtime summarization■ trace file generation
■ Parallel, replay-based event trace analyzer invoked automatically on set of traces
■ Common analysis report explorer & examination/processing tools
programsources
unifieddefs+maps trace Ntrace ..trace 2trace 1
application+EPIKapplication+EPIKapplication+EPIKapplication + measurement lib
traceanalysis
summaryanalysis
analysis report examiner
instrumentercompiler
instrumented executable
SCOUTSCOUTSCOUT parallel trace analyzer
expt config

2010-04-23 | IPDPS-LSPP'10 10Brian J. N. Wylie, Jülich Supercomputing Centre
Scalasca usage
1. Prepare application objects and executable for measurement:■ scalasca -instrument mpixlf77 -O3 -qarch=450 -qtune=450 …
2. Run application under control of measurement nexus:■ scalasca -analyze mpirun -mode VN -np 294912 sweep3d
■ epik_sweep3d_vn294912_sum experiment produced■ scalasca -analyze -t mpirun -mode VN -np 294912 sweep3d
■ epik_sweep3d_vn294912_trace experiment produced 3. Interactively explore measurement analysis report
■ scalasca -examine epik_sweep3d_vn294912_trace
■ epik_sweep3d_vn294912_trace/trace.cube.gz presented
2010-04-23 | IPDPS-LSPP'10 11Brian J. N. Wylie, Jülich Supercomputing Centre
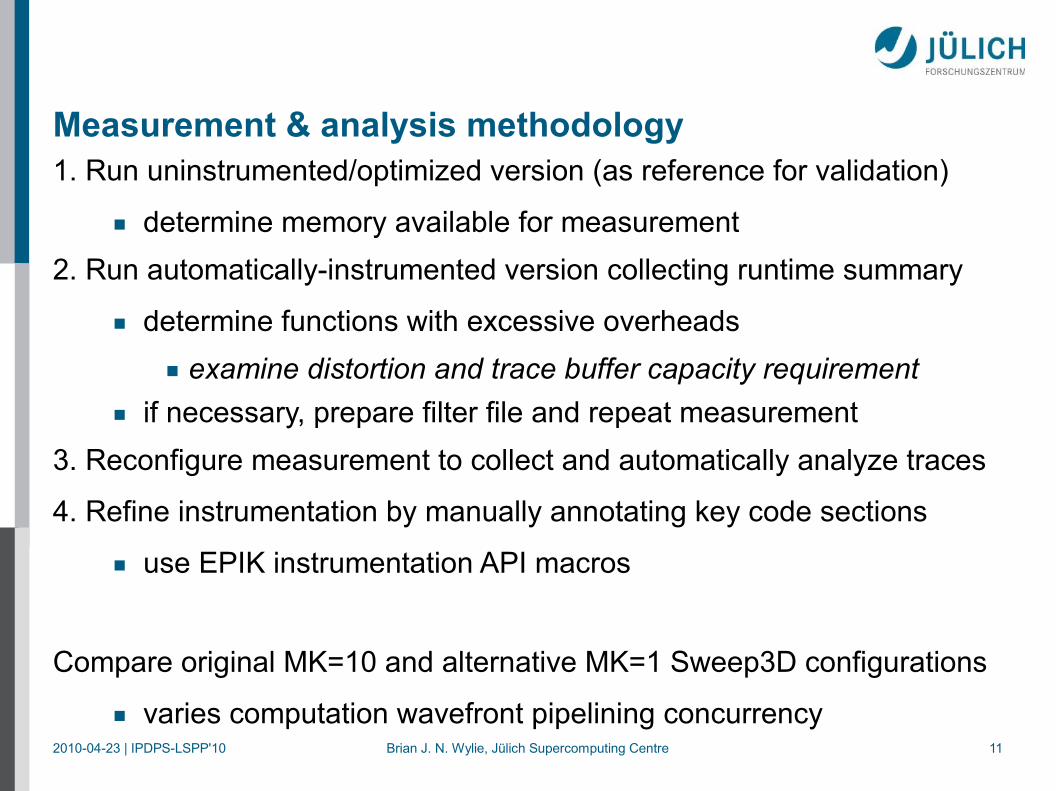
Measurement & analysis methodology1. Run uninstrumented/optimized version (as reference for validation)
■ determine memory available for measurement2. Run automatically-instrumented version collecting runtime summary
■ determine functions with excessive overheads■ examine distortion and trace buffer capacity requirement
■ if necessary, prepare filter file and repeat measurement3. Reconfigure measurement to collect and automatically analyze traces
4. Refine instrumentation by manually annotating key code sections
■ use EPIK instrumentation API macros
Compare original MK=10 and alternative MK=1 Sweep3D configurations
■ varies computation wavefront pipelining concurrency

2010-04-23 | IPDPS-LSPP'10 12Brian J. N. Wylie, Jülich Supercomputing Centre
Sweep3D execution time scaling: original MK=10
■ Default input deck settings
■ Weak scaling due to fixed problem size per process
■ Reasonable scalability(?)
■ Constant time for computation
■ Rapid growth in MPI time, which is almost all waiting time
[Replication of scaling characteristics reported by others]

2010-04-23 | IPDPS-LSPP'10 13Brian J. N. Wylie, Jülich Supercomputing Centre
Sweep3D execution time scaling: improved MK=1
■ Much improved performance and scalability
■ Computation 20% faster(better caching?)
■ MPI processing time increased (10x messages)
■ MPI waiting time significantly reduced, though still growing markedly
[Single k-planes rather than default batches of 10]

2010-04-23 | IPDPS-LSPP'10 14Brian J. N. Wylie, Jülich Supercomputing Centre
Scalasca GUI description for Late Sender metric
■ Analysis report explorer GUI provides hyperlinked online descriptions of metrics
■ Diagnosis hints suggest how to refine diagnosis of performance problems and possible remediation

2010-04-23 | IPDPS-LSPP'10 15Brian J. N. Wylie, Jülich Supercomputing Centre
Scalasca analysis report: performance metric tree
● Metrics arranged hierarchically in trees● inclusive values shown for closed nodes● exclusive values shown for open nodes
● Metrics values aggregated for all processes & callpaths● Colour-coded according to scale at window base● Selected metric value projected to panes on right● Most metrics calculated by local runtime summarization
● Augmented with metrics from automatic trace analysis calculated using non-local event information

2010-04-23 | IPDPS-LSPP'10 16Brian J. N. Wylie, Jülich Supercomputing Centre
Scalasca analysis report: program call tree
● Graphical presentation of callpath profile● metric selected from pane on left● shown projected on program call tree
● Tree selectively expanded following high metric values
● inclusive value when node closed● exclusive value when node opened
● Colour-coded according to scale at base

2010-04-23 | IPDPS-LSPP'10 17Brian J. N. Wylie, Jülich Supercomputing Centre
Scalasca analysis report: system tree/topology
● Distribution by process of selected metric value on selected callpath shown using physical topology (Blue Gene/P racks)● Process metric values coloured by peer distribution
● highest individual value coloured red● lowest individual value coloured yellow
● Mean and variance shown in legend below pane

2010-04-23 | IPDPS-LSPP'10 18Brian J. N. Wylie, Jülich Supercomputing Centre
Scalasca analysis report: sweep computation time● Only 45% of total time is (local) computation● 83% of which is exclusively in the sweep routine● With no clearly discernible distribution pattern
● Only 45% of total time is (local) computation● 83% of which is exclusively in the sweep routine● With no clearly discernible distribution pattern
2010-04-23 | IPDPS-LSPP'10 19Brian J. N. Wylie, Jülich Supercomputing Centre
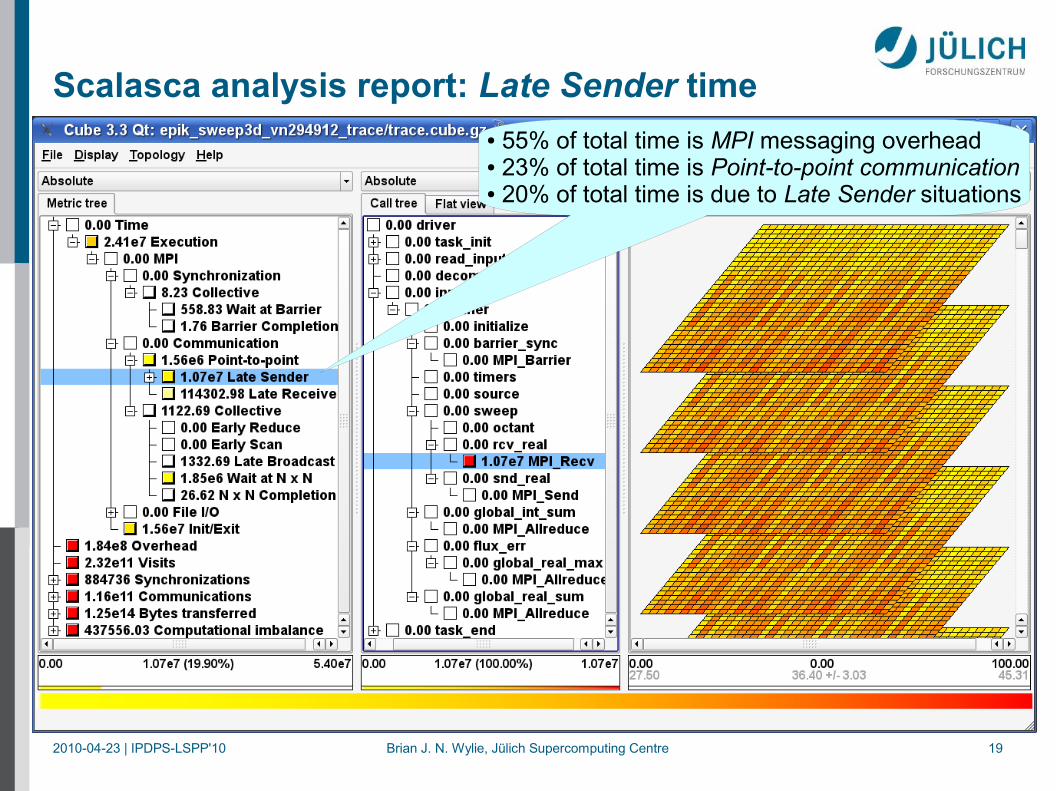
Scalasca analysis report: Late Sender time● 55% of total time is MPI messaging overhead● 23% of total time is Point-to-point communication● 20% of total time is due to Late Sender situations
2010-04-23 | IPDPS-LSPP'10 20Brian J. N. Wylie, Jülich Supercomputing Centre
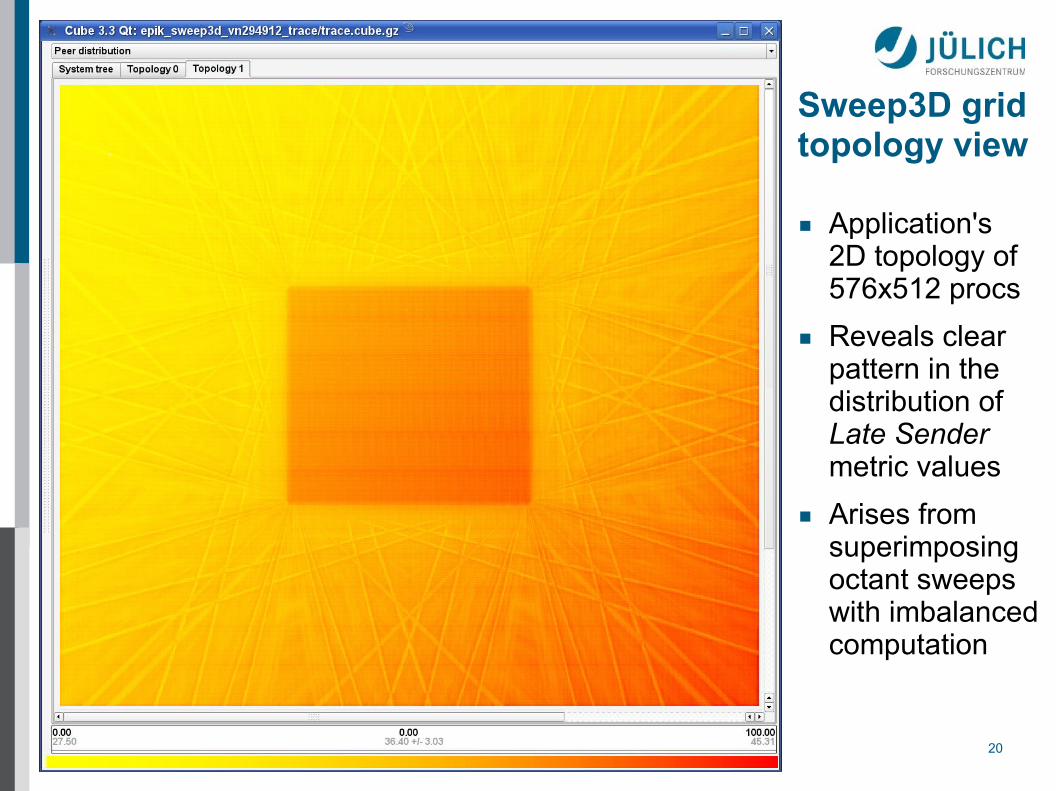
Sweep3D grid topology view
■ Application's2D topology of 576x512 procs
■ Reveals clear pattern in the distribution of Late Sender metric values
■ Arises from superimposing octant sweeps with imbalanced computation

2010-04-23 | IPDPS-LSPP'10 21Brian J. N. Wylie, Jülich Supercomputing Centre
Sweep3D computation time by iteration (16,384 processes)● Manually annotated region for iteration loop appears as new callpaths in call tree

2010-04-23 | IPDPS-LSPP'10 22Brian J. N. Wylie, Jülich Supercomputing Centre
Iteration execution time breakdown (16,384 processes)
■ Initial 7 (non-fixup) iterations faster than later 5 (fixup) iterations■ MPI waiting time dominates original; amplified by fixup imbalance■ MPI processing time a fixed cost in each iteration
MK=1MK=10
2010-04-23 | IPDPS-LSPP'10 23Brian J. N. Wylie, Jülich Supercomputing Centre
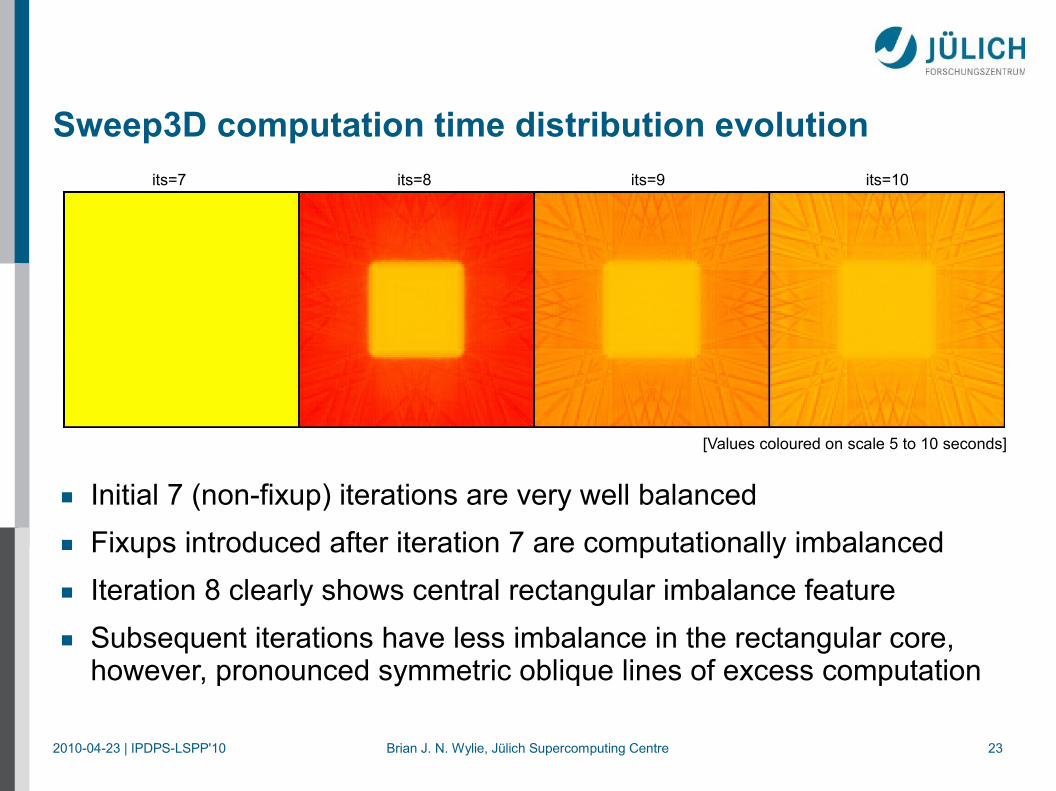
Sweep3D computation time distribution evolutionits=7 its=9 its=10its=8
■ Initial 7 (non-fixup) iterations are very well balanced■ Fixups introduced after iteration 7 are computationally imbalanced■ Iteration 8 clearly shows central rectangular imbalance feature■ Subsequent iterations have less imbalance in the rectangular core,
however, pronounced symmetric oblique lines of excess computation
[Values coloured on scale 5 to 10 seconds]

2010-04-23 | IPDPS-LSPP'10 24Brian J. N. Wylie, Jülich Supercomputing Centre
Scalasca source code browser
■ Source file sweep.f contains 625-line sweep flow routine
■ Computationally imbalanced i-line section where corrective 'fixups' for negative fluxes are recursively applied in i, j, k grid directions
■ Hotspot also typically identified by profilers based on sampling

2010-04-23 | IPDPS-LSPP'10 25Brian J. N. Wylie, Jülich Supercomputing Centre
MPI Late Sender time variation by sweep octant● Iterations grouped in sets with/without fixups● Manually annotated octant regions added

2010-04-23 | IPDPS-LSPP'10 26Brian J. N. Wylie, Jülich Supercomputing Centre
MPI Late Sender time distributions for octant pairs
octant=3+4octant=1+2 octant=5+6 octant=7+8
Iterations with fixups:
Iterations without fixups:

2010-04-23 | IPDPS-LSPP'10 27Brian J. N. Wylie, Jülich Supercomputing Centre
Scalasca experiment statistics: sweep3d_vn294912_trace
v1.2 v1.3+10 1
Sweep3d elapsed time [s] 505 129Measurement dilation [%] 5 3
43 41
Trace event records [G] 59 510Trace buffer content [MB] 2.75 27Trace total size [TB] 0.79 7.6Trace (physical) files [#] 294912 576
86 10Trace flush rate [GB/s] 3.7 19.1
Trace analysis time [s] 368 546 - Trace analysis collation [s] 162 91 - Trace analysis replay [s] 11 74
ScalascaSweep3d size of k-blocks MK
Unification time [mins]
Trace open/create time [mins]

2010-04-23 | IPDPS-LSPP'10 28Brian J. N. Wylie, Jülich Supercomputing Centre
Scalasca trace analysis time scaling: original MK=10
■ 2.75MB of traceevent records per process (determined from summary)
■ Total trace size (---) increases linearly to 790GB for59G events
■ Trace replay time scales with application execution time
[Scalasca v1.2]

2010-04-23 | IPDPS-LSPP'10 29Brian J. N. Wylie, Jülich Supercomputing Centre
Scalasca trace analysis time scaling: improved MK=1
■ 10x larger traces due to 10x messages
■ 27MB of traceevent records per process
■ Total trace size (---) increased to 7.6TB for 510G events
■ 10x longer trace replay time still scales with application execution time[Scalasca v1.3 using SIONlib & prototype binary-format report]
2010-04-23 | IPDPS-LSPP'10 30Brian J. N. Wylie, Jülich Supercomputing Centre
Scalasca scalability issues/optimizations
Time for unification of identifiers grows linearly with number of processes
■ use hierarchical unification scheme Creating individual traces files for each process is prohibitive
■ use SIONlib multi-files (e.g., one per Blue Gene/P IONode) Analysis reports are large and slow to collate
■ binary format for metric value data plus separate XML metadata Analysis presentation is slow and requires lots of memory
■ store metrics as inclusive values and load them incrementally Full analysis presentation requires very large, high-resolution screens
■ :-)

2010-04-23 | IPDPS-LSPP'10 31Brian J. N. Wylie, Jülich Supercomputing Centre
Conclusions
Blue Gene/P efficiently supports application executions at extreme scale Sweep3D is scalable to 294,912 MPI processes on Blue Gene/P
■ appropriate input configuration/tuning is necessary■ 'fixups' are computationally imbalanced and amplify waiting times
■ they therefore need to be used sparingly■ there might be further opportunities for performance improvement
■ e.g., with non-default mapping of processes to cores Scalasca has demonstrated performance measurement/analysis at unprecedented scale
■ however, further significant improvements are in progress

2010-04-23 | IPDPS-LSPP'10 32Brian J. N. Wylie, Jülich Supercomputing Centre
Scalable performance analysis of extremely large-scale parallel applications
■ portable toolset for scalable performance measurement & analysis of MPI, OpenMP & hybrid OpenMP/MPI parallel applications
■ supporting most popular HPC computer systems■ available under New BSD open-source license■ distributed on POINT/VI-HPS Parallel Productivity Tools Live-DVD■ sources, documentation & publications:
■ http://www.scalasca.org■ mailto: [email protected]