the ibm high performance computing toolkit on bluegene/l
TRANSCRIPT

IBM Systems & Technology Group
Deep Computing
The IBM High Performance Computing Toolkit on BlueGene/L
Kirk E Jordan, Ph.D.Strategic Growth Business/Deep ComputingSystems & Technology [email protected]
Collaborators:I-Hsin Chung - ACTCBob Walkup – Physical Sciences

IBM Systems & Technology Group
Deep Computing |
Outline
Performance Decision treeIBM High Performance Computing Toolkit– MPI performance: MP_Profiler– CPU performance: Xprofiler, HPM– Modular I/O: MIO– Visualization and analysis: PeekPerf
ChallengesFuture Work

IBM Systems & Technology Group
Deep Computing |
Performance Decision Tree
Total Performance
Computation Communication
Xprofiler HPM
Routines/Source Summary/Blocks
Compiler
Source Listing
MP_Profiler
Summary/Events
I/O
MIO Library

IBM Systems & Technology Group
Deep Computing |
IBM High Performance Computing Toolkit on BG/L
MPI performance: MP_Profiler, MP_TracerCPU performance: Xprofiler, HPMVisualization and analysis: PeekPerfModular I/O: MIO
HPMMP_Profiler/MP_Tracer MIO
PeekPerf
Xprofiler

IBM Systems & Technology Group
Deep Computing |
Message-Passing Performance:
MP_Profiler Library– Captures “summary” data for MPI calls– Source code traceback– User MUST call MPI_Finalize() in order to get output files.– No changes to source code
• MUST compile with –g to obtain source line number information
MP_Tracer Library– Captures “timestamped” data for MPI calls– Source traceback

IBM Systems & Technology Group
Deep Computing |
Compiling and Linking Example
BGL=/bgl/BlueLight/ppcfloorCC=$(BGL)/blrts-gnu/powerpc-bgl-blrts-gnu/bin/gccCFLAG= -I $(BGL)/bglsys/includeMPI_LIB= -L $(BGL)/bglsys/lib -lmpich.rts -lmsglayer.rts -lrts.rts -ldevices.rtsTRACE_LIB= -L $(MP_PROFILER) -lmpitrace.rtsBINUTILS_LIB= -L $(BINUTILS) -lbfd -liberty
target: source.c$(CC) –o $@ $< $(CFLAG) $(TRACE_LIB) $(MPI_LIB) $(BINUTIL_LIB)
$(TRACE_LIB) has to precede $(MPI_LIB)

IBM Systems & Technology Group
Deep Computing |
MP_Profiler Summary Output

IBM Systems & Technology Group
Deep Computing |
MP_Profiler Sample Call Graph Output

IBM Systems & Technology Group
Deep Computing |
MP_Profiler Output with Peekperf

IBM Systems & Technology Group
Deep Computing |
Measuring Communication Performance
The MPI standard provides alternate entry points for timing:
MPI_Send(…) {Start_timer();PMPI_Send(…);Stop_timer();Log_the_event();
}
Implement a scalable approach that can support >10**5 MPI tasks.
Two modes: summary and event-logging.
IBM Systems & Technology Group
Deep Computing |
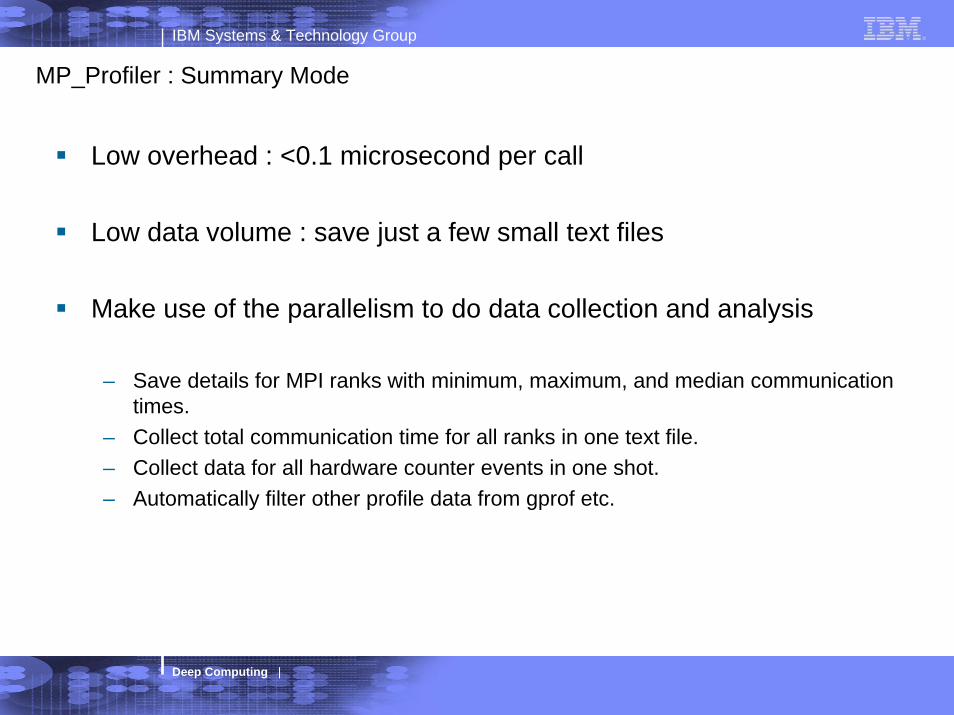
MP_Profiler : Summary Mode
Low overhead : <0.1 microsecond per call
Low data volume : save just a few small text files
Make use of the parallelism to do data collection and analysis
– Save details for MPI ranks with minimum, maximum, and median communication times.
– Collect total communication time for all ranks in one text file.– Collect data for all hardware counter events in one shot.– Automatically filter other profile data from gprof etc.

IBM Systems & Technology Group
Deep Computing |
MPI Timing SummaryMPI Rank 0 out of 1024.-----------------------------------------------------------------elapsed time from clock-cycles using freq = 700.0 MHz.-----------------------------------------------------------------total communication time = 4.943 seconds.total elapsed time = 43.113 seconds.top of the heap address = 158.305 MBytes.
-----------------------------------------------------------------MPI Routine #calls avg. bytes time(sec)-----------------------------------------------------------------MPI_Comm_size 2 0.0 0.000MPI_Comm_rank 2 0.0 0.000MPI_Isend 171 765163.0 0.001MPI_Irecv 174 757120.0 0.000MPI_Wait 340 0.0 1.912MPI_Barrier 11 0.0 0.038MPI_Allreduce 11 16.7 2.992

IBM Systems & Technology Group
Deep Computing |
MP_Profiler : Event Logging
Visualize the time-sequence of MPI events.
Preserve the connection between MPI events and source code.
Use a lightweight fast viewer based on OpenGL.
Keep the data volume manageable.
Limit event logging to a subset of MPI ranks, and/or to a subset of the overall
simulation.

IBM Systems & Technology Group
Deep Computing |
MPI Events for Enzo - Original

IBM Systems & Technology Group
Deep Computing |
Enzo : Original Code
For each pair of regions
conditionally call MPI_Test(…) to check for outstanding send requests
if regions overlap
call MPI_Isend(send_request,…) to “send” data
For each pair of regions
if regions overlap
call MPI_Irecv(recv_request) to receive boundary data
call MPI_Wait(recv_request,…)
IBM Systems & Technology Group
Deep Computing |
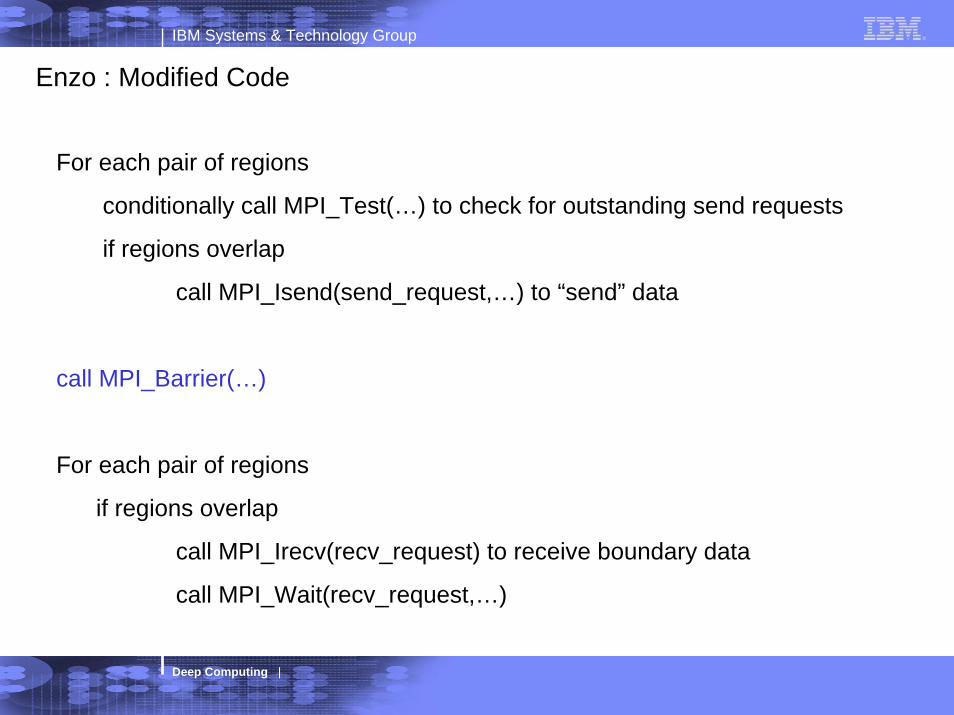
Enzo : Modified Code
For each pair of regions
conditionally call MPI_Test(…) to check for outstanding send requests
if regions overlap
call MPI_Isend(send_request,…) to “send” data
call MPI_Barrier(…)
For each pair of regions
if regions overlap
call MPI_Irecv(recv_request) to receive boundary data
call MPI_Wait(recv_request,…)

IBM Systems & Technology Group
Deep Computing |
MPI Events for Enzo - Tuned

IBM Systems & Technology Group
Deep Computing |
Xprofiler
CPU profiling tool similar to gprofCan be used to profile both serial and parallel applicationsUse procedure-profiling information to construct a graphical display of the functions within an applicationProvide quick access to the profiled data and helps users identify functions that are the most CPU-intensiveBased on sampling (support from both compiler and kernel)Charge execution time to source lines and show disassembly code
IBM Systems & Technology Group
Deep Computing |
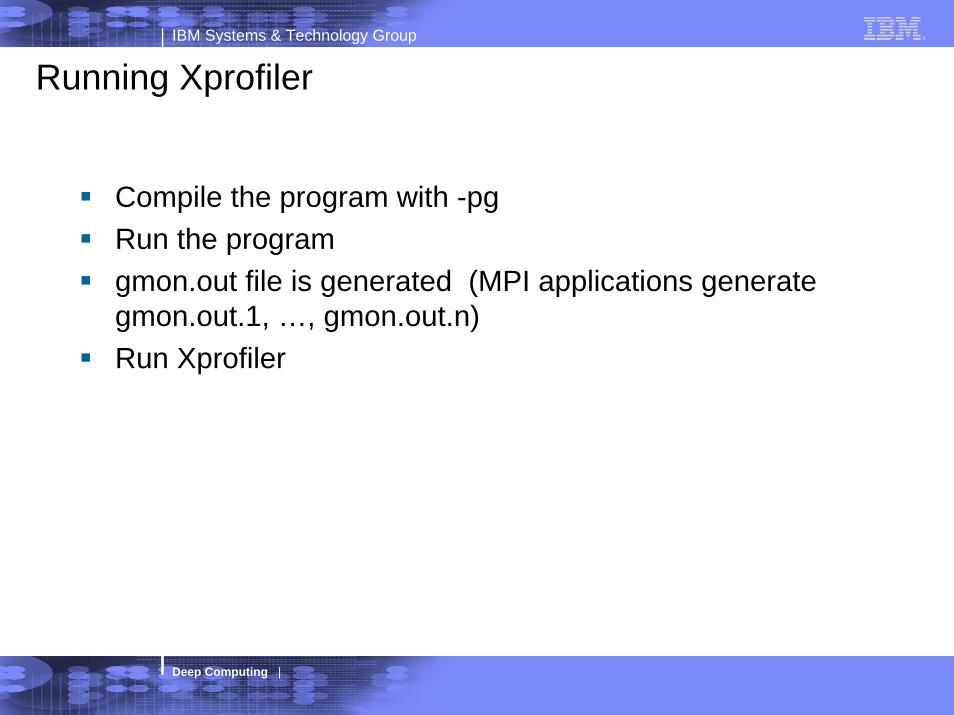
Running Xprofiler
Compile the program with -pg Run the program gmon.out file is generated (MPI applications generate gmon.out.1, …, gmon.out.n)Run Xprofiler

IBM Systems & Technology Group
Deep Computing |
Xprofiler - Application View

IBM Systems & Technology Group
Deep Computing |
Xprofiler: Main Display
Width of a bar:time includingcalled routinesHeight of a bar:time excludingcalled routinesCall arrowslabeled withnumber of callsOverview windowfor easy navigation(View Overview)

IBM Systems & Technology Group
Deep Computing |
Xprofiler: Flat Profile
Menu Report provides usual gprof reports plus some extra ones– Flat Profile– Call Graph Profile – Function Index – Function Call Summary – Library Statistics
IBM Systems & Technology Group
Deep Computing |
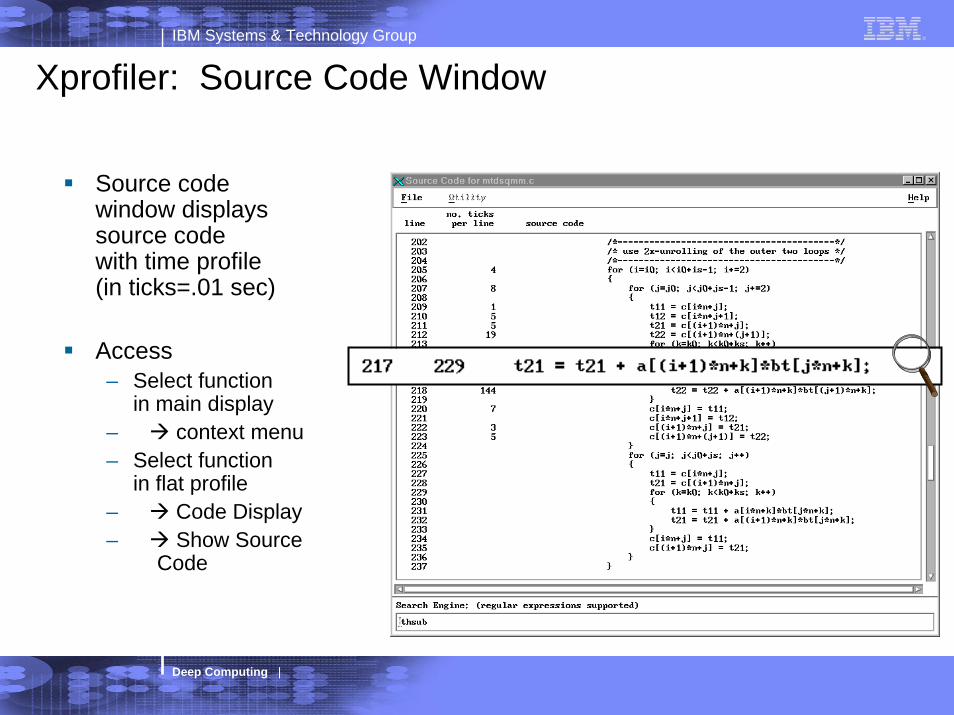
Xprofiler: Source Code Window
Source codewindow displayssource codewith time profile(in ticks=.01 sec)
Access– Select function
in main display– context menu– Select function
in flat profile– Code Display– Show Source
Code

IBM Systems & Technology Group
Deep Computing |
Xprofiler - Disassembler Code

IBM Systems & Technology Group
Deep Computing |
Hardware Performance Monitor (HPM)
Provides comprehensive reports of events that are critical to performance on IBM systems. Gather critical hardware performance metrics, e.g.
– Number of misses on all cache levels– Number of floating point instructions executed – Number of instruction loads that cause TLB misses
Helps to identify and eliminate performance bottlenecks.

IBM Systems & Technology Group
Deep Computing |
LIBHPM
Instrumentation libraryProvides performance information for instrumented program sectionsSupports multiple (nested) instrumentation sectionsMultiple sections may have the same IDRun-time performance information collectionBased on bgl_perfctr layer – can be eliminated in BG/P

IBM Systems & Technology Group
Deep Computing |
Event Sets
16 sets (0-15); 328 eventsInformation for– Time– FPU (0,1)– L3 memory– Processing Unit (0,1)– Tree network– Torus network
For detailed names and descriptions: event_sets.txt

IBM Systems & Technology Group
Deep Computing |
FunctionshpmInit( taskID, progName ) / f_hpminit( taskID, progName ) – taskID is an integer value indicating the node ID. – progName is a string with the program name.
hpmStart( instID, label ) / f_hpmstart( instID, label ) – instID is the instrumented section ID. It should be > 0 and <= 100 ( can be
overridden)– Label is a string containing a label, which is displayed by PeekPerf
hpmStop( instID ) / f_hpmstop( instID )– For each call to hpmStart, there should be a corresponding call to hpmStop with
matching instID
hpmTerminate( taskID ) / f_hpmterminate( taskID )– This function will generate the output. If the program exits without calling
hpmTerminate, no performance information will be generated.

IBM Systems & Technology Group
Deep Computing |
Functions (continued)
hpmGetTimeAndCounters( numCounters, time, values ) / f_GetTimeAndCounters ( numCounters, time, values ) – returns the time in seconds and counts since the call to hpmInit. – numCounters: integer indicating the number of counters to be accessed. – time: double precision float – values: “long long” vector of size “numCounters”.
hpmGetCounters( values ) / f_hpmGetCounters ( values ) – Similar to hpmGetTimeAndCounters– only returns the total counts since the call to hpmInit

IBM Systems & Technology Group
Deep Computing |
Example of Instrumented Code
C / C++declaration:
#include “libhpm.h” use:
hpmInit( taskID, “my program” ); hpmStart( 1, “outer call” ); do_work(); hpmStart( 2, “computing meaning of
life” ); do_more_work(); hpmStop( 2 ); hpmStop( 1 ); hpmTerminate( taskID );
Fortrandeclaration:
#include “f_hpm.h” use:
call f_hpminit( taskID, “my program” ) call f_hpmstart( 1, “Do Loop” ) do …
call do_work() call f_hpmstart( 5, “computing meaning
of life” ); call do_more_work(); call f_hpmstop( 5 );
end do call f_hpmstop( 1 ) call f_hpmterminate( taskID )

IBM Systems & Technology Group
Deep Computing |
Hpmcount Examplebash-2.05a$ hpm_count swim…… // program output hpmcount (V 2.5.4) summaryExecution time (wall clock time) : 7.378159 seconds######## Resource Usage Statistics ######## Total amount of time in user mode : 0.010000 secondsAverage shared memory use in text segment : 672 Kbytes*sec………PM_FPU_FDIV (FPU executed FDIV instruction) : 0PM_FPU_FMA (FPU executed multiply-add instruction) : 0PM_CYC (Processor cycles) : 54331072PM_FPU_STF (FPU executed store instruction) : 2172PM_INST_CMPL (Instructions completed) : 17928229Utilization rate : 0.446 %Total load and store operations : 0.004 MMIPS : 2.140Instructions per cycle : 0.330

IBM Systems & Technology Group
Deep Computing |
HPM Visualization Using PeekPerf

IBM Systems & Technology Group
Deep Computing |
Environment Flags
HPM_EVENT_SET– Select the event set to be recorded– Integer (0 – 15)
HPM_NUM_INST_PTS– Overwrite the default of 100 instrumentation sections in the app. – Integer value > 0
HPM_WITH_MEASUREMENT_ERROR– Deactivate the procedure that removes measurement errors. – True or False (0 or 1).
HPM_OUTPUT_NAME– Define an output file name different from the default. – String
HPM_VIZ_OUTPUT– Indicate if “.viz” file (for input to PeekPerf) should be generated or not. – True or False (0 or 1).
HPM_TABLE_OUTPUT– Indicate table text file should be generated or not. – True or False (0 or 1).

IBM Systems & Technology Group
Deep Computing |
Modular I/O (MIO)
Addresses the need of application-level optimization for I/O. Analyze and tune I/O at the application level – For example, when an application exhibits the I/O pattern of sequential
reading of large files – MIO
• Detects the behavior • Invokes its asynchronous prefetching module to prefetch user data.
Planned Integration into HPC Toolkit with PeekPerfcapabilities– Source code traceback– Future capability for dynamic I/O instrumentation

IBM Systems & Technology Group
Deep Computing |
Challenges
Hardware– Different performance counter set
Scalability– 64k nodes– Tracking communications for each pair:
• (65,536)2x48 bytes = 200 GB– Number of processes and events vs. number of screen pixels

IBM Systems & Technology Group
Deep Computing |
Future work
MP_Profiler– Scalability
Xprofiler– Improved GUI– Integration with other platforms
HPM– Useful derived metrics and verifications– Hpmcount / Hpmstat ?– Integration with other platforms
Next target– Modular I/O: MIO