performance analysis of novel blade design of vertical
TRANSCRIPT
2019 International Conference on Sustainable Energy Engineering and Application (ICSEEA)
978-1-7281-3931-9/19/$31.00 ©2019 IEEE
Performance Analysis of Novel Blade Design of Vertical Axis Wind Turbine
Yoyon Ahmudiarto
Research Centre for Electrical Power and Mechatronics
Indonesian Institute of Sciences Bandung, Indonesia [email protected]
Tri Admono Research Centre for Electrical Power
and Mechatronics Indonesian Institute of Sciences
Bandung, Indonesia [email protected]
Agus Budiyono Indonesia Center for Technology
Empowerment (ICTE) Jakarta, Indonesia
Amma Muliya Romadoni Research Centre for Electrical Power
and Mechatronics Indonesian Institute of Sciences
Bandung, Indonesia [email protected]
Bagus Nugroho Department of Mechanical Engineering
University of Melbourne Melbourne, Australia
Tulus Besar Karyanto Research Centre for Electrical Power
and Mechatronics Indonesian Institute of Sciences
Bandung, Indonesia [email protected]
Rey Cheng Chin School of Mechanical Engineering
The University of Adelaide South Australia, Australia [email protected]
Abstract—Vertical Axis Wind Turbine (VAWT) has advantages over Horizontal Axis Wind Turbine (HAWT) in unstable wind direction conditions, moderate, and intermittent wind sources, especially wind in an area of archipelago of Indonesia. To improve the VAWT performance, one of the influencing factors is blade design. The model of blade design will be affected by the output power. Therefore, the choice of blade design will be affected by the coefficient of power. The blade design was the airfoil of the type-H rotor of NACA 4212. Several empirical hypotheses obtained it through the practical experience subjected to use of the savonius blades. It will be shown in this study was to compare design a new type-H rotor VAWT blade using Computational Fluid Dynamic (CFD) software. The novel blade design was upper-curve H-blade of NACA 4212. It showed the result of the analytical analysis to be compared with the same upper-curve inverted blade, and with the upper-lower blade. The results of the performance comparison of numerical analysis, the upper-curve blade has a better power coefficient than the other types. Therefore, the upper-curve blade has the highest power output.
Keywords—Vertical Axis Wind Turbine (VAWT), blade design, Computational Fluid Dynamic (CFD), performance, power coefficient.
I. INTRODUCTION
Generally, wind turbines classified into two types based on their axis of rotation as the Horizontal Axis Wind Turbine (HAWT) and the Vertical Axis Wind Turbine (VAWT). Both types have their advantages and disadvantages. HAWT has better performance than VAWT in stable wind directions. However, in unstable wind conditions, VAWT has better performance than HAWT. The performance also affected by rotor diameter, blade type, and others [1]. Since the 1970s, many studies focused on the development of HAWT, the VAWT type used as an alternative to HAWT. Market demand wants the HAWT type to produce electricity on a large scale, considering that the HAWT type has better efficiency than the VAWT type. However, for urban areas that required ease of installation and maintenance, the
VAWT type is suitable for use, and the cost also less than the HAWT type [2]. Recently, the VAWT application not only in wind energy but also in offshore purposes. For example, the Eole project in Canada using the VAWT application in offshore. Although, in theory, Darrieus VAWT has a smaller efficiency than HAWT. However, on a large scale, the Darrieus VAWT has several advantages over a HAWT type [3].
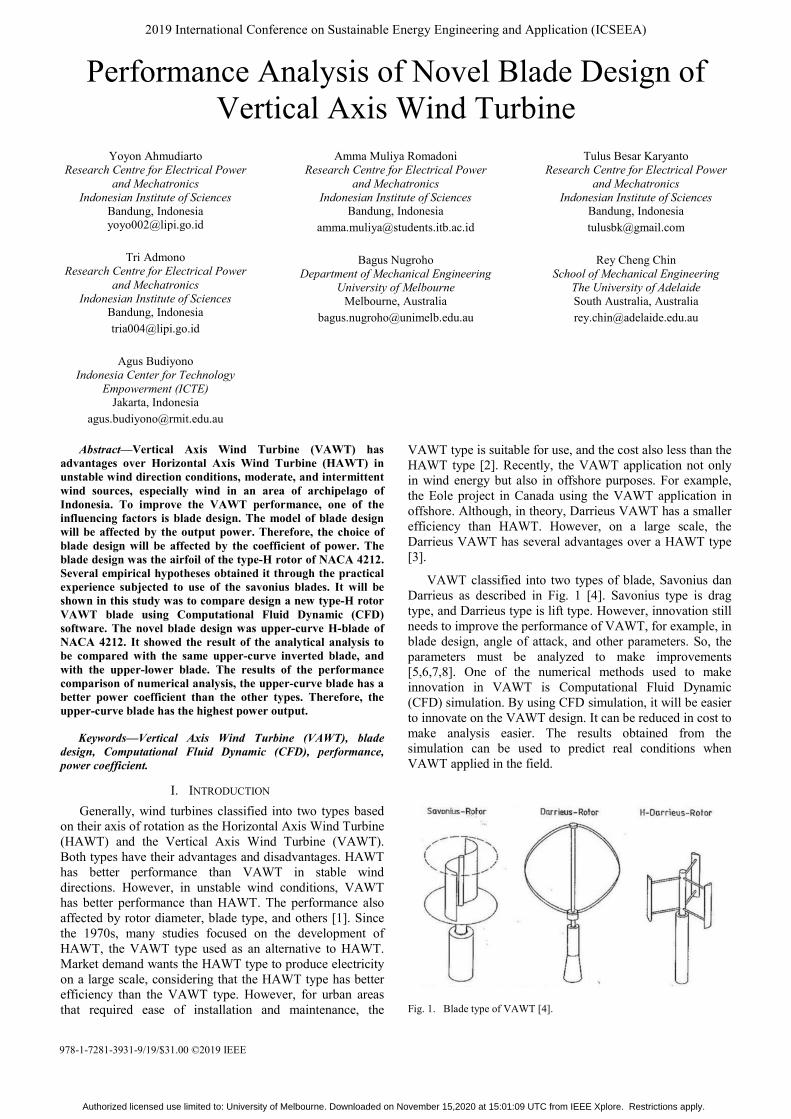
VAWT classified into two types of blade, Savonius dan Darrieus as described in Fig. 1 [4]. Savonius type is drag type, and Darrieus type is lift type. However, innovation still needs to improve the performance of VAWT, for example, in blade design, angle of attack, and other parameters. So, the parameters must be analyzed to make improvements [5,6,7,8]. One of the numerical methods used to make innovation in VAWT is Computational Fluid Dynamic (CFD) simulation. By using CFD simulation, it will be easier to innovate on the VAWT design. It can be reduced in cost to make analysis easier. The results obtained from the simulation can be used to predict real conditions when VAWT applied in the field.
Fig. 1. Blade type of VAWT [4].
Authorized licensed use limited to: University of Melbourne. Downloaded on November 15,2020 at 15:01:09 UTC from IEEE Xplore. Restrictions apply.
176
II. DESIGN APPROACH
A. General Design
NACA aerofoil usually used in airplane applications. There are many models of NACA in different sizes and shapes. N.C. Batista et al. [9] analyzed several types of NACA in VAWT. Their analysis focused on blade types of NACA profile in chamber size and position. The result is that NACA has right at drag in the downside of the rotor.
N.C. Batista et al. used the general design of NACA in their analysis. This study, the analysis not only in the general design of NACA but also in the novel design of NACA. NACA 4212 has been chosen in this study because of good at the leading edge in the upper side. In this research, NACA 4212 modified to increase the performance of the blade.
B. Governing Equations
Generally, governing equations in CFD consist of continuity equations, Navier-Stokes equations, and energy equations [10]. In this study, objects considered in three dimensional, unsteady, incompressible, and viscous flow. The model that simulated with the domain of moving (rotating), so the results obtained are in the form of moving frames. Therefore, the Reynold-Averaged Navier-Stokes equation used in this model.
The continuity equation is the fundamental law of the mass conservation equation. The law of mass conservation defined as a change in mass in the volume control (CV) equal to the net rate of mass entering CV [11]. The conservation equation for mass in integrals is as follows:
. + u. .δΑ = 0, ∀ϖ∈Ρ (1)
Equation (1) can be converted to the differential using Gauss divergence theorem:
+∇( υ) = 0 (2) isdensity(Kg/m ), uisflowvelocity(m/s), and∇is divergence term.
∇= + + (3)
The equation in incompressible viscous flow describe with the Navier-Stokes equation:
+ = − ̅ + ² − (4)
= ́ ́ (5)
= 0 (6)where is fluid velocity (m/s) , p is pressure (Pa), and v is kinematic viscosity (m /s).
The turbulence model used is the k-ω Shear Stress Transport (SST). This model has two equations, the first equation specific to turbulent kinetic energy, k (m² / s²) and another equation for turbulent dissipation rate, ω (1 / s). The
specific turbulent kinetic energy equation is as follows [12-14]:
( )+ ( ) = − + ( + ) (7)
( )+ ( ) = − + ( + )
+ 2(1− ) , (8)
Where is production turbulent kinetic energy and is a blending function.
C. General Considerations
The maximum power available in wind turbines, , and obtained from simulations or experiments, ,correlate. The following is the correlation [15]:
= (Ωαττ) (9)
= = (Ωαττ) (10)
Where is mechanical torque (N.m), is rotational speed (rad/s), A is swept area( ) projected by the turbine in wind directions, V is wind speed (m/s), and is the power coefficient. The power coefficient is the ratio between converted power ( )and the energy available in the wind ( ). = (11)
Tip speed ratio (TSR), , is the ratio between the tangential speed of blade speed and wind speed.
= = (12)
Where is tip speed (m/s), R is rotor radius (m), is rotational speed (rad/s), and V is wind speed (m/s).
III. METHODOLOGY
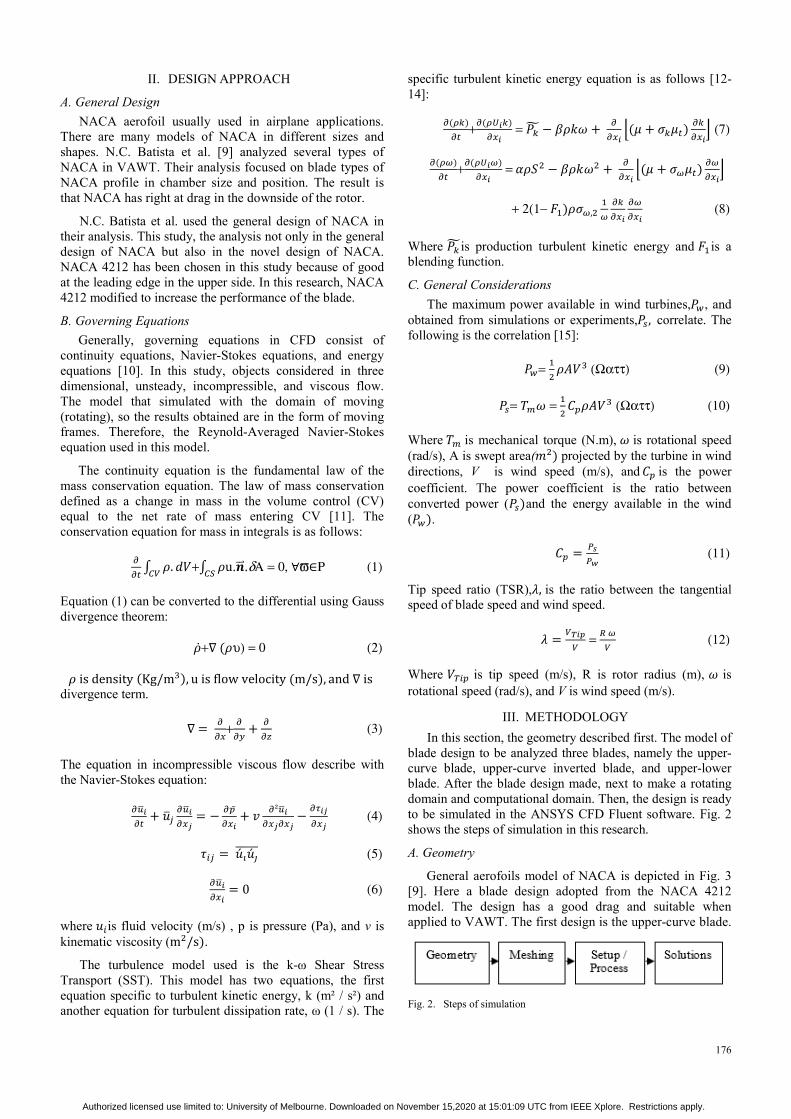
In this section, the geometry described first. The model of blade design to be analyzed three blades, namely the upper-curve blade, upper-curve inverted blade, and upper-lower blade. After the blade design made, next to make a rotating domain and computational domain. Then, the design is ready to be simulated in the ANSYS CFD Fluent software. Fig. 2 shows the steps of simulation in this research.
A. Geometry
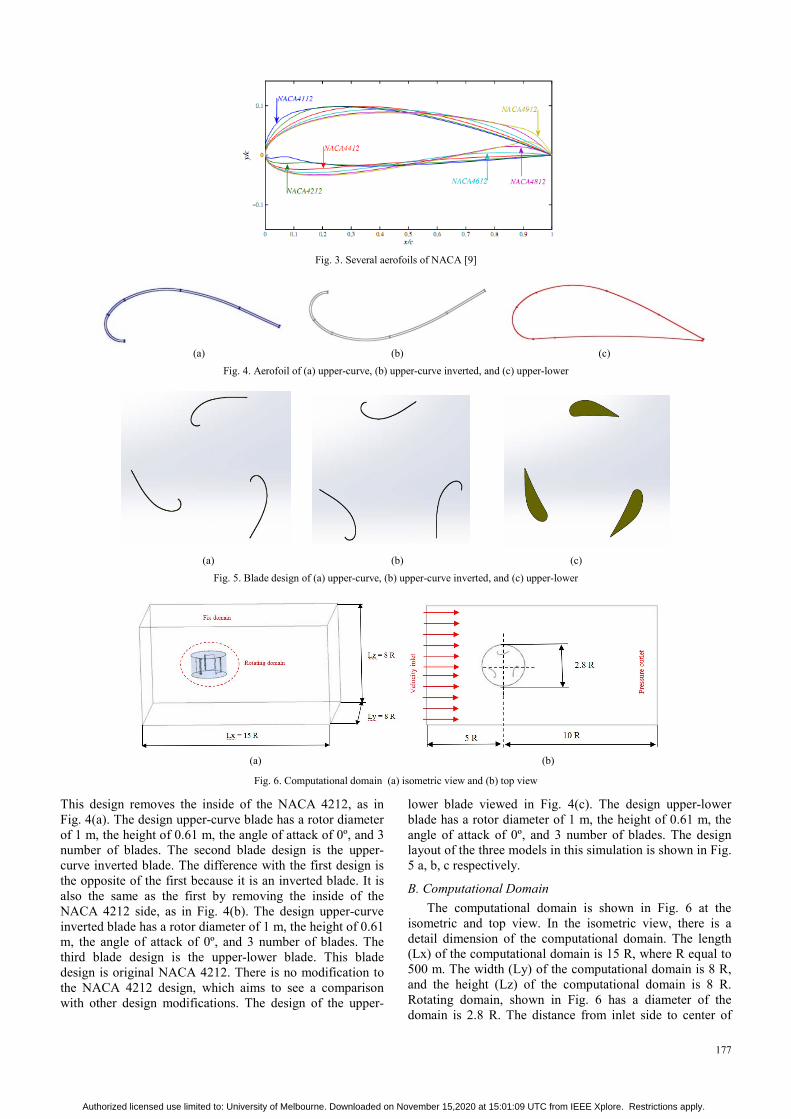
General aerofoils model of NACA is depicted in Fig. 3 [9]. Here a blade design adopted from the NACA 4212 model. The design has a good drag and suitable when applied to VAWT. The first design is the upper-curve blade.
Fig. 2. Steps of simulation
Authorized licensed use limited to: University of Melbourne. Downloaded on November 15,2020 at 15:01:09 UTC from IEEE Xplore. Restrictions apply.
177
This design removes the inside of the NACA 4212, as in Fig. 4(a). The design upper-curve blade has a rotor diameter of 1 m, the height of 0.61 m, the angle of attack of 0º, and 3 number of blades. The second blade design is the upper-curve inverted blade. The difference with the first design is the opposite of the first because it is an inverted blade. It is also the same as the first by removing the inside of the NACA 4212 side, as in Fig. 4(b). The design upper-curve inverted blade has a rotor diameter of 1 m, the height of 0.61 m, the angle of attack of 0º, and 3 number of blades. The third blade design is the upper-lower blade. This blade design is original NACA 4212. There is no modification to the NACA 4212 design, which aims to see a comparison with other design modifications. The design of the upper-
lower blade viewed in Fig. 4(c). The design upper-lower blade has a rotor diameter of 1 m, the height of 0.61 m, the angle of attack of 0º, and 3 number of blades. The design layout of the three models in this simulation is shown in Fig. 5 a, b, c respectively.
B. Computational Domain
The computational domain is shown in Fig. 6 at the isometric and top view. In the isometric view, there is a detail dimension of the computational domain. The length (Lx) of the computational domain is 15 R, where R equal to 500 m. The width (Ly) of the computational domain is 8 R, and the height (Lz) of the computational domain is 8 R. Rotating domain, shown in Fig. 6 has a diameter of the domain is 2.8 R. The distance from inlet side to center of
Fig. 3. Several aerofoils of NACA [9]
(a) (b) (c)
Fig. 4. Aerofoil of (a) upper-curve, (b) upper-curve inverted, and (c) upper-lower
(a) (b) (c)
Fig. 5. Blade design of (a) upper-curve, (b) upper-curve inverted, and (c) upper-lower
(a) (b)
Fig. 6. Computational domain (a) isometric view and (b) top view
Authorized licensed use limited to: University of Melbourne. Downloaded on November 15,2020 at 15:01:09 UTC from IEEE Xplore. Restrictions apply.
178
rotor diameter is 5 R and from outlet side is 10 R. Rotating domain means rotation of VAWT blade. Furthermore, fix domain is the wall of the computational domain.
C. Meshing
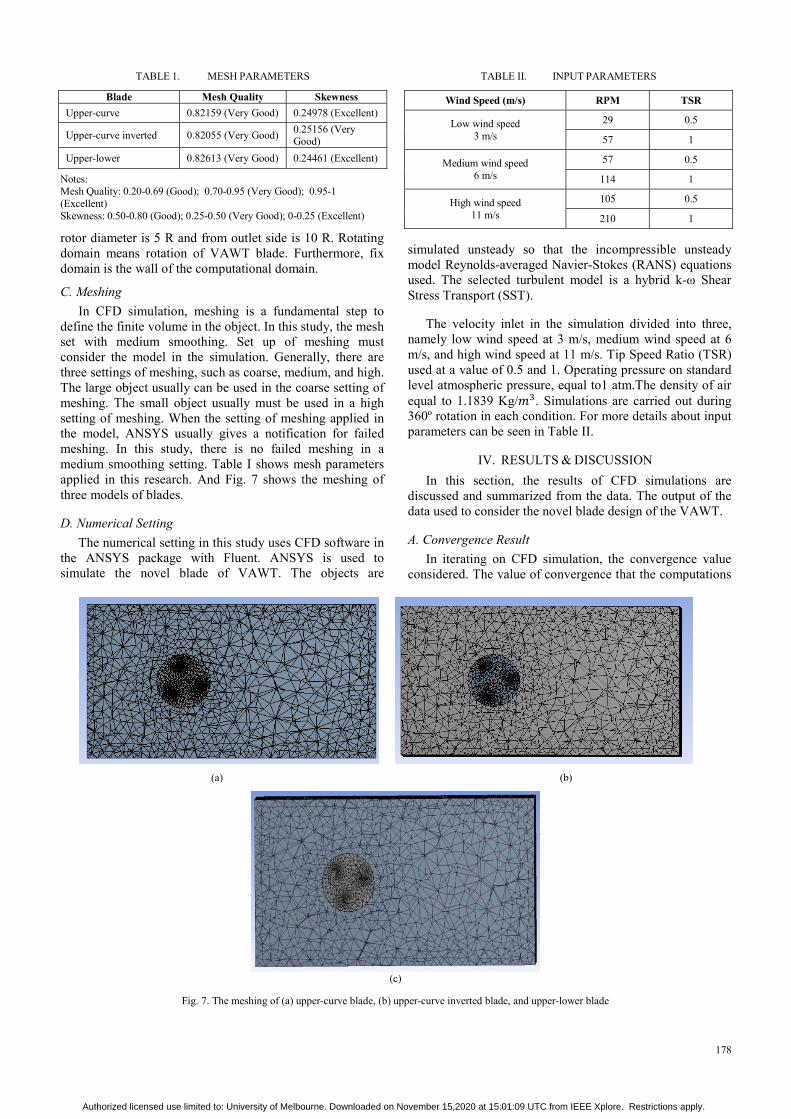
In CFD simulation, meshing is a fundamental step to define the finite volume in the object. In this study, the mesh set with medium smoothing. Set up of meshing must consider the model in the simulation. Generally, there are three settings of meshing, such as coarse, medium, and high. The large object usually can be used in the coarse setting of meshing. The small object usually must be used in a high setting of meshing. When the setting of meshing applied in the model, ANSYS usually gives a notification for failed meshing. In this study, there is no failed meshing in a medium smoothing setting. Table I shows mesh parameters applied in this research. And Fig. 7 shows the meshing of three models of blades.
D. Numerical Setting
The numerical setting in this study uses CFD software in the ANSYS package with Fluent. ANSYS is used to simulate the novel blade of VAWT. The objects are
simulated unsteady so that the incompressible unsteady model Reynolds-averaged Navier-Stokes (RANS) equations used. The selected turbulent model is a hybrid k-ω Shear Stress Transport (SST).
The velocity inlet in the simulation divided into three, namely low wind speed at 3 m/s, medium wind speed at 6 m/s, and high wind speed at 11 m/s. Tip Speed Ratio (TSR) used at a value of 0.5 and 1. Operating pressure on standard level atmospheric pressure, equal to1 atm.The density of air equal to 1.1839 Kg/ . Simulations are carried out during 360º rotation in each condition. For more details about input parameters can be seen in Table II.
IV. RESULTS & DISCUSSION
In this section, the results of CFD simulations are discussed and summarized from the data. The output of the data used to consider the novel blade design of the VAWT.
A. Convergence Result
In iterating on CFD simulation, the convergence value considered. The value of convergence that the computations
(a) (b)
(c)
Fig. 7. The meshing of (a) upper-curve blade, (b) upper-curve inverted blade, and upper-lower blade
TABLE 1. MESH PARAMETERS
Blade Mesh Quality Skewness
Upper-curve 0.82159 (Very Good) 0.24978 (Excellent)
Upper-curve inverted 0.82055 (Very Good) 0.25156 (Very Good)
Upper-lower 0.82613 (Very Good) 0.24461 (Excellent)
Notes: Mesh Quality: 0.20-0.69 (Good); 0.70-0.95 (Very Good); 0.95-1 (Excellent) Skewness: 0.50-0.80 (Good); 0.25-0.50 (Very Good); 0-0.25 (Excellent)
TABLE II. INPUT PARAMETERS
Wind Speed (m/s) RPM TSR
Low wind speed 3 m/s
29 0.5
57 1
Medium wind speed 6 m/s
57 0.5
114 1
High wind speed 11 m/s
105 0.5
210 1
Authorized licensed use limited to: University of Melbourne. Downloaded on November 15,2020 at 15:01:09 UTC from IEEE Xplore. Restrictions apply.
179
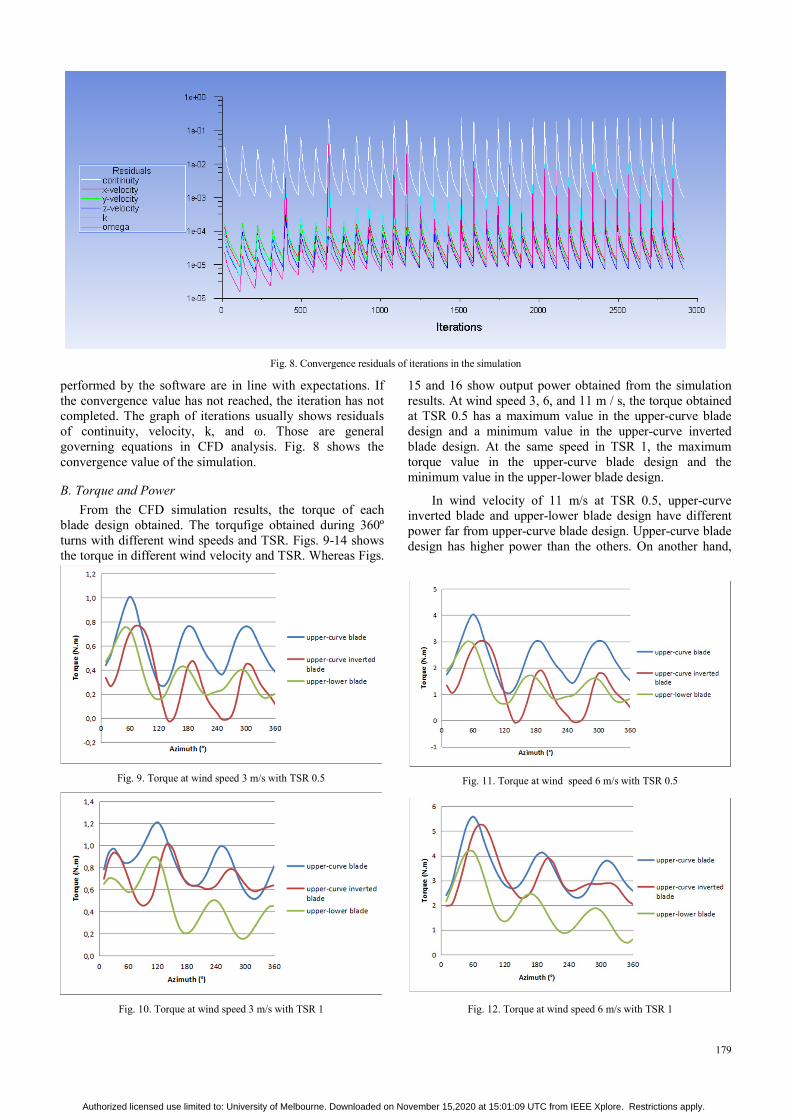
performed by the software are in line with expectations. If the convergence value has not reached, the iteration has not completed. The graph of iterations usually shows residuals of continuity, velocity, k, and ω. Those are general governing equations in CFD analysis. Fig. 8 shows the convergence value of the simulation.
B. Torque and Power
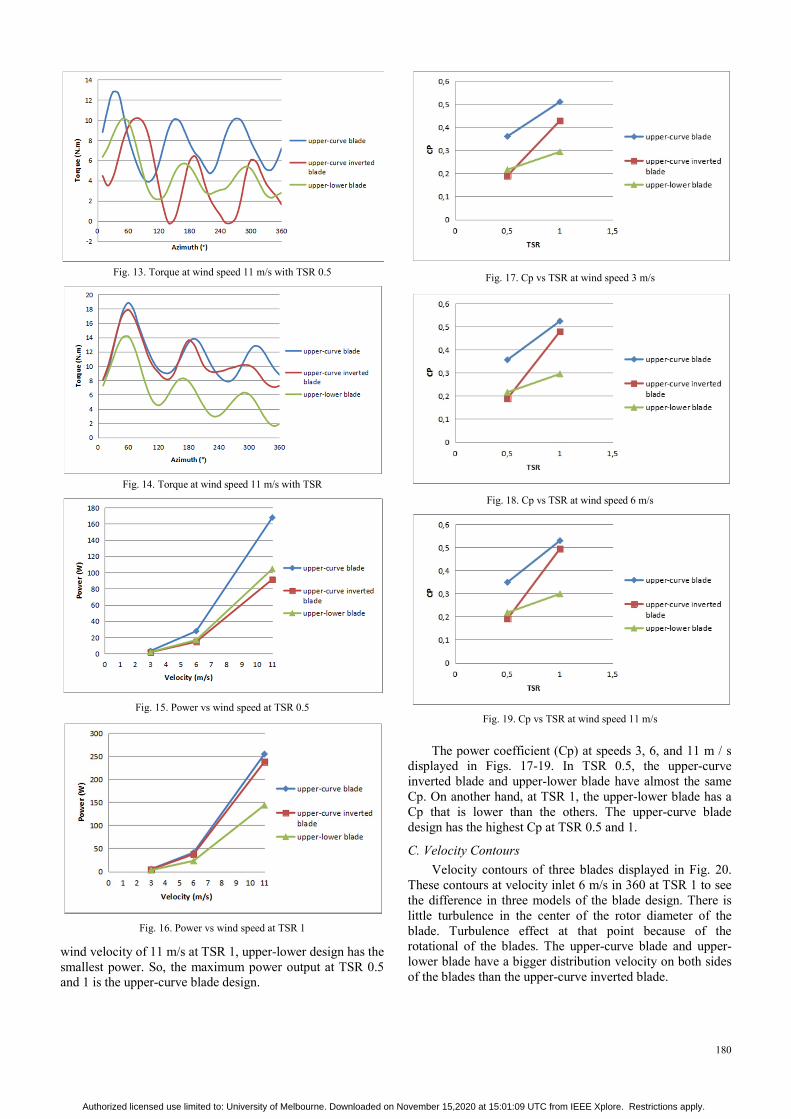
From the CFD simulation results, the torque of each blade design obtained. The torqufige obtained during 360º turns with different wind speeds and TSR. Figs. 9-14 shows the torque in different wind velocity and TSR. Whereas Figs.
15 and 16 show output power obtained from the simulation results. At wind speed 3, 6, and 11 m / s, the torque obtained at TSR 0.5 has a maximum value in the upper-curve blade design and a minimum value in the upper-curve inverted blade design. At the same speed in TSR 1, the maximum torque value in the upper-curve blade design and the minimum value in the upper-lower blade design.
In wind velocity of 11 m/s at TSR 0.5, upper-curve inverted blade and upper-lower blade design have different power far from upper-curve blade design. Upper-curve blade design has higher power than the others. On another hand,
Fig. 9. Torque at wind speed 3 m/s with TSR 0.5
Fig. 10. Torque at wind speed 3 m/s with TSR 1
Fig. 8. Convergence residuals of iterations in the simulation
Fig. 11. Torque at wind speed 6 m/s with TSR 0.5
Fig. 12. Torque at wind speed 6 m/s with TSR 1
Authorized licensed use limited to: University of Melbourne. Downloaded on November 15,2020 at 15:01:09 UTC from IEEE Xplore. Restrictions apply.
180
wind velocity of 11 m/s at TSR 1, upper-lower design has the smallest power. So, the maximum power output at TSR 0.5 and 1 is the upper-curve blade design.
The power coefficient (Cp) at speeds 3, 6, and 11 m / s displayed in Figs. 17-19. In TSR 0.5, the upper-curve inverted blade and upper-lower blade have almost the same Cp. On another hand, at TSR 1, the upper-lower blade has a Cp that is lower than the others. The upper-curve blade design has the highest Cp at TSR 0.5 and 1.
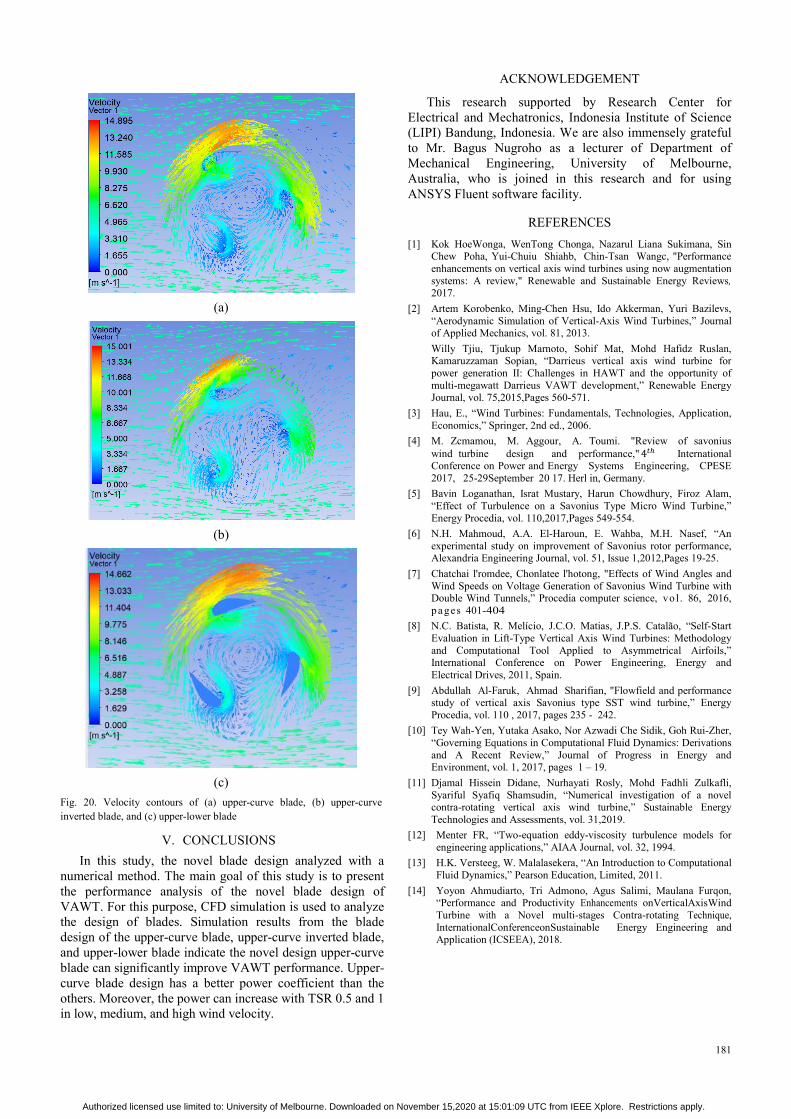
C. Velocity Contours
Velocity contours of three blades displayed in Fig. 20. These contours at velocity inlet 6 m/s in 360 at TSR 1 to see the difference in three models of the blade design. There is little turbulence in the center of the rotor diameter of the blade. Turbulence effect at that point because of the rotational of the blades. The upper-curve blade and upper-lower blade have a bigger distribution velocity on both sides of the blades than the upper-curve inverted blade.
Fig. 13. Torque at wind speed 11 m/s with TSR 0.5
Fig. 14. Torque at wind speed 11 m/s with TSR
Fig. 15. Power vs wind speed at TSR 0.5
Fig. 16. Power vs wind speed at TSR 1
Fig. 17. Cp vs TSR at wind speed 3 m/s
Fig. 18. Cp vs TSR at wind speed 6 m/s
Fig. 19. Cp vs TSR at wind speed 11 m/s
Authorized licensed use limited to: University of Melbourne. Downloaded on November 15,2020 at 15:01:09 UTC from IEEE Xplore. Restrictions apply.
181
V. CONCLUSIONS
In this study, the novel blade design analyzed with a numerical method. The main goal of this study is to present the performance analysis of the novel blade design of VAWT. For this purpose, CFD simulation is used to analyze the design of blades. Simulation results from the blade design of the upper-curve blade, upper-curve inverted blade, and upper-lower blade indicate the novel design upper-curve blade can significantly improve VAWT performance. Upper-curve blade design has a better power coefficient than the others. Moreover, the power can increase with TSR 0.5 and 1 in low, medium, and high wind velocity.
ACKNOWLEDGEMENT
This research supported by Research Center for Electrical and Mechatronics, Indonesia Institute of Science (LIPI) Bandung, Indonesia. We are also immensely grateful to Mr. Bagus Nugroho as a lecturer of Department of Mechanical Engineering, University of Melbourne, Australia, who is joined in this research and for using ANSYS Fluent software facility.
REFERENCES
[1] Kok HoeWonga, WenTong Chonga, Nazarul Liana Sukimana, Sin Chew Poha, Yui-Chuiu Shiahb, Chin-Tsan Wangc, "Performance enhancements on vertical axis wind turbines using now augmentation systems: A review," Renewable and Sustainable Energy Reviews, 2017.
[2] Artem Korobenko, Ming-Chen Hsu, Ido Akkerman, Yuri Bazilevs, “Aerodynamic Simulation of Vertical-Axis Wind Turbines,” Journal of Applied Mechanics, vol. 81, 2013.
Willy Tjiu, Tjukup Marnoto, Sohif Mat, Mohd Hafidz Ruslan, Kamaruzzaman Sopian, “Darrieus vertical axis wind turbine for power generation II: Challenges in HAWT and the opportunity of multi-megawatt Darrieus VAWT development,” Renewable Energy Journal, vol. 75,2015,Pages 560-571.
[3] Hau, E., “Wind Turbines: Fundamentals, Technologies, Application, Economics,” Springer, 2nd ed., 2006.
[4] M. Zcmamou, M. Aggour, A. Toumi. "Review of savonius wind turbine design and performance,"4 International Conference on Power and Energy Systems Engineering, CPESE 2017, 25-29September 20 17. Herl in, Germany.
[5] Bavin Loganathan, Israt Mustary, Harun Chowdhury, Firoz Alam, “Effect of Turbulence on a Savonius Type Micro Wind Turbine,” Energy Procedia, vol. 110,2017,Pages 549-554.
[6] N.H. Mahmoud, A.A. El-Haroun, E. Wahba, M.H. Nasef, “An experimental study on improvement of Savonius rotor performance, Alexandria Engineering Journal, vol. 51, Issue 1,2012,Pages 19-25.
[7] Chatchai l'romdee, Chonlatee l'hotong, "Effects of Wind Angles and Wind Speeds on Voltage Generation of Savonius Wind Turbine with Double Wind Tunnels,” Procedia computer science, vo l . 86, 2016, p ages 401-404
[8] N.C. Batista, R. Melício, J.C.O. Matias, J.P.S. Catalão, “Self-Start Evaluation in Lift-Type Vertical Axis Wind Turbines: Methodology and Computational Tool Applied to Asymmetrical Airfoils,” International Conference on Power Engineering, Energy and Electrical Drives, 2011, Spain.
[9] Abdullah Al-Faruk, Ahmad Sharifian, "Flowfield and performance study of vertical axis Savonius type SST wind turbine,” Energy Procedia, vol. 110 , 2017, pages 235 - 242.
[10] Tey Wah-Yen, Yutaka Asako, Nor Azwadi Che Sidik, Goh Rui-Zher, “Governing Equations in Computational Fluid Dynamics: Derivations and A Recent Review,” Journal of Progress in Energy and Environment, vol. 1, 2017, pages 1 – 19.
[11] Djamal Hissein Didane, Nurhayati Rosly, Mohd Fadhli Zulkafli, Syariful Syafiq Shamsudin, “Numerical investigation of a novel contra-rotating vertical axis wind turbine,” Sustainable Energy Technologies and Assessments, vol. 31,2019.
[12] Menter FR, “Two-equation eddy-viscosity turbulence models for engineering applications,” AIAA Journal, vol. 32, 1994.
[13] H.K. Versteeg, W. Malalasekera, “An Introduction to Computational Fluid Dynamics,” Pearson Education, Limited, 2011.
[14] Yoyon Ahmudiarto, Tri Admono, Agus Salimi, Maulana Furqon, “Performance and Productivity Enhancements onVerticalAxisWind Turbine with a Novel multi-stages Contra-rotating Technique, InternationalConferenceonSustainable Energy Engineering and Application (ICSEEA), 2018.
(a)
(b)
(c)
Fig. 20. Velocity contours of (a) upper-curve blade, (b) upper-curve inverted blade, and (c) upper-lower blade
Authorized licensed use limited to: University of Melbourne. Downloaded on November 15,2020 at 15:01:09 UTC from IEEE Xplore. Restrictions apply.