lecture 7 emissions anthropogenic - natural (earth crust) deep earth (mantle, core) hydrosphere...
TRANSCRIPT

1
Lecture 7Lecture 7
emissionsemissions
anthropogenicanthropogenic -- naturalnatural
IPCC [2007]

2
Lifetime = time necessary that the concentrationdecrease to 1/e concerning the start value:
Atmospheric lifetime
ttXtX exp)0()(
Chemical Lifetimes of atmospheric compoundsChemical Lifetimes of atmospheric compounds(average for total atmosphere)
2 days*Toluene (traffic, anthropog.)
1.6 hours*monoterpenes ( -pinene)
45-1700 years **CFCs (sprays, cooling, anthropog.)
3200 years **SF6
8.4 years **Methane (CH4)
57 days*Carbon monoxide (CO)
3-18 days **Tropospheric O3
Chemical lifetimeCompound
* [OH] = 1.0x10⁶ molecules cm-3 at room temperature assumed
** IPCC, 2001

3
Time scales for horizontal transport (troposphere)Time scales for horizontal transport (troposphere)
2 weeks1-2 months
1-2 months
1 year
D.J. Jacob
Helsinki
Frankfurt
Typical time scales for vertical mixingTypical time scales for vertical mixing
• Estimate time t to travel z by turbulent diffusion:
0 km
2 km1 day
“planetaryboundary layer”
tropopause
5 km
(~10 km)
1 week1 month
10 years
1-2 years
stratopause(~50 km)
1252
102
scmKwithKzt turbturb
D.J. Jacob

4
Reservoir of the Earth system and examples ofReservoir of the Earth system and examples ofprocesses exchanging elements between resrevoirsprocesses exchanging elements between resrevoirs
AtmosphereAtmosphere
Biosphere(Vegetation, animals
Biosphere(Vegetation, animals
Lithosphere(Earth crust)
Lithosphere(Earth crust)
Deep Earth(Mantle, core)
Deep Earth(Mantle, core)
Hydrosphere(oceans, lakes,
rivers, groundwater)
Hydrosphere(oceans, lakes,
rivers, groundwater)SoilsSoils
gas-waterexchange
meteorites escape
assimilation
decay
assimilation
decay
decay photosynthesis
runoffburial
subduction volcanoes
Outer SpaceOuter Space
Global budget of methane (CHGlobal budget of methane (CH44))
D.J. JacobLifetime: 9 years

5
Estimated presentEstimated present--day sources ofday sources of tropospherictropospheric NONOxx
Mapping ofMapping of tropospherictropospheric NONO22 from thefrom the GOMEGOME satellite instrumentsatellite instrument
AFO2000, 2004
Lights atLights atnight fromnight from
spacespace
Can you observe aneffect of mankind?

6
Lightning observed from space (2000)Lightning observed from space (2000)
DJF
JJA
D.J. Jacob
Present day global budget of atmospheric NPresent day global budget of atmospheric N22O (1994)O (1994)
3.9 (3.1 – 4.7)
12.3 (9 – 16)
1.3 (0.7 – 1.8)
0.5 (0.2 – 1.0)
2.1 (0.6 – 3.1)
4.2 (0.6 – 14.8)
2 (0.6 – 4)
4 (2.7 – 5.7)
0.6 (0.3 - 1.2)
3 (1 - 5)
17.7 (6.7 – 36.6)
Biomass burning
Atmosphere (NH3oxidation)
Sink (Tg N yr-1) (stratosphere)Photolysis and oxidation
Accumulation/ trend (Tg N yr-1)
Industrial
Livestock (cattle, feedlots)
Agricultural soils Anthropogenic:
8.1 (2.1 – 20.6)
Temperate soils (forest,grassland)
Tropical soils (forest,savannah)
Oceans Natural:
9.6 (4.6 – 15.9)
Sources (Tg N yr-1)
Although a closed budget can be constructed, uncertainties in sources are large!
Source:IPCC [2001]

7
Global budget of COGlobal budget of CO
D.J. Jacob
Tg O3 yr-1
SOURCES 3400-5700
Chemical production 3000-4600HO2 + NO (70 %)
CH3O2 + NO (20 %)RO2 + NO (10 %)
Transport from Stratosphere 400-1100SINKS 3400-5700
Chemical loss 3000-4200O(1D) + H2O (40 %)
HO2 + O3 (40 %)OH + O3 (10 %)others (10 %)
Dry deposition 500-1500
Sink and source terms for ozone

8
Dust storm
Microscopic picture
Why we have to know something aboutaerosols in the atmosphere ???
• health (respiration)• visibility• radiative balance• cloud formation• heterogeneous
reactions• delivery of nutrients• disease carier• …..

9
Antarctica: > 100 km New Delhi: < 1.5 kmPictures by: Ismo K. Koponen ja Petteri Mönkkönen
Atmospheric aerosols – basiccharacteristics
Definition:solid or liquid particles suspended in air
(‘aero’ (greek) = air + ‘sol’ (greek) = solid),but no single molecules or water droplets!
Sizes:between 1 nm (molecule clusters) and about 100 m,
therefore covering about 5 orders of magnitude in size.
Atmospheric lifetimes:a few minutes up to 10 days depending on size, altitude and water
solubility

10
Types of atmospheric aerosolsPrimary aerosols:
released preformed from the Earths surface e.g. mineral dust, sea salt,pollen, black soot from fire exhaust
Secondary aerosols:
formed from low-volatile chemical or reactive compounds in theatmosphere (gas-phase) e.g. sulphuric acid, organics, nitric acid
Cloud-phase induced aerosols:
formation of low-volatile chemical compounds in the water droplet, which isevaporating, releasing the new particle e.g. sulphuric acid, organics,nitric acids (similar to sec. particles)
But the longer their residence time in the atmosphere,the more these types interact and get mixed!
Size characteristics for aerosols
Particle diameter [ m]
0.001 0.01 0.1 1 10 100
Nucleationmode
Aitkenmode
Accumulationmode
Fine Particles Coarse Particles

11
Origin of theatmospheric aerosol
Soil dustSea saltSmoke
secondary
primary
Cloud-phase
D.J. Jacob
Atmospheric chemistry andatmospheric aerosols
VOCs and primary org.compounds (pollen etc.)soil
VOCs, primary org. compounds(soot etc), NOx, SO2 Sea salt, DMS,
halogenates(Cl -, Br -, IO -)
SO2,soot
Mineral dust
NOx, SO2,Ions, H2O
cloud-particleproduction
(H2SO4, HNO3,nitrates, organics)
primary particles
secondary aerosolprecursors
cloud-phase inducedaerosol

12
Ambient aerosol size distributions
m
m2 /c
m3
m3 /c
m3
SEAS experiment, 2000
Number highest at smaller sizes
Surface area highest at medium sizes
Volume highest at largest sizes
Typical aerosol volume size distributions
Freshurban
Agedurban
rural
remoteWarneck [1999]
Note: Concentrations especially of larger particles decrease rapidly with height.D.J. Jacob

13
Vertical distribution and lifetimeJaenicke, 1993
Jaenicke, 1978
Aerosols with sizes aroundbetween 100 nm and 1 µm have
the longest lifetime
Primary aerosols: sourcesAerosoltyp Yearly production Tg/yearMineral dust 2980Sea salt 10100Vulcano dust 30Primary biologicalparticles
50
Soot 200
Soot
Mineral dustVlasenko, PSI, CH
Sea saltGaspar, 2004
Pollenwww.wikipedia.orgPrimary particles are
larger and observednormally above
1 µm

14
Secondary aerosol sources:Oxidation products by gas phase chemistry
Precursors Yearly production in Tg/yearDimethylsulfid (DMS) from algae 12.4SO2 from volcanos 20Biogenic VOCs 11-270 (could be higher up to
1000)SO2 (antropogenic) from fossilfuels
ca. 50
NOx (antropogenic) from fossilfuels
22
Antropogenic VOCs ca. 2
Black carbon emissions
Chin et al. [2000]
DIESEL
DOMESTICCOAL BURNING
BIOMASSBURNING
D.J. Jacob

15
Primaryemissions
New European emissioninventories for 2005
(EC and OC emissioninventory of PM1,PM2.5 and PM10)
Emission inventoryEmission inventory• Measurements of emissions normally only on selected places
– Important:• It most be representative for a certain area
• Measurements under different atmospheric relevant conditions (temperature, humidity,stress, ...)
• If possible measurements with different techniques (‚cross check‘)
Guenther et al., ACP, 2006
Biogenic VOCmeasurements at the
earth surface(Isopren)

16
• Emission measurements (campaign or monitoring)– A) direct: Measurement down-wind of an emission source (e.g. at the exhaust
pipe of a car or at the chimney of a factory)
– B) indirect: Relaxed Eddy Accumulation (REA)-Systeme
Hyytiälä,Universität Helsinki
Emission inventoryEmission inventory
a) Direct measurements• Measurements direct in the
exhaust gas flow of a chimneyor exhaust pipe
– Sensor will be mounted direct atthe exhaust pipe or the exhaustgas will be measured in achamber
– Adsorption on sampling materialor online measurement
– Variation in the way you run theengine (motor speed)
• Emission measurements in thecanopy
– Enclousure of a certain part fromthe tree in a cuvette or teflon bag
– Sampling over a certain timeperiod on tenax tubes
– Or online measurment withinsturments of high temporal andhigh sensitive sensitivity
http://www.atm.helsinki.fi/SMEAR/index.php?option=com_content&task=view&id=22&Itemid=56Yu et al., 2008

17
Direct analyses: PTR-MS(-TOF)• Proton-Transfer-Reaction Mass Spectroscopie (PTR-MS)• Important: the concentration has to be hgher than the detection limit
(about 20-50 ppt depending on compound) and the proton affinity hasto be stronger than the one for water
Ionicon, 2007
XHOHXOH 23
b) Indiret measurements
• Possible for large-scale areas of homogeneous vegetation or streetcanyons
• Measurements of the individualcompounds inside and above theforest
• Calcualtion of the exchangecoefficients
Relaxed Eddy Accumulation Systeme:– Vegetation considered as a box– Up and down-ward transport will be
calculated based on the vertical windgradients
18
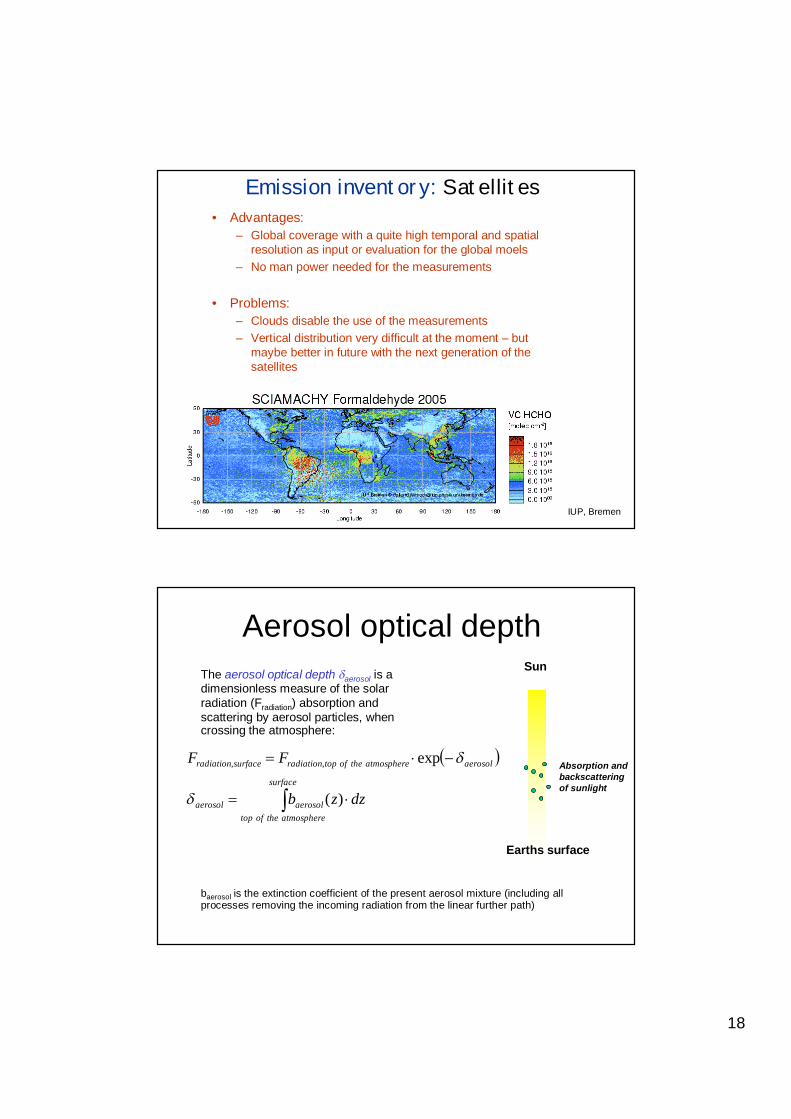
Emission inventory: Satellites
IUP, Bremen
• Advantages:– Global coverage with a quite high temporal and spatial
resolution as input or evaluation for the global moels– No man power needed for the measurements
• Problems:– Clouds disable the use of the measurements– Vertical distribution very difficult at the moment – but
maybe better in future with the next generation of thesatellites
Sun
Aerosol optical depth
Absorption andbackscatteringof sunlight
Earths surface
The aerosol optical depth aerosol is adimensionless measure of the solarradiation (Fradiation) absorption andscattering by aerosol particles, whencrossing the atmosphere:
surface
atmospheretheoftopaerosolaerosol
aerosolatmospheretheoftopradiationsurfaceradiation
dzzb
FF
)(
exp,,
baerosol is the extinction coefficient of the present aerosol mixture (including allprocesses removing the incoming radiation from the linear further path)

19
Aerosol optical depth from satellitemeasurements (ATSR-2)
July 2000 November 2000
at 555 nm
courtesy of ESA (TEMIS)
-10%
-25%
-50%
0%
-10%
-25%
-50%
0%
Aerosol optical depth (AOD) in Europe, 2003PARMA project final report, Jan. 2007
Highest light absorption:
• large cities (e.g. London)• industrialized areas (e.g.Benelux)• at strong sources butprevented mixing (e.g. PoValley)• at traffic ways and oilplatforms (e.g. North Sea)• close to deserts because ofmineral dust (e.g. Marocco,Lybia)
PARMA project final report, …, 2007

20
Fit relies on knownaerosol composition andsize distribution!
PM 2.5 concentrationsin Europe 2003
(fit of PM2.5 data toAOD from MODIS
satellite)
Emission of anthropogenic volatileorganice compounds (AVOCs)

21
Anthropogenic (man made) VOC sources
Traffic19%
Solvents(industry)
13%
Oil production12%
Use of biofuel17%
Rest(e.g. heating,
cooling)19%
Global AVOC EmissionsAnthropogenic: 100 Tg/yearBiomass burning : 50 Tg/year
Total: 140-160 Tg/year1990 tendency increasing
Biomass burning20%
GEIA, 1995;Seinfeld and Pandis, 1998
Anthropogenic VOCs: global sourceAnthropogenic VOCs: global sourceestimationestimation
IPCC (2001)
alkanes (ethane,propane etc)
49%
(aromatics) 20 Tg carbon/year100-200 Tg/yr. (mainly NH)
alkenes,alkynes, dienes
11%
Aromatics15 %
acids4 %
carbonyls 4 %
alcohols 3 %
ether, ester3 %
others8 %
• Major fraction are alkanes(49 %)
• Substantial fraction ofreactive ones:
aromatics and alkenes(26 %)
• Notable fraction ofwater-soluble ones:acids, alcohols andethers/esters (10 %)

22
What single compounds are emitted?
Benzene
Organic compound = hydrocarbon (CxHy)+ other molecules:nitrogen (N), oxygen (O), sulphur (S) …).
Aromatics: e.g. benzene, tolueneAlkene: e.g. ethene, propene, buteneAlkane: e.g. ethane, propane, butane
Oxidised hydrocarbonsAldehydes: e.g. formaldehyde (HCHO)Ketones: e.g. acetone (CH3COCH3)Alcoholes: e.g. ethanol (C2H5OH)Acids: e.g. formic acid (HCOOH)
Nitrate, Sulfate etc.: e.g. PANPeroxides: e.g. Methylhydroperoxide
C=CH
H
H
HEthene
CH3 CH3
C
O
AcetoneAcetone
DDT
Energy production
Industrialproduction
Agriculture
Energy production - petroleum:
Organic material + anaerobe bacteria kerogen petroleum, methane
necessary: temperature and pressure are high without oxygen
23
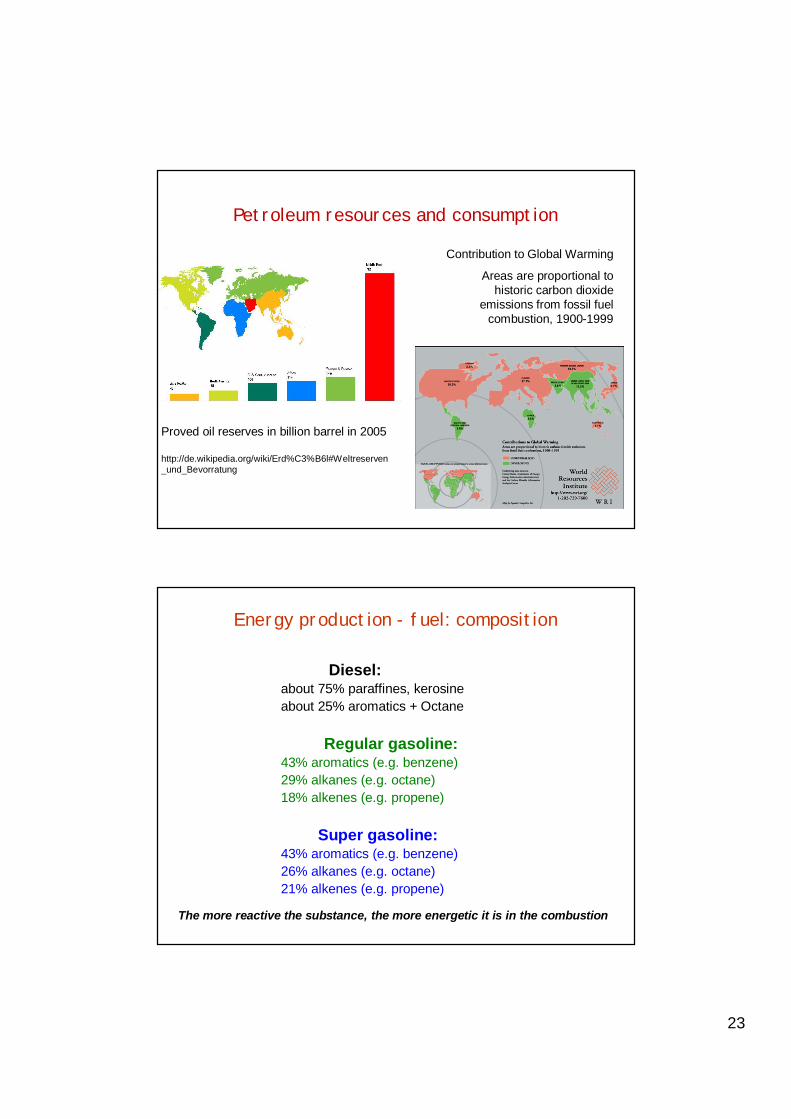
Petroleum resources and consumption
Proved oil reserves in billion barrel in 2005
http://de.wikipedia.org/wiki/Erd%C3%B6l#Weltreserven_und_Bevorratung
Contribution to Global Warming
Areas are proportional tohistoric carbon dioxide
emissions from fossil fuelcombustion, 1900-1999
Energy production - fuel: composition
Diesel:about 75% paraffines, kerosineabout 25% aromatics + Octane
Regular gasoline:43% aromatics (e.g. benzene)29% alkanes (e.g. octane)18% alkenes (e.g. propene)
Super gasoline:43% aromatics (e.g. benzene)26% alkanes (e.g. octane)21% alkenes (e.g. propene)
The more reactive the substance, the more energetic it is in the combustion
24
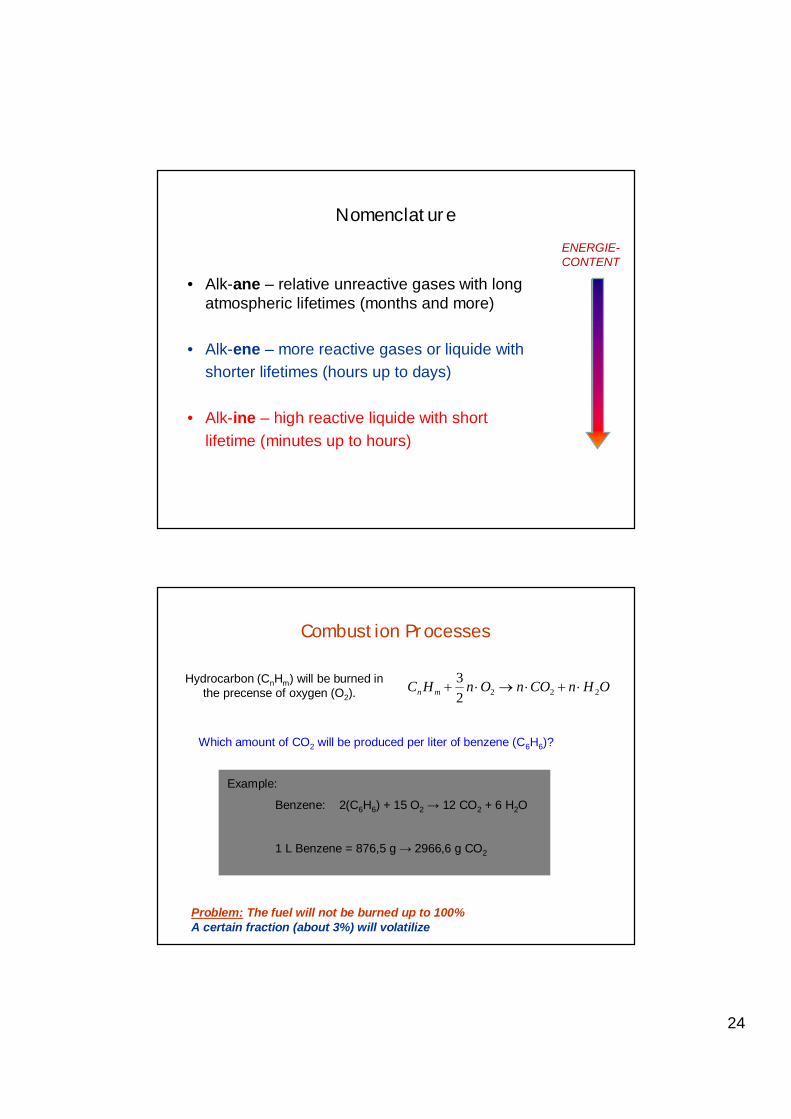
Nomenclature
• Alk-ane – relative unreactive gases with longatmospheric lifetimes (months and more)
• Alk-ene – more reactive gases or liquide withshorter lifetimes (hours up to days)
• Alk-ine – high reactive liquide with shortlifetime (minutes up to hours)
ENERGIE-CONTENT
Combustion Processes
Hydrocarbon (CnHm) will be burned inthe precense of oxygen (O2).
OHnCOnOnHC mn 22223
Example:
Benzene: 2(C6H6) + 15 O2 12 CO2 + 6 H2O
1 L Benzene = 876,5 g 2966,6 g CO2
Which amount of CO2 will be produced per liter of benzene (C6H6)?
Problem: The fuel will not be burned up to 100%A certain fraction (about 3%) will volatilize

25
Consumption of a normal car
http://home.foni.net/~michaelbosch/auto/economic/calconsu.htm
Civil passanger plane: aim = 3.8 L / 100 km / passanger
Gas
olin
e co
nsum
ptio
n pe
r 100
km
Ener
gy c
onsu
mpt
ion
in M
JConsumption Golf IV
Speed in km/h
Global Emission of fuel
http://www.worldwatch.org/
Fossil fuelemissions(unburnt):
ca. 16 Tg/year(2000)

26
Global Emission of fuels
http://www.geiacenter.org/ (GEIA = Global Emissions Inventory Activity)
Total global emissions of anthropogenic VOCsEDGAR database 2007http://geiacenter.org/
27
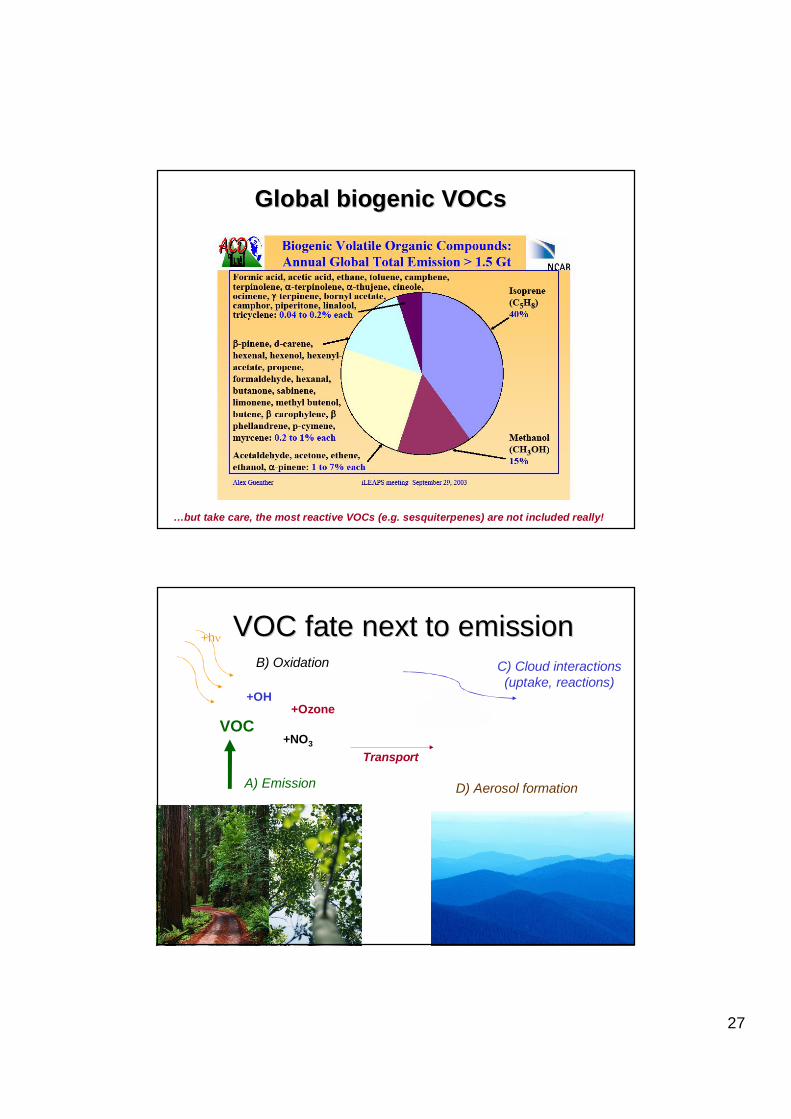
Global biogenic VOCsGlobal biogenic VOCs
…but take care, the most reactive VOCs (e.g. sesquiterpenes) are not included really!
VOC fate next to emissionVOC fate next to emission
A) Emission
+OH
+NO3
+Ozone
+h
VOC
B) Oxidation
Transport
D) Aerosol formation
C) Cloud interactions(uptake, reactions)
28
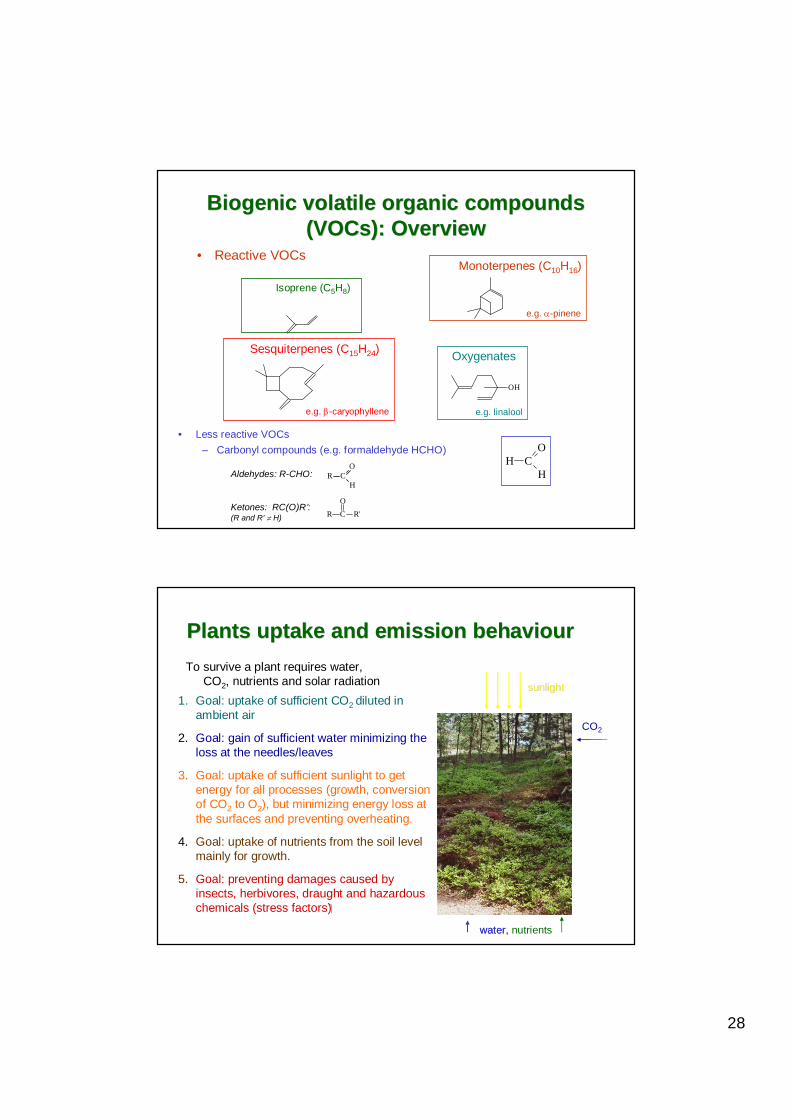
Biogenic volatile organic compoundsBiogenic volatile organic compounds(VOCs): Overview(VOCs): Overview
• Reactive VOCs
• Less reactive VOCs– Carbonyl compounds (e.g. formaldehyde HCHO)
Oxygenates
e.g. linalool
OH
Isoprene (C5H8)
Monoterpenes (C10H16)
e.g. -pinene
Sesquiterpenes (C15H24)
e.g. -caryophyllene
CO
HH
Aldehydes: R-CHO:
Ketones: RC(O)R’:(R and R’ H) R C
OR'
R CO
H
Plants uptake and emission behaviourPlants uptake and emission behaviourTo survive a plant requires water,
CO2, nutrients and solar radiation sunlightsunlight
water, nutrients
1. Goal: uptake of sufficient CO2 diluted inambient air
2. Goal: gain of sufficient water minimizing theloss at the needles/leaves
3. Goal: uptake of sufficient sunlight to getenergy for all processes (growth, conversionof CO2 to O2), but minimizing energy loss atthe surfaces and preventing overheating.
4. Goal: uptake of nutrients from the soil levelmainly for growth.
5. Goal: preventing damages caused byinsects, herbivores, draught and hazardouschemicals (stress factors)
CO2
water

29
Stress factors:Effect of hazardous chemicals (NO, O3, acids):
Ozone impacts on vegetation
A - tobacco
B - birch
Loreto et al., 2001
1 – ozone fumigation2 – ozone and isoprene (VOC)3 – before treatment
1
3
2
Ozone
Ozone
reactive VOCs
Surface emission flux Fvegetation from the vegetation [Guenther et al. (1995)]:
Dm: foliar density (kg dry matter m-2)
e.g. amount of leaves/needles per surface area
: ecosystem dependent emission factor atT = 30 C and PAR = 1000 mol m-2 s-1
( g C m-2 h-1)amount of emission at standard conditions
: adjustment factor for dependence ontemperature and light – emission activity
: emission activity factor for long term controls
mvegetation DF sunlightVOC
Description of VOC emissions
From database tables (EMEP or GEIA), obtained from measurements,by process-based or empirical description.
Dynamic description
ambient temperature
pine branch
30
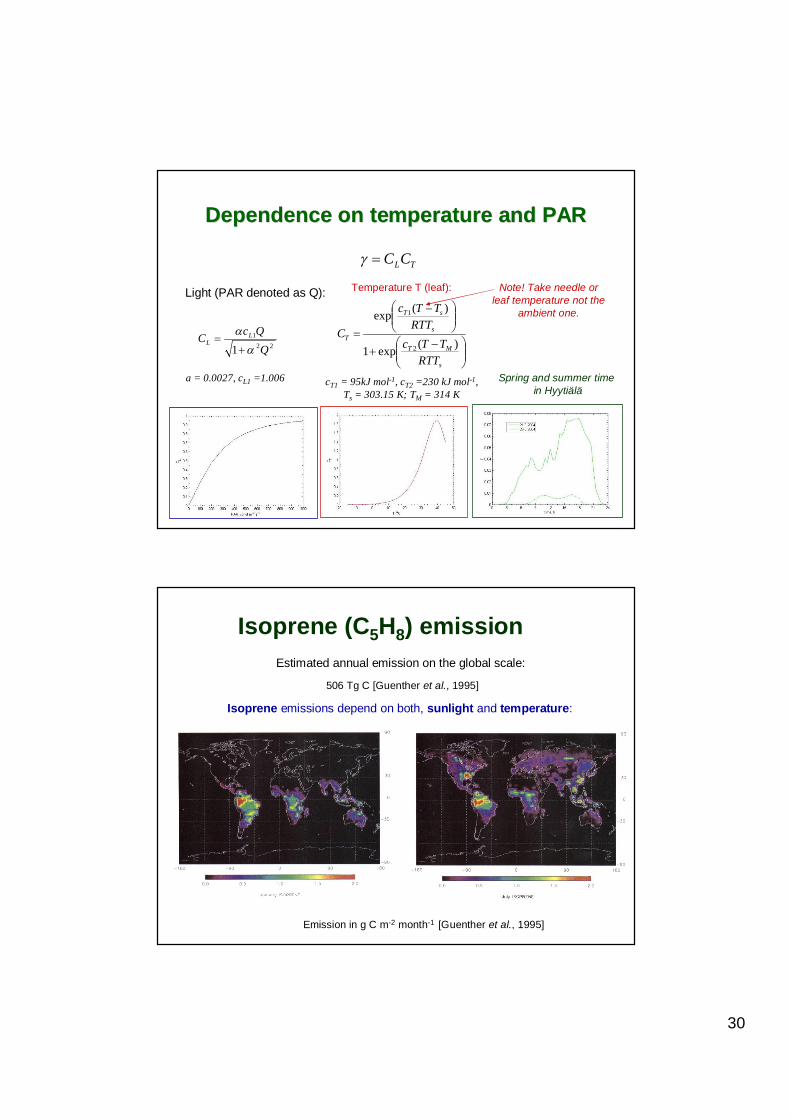
Dependence on temperature and PARDependence on temperature and PAR
Light (PAR denoted as Q):
TLCC
221
1 QQcC L
L
a = 0.0027, cL1 =1.006s
MT
s
sT
T
RTTTTc
RTTTTc
C)(exp1
)(exp
2
1
cT1 = 95kJ mol-1, cT2 =230 kJ mol-1,Ts = 303.15 K; TM = 314 K
Temperature T (leaf):
Spring and summer timein Hyytiälä
Note! Take needle orleaf temperature not the
ambient one.
Isoprene (C5H8) emissionEstimated annual emission on the global scale:
506 Tg C [Guenther et al., 1995]
Isoprene emissions depend on both, sunlight and temperature:
Emission in g C m-2 month-1 [Guenther et al., 1995]

31
Monoterpene (C10H16) emissions
))(exp( sTT
Estimated annual emission on the global scale:
127 Tg C [Guenther et al., 1995]
Monoterpene emissions are believed to depend on temperature only:
= 0.09 K-1, Ts =303.15 K
Hyytiäläglobal
No emissions from the Guenther et al. approach during winter in the Northern hemisphere, but there are.
~1300 Biogenic +AnthropogenicGlobal VOC Emissions
AtmosphericVOC
SecondaryOrganicAerosol
130-270 Dry + WetDeposition
310-720 Oxidationto CO/CO2
510-910 SOA Formation50-200 Oxidation toVOC/CO/CO2
175-375 Dry + WetDeposition
Units Tg C yr-1
Goldstein und Galbally, 2007

32
Chemical reactionsChemical reactionsIsoprene and terpenes react with OH, ozone and NO3
Compound Chem. lifetime ClassIsoprene 2.5 h Isoprene
2.3 h MonoterpeneLimonene 50 min Monoterpene
1-2 min Sesquiterpene
-pinene
-caryophyllene
Consequences:
Isoprene and monoterpenes are transported at least partially to the freetroposphere, in convective cells at the equator up to the tropopause.
Sesquiterpenes are not. They even stay in the vicinity of the emission site.
All contribute to secondary organic aerosol formation.
0 %10 %20 %30 %40 %50 %60 %70 %80 %90 %
100 %
isoprene monoterpenes sesquiterpenes
NO3OHOzone
Atmospheric oxidation by ozone, OH and NO3displayed as fractions