pdf (575 kb) - world bank elibrary
TRANSCRIPT
Policy Research Working Paper 6659
Effects of Early-Life Exposure to Sanitationon Childhood Cognitive Skills
Evidence from India’s Total Sanitation Campaign
Dean Spears Sneha Lamba
The World BankSustainable Development NetworkWater and Sanitation Program UnitOctober 2013
WPS6659P
ublic
Dis
clos
ure
Aut
horiz
edP
ublic
Dis
clos
ure
Aut
horiz
edP
ublic
Dis
clos
ure
Aut
horiz
edP
ublic
Dis
clos
ure
Aut
horiz
ed

Produced by the Research Support Team
Abstract
The Policy Research Working Paper Series disseminates the findings of work in progress to encourage the exchange of ideas about development issues. An objective of the series is to get the findings out quickly, even if the presentations are less than fully polished. The papers carry the names of the authors and should be cited accordingly. The findings, interpretations, and conclusions expressed in this paper are entirely those of the authors. They do not necessarily represent the views of the International Bank for Reconstruction and Development/World Bank and its affiliated organizations, or those of the Executive Directors of the World Bank or the governments they represent.
Policy Research Working Paper 6659
Early life health and net nutrition shape childhood and adult cognitive skills and human capital. In poor countries—and especially in South Asia—widespread open defecation without making use of a toilet or latrine is an important source of childhood disease. This paper studies the effects on childhood cognitive achievement of early life exposure to India’s Total Sanitation Campaign, a large government program that encouraged local governments to build and promote use of inexpensive
This paper is a product of the Water and Sanitation Program Unit, Sustainable Development Network. It is part of a larger effort by the World Bank to provide open access to its research and make a contribution to development policy discussions around the world. Policy Research Working Papers are also posted on the Web at http://econ.worldbank.org. The authors may be contacted at [email protected].
pit latrines. In the early years of the program studied here, the TSC caused six-year-olds exposed to it in their first year of life to be more likely to recognize letters and simple numbers. The results suggest both that open defecation is an important threat to the human capital of the Indian labor force, and that a program feasible to low capacity governments in developing countries could improve average cognitive skills.

Effects of Early-Life Exposure to Sanitationon Childhood Cognitive Skills:
Evidence from India’s Total Sanitation Campaign
Dean Spears and Sneha Lamba∗
October 11, 2013
Keywords: sanitation, cognitive achievement, human capital, early-life health, IndiaJEL codes: I25, I15, O15
∗Spears is corresponding author: [email protected]. Affiliations: Spears: Centre for DevelopmentEconomics, Delhi School of Economics, Delhi, India and r.i.c.e. (www.riceinstitute.org); Lamba: BarcelonaGraduate School of Economics. We deeply appreciate the outstanding research assistance of Aashish Gupta.We appreciate helpful comments from Anne Case, Diane Coffey, Juan Costain, Janet Currie, Aashish Gupta,Jeff Hammer, Payal Hathi, Avinash Kishore, Manisha Shah, and Sangita Vyas. We are grateful to Prathamand the ASER Centre for making the ASER data available for this project; we particularly thank NatashaArora, Ranajit Bhattacharyya, and Sushmita Das. Dean Spears acknowledges with thanks support for theresearch program of which this paper is a part from the World Bank Water and Sanitation Program (WSP)and the Bill and Melinda Gates Foundation. All conclusions and any errors are our own.
1

1 Introduction
Health and disease early in life have lasting consequences for human capital (Currie, 2009).
Evidence is accumulating that poor health and inadequate net nutrition in early life cause
persistent deficits in cognitive development and skills (Case and Paxson, 2008; Barham,
2012). Cunha et al. (2010) advocate investing in very young children’s cognitive skills, based
on evidence of especially high returns on such investment at early ages. Although much of
this literature has studied developed countries, early-life missed opportunities for cognitive
development may be especially important in poor countries, where disease and malnutrition
are widespread.
One of the largest sources of early-life disease worldwide is unsafe disposal of human
feces. Over 600 million people in India – 53 percent of Indian households – defecate in
the open, without using a toilet or latrine (Unicef & WHO 2012). This open defecation is
an important cause of infant and child disease and mortality. Spears (2013) observes that
open defecation can statistically account for much of the variation across poor countries in
average child height. Because the same factors that promote early-life physical development
also encourage children’s cognitive development (Strauss and Thomas, 1998), diseases caused
by poor sanitation have been associated with cognitive achievement. Bleakley (2007) finds
that the eradication of hookworm in the American South in the early 20th century led to
important increases in literacy. Variation in early-life health may be particularly important
for cognitive outcomes in India, where the child height-cognitive achievement gradient is
particularly steep (Spears, 2012b).
From 2001 to 2012, the Indian government promoted the construction and use of low
cost pit latrines in rural areas through a large program called the Total Sanitation Cam-
paign (TSC).1 This paper asks whether, in improving the early-life disease environment faced
1Spears (2012a) estimates that the TSC caused a reduction in infant mortality of about 4 infant deathsper 1,000 live births, on average, and an increase in children’s height for age of about 0.2 standard deviations,on average.
2
by rural Indian children, the TSC also improved the cognitive skills that they subsequently
attain. This paper estimates an effect of the TSC on Indian children’s cognitive skills by
matching test score data on six year olds’ academic achievement with government adminis-
trative data on TSC program intensity early in their life, focusing on the first three years
of the TSC, 2001 to 2003. The contribution of the paper is to show that, during the pe-
riod studied, the TSC caused Indian children to be more likely to recognize letters and to
recognize simple numbers.
This finding is important for three reasons. First, open defecation and poor sanitation are
leading threats to global health, especially in South Asia, where open defecation is common
and high population density contributes to negative externalities of disease. This paper adds
evidence of a loss of cognitive ability to the health consequences of unsafe excreta disposal
that are already documented in the literature. Second, because childhood cognitive skills
predict adult cognitive skills, these results imply a detrimental effect of widespread open
defecation in developing countries on adult human capital and labor productivity (Hanushek
and Woessmann, 2008).
Third, and more optimistically, unlike some other program evaluations in the literature
(cf. Ravallion, 2012), in studying India’s Total Sanitation Campaign, this paper is study-
ing large-scale and imperfect implementation of a program by the Indian government. This
means that the estimated average treatment effects incorporate whatever heterogeneity, ad-
ministrative costs, and losses to corruption that exist in real implementation. Nevertheless,
this analysis finds a positive average effect of sanitation on children’s cognitive achievement.
This suggests that low-cost rural sanitation strategies that can be implemented even by
limited capacity governments can importantly support children’s cognitive development.
1.1 Early life health and cognitive skills
Grantham-McGregor et al. (2007) estimate that, in developing countries, “over 200 million
children under 5 years are not fulfilling their developmental potential” due to malnutri-
3

tion and poor health associated with poverty. Grantham-McGregor et al. (1999) put “poor
sanitation” at the top of a list of “community or ecological” barriers to early childhood de-
velopment in low-income countries. Our paper joins a growing literature documenting effects
of early life health, disease, and nutrition on later life cognitive abilities. Many of these pa-
pers, like ours, use an econometric identification strategy based on differences-in-differences
or other fixed effects implementations of parallel trends assumptions.
For example, Barham (2012) estimates the effect on cognitive outcomes of a maternal
and child health, family planning, and vaccination program in Bangladesh. Using differential
timing in the implementation of the program, she finds that early life exposure to the pro-
gram caused a 0.39 standard deviation in a measure of cognitive functioning when children
were 8 to 14 years old. Vogl (2012) studying the Mexican labor market, finds that childhood
conditions explain adult height and cognitive achievement. In turn, taller Mexican adults
earn more by sorting into jobs requiring more cognitive skill. In particular, although this
approach does not consider sanitation externalities, Vogl notes that children whose house-
holds had toilets or latrines at age 12 grew into taller adults with more education and higher
cognitive test scores.
Perhaps the most complementary recent paper to this one is Shah and Steinberg’s (2013)
analysis of the cognitive effects of exposure to drought in utero. They study the same ASER
data on learning tests administered to Indian children that this paper uses. Using a similar
fixed effects strategy, they find large effects: for example, they find that exposure to drought
in utero is associated with being 2 percentage points less likely to recognize numbers in
childhood.
Epidemiological literature suggests a large effect on early-life health and net nutrition
of exposure to open defecation. One well-known mechanism is diarrhea (Guerrant et al.,
1992). Checkley et al. (2008) pool data from several field sites to show an effect of diarrhea
in children on subsequent physical growth. Another increasingly well understood possible
mechanism is tropical or environmental enteropathy. Evidence is converging that this chronic
4
disorder of the small intestine, due to “faecal bacteria ingested in large quantities by young
children living in conditions of poor sanitation and hygiene” (Humphrey, 2009, 1032), could
cause widespread malabsorption of nutrients among children living in places where open
defecation is common (Petri et al., 2008; Mondal et al., 2011; Korpe and Petri, 2012). In a
recent study in rural Bangladesh, Lin et al. (2013) show that children exposed to less sanitary
conditions show more biologically measured markers of enteropathy and do not grow as tall
(also see Kosek et al., 2013). These epidemiological and medical studies, combined with
a growing literature within economics that documents effects of poor sanitation on early-
life health,2 suggest that diminished human capital and cognitive skills may be a further
consequence of open defecation.
1.2 Outline
This paper continues in eight further sections. Section 2 first offers descriptive statistics
from the India Human Development Survey as motivation: children in this survey who are
exposed to more local open defecation perform worse on cognitive tests similar to those we
study. Section 3 provides introductory context about the Total Sanitation Campaign (TSC),
a government program in India. Section 4 details our difference-in-differences empirical strat-
egy. Section 5 presents our main result, that children exposed to a sanitation environment
that had been improved by the TSC by their first year of life subsequently showed greater
cognitive skills at age six. Section 6 reports evidence that pre-program trends in learning
outcomes and related measures were similar in districts that did and did not receive the
TSC. Section 7 verifies that our findings are consistent with the hypothesized mechanism of
effect, by showing that the sanitation-achievement gradient is steepest for exposure in the
first year of life. Section 8 reports a simulation exercise designed to account for possible un-
2A growing set of studies in economics documents the health importance of sanitation. Cutler and Miller(2005) show an effect of adoption of clean water technology in U.S. cities on mortality rates in the twentiethcentury. Watson (2006) documents an effect of improving sanitation in U.S. Native American populationson infant mortality. Galiani et al. (2005) show that privatizing water supply in Argentina reduced childmortality.
5
derestimation of the effect of the program, due to endogenous effects on mortality, correlated
with cognitive skills. Finally, section 9 concludes.
2 Motivation: Open defecation and cognitive
achievement in the IHDS
Section 1.1 reviewed evidence in the literature that early-life health and net nutrition shape
later human capital and cognitive achievement. Is exposure to open defecation indeed asso-
ciated with less cognitive achievement? As a motivation for this paper’s evaluation of the
impact of the TSC on children’s learning outcomes, this section uses the rural sample of the
2005 India Human Development Survey (IHDS) to document a robust association between
sanitation externalities and children’s test scores.
The IHDS interviewed about 40,000 households in India and gave children aged 8 to 11
learning tests that were modeled closely on the ASER tests that this paper primarily studies.
Section 6.3 uses this data to document that TSC program intensity was not correlated with
trends in test scores in children whose early life developmental period was before the program.
Although the main objective of this paper is to exploit heterogeneity in program timing to
identify an effect of the TSC, there are two reasons the IHDS provides additional useful
motivation. First, the IHDS includes detailed socio-economic data, specifically including
household consumption per capita. Second, the IHDS allows us to match children’s learning
outcomes to the local area open defecation to which they are exposed in their own village.
Additionally, this result has the advantage of being representative of rural Indian households.
Figure 1 documents that children living in villages where most of their neighbors defe-
cate in the open are less likely to be able to read paragraphs than children living in villages
with better sanitation.3 The sample of rural children is split into those who live in local
3The rest of this paper, studying younger children, will use reading words rather than reading paragraphsas a dependent variable.
6
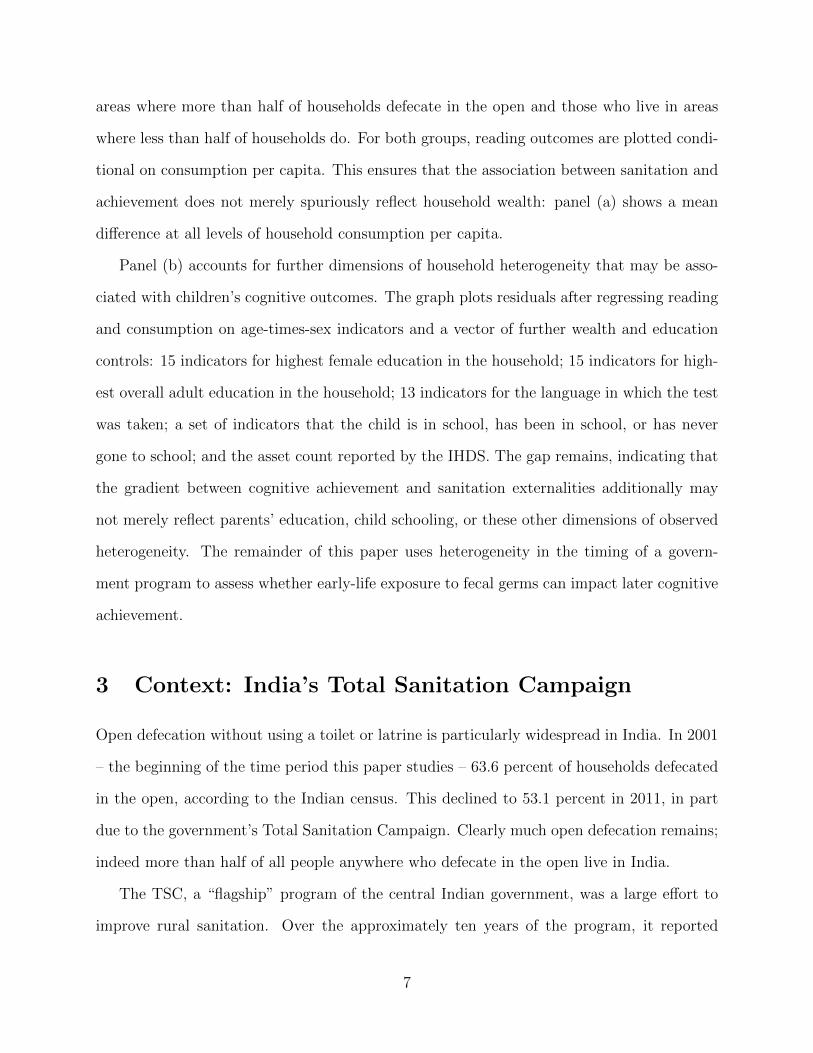
areas where more than half of households defecate in the open and those who live in areas
where less than half of households do. For both groups, reading outcomes are plotted condi-
tional on consumption per capita. This ensures that the association between sanitation and
achievement does not merely spuriously reflect household wealth: panel (a) shows a mean
difference at all levels of household consumption per capita.
Panel (b) accounts for further dimensions of household heterogeneity that may be asso-
ciated with children’s cognitive outcomes. The graph plots residuals after regressing reading
and consumption on age-times-sex indicators and a vector of further wealth and education
controls: 15 indicators for highest female education in the household; 15 indicators for high-
est overall adult education in the household; 13 indicators for the language in which the test
was taken; a set of indicators that the child is in school, has been in school, or has never
gone to school; and the asset count reported by the IHDS. The gap remains, indicating that
the gradient between cognitive achievement and sanitation externalities additionally may
not merely reflect parents’ education, child schooling, or these other dimensions of observed
heterogeneity. The remainder of this paper uses heterogeneity in the timing of a govern-
ment program to assess whether early-life exposure to fecal germs can impact later cognitive
achievement.
3 Context: India’s Total Sanitation Campaign
Open defecation without using a toilet or latrine is particularly widespread in India. In 2001
– the beginning of the time period this paper studies – 63.6 percent of households defecated
in the open, according to the Indian census. This declined to 53.1 percent in 2011, in part
due to the government’s Total Sanitation Campaign. Clearly much open defecation remains;
indeed more than half of all people anywhere who defecate in the open live in India.
The TSC, a “flagship” program of the central Indian government, was a large effort to
improve rural sanitation. Over the approximately ten years of the program, it reported
7

building one household pit latrine per 10 rural people in India and spent U.S.$1.5 billion.
Basic pit latrines, which cost around U.S.$30-$50 to build (but can also be made much more
expensively), are an inexpensive and effective method to safely dispose of human excreta,
if they are used.4 Because this paper’s identification strategy requires comparing early life
exposure to achievement several years later, we only study effects of the first three years
of TSC implementation: 2001, 2002, and 2003. This paper will study heterogeneity in the
timing of the implementation of the TSC at the district-year level, a large enough unit to
account for the externalities of open defecation. Districts are divisions of states; there are
about 600 districts in India, and we study 575 that have a rural population.
It is widely agreed that the TSC did not come close to eliminating rural open defecation
in India, but it did importantly reduce open defecation (Barnard et al., 2013). The TSC
was designed to focus on – and, in some cases, reward – the outcome required for improved
health: latrine use. The TSC focused on creating demand for latrine use, in recognition of
the many subsidized latrines that sit unused in rural India (Alok, 2010). One aspect of the
program was an ex post monetary incentive to local village leaders, awarded when a village
is verified to be open defecation free.5
In part, the TSC did this by making use of social forces, and of social hierarchy existing
within villages: local leaders sometimes acted to motivate the community with social norms.
Pattanayak et al. (2009) conducted a randomized, controlled trial in rural India where they
demonstrated that using community meetings to shame villagers about open defecation could
promote sanitation take-up; this experiment was designed to asses techniques used by the
TSC. For example, Hammer et al. (2007) report that, as the TSC was implemented in an
experimental collaboration of the government and the World Bank in Maharashtra, high-
caste villagers were motivated to build latrines for the entire village with the observation
4Black and Fawcett (2008) argue that earlier sanitation programs in India were unsuccessful because theyfocused on latrine construction, rather than promoting use. Government-built latrines in rural India aresometime repurposed for storage, as a temple, or simply abandoned or taken apart for housing material.
5Using a discontinuity in the size of the incentive as a function of village population, Spears (2012a)demonstrates the role of this incentive in making the TSC effective in the period after it was introduced.
8

that otherwise flies would carry particles of low-caste people’s feces into high-caste people’s
food.
WaterAid (2008) documents “significant policy variations across the states”: “there are
variations across states and districts in terms of approaches and strategies adopted and re-
sults achieved as well” (p. 7). This heterogeneity has been “at times, not really in line with
the stated TSC strategy of the program being ‘community led”’ (p. 9). India is a federal
democracy with powerful central and state bureaucracies and several levels of elected offi-
cials with autonomous power.6 Because the TSC depended not only upon construction but
also upon information and persuasion, its implementation was heterogeneous, in large part
according to the commitment of state, mid-level, and especially local government officials.
Alok (2010), an Indian Administrative Service officer involved in the design and central over-
sight of the TSC, details the importance of these differing levels of political commitment. As
an official once explained to one of the authors, “it’s person driven here in [our state] – if the
person in charge wants it. . .” Of course, a large political economy literature documents that
policy outcomes can be correlated with many social and economic variables; however, in this
case, section 4.3 will show that the within-district trends in TSC implementation that we
exploit for identification are not correlated with within-district trends in a range of observed
socioeconomic and educational variables.
4 Empirical Strategy
Are children who live in districts in which more TSC latrines had been constructed by their
first year of life more likely to recognize letters and numbers when they are six years old,
compared with children born in the same district in different years, or in different districts
6WaterAid (2008) notes that in some states the TSC was implemented by Rural Development depart-ments, while in others it is implemented by a Public Heath Engineering department. “In most places TSC[was] being implemented in a routine administrative fashion without any conscious and visible attempt tostrategise the implementation of the program” (p. 22). States and districts have also varied in whether theyhave collaborated with NGOs to implement the rural information and education components of the program.
9

in the same year? To answer this question, we matched an annual, district-level time series
of TSC latrine construction to individual-level data on children’s cognitive achievement.
Figure 2 depicts the paper’s identification strategy graphically. In order to investigate
an effect of early-life sanitation coverage we must match cognitive achievement data from
childhood (2007, 2008, and 2009) to data on exposure to sanitation in a child’s first year of
life (2001, 2002, and 2003). We will verify that it is from exposure in the first year of life
that the sanitation-achievement gradient is steepest, a result consistent with the mechanism
of an early-life critical period (Doyle et al., 2009).
4.1 Data
Table 1 presents summary statistics from the two data sources used in this paper: administra-
tive records on TSC implementation, and Pratham’s ASER survey on education outcomes,
which includes learning tests.
4.1.1 Independent variable: Total Sanitation Campaign administrative records
As its key independent variable, this paper uses administrative records on the implementa-
tion of the TSC collected at the district level by the government of India. In the period under
study, India had about 600 districts, although some had no rural population. An annual-
frequency, district-level time series of TSC household latrine construction, collected for ad-
ministrative purposes, is publicly available on the program’s website at http://tsc.gov.in/.
These data were reported by block officials to district offices, where they were aggregated
into district-level figures that were input into a computer system maintained by the central
government.
The TSC data report latrine counts, but districts vary considerably in size. The 5th
percentile district in our data had a 2001 rural population of 120,000; the 95th percentile
district had a rural population of 3 million. Therefore, as our measure of program intensity,
we compute TSC latrines per capita: the number of TSC latrines reported as built in the
10

official data by the end of that year, per rural person in the 2001 census.
The years in which the studied children were born – 2001 to 2003 – were the earliest
years in which any TSC latrines were built. By 2003, the program had built about one
latrine, on average, per 20 households in the districts where it was active. As the two last
columns of table 1 show, over half of Indian districts had not received any TSC latrines
at all by the end of 2003. The distribution of TSC intensity was not, of course, randomly
assigned, and therefore it is unsurprising that there are differences between the districts
that received TSC latrines in this early period and those that did not. However, there is
no monotonic difference: on average the districts that received TSC latrines appear richer
(with, for example, better houses), but they also show lower overall educational performance.
These differences indicate that the use of district fixed effects will be a necessary part of the
identification strategy.
We interpret TSC latrines reported built per capita as a noisy measure of overall TSC
intensity. It is imperfect in at least two ways. First, it measures only latrine construction, an
easily quantifiable but secondary part of a program that would succeed only if it encouraged
people to use latrines, including latrines they, in some cases, already owned (Barnard et al.,
2013). Second, bureaucratic agents of distant government principals clearly had incentives
to inflate latrine counts. Our strategy requires only that reported latrine construction be
correlated with true TSC program intensity. Insofar as our independent variable is a noisy
measure of overall TSC activity, our estimates of the effect will be attenuated towards zero. If
administrative capacity or corruption caused administrative records to be inflated upwards
– presumably in the districts where other dimensions of welfare that would be correlated
with test scores are worse – then this would introduce negative omitted variable bias into
our estimates.7 Therefore, we use these administrative records cautiously as an imperfect,
7To see this omitted variable bias from inflation of administrative records, assume that test scores are
shaped by the TSC and other uncorrelated factors, so test = βTSC+ ε. We observe only T̃ SC, which is true
program intensity plus an inflation factor ι: T̃ SC = TSC + ι. Then the numerator of the OLS estimatorof β̂ will be βvar(TSC) + βcov(TSC, ι) + cov(ι, ε). Under the assumptions, which we find reasonable, thatinflation will not be positively correlated with actual performance and service delivery, and that inflation
11
and perhaps conservative, signal of program intensity.
4.1.2 Dependent variables: Pratham’s Annual Status of Education Report
Since 2005, Pratham – a large Indian non-governmental organization – has coordinated the
Annual Status of Education Report (ASER) survey. The ASER is a household survey that
is implemented annually by local organizations in every rural district of India and is based
on a nationally standardized set of educational achievement tests for children. This data
collection effort visits about 15,000 Indian villages each year. In addition to cognitive tests,
the survey includes a very small set of household and child survey questions and a few
questions about the child’s village.
The dependent variables of this paper are children’s outcomes on the educational tests in
the ASER surveys. There is a reading test and a math test. From these tests, we construct
three dependent variables that distinguish ability levels among Indian six year olds: ability
to recognize letters, ability to recognize single-digit numbers, and ability to recognize two-
digit numbers. As table 1 shows, about three-fourths of the sample can recognize letters and
the simple numbers, and about one-third of the sample can recognize larger numbers.
All districts with a rural population are included in ASER’s sample (ASER, 2010).
Within each district, ASER randomly selected 30 villages using probability proportionate
to size sampling based on village sizes in the 2001 census. Within each village, they used
a field-implemented random sampling strategy, stratifying within hamlets if necessary, to
randomly sample 20 households by drawing a map. Although this strategy is representative
(and self-weighting) at the district level (and districts are the level at which our indepen-
dent variable varies), households in smaller districts are more likely to be selected into the
national sample than households in larger districts. We attempt to estimate a causal ef-
fect, not merely describe the population, so weights may be inappropriate, as Solon et al.
will be negatively correlated with other social, political, and economic factors shaping test scores, that is ε,then the omitted variable bias due to inflation of administrative records would be away from the positiveeffect that we find.
12
(2013) have recently documented. However, as a robustness check we replicate our results
by constructing weights according to district population, and there is no important change.8
The ASER test is only given to children living in rural areas. Therefore, we are unable
to estimate the effect of the TSC on urban children. However, as the TSC is an exclusively
rural program, we would not expect an effect in urban areas. More information about this
data, including survey forms and summary reports, is available online at Pratham’s website:
http://www.pratham.org/M-20-3-ASER.aspx.
4.2 Identification: Difference-in-differences
We estimate OLS linear probability models of achieving the three binary educational out-
comes: recognizing letters, recognizing single-digit numbers, and recognizing the larger num-
bers. In order to account for fixed geographic heterogeneity and for an overall time trend,
we use district and year fixed effects. Therefore, separately for each outcome, our regression
is:
achivementidt = βTSCdt + γgirlidt +Xidtθ + λ1litdt+6 + λ2lit2dt+6 + αt + δd + εidt, (1)
where i indexes six-year-old children, d indexes districts, and t indexes years of birth (2001,
2002, and 2003). Achievement is an indicator that takes on 1 if the child demonstrated the
relevant ability on the test and 0 otherwise. TSC is reported TSC latrines per capita built
in a district by the end of the first year of the child’s life, as in figure 2.9 Notice that there
is no i subscript on TSC because it is the same for all children born in the same district in
the same year. δ and α are district and year fixed effects. As recommended by Cameron
8Indeed, for example, our main result estimate of 0.75 in column 1 of panel A of table 3 for the effect onreading slightly increases to 0.90 when weighted, with a standard error clustered at the district level of 0.39.
9In fact, the ASER data report the district in which the child currently lives, not the district where shelived during her first year of life. However, permanent rural-to-rural migration is rare in India, other thanof women without children moving for marriage (Munshi and Rosenzweig, 2009). Demand for latrines isunfortunately sufficiently low that it is unlikely that the TSC would cause anyone to migrate, so migrationis unlikely to be a threat to our identification.
13

et al. (2008), standard errors are clustered at the district level (not the district-year level)
and asymptotic inference is acceptable with many more than 50 clusters.
The covariate girl is an indicator that the child is a girl; girls are subject to a range of
disadvantages and deprivations in rural India. The vector Xidt is a set of controls varying
at the household or village level that are available from the Pratham ASER survey data.
Some are about the child’s household or parents: housing material, household electrification
in general and on the day of the survey, whether the child goes to “tuition” tutoring classes,
whether the child’s father and mother have been to school, and whether the child’s mother
is literate. Others are about the child’s district, described below, or about the child’s vil-
lage: whether it has electricity, a road, a health worker (called an ASHA), a school, and a
government ration shop.
The district controls are litdt+6 and lit2dt+6, or district level literacy in the year of the
ASER test as a quadratic polynomial. District literacy data is available from the 2001 and
2011 censuses. We construct annual frequency literacy observations by linearly interpolating
between these two values (although the quadratic term is intended to account for any non-
linearity, the result is quite similar if interpolation in logs is used instead). We intend these
controls to partially account for unrelated district trends in literacy or education. These two
sets of controls – household/parent and village/district – are added sequentially to demon-
strate that neither has an important effect on the coefficient on the TSC, suggesting that
omitted variable bias is unlikely.
4.3 Balance of covariates
If TSC program intensity were associated with the observable characteristics of children and
their environment, then we might doubt that variation in the TSC had an exogenous effect
on children’s learning. In this section, we assess whether the program predicts the covariates
that are included in the ASER data. This analysis is analogous to verifying that treatment
and control groups are balanced on observables in a randomized experiment. Table 2 reports
14

results from running the main regression with district and year fixed effects in equation (1),
substituting other observables as the the dependent variable. For robustness, in addition to
the measure of TSC intensity, we separately regress the observed properties of children on
a binary indicator that the TSC had started, meaning that any positive number of latrines
had been built in that district by that year.
Table 2 demonstrates that none of the characteristics of children or households that we
observe are predicted by the variation in TSC program intensity that we use to identify an
effect on cognitive achievement. In particular, children exposed to more TSC latrines in
their first year of life are not more likely to attend extra “tuition” classes outside of school,
nor do they have better educated fathers; if anything, they have slightly less well educated
mothers. Note specifically that we find no association of early-life exposure to the TSC with
school enrollment among these six-year-olds. Village-level variables are also uncorrelated
with TSC implementation, indicating that our results do not reflect overall trends in local
government service delivery. Of course, this exercise cannot fully eliminate the possibility
of omitted variable bias from another factor, but it may be unlikely that such an important
factor would be uncorrelated with the variables observed here.
4.4 Evidence for parallel trends
Equation 1 will only estimate the effect of the program if we can make the parallel trends
assumption that test scores would have evolved along similar trends, on average, in districts
where the TSC was and was not implemented, without the program. Although we cannot
observe this counterfactual case directly, we can assess this assumption by looking for differ-
ences in trends established before the program, in additional datasets. In section 6 we do this
in three different ways. First, we show that the distributions of district level improvements
in literacy between the 1991 and 2001 censuses are quite similar among districts that did
and did not receive any reported TSC latrines by 2003. Second, we study within-district
trends in literacy in the India Human Development Survey, and find no difference in trends
15
either for children slightly older than the children we study here nor for women who are
mothers of children of the age group we study. Finally, we return to the ASER-like tests in
the IHDS that were introduced in section 2. Using data on children in the same districts
as our main sample but a few years too old to have been importantly exposed to the TSC,
we find no association between within-district trends in TSC implementation and trends in
these children’s cognitive test scores.
4.5 Mechanism checks
It is more plausible that the association we report reflects a causal effect if it appears to
reflect mechanisms known from the literature to connect disease to cognitive achievement.
In particular, there are critical early-life periods of neural development (Doyle et al., 2009),
so our findings may be more plausible if the sanitation-cognition gradient we find is steepest
for exposure in the first year of life. There is evidence in the literature that sanitation
exposure matters for health very early in life: studying the same sanitation program as we
do and using the same government records as the independent variable, Spears (2012a) finds
an effect on mortality in the first year of life, and finds an effect of exposure in the first year
of life on subsequent height.
Studies that examine heterogeneity in the ages at which children change environments
have demonstrated that very early life is the most sensitive period for later cognitive and
overall development. For example, Beckett et al. (2006) study cognitive outcomes at age 11
of 131 children adopted from Romania in the 1980s to the U.K. They find that children who
moved before they were six months old were able to catch up with a sample of U.K.-born
adoptees, but children who moved after they were six months old did not. In a randomized,
controlled trial, Nelson et al. (2007) study abandoned children in Bucharest who were moved
from institutions to foster care; children moved before they are 18 months old score better
in subsequent years than children moved later, especially compared with children moved
after 30 months. A similar study reflecting the Indian context of this paper is by Proos
16
et al. (1993), who study the physical growth of Indian children adopted into Sweden early
in life. Even within this group of young children, they find that children who were brought
to Sweden at a younger age eventually grew taller.
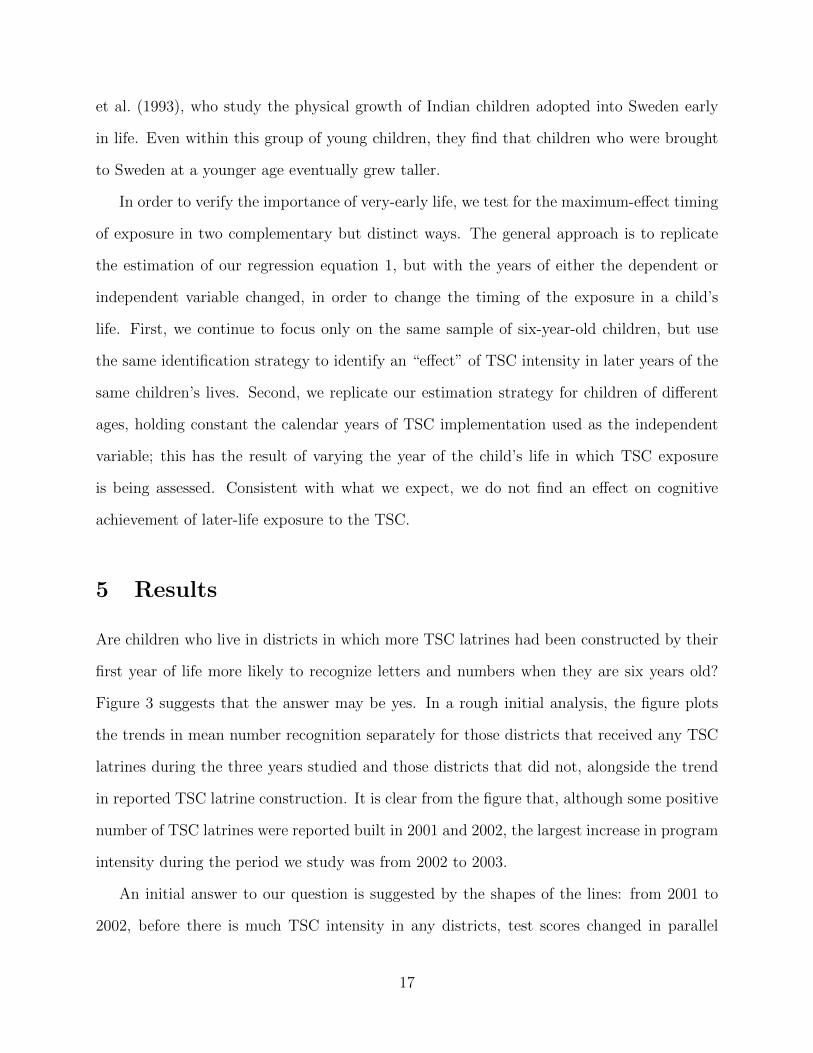
In order to verify the importance of very-early life, we test for the maximum-effect timing
of exposure in two complementary but distinct ways. The general approach is to replicate
the estimation of our regression equation 1, but with the years of either the dependent or
independent variable changed, in order to change the timing of the exposure in a child’s
life. First, we continue to focus only on the same sample of six-year-old children, but use
the same identification strategy to identify an “effect” of TSC intensity in later years of the
same children’s lives. Second, we replicate our estimation strategy for children of different
ages, holding constant the calendar years of TSC implementation used as the independent
variable; this has the result of varying the year of the child’s life in which TSC exposure
is being assessed. Consistent with what we expect, we do not find an effect on cognitive
achievement of later-life exposure to the TSC.
5 Results
Are children who live in districts in which more TSC latrines had been constructed by their
first year of life more likely to recognize letters and numbers when they are six years old?
Figure 3 suggests that the answer may be yes. In a rough initial analysis, the figure plots
the trends in mean number recognition separately for those districts that received any TSC
latrines during the three years studied and those districts that did not, alongside the trend
in reported TSC latrine construction. It is clear from the figure that, although some positive
number of TSC latrines were reported built in 2001 and 2002, the largest increase in program
intensity during the period we study was from 2002 to 2003.
An initial answer to our question is suggested by the shapes of the lines: from 2001 to
2002, before there is much TSC intensity in any districts, test scores changed in parallel
17

across the two sets of districts. In 2003, when TSC intensity increases sharply in some
districts, test scores turn noticeably up in exposed districts, relative to unexposed districts.
The rest of this section adds precision and depth to these observations while confirming the
robustness of the statistical and causal inference.
5.1 TSC intensity associated with greater cognitive achievement
Table 3 presents the main result of the paper: greater TSC coverage in the first year of
life is associated with greater cognitive achievement at age six, as measured by the ASER
tests. The coefficients on TSC intensity must be interpreted with care: because TSC latrines
are scaled per capita, they estimate a linear approximation to the effect of moving from 0
latrines per capita to 1 latrine per capita. The program did not nearly achieve this and
would not aspire to, as members of a household can share a latrine, and some households
already had latrines. Therefore, in the row below the TSC coefficients, the table presents the
average effect of the program: the coefficient estimate multiplied by the across-district mean
of TSC intensity in 2003. Therefore, on average among rural six year olds studied in the
ASER survey, during this period the TSC increased the fraction who could recognize letters
by about three-tenths of a percentage point.10 This is an important but not implausibly
large effect.
The result is very similar across the three tests and levels of cognitive achievement.11
Adding the controls does little in any specification to change the estimated coefficients,
suggesting that the result is not driven by an omitted variable. Given the rural Indian
context, it is reassuring of data quality that girls are consistently found to show worse
performance on the tests than boys. Two districts report especially high levels of TSC
10Another way of arriving at this result is to regress test scores on an indicator for a district being reportedto have received any TSC latrines by that year. As is well-known, this dichotomization will reduce powerand attenuate estimates by introducing measurement error into the independent variable. This is associatedwith a statistically significant coefficient of about 0.015 for reading and math tests, which can be multipliedby about one-fifth of studied children being exposed to the TSC during this period.
11Additionally, estimation using logit rather than linear probability finds a similar result; for example, thet-statistic in the case of recognizing letters is 2.13.
18
intensity in 2003 (0.16 and 0.20 TSC latrines per capita, or about one per household);
including or excluding these outlier districts (the “restricted sample”) has no impact on the
results.
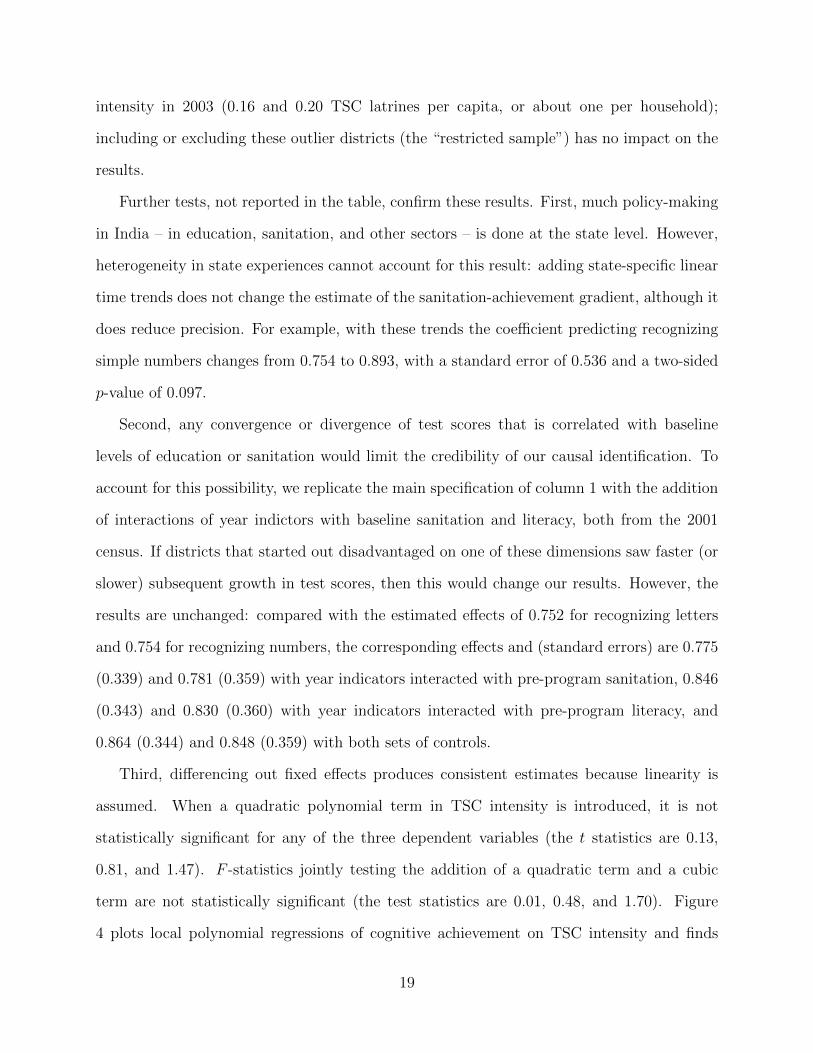
Further tests, not reported in the table, confirm these results. First, much policy-making
in India – in education, sanitation, and other sectors – is done at the state level. However,
heterogeneity in state experiences cannot account for this result: adding state-specific linear
time trends does not change the estimate of the sanitation-achievement gradient, although it
does reduce precision. For example, with these trends the coefficient predicting recognizing
simple numbers changes from 0.754 to 0.893, with a standard error of 0.536 and a two-sided
p-value of 0.097.
Second, any convergence or divergence of test scores that is correlated with baseline
levels of education or sanitation would limit the credibility of our causal identification. To
account for this possibility, we replicate the main specification of column 1 with the addition
of interactions of year indictors with baseline sanitation and literacy, both from the 2001
census. If districts that started out disadvantaged on one of these dimensions saw faster (or
slower) subsequent growth in test scores, then this would change our results. However, the
results are unchanged: compared with the estimated effects of 0.752 for recognizing letters
and 0.754 for recognizing numbers, the corresponding effects and (standard errors) are 0.775
(0.339) and 0.781 (0.359) with year indicators interacted with pre-program sanitation, 0.846
(0.343) and 0.830 (0.360) with year indicators interacted with pre-program literacy, and
0.864 (0.344) and 0.848 (0.359) with both sets of controls.
Third, differencing out fixed effects produces consistent estimates because linearity is
assumed. When a quadratic polynomial term in TSC intensity is introduced, it is not
statistically significant for any of the three dependent variables (the t statistics are 0.13,
0.81, and 1.47). F -statistics jointly testing the addition of a quadratic term and a cubic
term are not statistically significant (the test statistics are 0.01, 0.48, and 1.70). Figure
4 plots local polynomial regressions of cognitive achievement on TSC intensity and finds
19

little visual indication of non-linearity; these plots are designed to roughly correspond to the
fixed effects regressions by using dependent and independent variables that have both been
demeaned twice, first by district then by year.
Fourth, the effect of the TSC on learning outcomes is not different depending on whether
the child’s mother is literate. The effect on reading, for example, is slightly less for children
of literate mothers, but with a t statistic of 0.38 on the interaction. This is consistent with
disease externalities as a mechanism of the effect. Spears (2013) has shown that exposure
to local open defecation stunts the growth of rich and poor children both, and even those
living in households which use a toilet or latrine.
5.2 Assessing effect magnitudes
Are these effect sizes plausible? One method of evaluating the effect size is to compare
this paper’s estimates, causally identified using heterogeneity in program timing, with OLS
cross-sectional estimates from another data source. Section 2 reported a gradient between
sanitation and cognitive achievement using the IHDS. These results are not directly com-
parable because they are for 8 to 11 year olds, not 6 year olds, and therefore focus on the
higher achievement levels of reading paragraphs or better, which is approximately a median
split in that sample. Nevertheless, regressing an indicator for reading paragraphs on local
area (PSU) latrines per capita, and including all of the controls used in figure 1, finds a slope
of 0.82 (clustered standard error = 0.25). Because of measurement error from the larger
geographic area of districts rather than villages, and because of the general tendency of OLS
to overestimate, it is unsurprising that this OLS finding is slightly larger than this paper’s
estimates around 0.75.
Another approach to assessing the plausibility of this result is to compare the magnitude
of the estimate effect with what is implied by other estimates in the literature. Case and
Paxson (2010) found that taller children in the U.S. perform better, on average, on cognitive
tests. Spears (2012b) not only replicated this result among Indian children, but found that
20
the slope in India is more than twice as steep as in the U.S. Approximately, a one standard
deviation increase in height is associated with about a 5 percentage point increase in the
linear probability of being able to read words among Indian eight year olds.
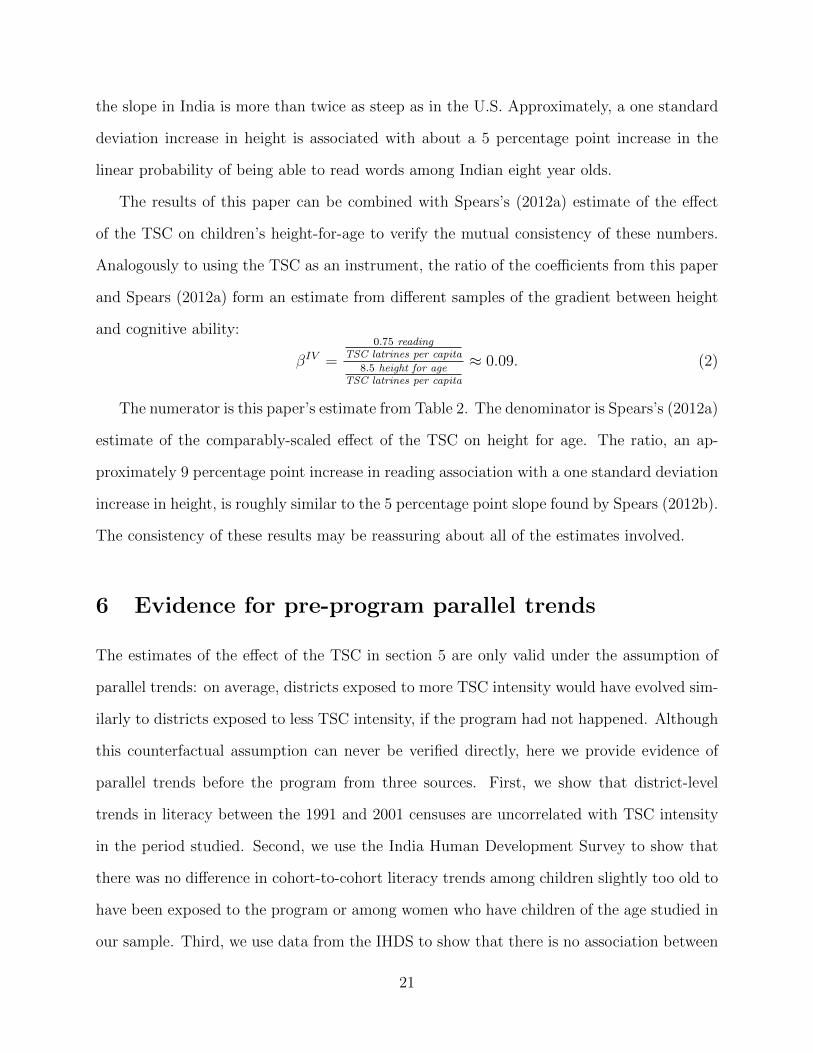
The results of this paper can be combined with Spears’s (2012a) estimate of the effect
of the TSC on children’s height-for-age to verify the mutual consistency of these numbers.
Analogously to using the TSC as an instrument, the ratio of the coefficients from this paper
and Spears (2012a) form an estimate from different samples of the gradient between height
and cognitive ability:
βIV =
0.75 readingTSC latrines per capita
8.5 height for ageTSC latrines per capita
≈ 0.09. (2)
The numerator is this paper’s estimate from Table 2. The denominator is Spears’s (2012a)
estimate of the comparably-scaled effect of the TSC on height for age. The ratio, an ap-
proximately 9 percentage point increase in reading association with a one standard deviation
increase in height, is roughly similar to the 5 percentage point slope found by Spears (2012b).
The consistency of these results may be reassuring about all of the estimates involved.
6 Evidence for pre-program parallel trends
The estimates of the effect of the TSC in section 5 are only valid under the assumption of
parallel trends: on average, districts exposed to more TSC intensity would have evolved sim-
ilarly to districts exposed to less TSC intensity, if the program had not happened. Although
this counterfactual assumption can never be verified directly, here we provide evidence of
parallel trends before the program from three sources. First, we show that district-level
trends in literacy between the 1991 and 2001 censuses are uncorrelated with TSC intensity
in the period studied. Second, we use the India Human Development Survey to show that
there was no difference in cohort-to-cohort literacy trends among children slightly too old to
have been exposed to the program or among women who have children of the age studied in
our sample. Third, we use data from the IHDS to show that there is no association between
21
ASER-like test scores and TSC trends for older children whose critical developmental periods
were before the TSC.
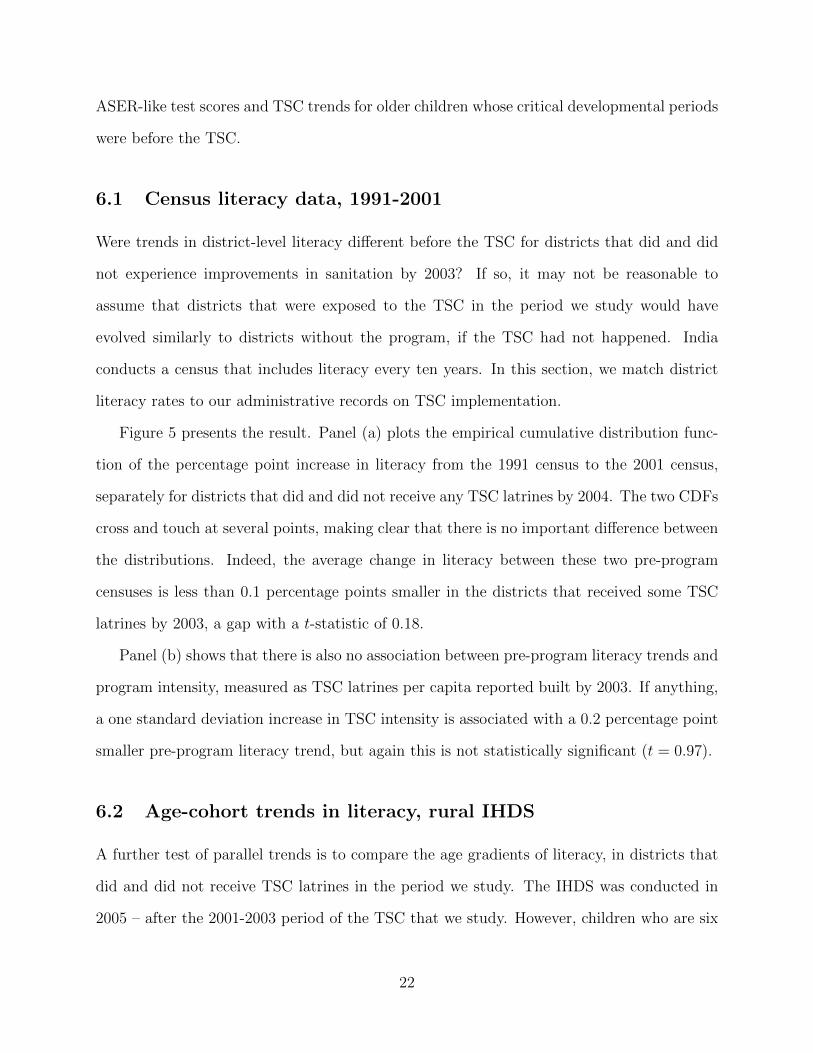
6.1 Census literacy data, 1991-2001
Were trends in district-level literacy different before the TSC for districts that did and did
not experience improvements in sanitation by 2003? If so, it may not be reasonable to
assume that districts that were exposed to the TSC in the period we study would have
evolved similarly to districts without the program, if the TSC had not happened. India
conducts a census that includes literacy every ten years. In this section, we match district
literacy rates to our administrative records on TSC implementation.
Figure 5 presents the result. Panel (a) plots the empirical cumulative distribution func-
tion of the percentage point increase in literacy from the 1991 census to the 2001 census,
separately for districts that did and did not receive any TSC latrines by 2004. The two CDFs
cross and touch at several points, making clear that there is no important difference between
the distributions. Indeed, the average change in literacy between these two pre-program
censuses is less than 0.1 percentage points smaller in the districts that received some TSC
latrines by 2003, a gap with a t-statistic of 0.18.
Panel (b) shows that there is also no association between pre-program literacy trends and
program intensity, measured as TSC latrines per capita reported built by 2003. If anything,
a one standard deviation increase in TSC intensity is associated with a 0.2 percentage point
smaller pre-program literacy trend, but again this is not statistically significant (t = 0.97).
6.2 Age-cohort trends in literacy, rural IHDS
A further test of parallel trends is to compare the age gradients of literacy, in districts that
did and did not receive TSC latrines in the period we study. The IHDS was conducted in
2005 – after the 2001-2003 period of the TSC that we study. However, children who are six
22
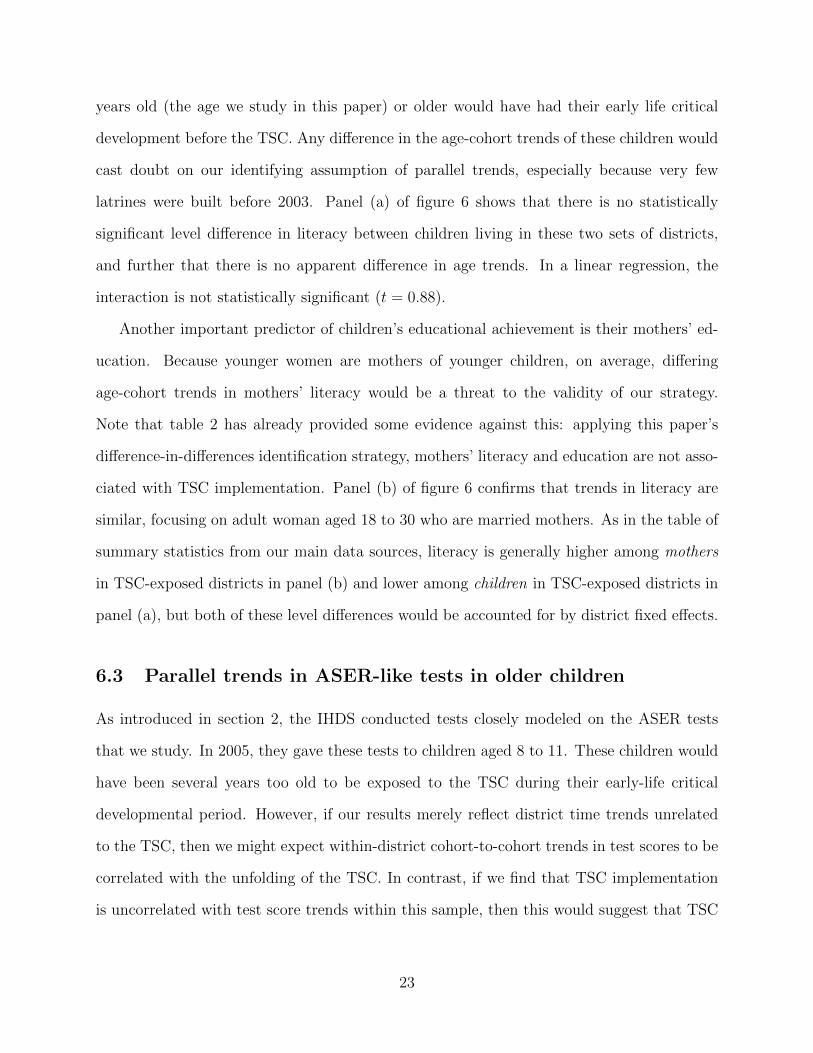
years old (the age we study in this paper) or older would have had their early life critical
development before the TSC. Any difference in the age-cohort trends of these children would
cast doubt on our identifying assumption of parallel trends, especially because very few
latrines were built before 2003. Panel (a) of figure 6 shows that there is no statistically
significant level difference in literacy between children living in these two sets of districts,
and further that there is no apparent difference in age trends. In a linear regression, the
interaction is not statistically significant (t = 0.88).
Another important predictor of children’s educational achievement is their mothers’ ed-
ucation. Because younger women are mothers of younger children, on average, differing
age-cohort trends in mothers’ literacy would be a threat to the validity of our strategy.
Note that table 2 has already provided some evidence against this: applying this paper’s
difference-in-differences identification strategy, mothers’ literacy and education are not asso-
ciated with TSC implementation. Panel (b) of figure 6 confirms that trends in literacy are
similar, focusing on adult woman aged 18 to 30 who are married mothers. As in the table of
summary statistics from our main data sources, literacy is generally higher among mothers
in TSC-exposed districts in panel (b) and lower among children in TSC-exposed districts in
panel (a), but both of these level differences would be accounted for by district fixed effects.
6.3 Parallel trends in ASER-like tests in older children
As introduced in section 2, the IHDS conducted tests closely modeled on the ASER tests
that we study. In 2005, they gave these tests to children aged 8 to 11. These children would
have been several years too old to be exposed to the TSC during their early-life critical
developmental period. However, if our results merely reflect district time trends unrelated
to the TSC, then we might expect within-district cohort-to-cohort trends in test scores to be
correlated with the unfolding of the TSC. In contrast, if we find that TSC implementation
is uncorrelated with test score trends within this sample, then this would suggest that TSC
23

implementation was not correlated with pre-existing trends in cognitive achievement.12
Table 4 reports results of regressions of the form:
test scoreidt = βTSCdt + αt + δd + εidt, (3)
where i indexes individual children, d districts, and t age cohorts. Standard errors are
clustered by district. Note that this data reflects a single cross section, so differences in
birth cohorts are identified by comparing children of different ages, controlling for an age
fixed effect. The IHDS tested children at four years of age (8 to 11), but our paper studies
only TSC implementation in 2001, 2002, and 2003. Therefore, for robustness we use three
different samples, matching birth cohorts to TSC years in three different ways:
• 8-10 sample: children aged 8 in 2005 are assigned to 2003 TSC data; 9 to 2002; 10 to
2001.
• 9-11 sample: children aged 9 in 2005 are assigned to 2003 TSC data; 10 to 2002; 11 to
2001.
• 8-11 sample: children aged 8 in 2005 are assigned to 2004 TSC data (which is not
otherwise used in our analysis); 9 to 2003; 10 to 2002; 11 to 2001.
Additionally, we replicate results with a simple indicator that in a particular district or year,
the TSC had “started,” by which we mean any latrines are reported built.
As table 4 shows, in no specification is the within-district trend in TSC implementation
associated with the within-district cohort-to-cohort trend in test scores, in this sample of
children who are too old to have been exposed to the TSC during early-life development.
Indeed, only 2 of 12 point estimates are positive, and in only 4 of 12 cases does the t-statistic
12Although we are assuming that any effect of the TSC on cognitive scores would reflect early-life exposure(we explore this timing of the effect in detail in section 7) if we are incorrect, then any effect of later childhoodexposure to the TSC would make these estimates more positive, biasing against our purpose in this section,which is to demonstrate a lack of association.
24

exceed 1 in absolute value. This sample is notably smaller than the main sample used in our
analysis. However, the various negative coefficients on the TSC path in this sample suggest
it is unlikely that TSC implementation was positively correlated with pre-program trends in
cognitive achievement.
7 Mechanism check: Effect by timing of exposure
How plausible is it that the difference-in-differences effects we have estimated indeed reflect
causal effects of sanitation on cognitive achievement? One further way to asses this is to
analyze the apparent mechanisms of the effect, to assess whether they match what is known
about the effects of early life health and disease on human capital from the literature. In this
section, we examine the age at which exposure to poor sanitation shapes subsequent cognitive
achievement. Section 4.5 reviewed evidence in the literature that health and net nutrition
in the first year of life are particularly important for subsequent cognitive achievement.
Therefore, we expect exposure to the TSC in a child’s first year to have the steepest gradient
with learning outcomes.
We investigate this in two ways, using the same ASER test score data and TSC admin-
istrative records as in our main analysis. First, we continue to focus only on six-year-old
children, but use the same identification strategy to identify an “effect” of exposure to the
TSC in other years of life. Because we have more years of TSC implementation data than
of ASER test score data, we can displace the TSC exposure in time without reducing the
sample. Second, we replicate our estimation strategy for children of different ages, holding
constant the years of TSC implementation used as the independent variable; this has the
result of varying the year of the child’s life in which TSC exposure is being assessed.
Our finding that the sanitation-learning gradient is steepest for exposure in the first year
of life has two implications, both of which support a causal interpretation of our result.
First, and most importantly, they match the mechanism that we would expect, if the effect
25
were through early life health.13 Second, for a reader who was already convinced that the
first year of life is a critical period for the effects of health an net nutrition on subsequent
development, they make less likely that that our results reflect a spurious correlation of
general sanitation trends with general educational trends: only a properly timed matching
of cause and effect (in this interpretation) finds an effect on learning outcomes.
7.1 Effect in first year: Displacing TSC exposure for six-year-olds
In which year of life does latrine exposure have the steepest gradient with subsequent cogni-
tive achievement at age six? Table 5 reports the results, studying the same six-year-olds as in
our main analysis, but different years of TSC implementation. As expected, TSC exposure
in the first year of life is most associated with subsequent cognitive achievement. Indeed,
only exposure in this year is statistically significantly associated with outcomes. This is
consistent with the mechanism that we hypothesize, and further suggests that our result
may not be a spurious correlation of general trends.14
7.2 Effect in first year: No effect on older children in same data
Another approach to assessing the importance of the year of exposure is to hold constant
the calendar years of TSC implementation that are used as the independent variable and
examine the effect on children of different ages in the years 2007 through 2009.15 Studying
13We note that other effects are possible, although outside the scope of this paper. Miguel and Kremer(2004) find an effect of deworming medicine on school attendance in Kenya, although not on test scores.Adukia (2013) shows that construction of latrines at schools (unlike the household latrines we study) promotescontemporaneous school attendance. (We reiterate from table 1 that we find no effect of early-life exposureto the TSC on school enrollment.) We believe that this paper’s focus on early-life effects is justified byevidence of early-life critical periods, and by evidence that the TSC matters for infant mortality and childheight (Spears, 2012a).
14Although we would not have been surprised to find an effect in the second year of life, as well, we arenot concerned that we did not. First, our timing measures are noisy, as they are as coarse as calendar years,so estimates are attenuated and some children may even be matched with sanitation exposure more similarto their third year of life. Second, it is exactly from first year exposure that Spears (2012a) finds an effecton infant (first year) mortality and subsequent height.
15This is similar to the parallel trends test with the IHDS in section 6.3, but uses the same data sourcesas the main analysis and is more narrowly focused on isolating the early-life period.
26
older children has the consequence of studying the effect of the TSC later in life. In other
words, instead of regressing the test scores of children who were 6 years old in 2009 on TSC
coverage in 2003, this test regresses the test scores of children who were 7 or 8 years old in
2009 on TSC coverage in 2003.
Table 6 presents the results, studying the same years of TSC implementation as our main
analysis, but matched to older cohorts of children. Again, there is no consistent evidence of
an effect on older children to TSC exposure in later years of life than the first.16
If education, test-taking, or ASER test scores were coincidentally improving in the dis-
tricts that received TSC latrines first, then one might also expect test scores to be increasing
in these districts for older children. Seven and eight year olds in the same district would have
been exposed to similar educational trends, but would not have been exposed to very much
TSC sanitation in their first year of life, because the largest increase in TSC implementa-
tion during the period that we study was from 2002 to 2003. Most importantly, this test is
consistent with the hypothesized mechanism of early life critical periods for development.
8 Adjusting for prevented mortality
As a final note, it is possible that these results underestimate the effect of early-life sanita-
tion coverage on cognitive achievement because of mortality selection. Spears (2012a) has
demonstrated an important reduction of infant mortality due to TSC sanitation coverage.
If the marginal children prevented from dying by the TSC were below average in cognitive
achievement then the estimated effect is lower than the true effect.
How large could this underestimate be? We use Spears’s (2012a) main estimate of a
reduction in infant mortality of 85 deaths per 1,000 live births associated with moving from
0 to 1 TSC latrines per capita to compute the expected probability that a child in a district-
year would have died in the absence of the TSC, given his or her exposure to TSC in the
16If anything, there is one statistically-significant negative effect on eight year olds’ reading, which is verylikely a spurious result of having estimated many regressions.
27

first year of life. To put an upper bound on the effect of mortality selection, we make the
extreme assumption that if a child in the sample from a district-year were prevented from
dying because of the TSC, then if any child in that district-year’s sample was unable to
recognize letters, it would have been a child who was unable to recognize letters who died in
the absence of the TSC. We re-estimate the effect of the TSC on reading scores from table 3,
using 100 different samples, each excluding children who are randomly drawn to have died
in the absence of the TSC. On average, we drop about 10 children from the sample in each
repetition due to modeled “death.”
Figure 7 presents the result. Even with the extreme assumption that the TSC always
prevented the death of the sampled child with the lowest test score in a district-year, the
effect on the coefficient estimate is small. The mean simulated effect is 0.805, or 107 percent
of the full-sample estimate without adjusting for endogenous mortality.
9 Conclusion
We find an effect of exposure to India’s Total Sanitation Campaign in the first year of life
on cognitive skills at age six. This is consistent with evidence in the literature of a well-
identified effect of sanitation on early-life health and of the importance of early-life health
for cognitive development.
Of course, exposure to the TSC was not randomly assigned. However, we find a consistently-
sized effect across several measures of cognitive ability, an effect that is not sensitive to various
respecifications. More importantly, several further tests are consistent with a causal effect of
exposure to improved sanitation in the first year of life on subsequent cognitive achievement.
These results are important because of the persistence into adulthood of childhood dif-
ferences in cognitive skills. That is, there is no reason to think that the effects of the TSC
end after a child is six years old. For example, Brooks-Gunn et al. (2006) show that dif-
ferences in cognitive ability at age 3 approximately remain through ages 5 and 8 to age 18.
28

Knudsen et al. (2006) review evidence that early life disadvantage translates into cognitive
heterogeneity of the adult workforce. Vogl (2012) documents this in Mexico.
Our findings suggest that even a low capacity government can implement a relatively
inexpensive program that will cause an important improvement in cognitive skills, given the
context of widespread open defecation. The program we study was imperfect: much open
defecation remains even after the end of a decade of the TSC. However, open defecation may
be so harmful for early-life physical and cognitive development that even an imperfect and
incomplete improvement in sanitation can have important effects.
References
Adukia, Anjali. 2013. “Impacts of School Sanitation on Student Outcomes in India: Evi-
dence from a School-Latrine Construction Initiative.” working paper, Harvard Graduate
School of Education.
Alok, Kumar. 2010. Squatting with Dignity: Lessons from India, New Delhi: Sage.
ASER. 2010. Annual Status of Education Report (Rural) 2009: Pratham.
Barham, Tania. 2012. “Enhancing Cognitive Functioning: Medium-Term Effects of a
Health and Family Planning Program in Matlab.” American Economic Journal: Applied
Economics, 4(1): 245–273.
Barnard, Sharmani, Parimita Routray, Fiona Majorin, Rachel Peletz, Sophie
Boisson, Antara Sinha, and Thomas Clasen. 2013. “Impact of Indian Total Sanita-
tion Campaign on Latrine Coverage and Use: A Cross-Sectional Study in Orissa Three
Years Following Programme Implementation.” PLOS ONE, 8(8): e71438, August.
Beckett, Celia, Barbara Maughan, and et al. 2006. “Do the Effects of Early Severe
Deprivaton on Cognition Persist Into Early Adolescence? Findings from the English and
Romanian Adoptiees Study.” Child Development, 77(3): 696–711.
Black, Maggie and Ben Fawcett. 2008. The Last Taboo: Opening the Door on the Global
29
Sanitation Crisis, London: Earthscan.
Bleakley, Hoyt. 2007. “Disease and Development: Evidence from Hookworm Eradication
in the American South.” Quarterly Journal of Economics, 122(1): 73–117.
Brooks-Gunn, Jeanne, Flavio Cunha, Greg Duncan, James J. Heckman, and
Aaron Sojourner. 2006. “A Reanalysis of the IHDP Program.” workng paper, North-
western University.
Cameron, A. Colin, Jonah B. Gelbach, and Douglas L. Miller. 2008. “Bootstrap-
Based Improvements for Inference with Clustered Errors.” The Review of Economics and
Statistics, 90(3): 414–427.
Case, Anne and Christina Paxson. 2008. “Stature and Status: Height, Ability, and
Labor Market Outcomes.” Journal of Political Economy, 116(3): 499–532.
2010. “Causes and Consequences of Early-Life Health.” Demography, 47: S65–S85.
Checkley, William, Gillian Buckley, Robert H Gilman, Ana MO Assis, Richard L
Guerrant, Saul S Morris, K̊are Mølbak, Palle Valentiner-Branth, Claudio F
Lanata, Robert E Black, and The Childhood Malnutrition and Infection Net-
work. 2008. “Multi-country analysis of the effects of diarrhoea on childhood stunting.”
International Journal of Epidemiology, 37: 816–830.
Cunha, Flavio, James J. Heckman, and Susanne M. Schennach. 2010. “Estimating
the Technology of Cognitive and Noncognitive Skill Formation.” Econometrica, 78(3):
883–931.
Currie, Janet. 2009. “Healthy, Wealthy, and Wise: Socioeconomic Status, Poor Health
in Childhood, and Human Capital Development.” Journal of Economic Literature, 47(1):
87–122.
Cutler, David and Grant Miller. 2005. “The role of public health improvements in health
advances: The twentieth-century United States.” Demography, 42(1): 1–22.
Doyle, Orla, Colm P. Harmon, James J. Heckman, and Richard E. Tremblay.
2009. “Investing in Early Human Development: Timing and Economic Efficiency.” Eco-
30

nomics and Human Biology, 7(1): 1–6.
Galiani, Sebastian, Paul Gertler, and Ernesto Schargrodsky. 2005. “Water for Life:
The Impact of the Privatization of Water Services on Child Mortality.” Journal of Political
Economy, 113(1): 83–120.
Grantham-McGregor, Sally, Yin Bun Cheung, Santiago Cueto, Paul Glewwe,
Linda Richter, and Barbara Strupp.. 2007. “Developmental Potential in the First 5
Years for Children in Developing Countries.” Lancet, 369(9555): 60–70.
Grantham-McGregor, Sally M., Ernesto Pollitt, Theodore D. Wachs, Samuel J.
Meisels, and Keith G. Scott. 1999. “Summary of the scientific evidence on the nature
and determinants of child development and their implications for programmatic interven-
tions with young children.” Food and Nutrtion Bulletin, 20(1).
Guerrant, RL, JB Schorling, JF McAuliffe, and MA de Souza. 1992. “Diarrhea as a
cause and an effect of malnutrition: Diarrhea prevents catch-up growth and malnutrition
increases diarrhea frequency and duration.” American Journal of Tropical Medicine and
Hygiene, 47(1): 28–35.
Hammer, Jeffrey S., Nazmul Chaudhury, Soma Ghosh Moulik, and Atul
Pokharel. 2007. “Hygiene and Health: An evaluation of the Total Sanitation Campaign
in Maharashtra.” working paper, World Bank WSP.
Hanushek, Eric A. and Ludger Woessmann. 2008. “The Role of Cognitive Skills in
Economic Development.” Journal of Economic Literature, 46(3): 607–688.
Humphrey, Jean H. 2009. “Child undernutrition, tropical enteropathy, toilets, and hand-
washing.” The Lancet, 374: 1032 – 35.
Joint Monitoring Programme for Water Supply and Sanitation. 2012. Progress on
Drinking Water and Sanitation: 2012 Update: WHO and UNICEF.
Knudsen, Eric I., James J. Heckman, Judy Cameron, and Jack P. Shonko. 2006.
“Economic, Neurobiological, and Behavioral Perspectives on Building America’s Future
Workforce.” PNAS, 103(27): 10155–10162.
31

Korpe, Poonum S. and William A Petri, Jr.. 2012. “Environmental enteropathy:
critical implications of a poorly understood condition.” Trends in Molecular Medicine,
18(6): 328–336.
Kosek, Margaret, et al., and the MAL-ED network. 2013. “Fecal Markers of Intestinal
Inflammation and Permeability Associated with the Subsequent Acquisition of Linear
Growth Deficits in Infants.” American Journal of Tropical Medicine and Hygiene, 88(2):
390–396.
Lin, Audrie, Benjamin F. Arnold, Sadia Afreen, Rie Goto, Tarique Moham-
mad Nurul Huda, Rashidul Haque, Rubhana Raqib, Leanne Unicomb, Tah-
meed Ahmed, John M. Colford Jr., and Stephen P Luby. 2013. “Household En-
vironmental Conditions Are Associated with Enteropathy and Impaired Growth in Rural
Bangladesh.” American Journal of Tropical Medicine and Hygiene.
Miguel, Edward and Michael Kremer. 2004. “Worms: Identifying Impacts on Education
and Health in the Presence of Treatment Externalities.” Econometrica, 72(1): 159–217.
Mondal, Dinesh, Juliana Minak, Masud Alam, Yue Liu, Jing Dai, Poonum Ko-
rpe, Lei Liu, Rashidul Haque, and William A. Petri, Jr. 2011. “Contribution of
Enteric Infection, Altered Intestinal Barrier Function, and Maternal Malnutrition to Infant
Malnutrition in Bangladesh.” Clinical Infectious Diseases.
Munshi, Kaivan and Mark Rosenzweig. 2009. “Why is Mobility in India so Low? Social
Insurance, Inequality, and Growth.” working paper, Brown University.
Nelson, Charles A., Charles H. Zeanah, Nathan A. Fox, Peter J. Marshal,
Anna T. Smyke, and Donald Guthrie. 2007. “Cognitive recovery in socially deprived
young children: The Bucharest early intervention project.” Science, 318(5858): 1937–1940.
Pattanayak, Subhrendu K, Jui-Chen Yang, Katherine L Dickinson, Christine
Poulos, Sumeet R Patil, Ranjan K Mallick, Jonathan L Blitstein, and Purujit
Praharaj. 2009. “Shame or subsidy revisited: social mobilization for sanitation in Orissa,
India.” Bulletin of the World Health Organization, 87: 580 – 587.
32

Petri, William A., Jr, Mark Miller, Henry J. Binder, Myron M. Levine, Rebecca
Dillingham, and Richard L. Guerrant. 2008. “Enteric infections, diarrhea, and their
impact on function and development.” Journal of Clinical Investigation, 118(4): 1266–
1290.
Proos, L. A., Y. Hofvander, K. Wennqvist, and T. Tuvemo. 1993. “A longitudinal
study on anthropometric and clinical development of Indian children adopted in Sweden.”
Upsala J Med Sci, 97: 93–106.
Ravallion, Martin. 2012. “Fighting Poverty One Experiment at a Time: A Review of
Abhijit Banerjee and Esther Duflo’s Poor Economics: A Radical Rethinking of the Way
to Fight Global Poverty.” Journal of Economic Literature, 50(1): 103–114.
Shah, Manisha and Bryce Millett Steinberg. 2013. “Drought of Opportunities: Con-
temporaneous and Long Term Impacts of Rainfall Shocks on Human Capital.” Working
Paper 19140, NBER.
Solon, Gary, Steven J. Haider, and Jeffrey Wooldridge. 2013. “What are we weighting
for?” working paper 18859, NBER.
Spears, Dean. 2012a. “Effects of Rural Sanitation on Infant Mortality and Human Cap-
ital: Evidence from a Local Governance Incentive in India.” working paper, Princeton
University Research Program in Development Studies.
2012b. “Height and Cognitive Achievement among Indian Children.” Economics
and Human Biology, 10: 210–219.
2013. “The nutritional value of toilets: How much international variation in child
height can sanitation explain?” working paper, Princeton University Research Program
in Development Studies.
Strauss, John and Duncan Thomas. 1998. “Health, Nutrition, and Economic Develop-
ment.” Journal of Economic Literature, 36(2): 766–817.
Vogl, Tom S.. 2012. “Height, Skills, and Labor Market Outcomes in Mexico.” working
paper, Princeton University.
33

WaterAid. 2008. Feeling the Pulse: A Study of the Total Sanitation Campaign in Five
States, Delhi: WaterAid India.
Watson, Tara. 2006. “Public health investments and the infant mortality gap: Evidence
from federal sanitation interventions on U.S. Indian reservations.” Journal of Public Eco-
nomics, 90(8-9): 1537 – 1560.
34

(a) reading, sanitation, and consumption, without controls
.2.4
.6.8
1
read
s pa
ragr
aphs
or
bette
r
5 5.5 6 6.5 7 7.5log of monthly consumption per capita
low local open defecation high local open defecation
(b) reading, sanitation, and consumption, with controls
-.1
-.05
0.0
5.1
read
s pa
ragr
aphs
or
bette
r, r
esid
uals
-1 -.5 0 .5 1log of monthly consumption per capita, residuals
low local open defecation high local open defecation
Figure 1: Local open defecation predicts reading conditional on SES, rural IHDS
Non-parametric local regressions with 95% confidence intervals. “Low” and “high” open defecation are
above and below 50% of households in a child’s survey PSU. Household consumption per capita is per
month, in rupees. The IHDS gave tests modeled after ASER tests to children aged 8-11. 50% of rural
children can read paragraphs or stories; the rest can read letters or words, or cannot read. Residuals are
after controlling for age times sex indicators; 15 indicators for highest female education in the household;
15 indicators for highest overall adult education in the household; 13 indicators for the language in which
the test was taken; a set of indicators that the child is in school, has been in school, or has never gone to
school; and the asset count reported by the IHDS.
35

2002 2003 2004 2005 2006 2007 2008 2009 2001
age 0
age 0
age 0
age 6
age 6
age 6
ASER tests beginning of TSC
Figure 2: Empirical strategy: 2001-2003 TSC intensity matched to six-year-olds’ 2007-2009tests
36
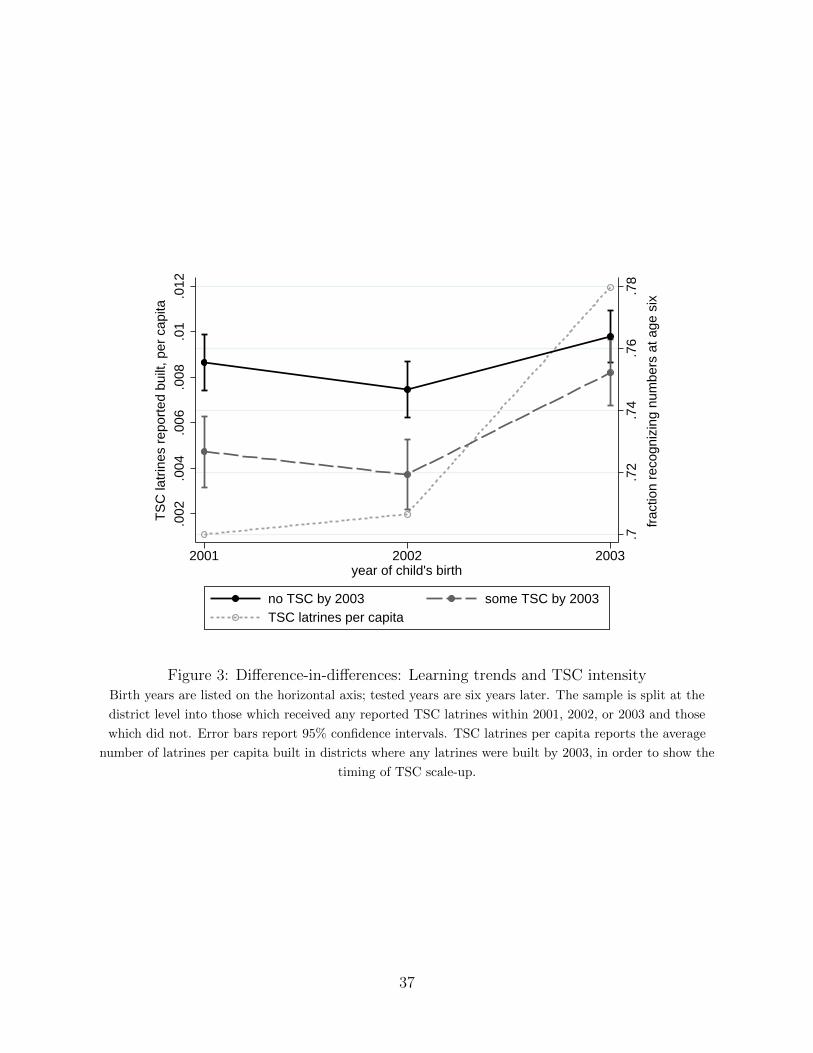
.7.7
2.7
4.7
6.7
8
frac
tion
reco
gniz
ing
num
bers
at a
ge s
ix
.002
.004
.006
.008
.01
.012
TS
C la
trin
es r
epor
ted
built
, per
cap
ita
2001 2002 2003year of child's birth
no TSC by 2003 some TSC by 2003TSC latrines per capita
Figure 3: Difference-in-differences: Learning trends and TSC intensityBirth years are listed on the horizontal axis; tested years are six years later. The sample is split at the
district level into those which received any reported TSC latrines within 2001, 2002, or 2003 and those
which did not. Error bars report 95% confidence intervals. TSC latrines per capita reports the average
number of latrines per capita built in districts where any latrines were built by 2003, in order to show the
timing of TSC scale-up.
37
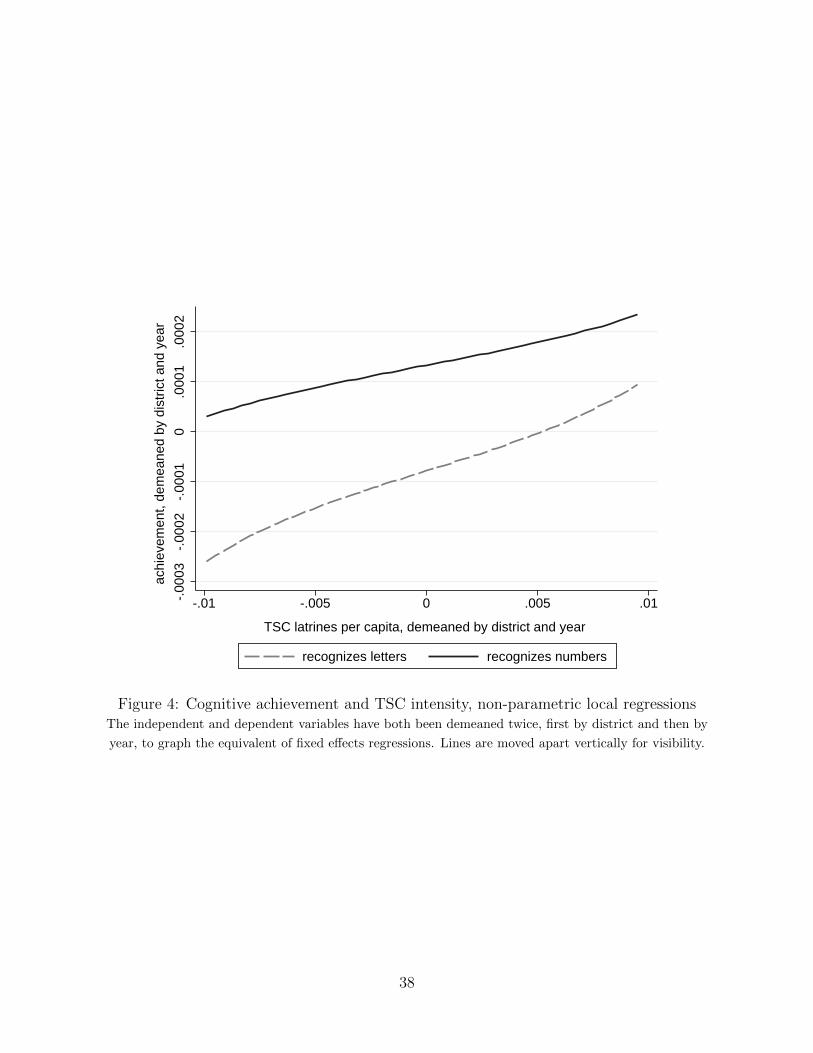
-.00
03-.
0002
-.00
010
.000
1.0
002
achi
evem
ent,
dem
eane
d by
dis
tric
t and
yea
r
-.01 -.005 0 .005 .01
TSC latrines per capita, demeaned by district and year
recognizes letters recognizes numbers
Figure 4: Cognitive achievement and TSC intensity, non-parametric local regressionsThe independent and dependent variables have both been demeaned twice, first by district and then by
year, to graph the equivalent of fixed effects regressions. Lines are moved apart vertically for visibility.
38

(a) CDF of pre-program change in literacy, by whether TSC started by 2003
0
.2
.4
.6
.8
1
empi
rical
cum
ulat
ive
prob
abili
ty fu
nctio
n
0 10 20 30 40change in district literacy (percentage points), 1991 to 2001 census
no TSC by 2003 some TSC by 2003
(b) pre-program change in literacy and TSC latrines per capita in 2003
010
2030
40
chan
ge in
dis
tric
t lite
racy
, 199
1 to
200
1 ce
nsus
0 .02 .04 .06 .08 .1
TSC latrines per capita, 2003
Figure 5: TSC implementation uncorrelated with pre-program literacy trends, 1991 & 2001census
Observations are Indian districts, to match the district-level variation in the TSC. Panel (b) uses the
restricted sample that omits two districts with implausibly high reported TSC intensity, to avoid stretching
the horizontal axis.39
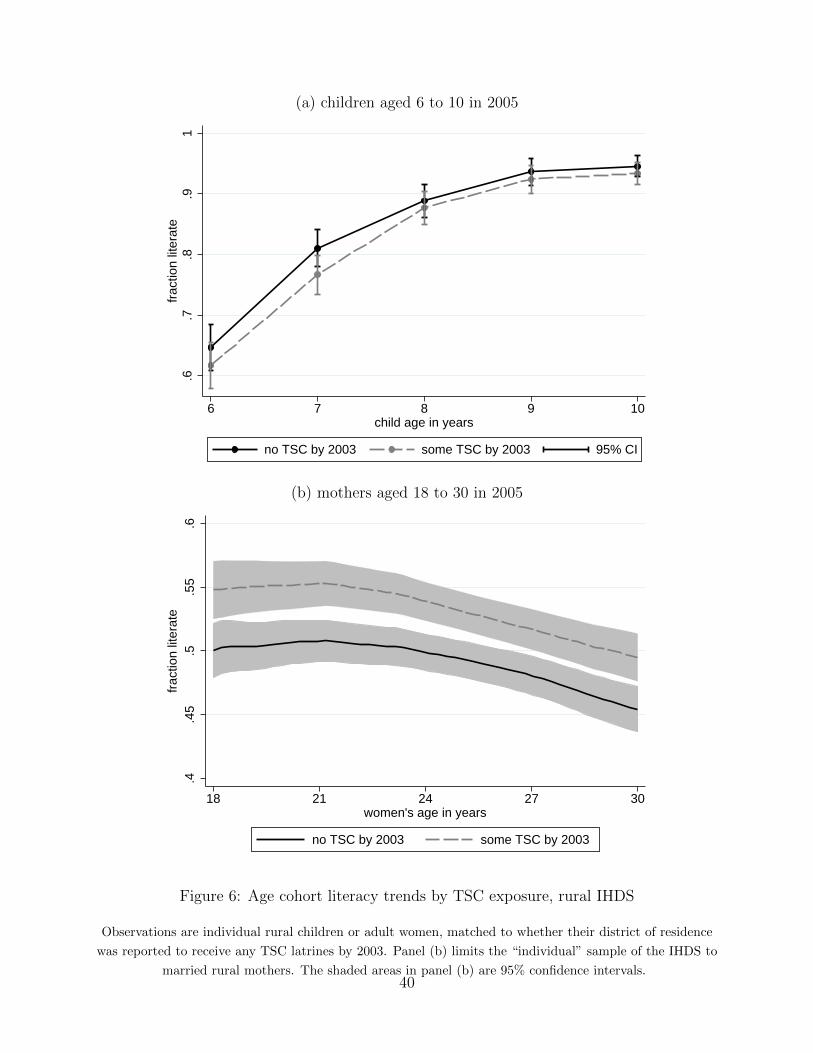
(a) children aged 6 to 10 in 2005
.6.7
.8.9
1fr
actio
n lit
erat
e
6 7 8 9 10child age in years
no TSC by 2003 some TSC by 2003 95% CI
(b) mothers aged 18 to 30 in 2005
.4.4
5.5
.55
.6fr
actio
n lit
erat
e
18 21 24 27 30women's age in years
no TSC by 2003 some TSC by 2003
Figure 6: Age cohort literacy trends by TSC exposure, rural IHDS
Observations are individual rural children or adult women, matched to whether their district of residence
was reported to receive any TSC latrines by 2003. Panel (b) limits the “individual” sample of the IHDS to
married rural mothers. The shaded areas in panel (b) are 95% confidence intervals.40
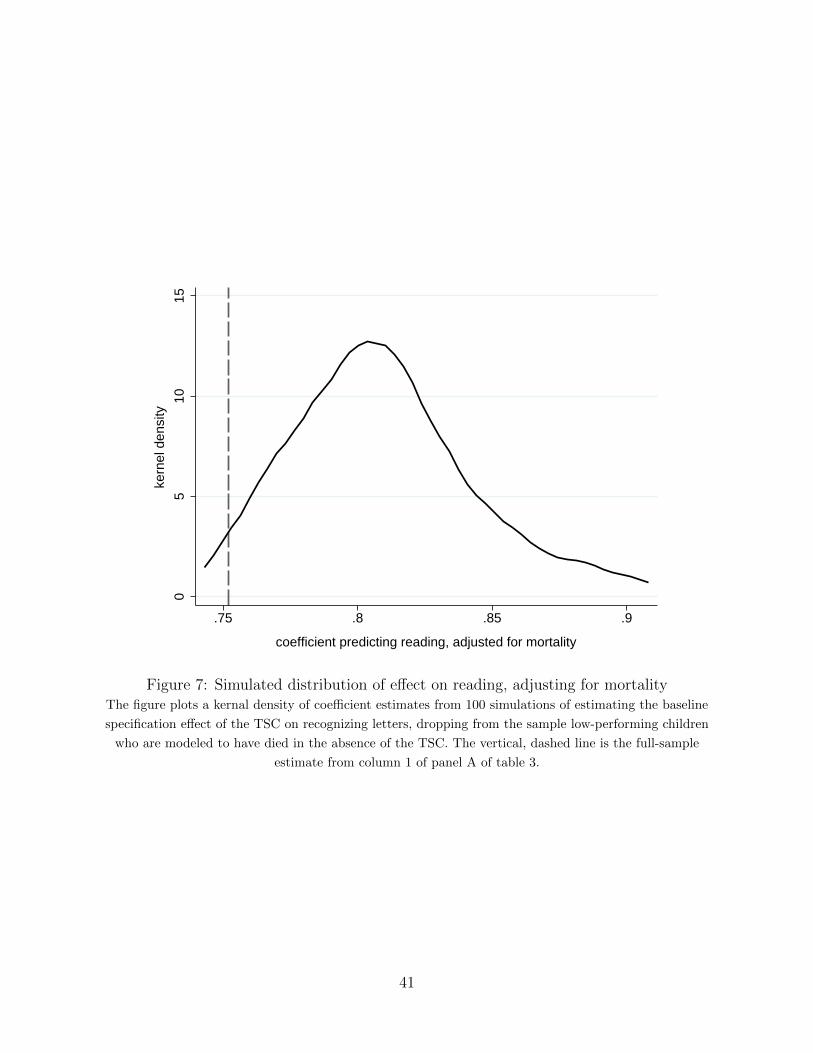
05
1015
kern
el d
ensi
ty
.75 .8 .85 .9
coefficient predicting reading, adjusted for mortality
Figure 7: Simulated distribution of effect on reading, adjusting for mortalityThe figure plots a kernal density of coefficient estimates from 100 simulations of estimating the baseline
specification effect of the TSC on recognizing letters, dropping from the sample low-performing children
who are modeled to have died in the absence of the TSC. The vertical, dashed line is the full-sample
estimate from column 1 of panel A of table 3.
41
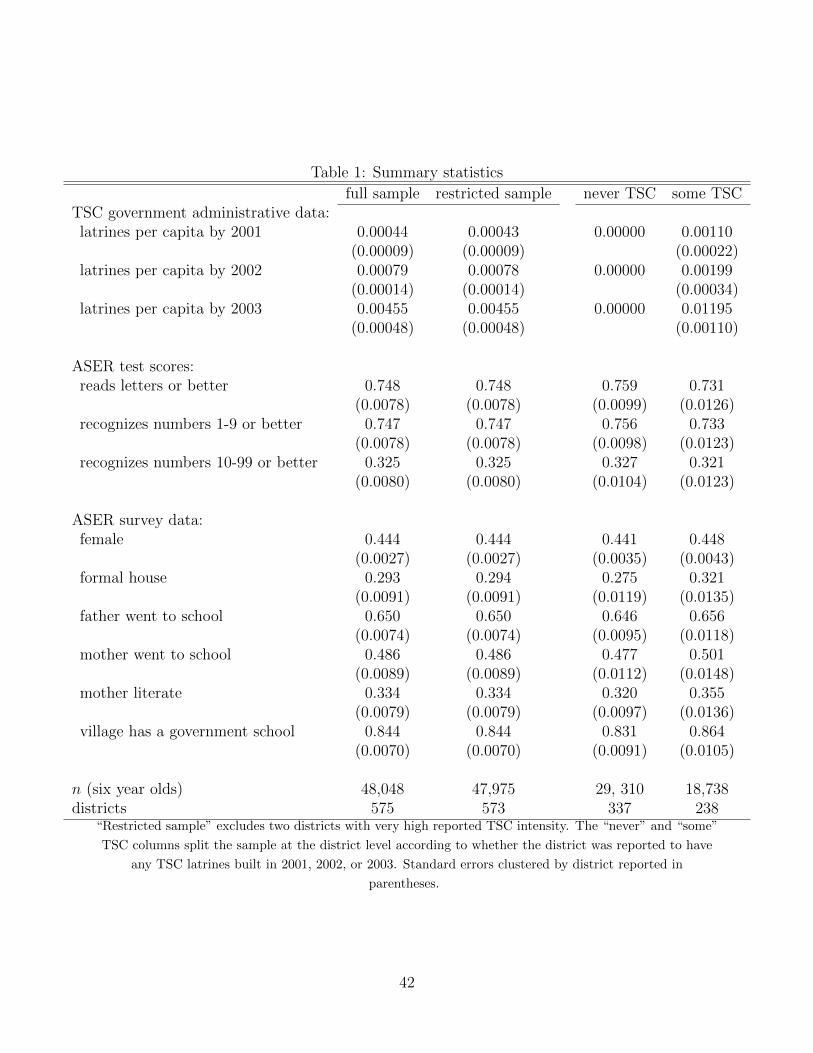
Table 1: Summary statistics
full sample restricted sample never TSC some TSCTSC government administrative data:latrines per capita by 2001 0.00044 0.00043 0.00000 0.00110
(0.00009) (0.00009) (0.00022)latrines per capita by 2002 0.00079 0.00078 0.00000 0.00199
(0.00014) (0.00014) (0.00034)latrines per capita by 2003 0.00455 0.00455 0.00000 0.01195
(0.00048) (0.00048) (0.00110)
ASER test scores:reads letters or better 0.748 0.748 0.759 0.731
(0.0078) (0.0078) (0.0099) (0.0126)recognizes numbers 1-9 or better 0.747 0.747 0.756 0.733
(0.0078) (0.0078) (0.0098) (0.0123)recognizes numbers 10-99 or better 0.325 0.325 0.327 0.321
(0.0080) (0.0080) (0.0104) (0.0123)
ASER survey data:female 0.444 0.444 0.441 0.448
(0.0027) (0.0027) (0.0035) (0.0043)formal house 0.293 0.294 0.275 0.321
(0.0091) (0.0091) (0.0119) (0.0135)father went to school 0.650 0.650 0.646 0.656
(0.0074) (0.0074) (0.0095) (0.0118)mother went to school 0.486 0.486 0.477 0.501
(0.0089) (0.0089) (0.0112) (0.0148)mother literate 0.334 0.334 0.320 0.355
(0.0079) (0.0079) (0.0097) (0.0136)village has a government school 0.844 0.844 0.831 0.864
(0.0070) (0.0070) (0.0091) (0.0105)
n (six year olds) 48,048 47,975 29, 310 18,738districts 575 573 337 238
“Restricted sample” excludes two districts with very high reported TSC intensity. The “never” and “some”
TSC columns split the sample at the district level according to whether the district was reported to have
any TSC latrines built in 2001, 2002, or 2003. Standard errors clustered by district reported in
parentheses.
42

Table 2: Balance of covariates: Observed properties uncorrelated with program timing
independent variable: TSC latrines per capita TSC startedmother literate -0.46 (0.38) -0.01 (0.01)mother went to school -0.30 (0.44) 0.00 (0.01)father went to school 0.12 (0.43) 0.00 (0.01)child receives extra tuition 0.26 (0.46) 0.00 (0.01)school enrollment -0.24 (0.32) 0.00 (0.00)
formal house -0.45 (0.50) -0.01 (0.01)electrification 0.20 (0.50) 0.00 (0.01)village has road 0.18 (0.61) -0.03† (0.02)village has ASHA 0.18 (0.64) -0.01 (0.02)village has school -0.12 (0.61) 0.00 (0.01)village has ration shop -0.25 (0.69) -0.02 (0.02)
Observations are the same sample of six-year-olds used in our main analysis. Each estimate presents a
coefficient and a clustered standard error in parentheses from a separate regression (of the form of equation
1) of the variables listed as the dependent variable, on either latrines per capita or an indicator for a
positive number of latrines per capita (“TSC started”), with district and year fixed effects. Two sided
p-value: † p < 0.1.
43
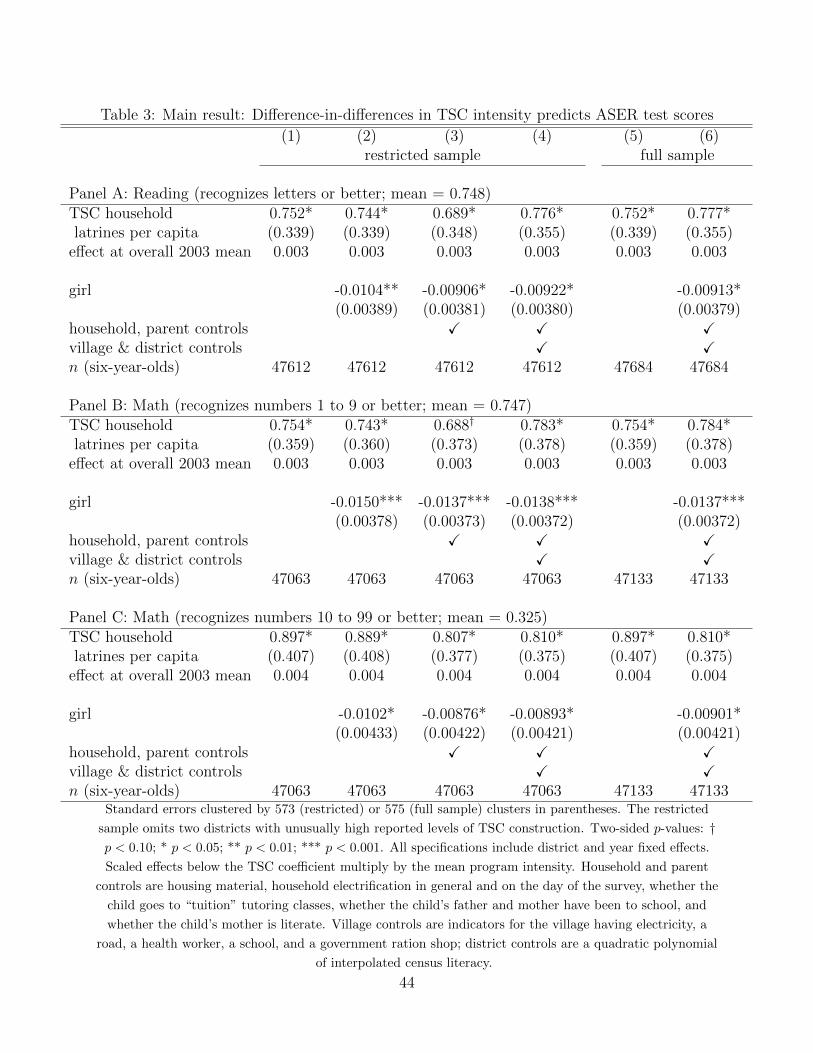
Table 3: Main result: Difference-in-differences in TSC intensity predicts ASER test scores
(1) (2) (3) (4) (5) (6)restricted sample full sample
Panel A: Reading (recognizes letters or better; mean = 0.748)TSC household 0.752* 0.744* 0.689* 0.776* 0.752* 0.777*latrines per capita (0.339) (0.339) (0.348) (0.355) (0.339) (0.355)
effect at overall 2003 mean 0.003 0.003 0.003 0.003 0.003 0.003
girl -0.0104** -0.00906* -0.00922* -0.00913*(0.00389) (0.00381) (0.00380) (0.00379)
household, parent controls X X Xvillage & district controls X Xn (six-year-olds) 47612 47612 47612 47612 47684 47684
Panel B: Math (recognizes numbers 1 to 9 or better; mean = 0.747)TSC household 0.754* 0.743* 0.688† 0.783* 0.754* 0.784*latrines per capita (0.359) (0.360) (0.373) (0.378) (0.359) (0.378)
effect at overall 2003 mean 0.003 0.003 0.003 0.003 0.003 0.003
girl -0.0150*** -0.0137*** -0.0138*** -0.0137***(0.00378) (0.00373) (0.00372) (0.00372)
household, parent controls X X Xvillage & district controls X Xn (six-year-olds) 47063 47063 47063 47063 47133 47133
Panel C: Math (recognizes numbers 10 to 99 or better; mean = 0.325)TSC household 0.897* 0.889* 0.807* 0.810* 0.897* 0.810*latrines per capita (0.407) (0.408) (0.377) (0.375) (0.407) (0.375)
effect at overall 2003 mean 0.004 0.004 0.004 0.004 0.004 0.004
girl -0.0102* -0.00876* -0.00893* -0.00901*(0.00433) (0.00422) (0.00421) (0.00421)
household, parent controls X X Xvillage & district controls X Xn (six-year-olds) 47063 47063 47063 47063 47133 47133
Standard errors clustered by 573 (restricted) or 575 (full sample) clusters in parentheses. The restricted
sample omits two districts with unusually high reported levels of TSC construction. Two-sided p-values: †p < 0.10; * p < 0.05; ** p < 0.01; *** p < 0.001. All specifications include district and year fixed effects.
Scaled effects below the TSC coefficient multiply by the mean program intensity. Household and parent
controls are housing material, household electrification in general and on the day of the survey, whether the
child goes to “tuition” tutoring classes, whether the child’s father and mother have been to school, and
whether the child’s mother is literate. Village controls are indicators for the village having electricity, a
road, a health worker, a school, and a government ration shop; district controls are a quadratic polynomial
of interpolated census literacy.
44
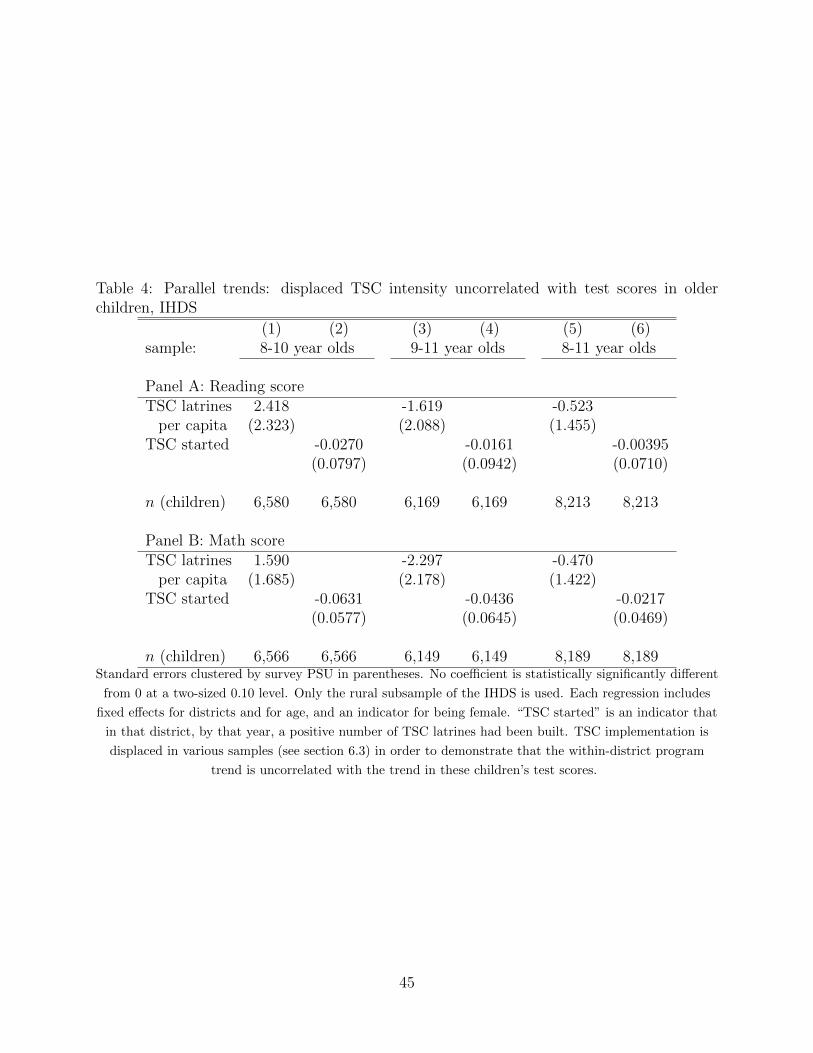
Table 4: Parallel trends: displaced TSC intensity uncorrelated with test scores in olderchildren, IHDS
(1) (2) (3) (4) (5) (6)sample: 8-10 year olds 9-11 year olds 8-11 year olds
Panel A: Reading scoreTSC latrines 2.418 -1.619 -0.523
per capita (2.323) (2.088) (1.455)TSC started -0.0270 -0.0161 -0.00395
(0.0797) (0.0942) (0.0710)
n (children) 6,580 6,580 6,169 6,169 8,213 8,213
Panel B: Math scoreTSC latrines 1.590 -2.297 -0.470
per capita (1.685) (2.178) (1.422)TSC started -0.0631 -0.0436 -0.0217
(0.0577) (0.0645) (0.0469)
n (children) 6,566 6,566 6,149 6,149 8,189 8,189Standard errors clustered by survey PSU in parentheses. No coefficient is statistically significantly different
from 0 at a two-sized 0.10 level. Only the rural subsample of the IHDS is used. Each regression includes
fixed effects for districts and for age, and an indicator for being female. “TSC started” is an indicator that
in that district, by that year, a positive number of TSC latrines had been built. TSC implementation is
displaced in various samples (see section 6.3) in order to demonstrate that the within-district program
trend is uncorrelated with the trend in these children’s test scores.
45

Table 5: Mechanism: Sanitation-cognition gradient is steepest for early-life exposure
(1) (2) (3) (4) (5) (6)effect of TSC latrines in child’s year of life:
1st (age 0) 2nd (age 1) 3rd (age 2) 4th (age 3) 5th (age 4) 6th (age 5)
Panel A: ReadingTSC latrines 0.752* -0.189 0.329 0.0206 -0.203 -0.142per capita (0.339) (0.230) (0.235) (0.176) (0.203) (0.227)n (six-year-olds) 47,684 47,684 47,684 47,684 47,684 47,684
Panel B: Math (numbers 1-9)TSC latrines 0.754* -0.234 -0.00616 -0.236 0.0271 0.0546per capita (0.359) (0.209) (0.255) (0.180) (0.189) (0.219)n (six-year-olds) 47,133 47,133 47,133 47,133 47,133 47,133
Panel C: Math (numbers 10-99)TSC latrines 0.897* 0.161 0.138 0.0888 0.199 0.0975per capita (0.407) (0.246) (0.307) (0.193) (0.234) (0.228)n (six-year-olds) 47,133 47,133 47,133 47,133 47,133 47,133
Standard errors clustered by districts in parentheses. Two-sided p-values: † p < 0.10; * p < 0.05; **
p < 0.01; *** p < 0.001. The sample is the same set of six-year-olds used in table 3. Within a panel, each
column reports a separate regression where the sample and dependent variables are held constant and the
TSC administrative data for the dependent variable is moved one year later. Each regression includes
district and year fixed effects.
46

Table 6: Mechanism: Sanitation-cognition gradient is not found for older children
(1) (2) (3)effect of 2001-2003 latrines on:
6 year olds 7 year olds 8 year olds
Panel A: ReadingTSC latrines 0.752* -0.0460 -0.402*per capita (0.339) (0.298) (0.196)n (children) 47,684 44,056 59,476
Panel B: Math (numbers 1-9)TSC latrines 0.754* -0.356 -0.121per capita (0.359) (0.270) (0.186)n (children) 47,133 43,688 59,019
Panel C: Math (numbers 10-99)TSC latrines 0.897* 0.387 -0.188per capita (0.407) (0.420) (0.406)n (children) 47,133 43,688 59,019
Standard errors clustered by districts in parentheses. Two-sided p-values: † p < 0.10; * p < 0.05. The
ASER survey rounds are the same from 2007 to 2009 as used in table 3, so in column 1, the sample is the
same set of six-year-olds used there. Within a panel, each column reports a separate regression where the
TSC administrative data from 2001 to 2003 is held constant, while the age cohorts from whose 2007 to
2009 ASER test score is taken (for the dependent variable) change; thus column 1 uses the same sample as
tables 3 and 5, but columns 2 and 3 do not. Each regression includes district and year fixed effects.
47