imf elibrary
TRANSCRIPT

FISCAL MONITOR
INTERNATIONAL MONETARY FUND
2021APR
A Fair Shot
©International Monetary Fund. Not for Redistribution

©2021 International Monetary Fund
Cover: IMF CSF Creative Solutions DivisionComposition: AGS, An RR Donnelley Company
Cataloging-in-Publication DataIMF Library
Names: International Monetary Fund.Title: Fiscal monitor.Other titles: World economic and financial surveys, 0258-7440Description: Washington, DC : International Monetary Fund, 2009- | Semiannual | Some
issues also have thematic titles.Subjects: LCSH: Finance, Public—Periodicals. | Finance, Public—Forecasting—Periodicals. |
Fiscal policy—Periodicals. | Fiscal policy—Forecasting—Periodicals.Classification: LCC HJ101.F57
ISBN: 978-1-51357-155-3 (paper) 978-1-51357-162-1 (ePub) 978-1-51357-160-7 (PDF)
Disclaimer: The Fiscal Monitor is a survey by the IMF staff published twice a year, in the spring and fall. The report analyzes the latest public finance developments, updates medium-term fiscal projections, and assesses policies to put public finances on a sustain-able footing. The report was prepared by IMF staff and has benefited from comments and suggestions from Executive Directors following their discussion of the report on March 25, 2021. The views expressed in this publication are those of the IMF staff and do not necessarily represent the views of the IMF’s Executive Directors or their national authorities.
Recommended citation: International Monetary Fund (IMF). 2021. Fiscal Monitor: A Fair Shot. Washington, April.
Publication orders may be placed online, by fax, or through the mail:International Monetary Fund, Publication Services
PO Box 92780, Washington, DC 20090, USATelephone: (202) 623-7430 Fax: (202) 623-7201
E-mail: [email protected]
©International Monetary Fund. Not for Redistribution

International Monetary Fund | April 2021 iii
<C T>
CONTENTS
Assumptions and Conventions vi
Further Information vii
Preface viii
Foreword ix
Executive Summary xi
Chapter 1. Tailoring Fiscal Responses 1
Introduction 1Recent Fiscal Developments and Outlook 2Effectiveness of Discretionary Fiscal Policy Responses to COVID-19 9Near-Term Policies: Win the Vaccination Race and Target Support More Effectively 13Broader Policy Priorities: Anchor Fiscal Support, Transition to a
New Post–COVID-19 Economy, and Address Crisis Legacies 15Box 1.1. Keeping the Receipts: One Year On, Some Innovative Practices 19Box 1.2. Considerations When Supporting Firms 21Box 1.3. The Flexibility of Fiscal Rules during the COVID-19 Pandemic 23Box 1.4. Toward an Agreement on Reforming International Taxes 24References 25
Chapter 2. A Fair Shot 27
Introduction 27Trends in Inequality before the COVID-19 Pandemic 27The Pandemic and Inequality 29Policies to Tackle Rising Inequality: Predistribution and Redistribution 32Support for a Fair Shot 39Box 2.1. Persistent Consequences of Wealth Inequality for the Next Generation’s Income:
The Case of Norway 42Box 2.2. Public Preferences for Progressive Taxation in the Post –COVID-19 World 43 References 44
Economy Abbreviations 49
Glossary 51
Methodological and Statistical Appendix 53
Data and Conventions 53Fiscal Policy Assumptions 56Definition and Coverage of Fiscal Data 60
Table A. Economy Groupings 60Table B. Advanced Economies: Definition and Coverage of Fiscal Monitor Data 64
©International Monetary Fund. Not for Redistribution

F I S C A L M O N I TO R: A FA I R S H OT
iv International Monetary Fund | April 2021
Table C. Emerging Market and Middle-Income Economies: Definition and Coverage of Fiscal Monitor Data 65
Table D. Low-Income Developing Countries: Definition and Coverage of Fiscal Monitor Data 66
List of TablesAdvanced Economies (A1–A8) 67Emerging Market and Middle-Income Economies (A9–A16) 75Low-Income Developing Countries (A17–A22) 83Structural Fiscal Indicators (A23–A25) 89
Selected Topics 93
IMF Executive Board Discussion of the Outlook, April 2021 103
Figures
Figure 1.1. Interest Expense and Government Debt, 2007–21 2Figure 1.2. The Effect of the COVID-19 Pandemic on the Forecast of General Government
Gross Debt and Fiscal Balances, 2019–26 2Figure 1.3. Public Debt and Bond Yields in Advanced Economies, 1880–2020 5Figure 1.4. Gross Financing Needs, 2021 5Figure 1.5. Accounting for Changes in Government Debt, 2019–21 5Figure 1.6. Recent Fiscal Developments and Outlook across Income Groups, 2019–26 6Figure 1.7. Government Fiscal Support in Response to COVID-19, 2020–21 10Figure 1.8. Forecast Revisions in Private Consumption and Demand, 2020 11Figure 1.9. Unemployment Forecast Revisions and Fiscal Measures, 2020 11Figure 1.10. Effects of the Pandemic on Employment, 2019:Q1–2020:Q3 12Figure 1.11. Take-Up of Job Retention Schemes for Selected Advanced Economies 12Figure 1.12. Adequacy and Coverage of Social Safety Nets 13Figure 1.13. Coverage of COVID-19 Social Assistance 13Figure 1.14. Nonfinancial Firms’ Access to Public Support, by Size and Type of Shock 14Figure 1.15. Balancing Greater Short-Term Support and Medium-Term Fiscal Discipline 16Figure 1.2.1. Policy Support to Nonfinancial Firms 22Figure 1.3.1. Policy Relaxation Relative to Fiscal Rule Limits, 2020 23Figure 2.1. Change in Inequality (Gini Index), 1990–2019 28Figure 2.2. Income and Wealth Shares of the Top 10 Percent of the Population 29Figure 2.3. Intergenerational Persistence in Education 29Figure 2.4. Relationships between Various Aspects of Inequality 30Figure 2.5. Education Losses from School Closures and Remote Learning Efficiency in 2020 32Figure 2.6. Policies: Conceptual Framework 33Figure 2.7. Spending on Education and Intergenerational Mobility 33Figure 2.8. Differences in Enrollment Rates between the Richest and Poorest Households 34Figure 2.9. Effect of Public Education Spending on School Enrollment Rates 34Figure 2.10. Effectiveness of Social Assistance Spending 35Figure 2.11. Effectiveness and Allocation of Social Assistance Programs 36Figure 2.12. OECD: Top Income Tax Rates 37Figure 2.13. Additional Spending Requirement for Meeting SDGs by 2030 38Figure 2.14. Sectoral Spending Inefficiencies 39Figure 2.15. Tax Reform Options to Raise Additional Revenue 40
©International Monetary Fund. Not for Redistribution
Co n t e n ts
International Monetary Fund | April 2021 v
Figure 2.16. Survey Results on Preferences for Tax-Financed Spending 40Figure 2.17. People’s Preference for Progressive Taxation 40Figure 2.1.1. Norway: Percentile in the Income Distribution of Children versus Parental Wealth 42
Tables
Table 1.1. General Government Fiscal Overall Balance, 2016–26 3Table 1.2. General Government Debt, 2016–26 4
Online Annexes
Online Annex 1.1. Model Simulations of Fiscal Support MeasuresOnline Annex 2.1. Inequality, Social Mobility, and Educational OutcomesOnline Annex 2.2. Inequalities in COVID-19 Health OutcomesOnline Annex 2.3. Inequalities in COVID-19 Education OutcomesOnline Annex 2.4. The Effect of Public Education Spending on School Attendance and Efficiency of
Public Education Spending Online Annex 2.5. Estimating the Potential Mechanical Impact of a Recurrent Wealth Tax on Inequality
and Tax RevenueOnline Annex 2.6. Public Perceptions and Distributive Policies
Online Database
Fiscal Monitor Database of Country Fiscal Measures in Response to the COVID-19 Pandemic
©International Monetary Fund. Not for Redistribution

F I S C A L M O N I TO R: A FA I R S H OT
vi International Monetary Fund | April 2021
The following symbols have been used throughout this publication:
. . . to indicate that data are not available
— to indicate that the figure is zero or less than half the final digit shown, or that the item does not exist
– between years or months (for example, 2008–09 or January–June) to indicate the years or months covered, including the beginning and ending years or months
/ between years (for example, 2008/09) to indicate a fiscal or financial year
“Billion” means a thousand million; “trillion” means a thousand billion.
“Basis points” refers to hundredths of 1 percentage point (for example, 25 basis points are equivalent to ¼ of 1 percentage point).
“n.a.” means “not applicable.”
Minor discrepancies between sums of constituent figures and totals are due to rounding.
As used in this publication, the term “country” does not in all cases refer to a territorial entity that is a state as understood by international law and practice. As used here, the term also covers some territorial entities that are not states but for which statistical data are maintained on a separate and independent basis.
ASSUMPTIONS AND CONVENTIONS
©International Monetary Fund. Not for Redistribution

International Monetary Fund | April 2021 vii
<C T>
Corrections and Revisions The data and analysis appearing in the Fiscal Monitor are compiled by IMF staff at the time of publication.
Every effort is made to ensure their timeliness, accuracy, and completeness. When errors are discovered, corrections and revisions are incorporated into the digital editions available from the IMF website and on the IMF eLibrary. All substantive changes are listed in the Table of Contents of the online PDF of the report.
Print and Digital Editions Print
Print copies of this Fiscal Monitor can be ordered from the IMF Bookstore at imfbk.st/29672.
Digital
Multiple digital editions of the Fiscal Monitor, including ePub, enhanced PDF, Mobi, and HTML, are available on the IMF eLibrary at www.elibrary.imf.org/APR21FM.
Download a free PDF of the report and data sets for each of the charts therein from the IMF website at www.imf.org/publications/fm, or scan the QR code below to access the Fiscal Monitor web page directly:
Copyright and ReuseInformation on the terms and conditions for reusing the contents of this publication are at www.imf.org/
external/terms.htm.
FURTHER INFORMATION
©International Monetary Fund. Not for Redistribution

F I S C A L M O N I TO R: A FA I R S H OT
viii International Monetary Fund | April 2021
The projections included in this issue of the Fiscal Monitor are drawn from the same database used for the April 2021 World Economic Outlook and Global Financial Stability Report (and are referred to as “IMF staff projections”). Fiscal projections refer to the general government, unless otherwise indicated. Short-term projections are based on officially announced budgets, adjusted for differences between the national authorities and the IMF staff regarding macroeconomic assumptions. The fiscal projections incorporate policy measures that are judged by the IMF staff as likely to be implemented. For countries supported by an IMF arrangement, the projections are those under the arrangement. In cases in which the IMF staff has insufficient information to assess the authorities’ budget intentions and prospects for policy implementation, an unchanged cyclically adjusted primary balance is assumed, unless indicated otherwise. Details on the composition of the groups, as well as country-specific assumptions, can be found in the Methodological and Statistical Appendix.
The Fiscal Monitor is prepared by the IMF Fiscal Affairs Department under the general guidance of Vitor Gaspar, Director of the Department. The project was directed by Paolo Mauro, Deputy Director; and Paulo Medas, Division Chief. The main authors of this issue are W. Raphael Lam and Mehdi Raissi (team leaders), Hamid R. Davoodi, William Gbohoui, Xuehui Han, Gee Hee Hong, Roberto Perrelli, Yuan Xiang, and Susan Yang for Chapter 1, which also benefited from contributions by Racheeda Boukezia, Teresa Curristine, Ruud de Mooij, Paul Elger, Alexandra Fotiou, Andresa Lagerborg, Sébastien Leduc, John Ralyea, Sandra Lizarazo Ruiz, Fazeer Sheik Rahim, Lorena Rivero del Paso, Xavier Rame, and Claude Wendling; and David Amaglobeli (lead), Jean-Marc Fournier (deputy), Fernanda Brollo, Chuling Chen, Maria Coelho, Andresa Lagerborg, Yuan Xiao with contributions from Kristoffer Berg, Ruud de Mooij, Shafik Hebous, Alex Klemm, Sébastien Leduc, Paolo Mauro, and Adil Mohommad for Chapter 2. The authors are also grateful to David Coady, Assistant Director, for his help-ful comments and suggestions. Excellent research contributions were provided by Yuan Xiang and Andrew Womer. The Methodological and Statistical Appendix was prepared by Yuan Xiang. Joni Mayfield and Meron Haile pro-vided excellent coordination and editorial support. Rumit Pancholi from the Communications Department led the editorial team and managed the report’s production, with editorial assistance from Christine Ebrahimzadeh, Susan Graham, Nancy Morrison, Devlan O’Connor, and Vector Talent Resources.
Inputs, comments, and suggestions were received from other departments in the IMF, including area departments—namely, the African Department, Asia and Pacific Department, European Department, Middle East and Central Asia Department, and Western Hemisphere Department—as well as the Communications Department, Institute for Capacity Development, Finance Department, Legal Department, Monetary and Capital Markets Department, Research Department, Secretary’s Department, Statistics Department, and Strategy, Policy, and Review Department. The chapter 2 of the Fiscal Monitor also benefited from comments by Barry Eichengreen (University of California, Berkeley), Wojciech Kopczuk (Columbia University), Camille Landais (London School of Economics), César Martinelli (George Mason University), Susan W. Parker (University of Maryland), Juan Gabriel Rodríguez (Complutense University), Carolina Sánchez-Páramo (World Bank), and Roy Van der Weide (World Bank). Both projections and policy considerations are those of the IMF staff and should not be attributed to Executive Directors or to their national authorities.
PREFACE
©International Monetary Fund. Not for Redistribution
International Monetary Fund | April 2021 ix
<C T>
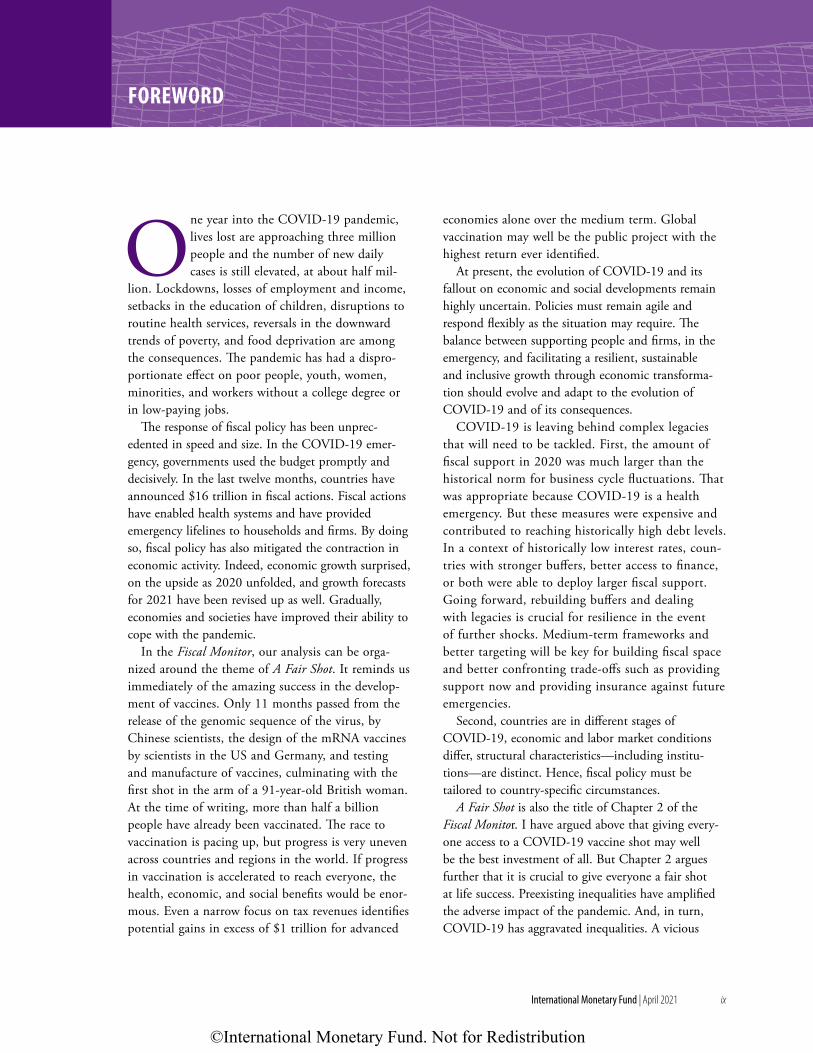
One year into the COVID-19 pandemic, lives lost are approaching three million people and the number of new daily cases is still elevated, at about half mil-
lion. Lockdowns, losses of employment and income, setbacks in the education of children, disruptions to routine health services, reversals in the downward trends of poverty, and food deprivation are among the consequences. The pandemic has had a dispro-portionate effect on poor people, youth, women, minorities, and workers without a college degree or in low-paying jobs.
The response of fiscal policy has been unprec-edented in speed and size. In the COVID-19 emer-gency, governments used the budget promptly and decisively. In the last twelve months, countries have announced $16 trillion in fiscal actions. Fiscal actions have enabled health systems and have provided emergency lifelines to households and firms. By doing so, fiscal policy has also mitigated the contraction in economic activity. Indeed, economic growth surprised, on the upside as 2020 unfolded, and growth forecasts for 2021 have been revised up as well. Gradually, economies and societies have improved their ability to cope with the pandemic.
In the Fiscal Monitor, our analysis can be orga-nized around the theme of A Fair Shot. It reminds us immediately of the amazing success in the develop-ment of vaccines. Only 11 months passed from the release of the genomic sequence of the virus, by Chinese scientists, the design of the mRNA vaccines by scientists in the US and Germany, and testing and manufacture of vaccines, culminating with the first shot in the arm of a 91-year-old British woman. At the time of writing, more than half a billion people have already been vaccinated. The race to vaccination is pacing up, but progress is very uneven across countries and regions in the world. If progress in vaccination is accelerated to reach everyone, the health, economic, and social benefits would be enor-mous. Even a narrow focus on tax revenues identifies potential gains in excess of $1 trillion for advanced
economies alone over the medium term. Global vaccination may well be the public project with the highest return ever identified.
At present, the evolution of COVID-19 and its fallout on economic and social developments remain highly uncertain. Policies must remain agile and respond flexibly as the situation may require. The balance between supporting people and firms, in the emergency, and facilitating a resilient, sustainable and inclusive growth through economic transforma-tion should evolve and adapt to the evolution of COVID-19 and of its consequences.
COVID-19 is leaving behind complex legacies that will need to be tackled. First, the amount of fiscal support in 2020 was much larger than the historical norm for business cycle fluctuations. That was appropriate because COVID-19 is a health emergency. But these measures were expensive and contributed to reaching historically high debt levels. In a context of historically low interest rates, coun-tries with stronger buffers, better access to finance, or both were able to deploy larger fiscal support. Going forward, rebuilding buffers and dealing with legacies is crucial for resilience in the event of further shocks. Medium-term frameworks and better targeting will be key for building fiscal space and better confronting trade-offs such as providing support now and providing insurance against future emergencies.
Second, countries are in different stages of COVID-19, economic and labor market conditions differ, structural characteristics—including institu-tions—are distinct. Hence, fiscal policy must be tailored to country-specific circumstances.
A Fair Shot is also the title of Chapter 2 of the Fiscal Monitor. I have argued above that giving every-one access to a COVID-19 vaccine shot may well be the best investment of all. But Chapter 2 argues further that it is crucial to give everyone a fair shot at life success. Preexisting inequalities have amplified the adverse impact of the pandemic. And, in turn, COVID-19 has aggravated inequalities. A vicious
FOREWORD
©International Monetary Fund. Not for Redistribution
F I S C A L M O N I TO R: A FA I R S H OT
x International Monetary Fund | April 2021
cycle of inequality could morph into a social and political seismic crack. To reduce that risk, Chapter 2 calls for tackling inequalities in access to basic public services—health care, education, social safety—and for strengthening redistributive policies. That will, in many cases, require substantial increases in tax capacity and improvements in the efficiency of public
spending. Such strong demands on the public sector require good government. And the first requirement of good government is transparent and accountable commitment to a fair shot for all.
Vitor GasparDirector of the Fiscal Affairs Department
©International Monetary Fund. Not for Redistribution

International Monetary Fund | April 2021 xi
<C T>
EXECUTIVE SUMMARY
Chapter 1: Tailoring Fiscal ResponsesThe race to vaccinate against COVID-19 continues,
but the pace of inoculations is widely different across countries, with access unavailable for many. Global vaccination is urgently needed. Global inoculation would pay for itself with stronger employment and economic activity, leading to increased tax revenues and sizable savings in fiscal support. Until the pan-demic is brought under control globally, fiscal policy must remain flexible and supportive of health care systems, households, viable firms, and the economic recovery. The need and scope for support varies across economies, depending on the effect of the pandemic and the ability to access low-cost borrowing. Many governments in advanced economies are implement-ing sizable spending and revenue measures in 2021 (6 percent of GDP, on average). Support in emerging market economies and especially in low-income devel-oping countries has been smaller and front-loaded, with a large share of measures expiring.
Fiscal support has prevented more severe economic contractions and larger job losses. Meanwhile, such support, along with drops in revenues, has raised government deficits and debt to unprecedented levels across all country income groups. Average overall defi-cits as a share of GDP in 2020 reached 11.7 percent for advanced economies, 9.8 percent for emerging market economies, and 5.5 percent for low-income developing countries. Countries’ ability to scale up spending has diverged. The rise in deficits in advanced economies and several emerging market economies resulted from roughly equal increases in spending and declines in revenues, whereas in many emerging market economies and most low-income developing countries, it stemmed primarily from the collapse in revenues caused by the economic downturn. Fis-cal deficits in 2021 are projected to shrink in most countries as pandemic-related support expires or winds down, revenues recover somewhat, and the number of unemployment claims declines.
Average public debt worldwide reached an unprec-edented 97 percent of GDP in 2020 and is projected to stabilize at around 99 percent of GDP in 2021.
Despite higher debt, average interest payments are gen-erally lower in advanced economies and many emerg-ing markets, given the trend decline in market interest rates. In pursuit of their mandates, central banks have lowered policy rates and purchased government bonds, thereby facilitating the fiscal responses to the pan-demic. For low-income countries, however, financing large deficits continues to be challenging, given limited market access and little scope to raise revenue in the near term. These countries need assistance through grants, concessional financing, or, in some cases, debt restructuring. Over the medium term, fiscal deficits are projected to shrink in all income groups as recoveries increase pace and fiscal adjustments resume. As a result, the debt-to-GDP ratios in most countries are projected to stabilize or decline, although public debt will con-tinue to increase in a few countries because of factors such as aging and development needs.
Uncertainty concerning the fiscal outlook is unusu-ally high. On the upside, faster-than-expected vac-cinations could expedite an end to the pandemic, boosting revenue collections and reducing the need for additional fiscal support. On the downside, a more protracted economic downturn, an abrupt tightening of financing conditions amid high debt, a surge in corporate bankruptcies, volatility in commodity prices, or rising social discontent could inhibit the recovery. In general, the longer the pandemic lasts, the larger the challenge for the public finances.
Against this backdrop, fiscal policy priorities include continuing support as needed while vaccina-tions proceed and the recovery strengthens; promptly implementing the announced fiscal measures with upgraded project execution capacities and procurement procedures; pursuing a green, digital, and inclusive transformation of the economy; tackling long-standing weaknesses in public finances once the recovery is firmly in place; developing medium-term fiscal strate-gies to manage fiscal and financing risks; and renewing efforts to achieve the Sustainable Development Goals. To meet these priorities: • Global cooperation must be scaled up to contain
the pandemic, especially accelerated vaccination at
©International Monetary Fund. Not for Redistribution

F I S C A L M O N I TO R: A FA I R S H OT
xii International Monetary Fund | April 2021
affordable cost in all countries. In an upside scenario in which the pandemic is controlled sooner in all countries (see the April 2021 World Economic Outlook), stronger economic growth would yield more than $1 trillion in additional tax revenues in advanced economies, cumulatively, by 2025, and save trillions more in fiscal support measures. Vaccination will, thus, more than pay for itself, providing excellent value for public money invested in ramping up global vaccine production and distribution.
• The targeting of measures must be improved and tailored to countries’ administrative capacity so that fiscal support can be maintained for the duration of the crisis—considering an uncertain and uneven recovery. Given the low-interest environment, a synchronized green public investment push by countries with fiscal space can foster global growth.
• Policymakers need to balance the risks from large and growing public and private debt with the risks from premature withdrawal of fiscal support, which could slow the recovery. Credible medium-term fiscal frameworks are critical for attaining such balance, setting a path for rebuilding fiscal buffers at a pace contingent on the recovery. This effort could be supported by improving the design of fiscal rules or recalibrating their limits to ensure a credible path of adjustments or legislation such as “preapproving” future tax reforms. Improving fiscal transparency and governance practices can help economies reap the full benefits of fiscal support.
• To help meet pandemic-related financing needs, policymakers could consider a temporary COVID-19 recovery contribution, levied on high incomes or wealth. To accumulate the resources needed to improve access to basic services, enhance safety nets, and reinvigorate efforts to achieve the Sustainable Development Goals, domestic and international tax reforms are necessary, especially as the recovery gains momentum.
Chapter 2: A Fair ShotThe COVID-19 pandemic has exacerbated preexist-
ing inequalities and poverty and has demonstrated the importance of social safety nets. It has also laid bare inequalities in access to basic services—health care, quality education, and digital infrastructure—which, in turn, may cause income gaps to persist generation
after generation. In the months ahead, universal access to vaccines and progress in vaccination will be decisive. For the recovery period and beyond, policies will need to aim at giving everyone a fair shot at lifetime oppor-tunities by reducing gaps in access to quality public services. For most countries, this will require mobiliz-ing additional revenues and improving the delivery of services while fostering inclusive growth.
This chapter documents how large preexisting inequalities have worsened the effect of the COVID-19 pandemic, while the crisis, in turn, has escalated those inequalities. For example, countries with better access to health care have had lower mortality rates, consider-ing the age of the population and the number of cases. Countries with higher relative poverty have had more reported infections, especially where urbanization is more extensive. Some effects on labor markets will be long lasting, as will be the impact on education. The unprecedented scale of school closures has resulted in education losses equivalent to about one-quarter of the school year in advanced economies and one-half in emerging market and developing economies. The largest losses have accrued to children from poorer and less-educated families. Moreover, in 2021, net school enrollment rates in emerging market and developing economies could drop by 1 percentage point (or about 6 million children dropping out of school). Children who drop out of school will experience major learning losses.
Policy responses should recognize that various aspects of inequality (income, wealth, opportunity) are mutually reinforcing and create a vicious circle. Interventions thus need to combine predistributive policies (which affect incomes before taxes and transfers) and redistributive policies (which reduce market income inequality, mostly through transfers and to a lesser extent through taxes, especially in advanced economies). Policy responses should thus include the following: • Investing more and investing better in education,
health, and early childhood development. Additional spending on education, for example, can reduce the enrollment gap between children from poor and rich households. Inefficiencies should also be tackled. In emerging markets and low-income developing countries, the difference between a country’s spending efficiency and that of best performers ranges from 8 percent to 11 percent for health care and 25 percent to 50 percent for education.
• Strengthening social safety nets by expanding coverage of the most vulnerable households, and increasing adequacy of
©International Monetary Fund. Not for Redistribution
e X e C U t I V e s UM MA RY
International Monetary Fund | April 2021 xiii
benefits. Beyond making more resources available, these objectives can also be attained by reallocating spending to the most effective programs and by improving identification of and delivery to beneficiaries.
• Mustering the necessary revenues. Advanced economies can increase progressivity of income taxation and increase reliance on inheritance/gift taxes and property taxation. COVID-19 recovery contributions and “excess” corporate profits taxes could be considered. Wealth taxes can also be considered if the previous measures are not enough. Emerging market and developing economies should focus on strengthening tax capacity to finance more social spending.
• Acting in a transparent manner. For most countries, these reforms would be best anchored in a medium-term fiscal framework as early as possible. Strengthening public financial management and improving transparency and accountability, not least for COVID-19 response measures, will reinforce trust in government.
• Supporting lower-income countries that face especially daunting challenges. Meeting the Sustainable Development Goals—a broad measure of the access
to basic services—by 2030 would require $3 trillion for 121 emerging market economies and low-income developing countries (2.6 percent of 2030 world GDP). Support from the international community is needed to aid reform efforts, with the immediate priority being affordable access to vaccines.
The COVID-19 pandemic has focused attention on governments and their ability to respond to the crisis. Popular support for better public services, already significant before the pandemic, has likely risen. Cross-country surveys administered before the pandemic suggest that respondents in advanced and emerging market economies have long expressed favor for more tax-financed spending on education, health care, and old-age care, and more progressive taxation. A recent survey suggests that, if a household member becomes ill with COVID-19 or loses employ-ment, the probability of favoring progressive taxa-tion rises by 15 percentage points. Meeting the rising demand for basic public services and more inclusive policies is crucial for policymakers to strengthen public trust and support social cohesion.
©International Monetary Fund. Not for Redistribution
This page intentionally left blank
©International Monetary Fund. Not for Redistribution

IntroductionThe COVID-19 pandemic has not yet been brought
under control, and recovery is not assured. Access to vaccines, the pace of vaccination, the effectiveness of other measures to curb contagion, and the scale and modalities of policy support differ widely across coun-tries. As a result, economic recoveries are diverging, with China and the United States recovering the fastest while many economies are lagging or are still stagnant (April 2021 World Economic Outlook). Continued and flexible fiscal support is, thus, crucial until a durable recovery is under way. Government actions are also needed to manage the legacies of the crisis, including debt vulnerabilities, rising fiscal risks, and the dispro-portionate burden on poor and vulnerable households that exacerbates preexisting inequities (Chapter 2). Many governments are implementing multiyear fiscal actions to support health care systems, households, and firms ($16 trillion globally since the beginning of the pandemic, with a data cutoff as of March 17, 2021). Such support varies across economies depending on the effect of pandemic-related shocks, the ability to access low-cost borrowing, and precrisis fiscal con-ditions. Public debt levels before the pandemic were higher than before the global financial crisis in 2007, but average interest payments are generally lower in advanced economies and many emerging market economies given the trend decline in market interest rates (Figure 1.1). The nonfinancial corporate sector in many countries entered the crisis with higher leverage than in 2007 (IMF Global Debt Database 2020), posing vulnerability to financial stress. Massive liquid-ity support to nonfinancial firms, although necessary, has increased private sector indebtedness (April 2021 Global Financial Stability Report). If bankruptcies increase, some private debt could migrate to the public sector through bailouts.
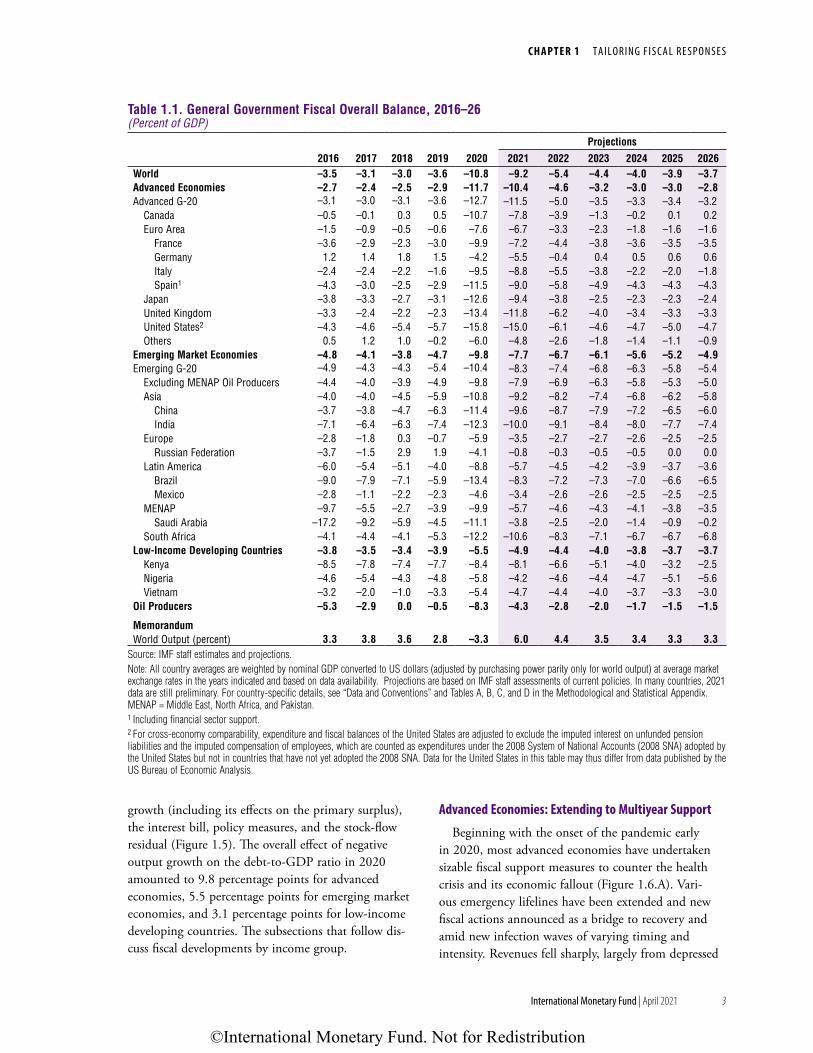
The longer the pandemic lasts, the greater the challenge is to public finances. Government deficits and debt have risen to unprecedented levels, given major fiscal support, along with a sharp fall in rev-enues caused by contractions in output (Figure 1.2, Tables 1.1 and 1.2). Average overall fiscal deficits as
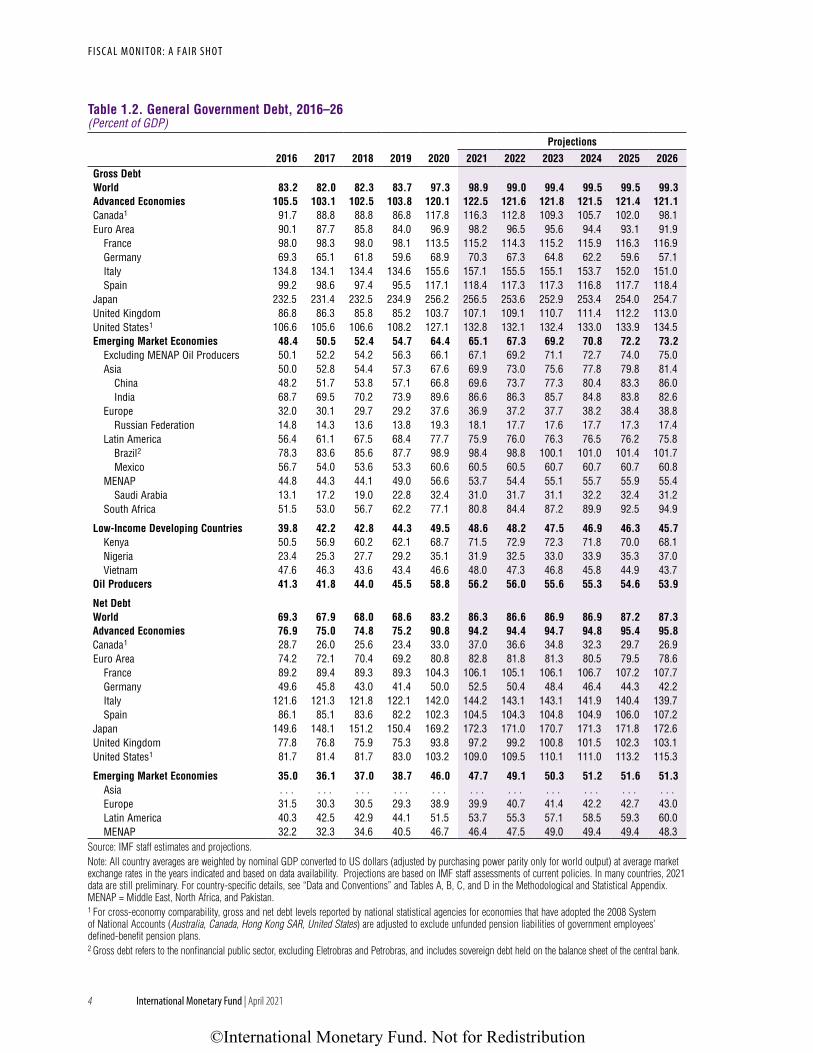
a share of GDP in 2020 reached 11.7 percent for advanced economies, 9.8 percent for emerging market economies, and 5.5 percent for low-income developing countries. Global public debt climbed to 97.3 percent of GDP in 2020, a surge of 13 percentage points from the level projected before the pandemic. In pursuit of their mandates, central banks in advanced econ-omies and some emerging market economies have lowered policy rates and purchased government bonds, thereby facilitating the fiscal responses to the pan-demic (Figure 1.3). Even so, many emerging market and developing economies have faced borrowing constraints, particularly those economies with elevated debt, large gross financing needs (Figure 1.4), and a high share of external or foreign-currency-denominated debt. In advanced economies, higher deficits have resulted from roughly equal increases in spending and declines in revenues, whereas in emerging market and developing economies, on average, the rise in deficits has stemmed primarily from the collapse in revenues caused by lower economic activity. For commodity exporters, depressed prices and supply cuts have added to the challenge. Fiscal deficits in 2021 are expected to shrink as pandemic-related support expires or winds down and automatic stabilizers play out (through, for example, higher tax revenues and lower unemployment benefits). The global public debt is projected to stabi-lize at about 99 percent of GDP through 2021 and in the medium term.
Large fiscal actions have prevented a more severe global economic contraction, greater job losses, and higher social costs. Fiscal support, therefore, should continue as feasible and as needed while vaccina-tions continue, testing capacity and other preventive measures are enhanced, and the recovery strengthens. Such support should increasingly be tailored to country circumstances and changing economic and pandemic conditions. On the basis of announced measures, however, a retrenchment in fiscal support is projected in 2021, especially in emerging market and developing economies with elevated debt. To balance the risks from growing debt with those from premature withdrawal of policy support, policymakers need to
1CHAP
TER
TAILORING FISCAL RESPONSES
International Monetary Fund | April 2021 1
©International Monetary Fund. Not for Redistribution

2 International Monetary Fund | April 2021
F I S C A L M O N I T O R: A F A I R S H O T
develop credible medium-term fiscal frameworks—thereby extending the horizon for fiscal policymaking beyond the annual budget. Fiscal policy should also enable a green, digital, and inclusive transformation of the economy in the post-COVID-19 environment. For example, efficient use of the Next Generation EU resources can facilitate such transformation in the European Union. Once the recovery is firmly in place, long-standing weaknesses in public finances must be tackled. Priorities include tax and social protection reforms as well as renewed efforts to achieve the Sus-tainable Development Goals (SDGs).
The remainder of Chapter 1 reviews recent fiscal developments and outlook by country income group,
considering risks to public finances; examines the effectiveness of discretionary fiscal policy responses to the COVID-19 crisis; and discusses near-term, then longer-term, policy priorities.
Recent Fiscal Developments and OutlookAlthough fiscal support actions have been massive,
especially in advanced economies, other factors—especially output drops—have largely driven the rise in public debt ratios during 2020–21. The major effect of output contractions on debt ratios is revealed by an extended accounting method (Mauro and Zilinsky 2016) that considers the separate roles of economic
Interest expenseDebt-to-GDP ratio
Interest expenseDebt-to-GDP ratio
Interest expenseDebt-to-GDP ratio
40
60
80
100
120
140
0
1
2
3
4
5
20
30
40
50
60
70
20
30
40
50
60
70
0
1
2
3
4
5
0
1
2
3
4
5
Figure 1.1. Interest Expense and Government Debt, 2007–21(Percent of GDP; debt-to-GDP, left scale; interest expense, right scale)
Sources: IMF, World Economic Outlook database; and IMF staff calculations.
1. Advanced Economies 2. Emerging Market Economies 3. Low-Income Developing Countries
2007 09 11 13 15 17 19 212007 09 11 13 15 17 19 21 2007 09 11 13 15 17 19 21
Despite rising public debt levels, interest bills are lower in advanced and emerging market economies.
Current projection: Overall balance Current projection: Gross debt Prepandemic projection: Gross debt Prepandemic projection: Overall balance
1. Advanced Economies 2. Emerging Market Economies 3. Low-Income Developing Countries
The pandemic has strained public finances across all country groups.
Source: IMF, World Economic Outlook database. Note: Prepandemic projections are based on the January 2020 World Economic Outlook Update. The right scale is different for each country income group.
Figure 1.2. The Effect of the COVID-19 Pandemic on the Forecast of General Government Gross Debt and Fiscal Balances,2019–26(Percent of GDP; overall balance, left scale; gross debt, right scale)
–15
–10
–5
0
5
10
–15
–10
–5
0
5
10
–15
–10
–5
0
5
10
9095100105110115120125
0102030405060
0
20
40
60
80
2019 20 21 22 23 24 25 26 2019 20 21 22 23 24 25 26 2019 20 21 22 23 24 25 26Percent of GDP Percent of GDP Percent of GDP
©International Monetary Fund. Not for Redistribution
3International Monetary Fund | April 2021
C H A P T E R 1 T A I L O R I N G F I S C A L R E S P O N S E S
growth (including its effects on the primary surplus), the interest bill, policy measures, and the stock-flow residual (Figure 1.5). The overall effect of negative output growth on the debt-to-GDP ratio in 2020 amounted to 9.8 percentage points for advanced economies, 5.5 percentage points for emerging market economies, and 3.1 percentage points for low-income developing countries. The subsections that follow dis-cuss fiscal developments by income group.
Advanced Economies: Extending to Multiyear Support
Beginning with the onset of the pandemic early in 2020, most advanced economies have undertaken sizable fiscal support measures to counter the health crisis and its economic fallout (Figure 1.6.A). Vari-ous emergency lifelines have been extended and new fiscal actions announced as a bridge to recovery and amid new infection waves of varying timing and intensity. Revenues fell sharply, largely from depressed
Table 1.1. General Government Fiscal Overall Balance, 2016–26(Percent of GDP)
Projections
2016 2017 2018 2019 2020 2021 2022 2023 2024 2025 2026World –3.5 –3.1 –3.0 –3.6 –10.8 –9.2 –5.4 –4.4 –4.0 –3.9 –3.7Advanced Economies –2.7 –2.4 –2.5 –2.9 –11.7 –10.4 –4.6 –3.2 –3.0 –3.0 –2.8Advanced G-20 –3.1 –3.0 –3.1 –3.6 –12.7 –11.5 –5.0 –3.5 –3.3 –3.4 –3.2
Canada –0.5 –0.1 0.3 0.5 –10.7 –7.8 –3.9 –1.3 –0.2 0.1 0.2Euro Area –1.5 –0.9 –0.5 –0.6 –7.6 –6.7 –3.3 –2.3 –1.8 –1.6 –1.6
France –3.6 –2.9 –2.3 –3.0 –9.9 –7.2 –4.4 –3.8 –3.6 –3.5 –3.5Germany 1.2 1.4 1.8 1.5 –4.2 –5.5 –0.4 0.4 0.5 0.6 0.6Italy –2.4 –2.4 –2.2 –1.6 –9.5 –8.8 –5.5 –3.8 –2.2 –2.0 –1.8Spain1 –4.3 –3.0 –2.5 –2.9 –11.5 –9.0 –5.8 –4.9 –4.3 –4.3 –4.3
Japan –3.8 –3.3 –2.7 –3.1 –12.6 –9.4 –3.8 –2.5 –2.3 –2.3 –2.4United Kingdom –3.3 –2.4 –2.2 –2.3 –13.4 –11.8 –6.2 –4.0 –3.4 –3.3 –3.3United States2 –4.3 –4.6 –5.4 –5.7 –15.8 –15.0 –6.1 –4.6 –4.7 –5.0 –4.7Others 0.5 1.2 1.0 –0.2 –6.0 –4.8 –2.6 –1.8 –1.4 –1.1 –0.9
Emerging Market Economies –4.8 –4.1 –3.8 –4.7 –9.8 –7.7 –6.7 –6.1 –5.6 –5.2 –4.9Emerging G-20 –4.9 –4.3 –4.3 –5.4 –10.4 –8.3 –7.4 –6.8 –6.3 –5.8 –5.4
Excluding MENAP Oil Producers –4.4 –4.0 –3.9 –4.9 –9.8 –7.9 –6.9 –6.3 –5.8 –5.3 –5.0Asia –4.0 –4.0 –4.5 –5.9 –10.8 –9.2 –8.2 –7.4 –6.8 –6.2 –5.8
China –3.7 –3.8 –4.7 –6.3 –11.4 –9.6 –8.7 –7.9 –7.2 –6.5 –6.0India –7.1 –6.4 –6.3 –7.4 –12.3 –10.0 –9.1 –8.4 –8.0 –7.7 –7.4
Europe –2.8 –1.8 0.3 –0.7 –5.9 –3.5 –2.7 –2.7 –2.6 –2.5 –2.5Russian Federation –3.7 –1.5 2.9 1.9 –4.1 –0.8 –0.3 –0.5 –0.5 0.0 0.0
Latin America –6.0 –5.4 –5.1 –4.0 –8.8 –5.7 –4.5 –4.2 –3.9 –3.7 –3.6Brazil –9.0 –7.9 –7.1 –5.9 –13.4 –8.3 –7.2 –7.3 –7.0 –6.6 –6.5Mexico –2.8 –1.1 –2.2 –2.3 –4.6 –3.4 –2.6 –2.6 –2.5 –2.5 –2.5
MENAP –9.7 –5.5 –2.7 –3.9 –9.9 –5.7 –4.6 –4.3 –4.1 –3.8 –3.5Saudi Arabia –17.2 –9.2 –5.9 –4.5 –11.1 –3.8 –2.5 –2.0 –1.4 –0.9 –0.2
South Africa –4.1 –4.4 –4.1 –5.3 –12.2 –10.6 –8.3 –7.1 –6.7 –6.7 –6.8Low-Income Developing Countries –3.8 –3.5 –3.4 –3.9 –5.5 –4.9 –4.4 –4.0 –3.8 –3.7 –3.7
Kenya –8.5 –7.8 –7.4 –7.7 –8.4 –8.1 –6.6 –5.1 –4.0 –3.2 –2.5Nigeria –4.6 –5.4 –4.3 –4.8 –5.8 –4.2 –4.6 –4.4 –4.7 –5.1 –5.6Vietnam –3.2 –2.0 –1.0 –3.3 –5.4 –4.7 –4.4 –4.0 –3.7 –3.3 –3.0
Oil Producers –5.3 –2.9 0.0 –0.5 –8.3 –4.3 –2.8 –2.0 –1.7 –1.5 –1.5
MemorandumWorld Output (percent) 3.3 3.8 3.6 2.8 –3.3 6.0 4.4 3.5 3.4 3.3 3.3
Source: IMF staff estimates and projections.Note: All country averages are weighted by nominal GDP converted to US dollars (adjusted by purchasing power parity only for world output) at average market exchange rates in the years indicated and based on data availability. Projections are based on IMF staff assessments of current policies. In many countries, 2021 data are still preliminary. For country-specific details, see “Data and Conventions” and Tables A, B, C, and D in the Methodological and Statistical Appendix. MENAP = Middle East, North Africa, and Pakistan.1 Including financial sector support.2 For cross-economy comparability, expenditure and fiscal balances of the United States are adjusted to exclude the imputed interest on unfunded pension liabilities and the imputed compensation of employees, which are counted as expenditures under the 2008 System of National Accounts (2008 SNA) adopted by the United States but not in countries that have not yet adopted the 2008 SNA. Data for the United States in this table may thus differ from data published by the US Bureau of Economic Analysis.
©International Monetary Fund. Not for Redistribution
4 International Monetary Fund | April 2021
F I S C A L M O N I T O R: A F A I R S H O T
Table 1.2. General Government Debt, 2016–26(Percent of GDP)
Projections
2016 2017 2018 2019 2020 2021 2022 2023 2024 2025 2026Gross DebtWorld 83.2 82.0 82.3 83.7 97.3 98.9 99.0 99.4 99.5 99.5 99.3Advanced Economies 105.5 103.1 102.5 103.8 120.1 122.5 121.6 121.8 121.5 121.4 121.1Canada1 91.7 88.8 88.8 86.8 117.8 116.3 112.8 109.3 105.7 102.0 98.1Euro Area 90.1 87.7 85.8 84.0 96.9 98.2 96.5 95.6 94.4 93.1 91.9
France 98.0 98.3 98.0 98.1 113.5 115.2 114.3 115.2 115.9 116.3 116.9Germany 69.3 65.1 61.8 59.6 68.9 70.3 67.3 64.8 62.2 59.6 57.1Italy 134.8 134.1 134.4 134.6 155.6 157.1 155.5 155.1 153.7 152.0 151.0Spain 99.2 98.6 97.4 95.5 117.1 118.4 117.3 117.3 116.8 117.7 118.4
Japan 232.5 231.4 232.5 234.9 256.2 256.5 253.6 252.9 253.4 254.0 254.7United Kingdom 86.8 86.3 85.8 85.2 103.7 107.1 109.1 110.7 111.4 112.2 113.0United States1 106.6 105.6 106.6 108.2 127.1 132.8 132.1 132.4 133.0 133.9 134.5Emerging Market Economies 48.4 50.5 52.4 54.7 64.4 65.1 67.3 69.2 70.8 72.2 73.2
Excluding MENAP Oil Producers 50.1 52.2 54.2 56.3 66.1 67.1 69.2 71.1 72.7 74.0 75.0Asia 50.0 52.8 54.4 57.3 67.6 69.9 73.0 75.6 77.8 79.8 81.4
China 48.2 51.7 53.8 57.1 66.8 69.6 73.7 77.3 80.4 83.3 86.0India 68.7 69.5 70.2 73.9 89.6 86.6 86.3 85.7 84.8 83.8 82.6
Europe 32.0 30.1 29.7 29.2 37.6 36.9 37.2 37.7 38.2 38.4 38.8Russian Federation 14.8 14.3 13.6 13.8 19.3 18.1 17.7 17.6 17.7 17.3 17.4
Latin America 56.4 61.1 67.5 68.4 77.7 75.9 76.0 76.3 76.5 76.2 75.8Brazil2 78.3 83.6 85.6 87.7 98.9 98.4 98.8 100.1 101.0 101.4 101.7Mexico 56.7 54.0 53.6 53.3 60.6 60.5 60.5 60.7 60.7 60.7 60.8
MENAP 44.8 44.3 44.1 49.0 56.6 53.7 54.4 55.1 55.7 55.9 55.4Saudi Arabia 13.1 17.2 19.0 22.8 32.4 31.0 31.7 31.1 32.2 32.4 31.2
South Africa 51.5 53.0 56.7 62.2 77.1 80.8 84.4 87.2 89.9 92.5 94.9
Low-Income Developing Countries 39.8 42.2 42.8 44.3 49.5 48.6 48.2 47.5 46.9 46.3 45.7Kenya 50.5 56.9 60.2 62.1 68.7 71.5 72.9 72.3 71.8 70.0 68.1Nigeria 23.4 25.3 27.7 29.2 35.1 31.9 32.5 33.0 33.9 35.3 37.0Vietnam 47.6 46.3 43.6 43.4 46.6 48.0 47.3 46.8 45.8 44.9 43.7
Oil Producers 41.3 41.8 44.0 45.5 58.8 56.2 56.0 55.6 55.3 54.6 53.9
Net DebtWorld 69.3 67.9 68.0 68.6 83.2 86.3 86.6 86.9 86.9 87.2 87.3Advanced Economies 76.9 75.0 74.8 75.2 90.8 94.2 94.4 94.7 94.8 95.4 95.8Canada1 28.7 26.0 25.6 23.4 33.0 37.0 36.6 34.8 32.3 29.7 26.9Euro Area 74.2 72.1 70.4 69.2 80.8 82.8 81.8 81.3 80.5 79.5 78.6
France 89.2 89.4 89.3 89.3 104.3 106.1 105.1 106.1 106.7 107.2 107.7Germany 49.6 45.8 43.0 41.4 50.0 52.5 50.4 48.4 46.4 44.3 42.2Italy 121.6 121.3 121.8 122.1 142.0 144.2 143.1 143.1 141.9 140.4 139.7Spain 86.1 85.1 83.6 82.2 102.3 104.5 104.3 104.8 104.9 106.0 107.2
Japan 149.6 148.1 151.2 150.4 169.2 172.3 171.0 170.7 171.3 171.8 172.6United Kingdom 77.8 76.8 75.9 75.3 93.8 97.2 99.2 100.8 101.5 102.3 103.1United States1 81.7 81.4 81.7 83.0 103.2 109.0 109.5 110.1 111.0 113.2 115.3
Emerging Market Economies 35.0 36.1 37.0 38.7 46.0 47.7 49.1 50.3 51.2 51.6 51.3Asia . . . . . . . . . . . . . . . . . . . . . . . . . . . . . . . . .Europe 31.5 30.3 30.5 29.3 38.9 39.9 40.7 41.4 42.2 42.7 43.0Latin America 40.3 42.5 42.9 44.1 51.5 53.7 55.3 57.1 58.5 59.3 60.0MENAP 32.2 32.3 34.6 40.5 46.7 46.4 47.5 49.0 49.4 49.4 48.3
Source: IMF staff estimates and projections.Note: All country averages are weighted by nominal GDP converted to US dollars (adjusted by purchasing power parity only for world output) at average market exchange rates in the years indicated and based on data availability. Projections are based on IMF staff assessments of current policies. In many countries, 2021 data are still preliminary. For country-specific details, see “Data and Conventions” and Tables A, B, C, and D in the Methodological and Statistical Appendix. MENAP = Middle East, North Africa, and Pakistan.1 For cross-economy comparability, gross and net debt levels reported by national statistical agencies for economies that have adopted the 2008 System of National Accounts (Australia, Canada, Hong Kong SAR, United States) are adjusted to exclude unfunded pension liabilities of government employees’ defined-benefit pension plans.2 Gross debt refers to the nonfinancial public sector, excluding Eletrobras and Petrobras, and includes sovereign debt held on the balance sheet of the central bank.
©International Monetary Fund. Not for Redistribution

5International Monetary Fund | April 2021
C H A P T E R 1 T A I L O R I N G F I S C A L R E S P O N S E S
economic activity (Figure 1.6.B). The average cycli-cally adjusted primary deficit of advanced economies jumped to 7.6 percent of GDP in 2020. The United States provided assistance equivalent to 16.7 percent of GDP in 2020 to households, firms, and state and local governments. Japan and the United Kingdom provided 15.9 percent and 13 percent, respectively, of GDP of above-the-budget-line support in 2020. Sim-ilarly, national fiscal policies in the euro area (totaling more than 5 percent of the region’s GDP) and sizable automatic stabilizers (amounting to about 5 percent of GDP) have provided critical support for workers and firms. With severe economic contraction and massive fiscal support, the average government gross debt-to-GDP ratio of advanced economies soared to 120 percent in 2020.
The average fiscal deficit in 2021 is expected to narrow, as several pandemic-related support actions expire or wind down and automatic stabilizers play out. Several measures have, however, been extended to 2021 and beyond. In Canada, the timeline for the withdrawal of fiscal support will not be locked into a
Sources: IMF, Historical Public Debt Database; IMF, World Economic Outlook database; JST Macro-History database; Maddison Database Project; Thomson Reuters Datastream, Global Financial Data; and IMF staff calculations.Note: The public-debt-to-GDP and long-term interest rate series for advanced economies are based on a constant sample of 20 countries, weighted by GDP in purchasing-power-parity terms. WWI = World War I; WWII = World War II.
Figure 1.3. Public Debt and Bond Yields in AdvancedEconomies, 1880–2020(Percent of GDP, left scale; percent, right scale)
Government debt has reached unprecedented levels, whereas interest rates are at historical lows.
Debt(left scale)
WWI WWII
Globalfinancial
crisis
Great Lockdown
Long-term interest rate(right scale)
GreatDepression
0
20
40
60
80
100
120
140
0
2
4
6
8
10
12
14
1880 88 96
1904 12 20 28 36 44 52 60 68 76 84 92
2000 08 16
Maturing debt Budget deficit 2020 GFN (without COVID-19)
Sources: Bloomberg Finance L.P.; IMF, World Economic Outlook database; and IMF staff estimates.Note: Data labels use International Organization for Standardization (ISO) country codes. GFN = gross financing needs.
Figure 1.4. Gross Financing Needs, 2021(Percent of GDP)
Gross financing needs have been boosted by the COVID-19 crisis.
0
10
20
30
40
50
60
701. Advanced Economies 2. Emerging Market Economies
JPN
USA
ITA
ESP
CAN
FRA
GBR
ISL
BEL
PRT
AUT
AUS
CZE
FIN
MLT
DEU
SVN
NLD
NZL
LTU
SVK
SWE
DNK
EGY
PAK
LKA
BRA
ZAF
UKR
HUN
IND
PHL
MAR
MEX
THA
TUR
ROU
ARG
HRV
MYS
Stock-flow residual Interest rate contributionTraditional growth contribution Additional growth contributionImplied policy measures Change in debt/GDP
Sources: IMF, World Economic Outlook database; and IMF staff estimates.Note: Additional growth contribution refers to the effect on the primary surplus through lower revenues. The stock-flow residual is the change in the debt ratio resulting from factors (such as bailouts or exchange rate changes) other than those listed. The overall effect of output growth on debt-to-GDP ratio is measured by the sum of traditional and additional growth contributions (dark and light red bars).
Figure 1.5. Accounting for Changes in Government Debt, 2019–21 (Percent of GDP)
Output drops have had a major effect on public debt.
–10
0
10
20
2019–20 20–21Advancedeconomies
2019–20 20–21Emergingmarkets
2019–20 20–21Low-income
developing countries
©International Monetary Fund. Not for Redistribution

6 International Monetary Fund | April 2021
F I S C A L M O N I T O R: A F A I R S H O T
predetermined calendar. In the United Kingdom, the fiscal year 2021/22 budget strengthens short-term support to the economy, including by extending the pandemic- related support through September 2021, while laying out a strategy to restore medium-term fiscal sustainability centered on corporate and income tax increases. The 2021 budgets of European Union
countries remain supportive and should be bolstered by grants from the European Union’s Recovery and Resilience Facility. Japan has announced sizable fiscal support for 2021, including public investment for climate-resilient infrastructure and incentives for firms to invest in digital technology. More support is likely forthcoming in several countries. By providing
2020 minus20192021 minus2020
2020 minus20192021 minus2020
Substantial Some At risk ornone
Substantial Some At risk ornone
Low Moderate High or indebt distress
2020 minus20192021 minus2020
–15
–10
–5
0
5
10
Figure 1.6. Recent Fiscal Developments and Outlook across Income Groups, 2019–26A. Cumulative Change in Fiscal Balance (Percent of GDP, relative to 2019)
Sources: IMF, World Economic Outlook database; and IMF staff calculations.Note: Figures 1.6.A and 1.6.C use the cyclically adjusted primary balance for advanced economies, primary balance for emerging market economies, and overall balance for low-income developing countries. Numbers in each year refer to the cumulative change since 2019. Figure 1.6.B reports the weighted averages across income groups. Pre–COVID-19 GDP refers to the GDP outturn in 2019 and the October 2020 World Economic Outlook projections of GDP for 2020 and 2021. Colors in Figure 1.6.C indicate fiscal space in panels 1 and 2 and risk of debt distress in panel 3. The bubble size refers to debt-to-GDP ratio relative to the respective income group average. Data labels use International Organization for Standardization (ISO) country codes.
1. Advanced Economies 2. Emerging Market Economies 3. Low-Income Developing Countries
2019 20 2221 23 24 25 26–30
–10–15–20–25
50–5
10
2015
2019 20 2221 23 24 25 26–10
–2–4–6–8
420
6
108
–1
43210
65
10
87
9
2019 20 2221 23 24 25 26
1. Advanced Economies(Percent of GDP, 2019–20)
2. Emerging Market Economies(Percent of GDP, 2019–20)
3. Low-Income Developing Countries(Percent of GDP, 2019–20)
2. Emerging Market Economies 3. Low-Income Developing Countries
Fiscal support is expected to unwind over the medium term.
Revenues fell everywhere, whereas pandemic-related spending was higher mostly in advanced economies.
Change in cyclically adjustedprimary balance, 2020–21
Change in primary balance, 2020–21 Change in overall balance, 2020–21
B. Change in General Government Expenditure and Revenue (Percent of pre-COVID-19 GDP)
1. Advanced Economies
Countries with fiscal space at risk are projected to adjust more in the coming years.
C. Fiscal Adjustment and Public Debt for Selected Economies, 2020–26 (Percent of GDP)
Primaryexpenditure
Revenue
1 3 5 7–5 –3 –1
Primaryexpenditure
Revenue
1 3 5–5 –3 –1
Primaryexpenditure
Revenue
1 3 5–5 –3 –1
–4
–2
4
2
0
6
10
8
0 1 2 3 4–3 –2 –1 0 1 2 3 4 5 6 7–2 –1–4
–2
4
2
0
6
10
8
0 1 2 3 4 5–2 –1
Chan
ge in
ove
rall
bala
nce,
2021
–26
Chan
ge in
prim
ary
bala
nce,
2021
–26
Chan
ge in
cyc
lical
ly a
djus
ted
prim
ary
bala
nce,
202
1–26
Perc
ent o
f GDP
,re
lativ
e to
201
9
US
Greece
Canada
Japan
Median Median
Aruba SeychellesTogo
MalawiGhana
Iraq
Brazil
Median
Largest cumulative adjustments
MT
adju
stm
ent
ST stimulus ST adjustment
STstimulus
ST adjustmentSTstimulus ST adjustment
MT stimulus
MT
adju
stm
ent
MT stimulus
MT adjustment
MT stimulus
Largest cumulative adjustments
Largest cumulative easing Largest cumulative easing
Largest cumulative adjustments
Largest cumulative easing
AUS
JPN ARGBRA
GHAKEN
CIV
NGA
VNM
TZA ETHBGD
UZB
MMRIND
CHNIDN
MEX
ZAFGBR
ITA
DEU
RUSFRA
TURESPKOR
CANUSA
©International Monetary Fund. Not for Redistribution

7International Monetary Fund | April 2021
C H A P T E R 1 T A I L O R I N G F I S C A L R E S P O N S E S
additional resources to tackle the public health crisis (including through vaccinations) and supporting those in need (including through unemployment benefits, the earned-income tax credit, child tax credits, and food assistance), the American Rescue Package in the United States would create much-needed lifelines as well as a large frontloaded fiscal impulse in the next two years.
Over the medium term, fiscal deficits are projected to shrink in most advanced economies as recoveries accelerate and gradual fiscal adjustments resume. The average cyclically adjusted primary deficit is projected to fall from 7.6 percent of GDP in 2020 to 2.3 per-cent in 2026, slightly higher than the pre–COVID-19 levels (Figure 1.6.C). Germany continues to guide its medium-term budget plan by the policy prior-ity of promoting greener, smarter, and more inclu-sive growth. Several countries are expected to have larger cyclically adjusted primary deficits compared with the pre–COVID-19 levels (Belgium, Denmark, Italy, Korea, The Netherlands, Spain), of which a few would benefit from spending and/or revenue reforms (Belgium, France, Italy). In Japan, the large increase in fiscal imbalances from COVID-19 and age-related budget pressures point to the need to reanchor the medium-term fiscal policy to ensure that debt remains sustainable. Favorable interest–growth differentials and projected fiscal adjustment plans—likely to occur at a faster pace than projected before the pandemic—are expected to stabilize the debt-to-GDP ratios in most advanced economies over the medium term. The average public debt for this group is projected to stand at 121 percent of GDP by 2026, 17 percentage points higher than the pre–COVID-19 levels. Public debt in several countries, however, is projected to rise in the medium term (Korea, United States). In Korea, increased expenditures to strengthen social safety nets, support job creation, and foster innovation over the medium term are likely to put public debt on an upward trajectory. In contrast, the average public debt for the euro area is projected to gradually decline to 92 percent of GDP in 2026.
Emerging Market Economies: Varied Outlook for Fiscal Responses and Adjustments
Nearly all emerging market economies eased fiscal policy in 2020. The average overall fiscal deficit more than doubled relative to 2019 to reach 9.8 percent
of GDP. China shifted to broader demand support over time after bringing the pandemic under control earlier than most other countries. India announced a support package in November 2020 that included multiyear investment incentives, additional agricultural subsidies, and measures to support housing as well as formal and rural employment. Brazil expanded the social safety net and provided a job-retention program, as well as implementing other measures. The fiscal defi-cit in Saudi Arabia widened sharply despite an increase in the value-added tax rate, hikes in custom duties, and the removal of 2018 cost-of-living allowances. Revenue and expenditure measures in oil exporters were smaller than the emerging market average, partly reflecting such economies’ ability to absorb additional health care costs in existing budget envelopes. Double-digit deficits in many countries contributed to a surge in average government debt ratios to 64.4 percent of GDP at the end of 2020, a 10 percentage points rise from the previous year, reflecting severe economic con-traction and—for commodity exporters—lower natural resource revenues. Central banks’ asset purchases and other global support measures helped reduce debt- service costs.
The average overall deficit is set to narrow in 2021 to 7.7 percent of GDP under the output recovery pro-jected in the April 2021 World Economic Outlook base-line. Revenues are expected to recover somewhat, and pandemic-related spending is set to decline gradually, with significant variation across countries. China’s fiscal policy is expected to tighten mildly. Despite the partial unwinding of exceptional fiscal measures, Indonesia’s 2021 budget envisages a moderate expansionary fiscal stance as some unspent 2020 budget allocations are car-ried over and other spending, including public invest-ment, is expected to increase. India’s fiscal year 2021/22 budget focuses on health care, education, and public infrastructure and predicts a continued accommodative fiscal stance with increased flexibility in the financing envelope for state governments. Some countries expect large fiscal adjustments. For example, the Russian Fed-eration foresees reducing non-oil deficits by gradually unwinding pandemic-related fiscal measures, aiming to return to the fiscal rule in 2022. Saudi Arabia has planned a significant central government fiscal consoli-dation in 2021. Mexico approved a “no policy change” conservative budget compared with 2020. In Brazil, the expiry of the COVID-19 response “war budget” implies a sizable tightening of primary expenditures.
©International Monetary Fund. Not for Redistribution

8 International Monetary Fund | April 2021
F I S C A L M O N I T O R: A F A I R S H O T
The average overall deficit is projected to shrink from 9.8 percent of GDP in 2020 to 4.9 percent in 2026. Fiscal adjustments are envisaged through spending restraint (3.3 percentage points of GDP on a cumula-tive basis) and moderate revenue mobilization efforts. China is projected to tighten off-budget investment. India aims to gradually reduce the central government fiscal deficit, although it will be important to lay out a medium-term fiscal framework with concrete measures and targets. In South Africa, fiscal adjustment relies largely on containing the wage bill rather than expediting reform of state-owned enterprises and rationalizing costly and inefficient subsidies. Indonesia plans adjustments of 1.5 percent of GDP annually during 2022–23 to return to the deficit ceiling, relying on expenditure cuts as the cyclical recovery in tax revenue is offset by the permanent reduction in corporate income tax rates initiated in 2020. Most oil-exporting countries (Kazakhstan, Saudi Arabia) foresee significant spending restraints and additional non-oil revenues to reduce sizable deficits, considering that oil revenues are projected to remain more subdued over the medium term than in the pre-2014 period.
With moderate fiscal adjustments, the average gov-ernment debt-to-GDP ratio is projected to rise further in 2021 and remain on an upward trajectory to exceed 73 percent of GDP by 2026 (largely driven by China over the medium term). Although the average interest– growth differential is expected to remain favorable, sizable primary deficits continue to weigh on debt, which is expected to rise further in two-thirds of emerg-ing market economies in 2021. General government debt in China is expected to reach 69.6 percent of GDP in 2021, higher than the average in emerging market economies. Likewise, in South Africa, the pandemic- related increase in debt is estimated to continue, reach-ing 95 percent of GDP by 2026. Debt-to-GDP ratios are projected to stabilize at high levels in several emerg-ing market economies, including Brazil (98.4 percent) and India (86.6 percent) in 2021. For all countries, a credible medium-term fiscal framework, anchored on revised fiscal objectives and revenue mobilization, can enhance confidence and reduce vulnerabilities.
Low-Income Developing Countries: Challenging Trade-Offs
In 2020, the average overall fiscal deficit of low- income developing countries increased by 1.5 per-centage points of GDP to reach 5.5 percent of GDP,
and the average public debt increased by 5 percentage points to reach 49.5 percent of GDP at the end of 2020. Despite large revenue shortfalls from out-put drops and a concurrent fall in commodity prices, deficits rose by less than in other income groups because total spending remained essentially constant (Figure 1.6.B) as financing remained constrained—even after larger external grants and exceptional emergency and concessional financing (including from the IMF). Many governments reprioritized spending—for example, 60 percent of countries in the group cut capital expenditures as a ratio of GDP levels projected before the COVID-19 pandemic. Less severe economic contractions compared with advanced economies have served as mitigating factors. Spending needs are expected to rise for vaccination and safety nets, in addition to financing requirements for preexisting development goals.
In 2021, the average fiscal deficit is projected to decline to 4.9 percent of GDP. As economies recover, revenue collection is projected to improve. Capital spending is expected to recover partially in most countries after the temporary cuts in 2020 (Guinea, Haiti, Malawi, Nigeria, Tajikistan). However, deficits are expected to widen in a few countries as rev-enue-to-GDP ratios only partially recover, while spending and debt-service costs continue to rise (Kenya). Over the medium term, the average fiscal deficit is projected to return to its prepandemic level by 2026, largely aided by revenue increases (Republic of Congo, Haiti, Lao P.D.R.). Average expenditure is projected to broadly stabilize, although some countries with high public debt ratios are projected to restrain spending to secure debt sustainability (Republic of Congo, Mozambique, Zambia). In the absence of renewed policy efforts domestically and internationally, achieving the SDGs by 2030 would be extremely difficult.
Near-term debt vulnerabilities remain high. Financ-ing large deficits is challenging, given limited market access and restricted ability to increase revenues in the near term. Average debt levels are projected to peak in 2021 while continuing to climb in some countries. Nonetheless, average debt is projected to stabilize over the medium term, with elevated debt service relative to tax revenues in many countries (exceeding 20 per-cent in Ghana, Kenya, Nigeria, and Zambia) and debt distress risks in several others. Actions were taken in 2020 to provide low-income developing countries with
©International Monetary Fund. Not for Redistribution
9International Monetary Fund | April 2021
C H A P T E R 1 T A I L O R I N G F I S C A L R E S P O N S E S
grants, concessional loans, and debt relief to address a steep rise in public debt. Beneficiaries included 38 countries (out of 70) assessed to be at high risk of or in debt distress, according to the IMF–World Bank Debt Sustainability Assessments. Fiscal adjustments in several countries (Vietnam) and debt restructuring (Chad, Republic of Congo) are expected to contribute to debt reduction. As of the end of December 2020, 45 countries (or more than 60 percent of eligible countries) had requested to join or extend the Debt Service Suspension Initiative, benefiting from the sus-pension of $5 billion total debt service (or an average of 0.6 percent of countries’ public debt) as reported by the Group of Twenty (G20) economies for May through December 2020.
Risks to the Fiscal Outlook
Risks to the fiscal outlook abound on both sides. On the upside, faster-than-expected vaccinations, particularly in emerging market and developing econo-mies, could bring an end to the pandemic sooner than assumed in the baseline, boosting revenue collections and allowing governments to unwind temporary lifelines sooner. On the downside, risks include a more protracted economic downturn, abrupt tightening of financing conditions amid high debt, or materialization of contingent liabilities from liquidity support mea-sures, volatile swings in commodity prices, and rising social discontent. Risks are intertwined and reinforce one another. • Protracted economic downturn: Growth could be
weaker if implementation of the announced mea-sures lags or if lockdowns from renewed waves of infections persist. Delays in vaccine deployment and lower vaccine efficacy against new variants of the virus could dampen hopes of a quick exit from the pandemic and increase the scale of long-term scarring. For example, an adverse scenario pre-sented in the April 2021 World Economic Outlook shows that high and rising infections would further restrict mobility and activity, leading to 0.5–1 percentage point lower growth in 2021–22 than the baseline and larger fiscal deficits and debt. A premature scaling back of policy support would likely cause losses in employment and income, particularly exacerbating poverty and inequality for vulnerable individuals, such as informal workers and low- income groups.
• Abrupt tightening of financing conditions: Higher and rising debt leaves governments and nonfinancial firms more exposed to abrupt changes in financ-ing conditions from the current accommodative levels. An abrupt surge in yields—possibly driven by diverging paths of recovery (with China and the United States recovering faster than others), policy response to higher inflation expectations, or inves-tors losing confidence in fiscal policy credibility or debt repayment capacity—could worsen financing constraints for emerging market and developing economies, particularly those with large financing needs or debt denominated in foreign currency (April 2021 Global Financial Stability Report).
• Materialization of contingent liabilities: Nearly 40 percent of global fiscal support constitutes governments’ liquidity support measures through provision of loans or guarantees, equity injections, and other forms of quasi-fiscal operations, including through public corporations. Although liquidity support has helped limit bankruptcies, calls on government guarantees or widening losses in state-owned enterprises could cause contingent liabilities to materialize that could eventually weaken gov-ernment balance sheets (Box 1.1; Mbaye, Moreno Badia, and Chae 2018). Surges in bankruptcies could further strain public balance sheets through corporate-bank-sovereign links.
• Volatility in commodity prices: Renewed weakness in commodity prices could worsen the revenue out-look, posing challenges to already stretched budgets in commodity-exporting countries.
• Rising social discontent: Social tensions could erupt as the pandemic or an inadequate policy response—including unequal access to vaccines—lead to more deaths or socioeconomic hardship (unemployment, poverty, malnutrition, inequality, food shortages, or price increases) and exacerbate deep-rooted discontent. These factors could weaken the trust in and policy effectiveness of governments and put public finances at risk.
Effectiveness of Discretionary Fiscal Policy Responses to COVID-19
The size, composition, and duration of fiscal sup-port has varied across countries (Figure 1.7, panel 1) and has influenced its effectiveness. Of the $16 tril-lion in global pandemic-related fiscal actions taken
©International Monetary Fund. Not for Redistribution

F I S C A L M O N I T O R: A F A I R S H O T
©International Monetary Fund. Not for Redistribution
10 International Monetary Fund | April 2021
through March 17, 2021, $10 trillion consists of additional spending and forgone revenue, and $6 tril-lion of government loans, guarantees, and capital injections. Among G20 advanced economies, half of the above-the-line support was devoted to employ-ment protection and household income support (Figure 1.7, panel 2). Among emerging market econ-omies, public works (typically aimed at infrastructure investment) and employment protection received the most support. In G20 advanced economies, large firms benefited more from government support (dominated by guarantees and quasi-fiscal activities). Many advanced economies have announced multiyear fiscal actions with revenue and spending measures of 6 percent of GDP in 2021 to contain the health crisis, provide lifelines, and support the recovery. In contrast, pandemic-related fiscal support in emerging
market economies has been frontloaded (Figure 1.7, panel 3). A large part of fiscal support is expiring (Brazil, China) and in only a few cases is it being replaced with new measures or substantial extension of existing programs (France, Japan, Spain, United States) (Figure 1.7, panel 4). The rest of this section assesses how effective support measures have been in mitigating the adverse impact of the pandemic on output, employment, and incomes.
Output effects of fiscal measures. Empirical analysis suggests that government spending and revenue actions have prevented a more severe global economic contraction— including through spillovers. It is estimated that, at the global level, such actions have mitigated the fall in global growth in 2020 by 2 per-centage points (Chudik, Mohaddes, and Raissi 2021). The effect of the fiscal actions is likely stronger as
Additional spending andforgone revenueLoans, equity, and guarantees
G20 advanced economiesG20 emerging market economies
2020 2021 2022 and beyondTotal revenue and spending measures
ExtendedExpiredMeasures in place
Sources: IMF, Fiscal Monitor Database of Country Fiscal Policies in Response to COVID-19; and IMF staff estimates.Note: Data refer to fiscal measures announced between January 2020 and March 17, 2021. AEs = advanced economies; EMs = emerging market economies; G20 = Group of Twenty; LIDCs = low-income developing countries; SMEs = small and medium enterprises.
AEs EMs LIDCs G20 Global
Additional spending andforgone revenue
Heal
th c
are
Hous
ehol
ds
Empl
oym
ent
Larg
er fi
rms
SMEs
Publ
ic w
orks
Hous
ehol
ds
Larg
er fi
rms
SMEs
Larg
er fi
rms
SMEs
Hous
ehol
ds
Equityand loans
Guarantee andquasi-fiscal
activities
Aust
ralia
Fran
ce
Japa
n
Spai
n
Unite
d St
ates
Arge
ntin
a
Braz
il
Chin
a
Mex
ico
G20
16
18
14
12
10
8
6
4
2
0
40353025201510
50
181614121086
24
0
24211815129630
20
15
10
5
0
1. Size of Fiscal Support(Percent of 2020 GDP)
2. Types of Beneficiaries(Percent of total)
3. Time Horizon of Revenue and Spending Measures(Percent of 2020 GDP)
4. Expiration and Extension Status of Revenue and SpendingMeasures for Selected Countries(Percent of 2020 GDP)
The size, nature, and duration of fiscal support varied significantly across countries.
Mex
ico
Turk
eySa
udi A
rabi
aIn
dia
Arge
ntin
aRu
ssia
Kore
aIn
done
sia
Chin
aSo
uth
Afric
aSp
ain
Fran
ceIta
lyBr
azil
Germ
any
Cana
daJa
pan
Aust
ralia
Unite
d Ki
ngdo
mUn
ited
Stat
esLI
DCs
EMs
G20
AEs
Rightscale
Leftscale
Figure 1.7. Government Fiscal Support in Response to COVID-19, 2020–21
11International Monetary Fund | April 2021
C H A P T E R 1 T A I L O R I N G F I S C A L R E S P O N S E S
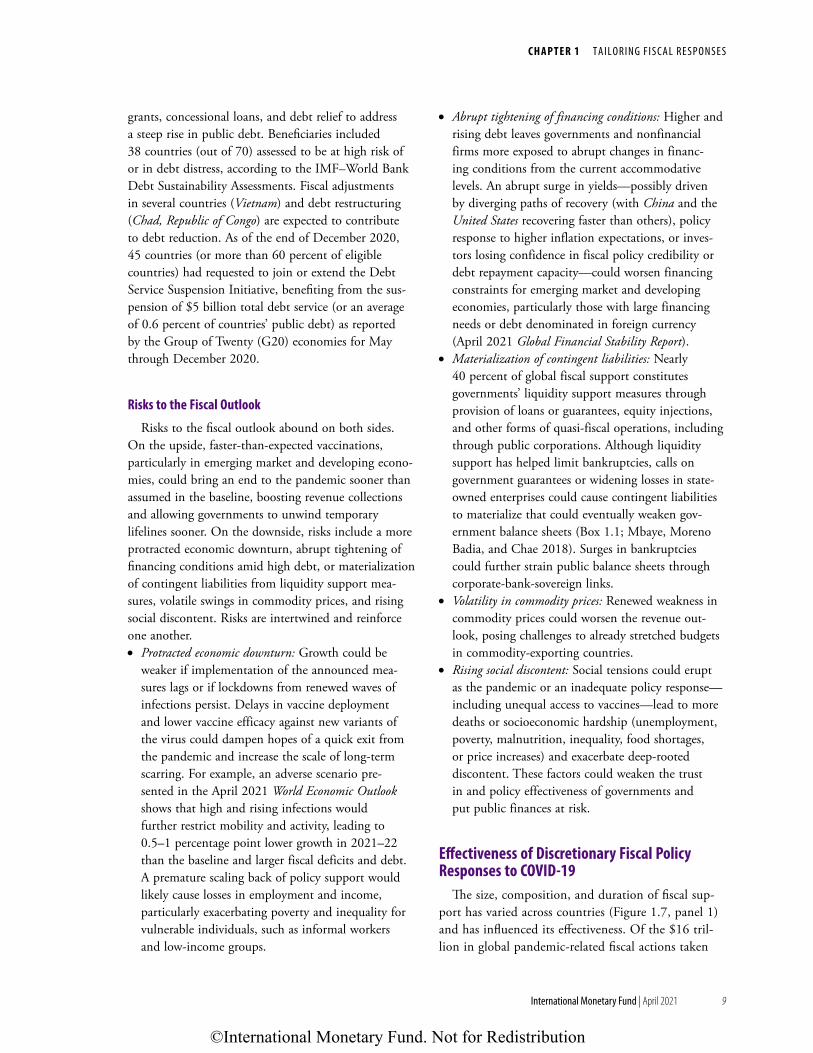
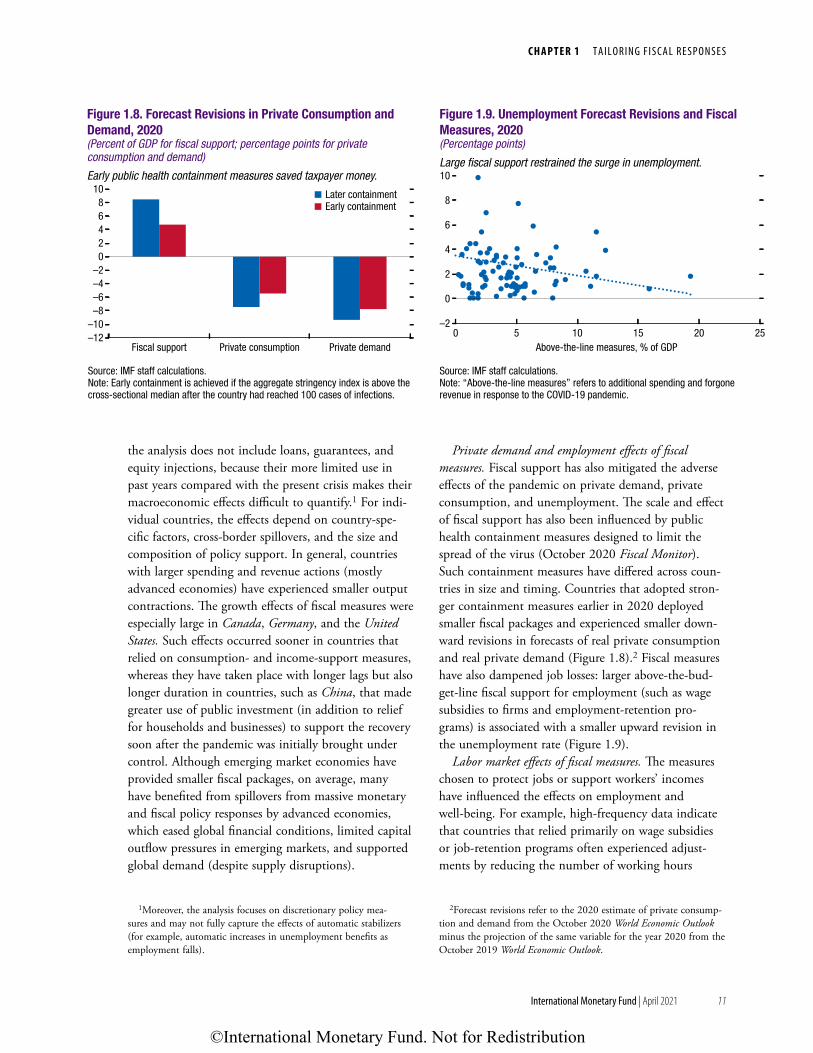
the analysis does not include loans, guarantees, and equity injections, because their more limited use in past years compared with the present crisis makes their macroeconomic effects difficult to quantify.1 For indi-vidual countries, the effects depend on country-spe-cific factors, cross-border spillovers, and the size and composition of policy support. In general, countries with larger spending and revenue actions (mostly advanced economies) have experienced smaller output contractions. The growth effects of fiscal measures were especially large in Canada, Germany, and the United States. Such effects occurred sooner in countries that relied on consumption- and income-support measures, whereas they have taken place with longer lags but also longer duration in countries, such as China, that made greater use of public investment (in addition to relief for households and businesses) to support the recovery soon after the pandemic was initially brought under control. Although emerging market economies have provided smaller fiscal packages, on average, many have benefited from spillovers from massive monetary and fiscal policy responses by advanced economies, which eased global financial conditions, limited capital outflow pressures in emerging markets, and supported global demand (despite supply disruptions).
1Moreover, the analysis focuses on discretionary policy mea-sures and may not fully capture the effects of automatic stabilizers (for example, automatic increases in unemployment benefits as employment falls).
Private demand and employment effects of fiscal measures. Fiscal support has also mitigated the adverse effects of the pandemic on private demand, private consumption, and unemployment. The scale and effect of fiscal support has also been influenced by public health containment measures designed to limit the spread of the virus (October 2020 Fiscal Monitor). Such containment measures have differed across coun-tries in size and timing. Countries that adopted stron-ger containment measures earlier in 2020 deployed smaller fiscal packages and experienced smaller down-ward revisions in forecasts of real private consumption and real private demand (Figure 1.8).2 Fiscal measures have also dampened job losses: larger above-the-bud-get-line fiscal support for employment (such as wage subsidies to firms and employment- retention pro-grams) is associated with a smaller upward revision in the unemployment rate (Figure 1.9).
Labor market effects of fiscal measures. The measures chosen to protect jobs or support workers’ incomes have influenced the effects on employment and well-being. For example, high-frequency data indicate that countries that relied primarily on wage subsidies or job-retention programs often experienced adjust-ments by reducing the number of working hours
2Forecast revisions refer to the 2020 estimate of private consump-tion and demand from the October 2020 World Economic Outlook minus the projection of the same variable for the year 2020 from the October 2019 World Economic Outlook.
Later containmentEarly containment
Source: IMF staff calculations.Note: Early containment is achieved if the aggregate stringency index is above the cross-sectional median after the country had reached 100 cases of infections.
Figure 1.8. Forecast Revisions in Private Consumption and Demand, 2020(Percent of GDP for fiscal support; percentage points for private consumption and demand)
Early public health containment measures saved taxpayer money.
–12–10–8–6–4–2
02468
10
Fiscal support Private consumption Private demand
Source: IMF staff calculations. Note: “Above-the-line measures” refers to additional spending and forgone revenue in response to the COVID-19 pandemic.
Figure 1.9. Unemployment Forecast Revisions and Fiscal Measures, 2020 (Percentage points)
Large fiscal support restrained the surge in unemployment.
–2
0
2
4
6
8
10
Above-the-line measures, % of GDP 0 5 10 15 20 25
©International Monetary Fund. Not for Redistribution

12 International Monetary Fund | April 2021
F I S C A L M O N I T O R: A F A I R S H O T
(France, Germany, Italy, United Kingdom), whereas more jobs were lost in countries that extended unem-ployment benefits (Canada, United States), although lost incomes were largely replaced (Figure 1.10).
The long-term implications of different forms of labor market support also depend on the duration of the pandemic. Whereas job-retention programs are powerful at reducing separations and preserving ulti-mately viable job matches, they could, if such programs are overextended, hamper reallocation to the jobs that will be created in the postpandemic era (Barrero, Bloom, and Davis 2020). High-frequency data show that job-retention programs have so far adjusted flexibly in line with an increase in working hours—as reflected in a decline in the take-up of such programs relative to the spring of 2020 (Figure 1.11). The effects of recent extensions of job-retention programs remain to be seen. Another risk is that wage subsidies have postponed—rather than averted— layoffs that could occur when support is withdrawn. For countries that relied largely on unemployment benefits, displaced workers may ultimately be structurally unemployed if their skills erode before job creation resumes. Effective support would, therefore, need to be adjusted over time to account for these trade-offs and the evolving path of the pandemic, with support relying more on realloca-tion measures during the recovery phase (Chapter 3 of the April 2021 World Economic Outlook).
The effect of fiscal measures on social safety nets. Additional social protection spending in response to the COVID-19 pandemic was 0.6 percent of GDP on average during the first three quarters of 2020, including to widen social safety nets (Gentilini and others 2020). Increased social protection spending has mitigated the rise of global extreme poverty by about 10 million people (October 2020 Fiscal Monitor). The effectiveness of social safety nets can be assessed along several dimensions, including coverage, adequacy, and cost efficiency. During the COVID-19 crisis, the share of the population covered by social safety nets has increased in emerging market and developing economies, with significant cross-country variation (Figures 1.12 and 1.13). Some countries, such as the Philippines, have reached a large portion of the population through social assistance to low-income households, displaced workers, and small businesses. In addition to broader coverage, the existing beneficia-ries of social safety nets have received higher trans-fers as well, resulting in improved adequacy levels in 2020. Across regions, Middle East and North African countries have recorded the highest rise in coverage but the lowest increases in terms of adequacy of benefits— reflecting untargeted support (for example, subsidies) for many countries in the region. In Latin American and Caribbean countries, adequacy levels doubled while keeping a relatively high coverage of the population.
DEU FRA ITA USA CAN BRA CHL ZAF
Sources: Eurostat; and Haver Analytics.Note: Data labels use International Organization for Standardization (ISO) country codes.
Figure 1.10. Effects of the Pandemic on Employment, 2019:Q1–2020:Q3(Index; 2019:Q1 = 100)
Countries with extensive job-retention programs experienced fewer job losses.
70
75
90
80
95
85
100
105
110
2019:Q1 19:Q2 19:Q3 19:Q4 20:Q1 20:Q2 20:Q3
At peak Latest (2020:Q4)
Sources: The Financial Times; Organisation for Economic Co-operation and Development; UK Office of National Statistics; and University of Oxford.Note: Data labels use International Organization for Standardization (ISO) country codes.
Figure 1.11. Take-Up of Job-Retention Schemes for Selected Advanced Economies(Percent of employees)
Take-up of job-retention programs has fallen from peak levels.
0
50
40
30
20
10
ITA FRA NLD GBR BEL AUT IRL ESP DEU
©International Monetary Fund. Not for Redistribution

13International Monetary Fund | April 2021
C H A P T E R 1 T A I L O R I N G F I S C A L R E S P O N S E S
Despite these efforts, preexisting gaps in social protec-tion systems could hamper cost efficiency and should be addressed durably (for example, by reducing leak-ages of benefits to high-income groups and program fragmentation and by expanding coverage).
Near-Term Policies: Win the Vaccination Race and Target Support More Effectively
The strength of the recovery hinges on when the pandemic is controlled and how policy support will continue. It is, therefore, imperative to ensure that health care systems everywhere are adequately resourced and that global cooperation on producing and dis-tributing vaccines to all countries at affordable prices is reinforced, particularly because many low- income countries rely on external grants to finance their vacci-nation plans. Vaccines are a global public good. Efforts to increase funding for COVAX—the multilateral mechanism for equitable access to vaccines— must be scaled up. The sooner global vaccinations control the pandemic, the quicker economies can return to normal and will need less government support. Under the April 2021 World Economic Outlook upside scenario in
which faster global vaccination brings the virus under control sooner, the global gain in GDP is $9 trillion cumulatively through 2025, with two-fifths of that gain accruing to advanced economies. Assuming a tax-to-GDP ratio of 30 percent on average and unit elasticity of revenues with respect to output, this would translate to a $1 trillion cumulative gain in revenues for advanced economies, plus savings from reduced spend-ing on lifelines for people and firms. Such an increase would provide an excellent return on investment for public money, paying for itself, given that the cost of global vaccination is estimated in the tens of billions of dollars.
As lockdowns become increasingly more localized and recoveries accelerate, lifelines should be better targeted and focus on people still significantly affected by the pandemic. As economies open up, support policies should rotate toward structural transformation (for example, supporting vocational training, providing hiring incentives, or facilitating the balance sheet repair of nonfinancial firms).
Under current policies, many programs are set to expire before the race between vaccinations and new waves of infections end. Countries need to maintain
Prepandemic coverage
Prepandemic adequacy (right scale)Current coverage
Current adequacy (right scale)
Sources: Gentilini and others 2020; World Bank ASPIRE; and IMF staff estimates.Note: Adequacy is the total transfer amount received by beneficiaries as a share of pretransfer total income and coverage denotes the share of population that receives social assistance. AP = Asia and Pacific; EMs = emerging markets; EUR = Europe; LAC = Latin America and the Caribbean; LIDCs = low-income developing countries; MENA = Middle East and North Africa; SSA = sub-Saharan Africa.
EMs LIDCs AP EUR LAC MENA SSA
100
80
60
40
20
0
25
20
15
10
5
0
Social safety nets expanded during the pandemic.
Figure 1.12. Adequacy and Coverage of Social Safety Nets(Percent of eligible beneficiaries, left scale; percent of household pretransfer income, right scale)
EMsLIDCs
Sources: Gentilini and others 2020; World Bank ASPIRE; and IMF staff estimates.Note: Coverage denotes the share of population that receives social assistance. Some countries have a high coverage (sometimes exceeding 100 percent of the population) owing to program duplications. Those exceeding 100 percent of the population are excluded. Post–COVID-19 data are constructed by adding COVID-19 social assistance to pre–COVID-19 information. Data labels use International Organization for Standardization (ISO) country codes. EMs = emerging markets; LIDCs = low-income developing countries.
0 2.5 5 10 15 25 35 45 55 65 100958575
16
14
12
10
8
6
4
2
0
Coverage of safety nets rose across the board, but to varyingdegrees.
Figure 1.13. Coverage of COVID-19 Social Assistance(Percent of countries, vertical axis; percent of population, horizontal axis)
ETH
KEN
SDN
CHN
BRA
IND
PHL
©International Monetary Fund. Not for Redistribution

14 International Monetary Fund | April 2021
F I S C A L M O N I T O R: A F A I R S H O T
support measures flexibly but refine their design and eligibility criteria as trade-offs between policy instru-ments (for example, job-retention programs versus income-support programs) evolve according to the path of the pandemic. Support measures should there-fore focus on the most vulnerable households and via-ble or systemic firms and on helping workers prepare for the post-COVID-19 economy. Emergency life-lines should be withdrawn only gradually where local transmission has been persistently low and activity has begun to normalize. If policy space permits, resources freed from expiring lifelines can be reallocated to support the recovery and structural transformation (Chapter 3 of the April 2021 World Economic Outlook). Yet, if the pandemic and economic indicators worsen, withdrawal of support should be paused or reversed. Measures may need to be extended with contingent spending plans through supplementary budgets or established COVID-19 contingency funds. Ensuring transparency in usage and carefully managing fiscal risks from contingent liabilities will be crucial given their scale, coverage, and novelty (IMF 2020e).
More targeted support to vulnerable households. The pandemic has had a disproportionately adverse effect on poor people, youth, women, minorities, and workers in low-paying jobs and the informal sector (Chapter 2). Policymakers should ensure social protec-tion spending is sustainable over the potential duration of the crisis and enhance the effectiveness of such spending through better targeting: • Improving the coverage of social safety nets in a
cost-effective way can be achieved by limiting the leakage of benefits to unintended beneficiaries. Other options include enhanced means testing in advanced economies and proxy means testing in emerging market and developing economies, whereby targeting is improved by identifying needy households on the basis of characteristics strongly associated with welfare, such as household size and composition, age of the household head, number of dependents, employment status, position of significant assets, and so on (Coady and Le 2020). Countries can use instruments that are effective in reaching individuals most in need, including individuals in the informal sector. For example, two-thirds of workers in the informal sector in sub-Saharan Africa do not have access to banking or other financial services. Effective instruments could therefore include government-to-person payments,
mobile money, in-kind transfers such as food assistance, basic education and health care services, matching databases of beneficiaries to create a single registry, and use of community-based methods to identify needy households.
• Increasing the progressivity of net transfers by reducing the benefit withdrawal rate as earnings increase would improve the design of safety net programs. Beyond social safety nets, there is opportunity to extend unemployment benefits for longer periods (but possibly at reduced levels) and to implement gender budgeting.
Support to otherwise viable nonfinancial firms. Gov-ernment support to nonfinancial firms in 2020 was timely, and it reduced liquidity shortages, job losses, and bankruptcies (Ebeke and others 2020). However, with limited information about firms’ viability, the support was sometimes not sufficiently targeted. For example, one-fifth of nonfinancial firms that received government support did not experience a large direct adverse effect on their operations, leading to substantial mismatches in access to public credit or other liquidity programs (Cirera and others 2021; Figure 1.14). In some cases, low demand, administration capacity con-straints, or conditionality contributed to a low take-up rate of loan guarantees (Germany, United States).
Sources: Cirera and others 2021; World Bank, Business Pulse and Enterprise Surveys data.Note: “No shocks suffered” refers to firms that did not experience business closure or a decrease in sales relative to before COVID-19.
Figure 1.14. Nonfinancial Firms’ Access to Public Support, by Size and Type of Shock(Percent)
Firm size
Prob
abili
ty o
f acc
ess
to s
uppo
rt
40
30
20
10
0
Larger firms had better access to support. Many firms received support although they were not directly affected by the COVID-19 pandemic.
21 2023 23 23
2932
34
Micro Small Medium Large Small MediumMicro Large
No shocks suffered Suffered demand orsupply shocks
©International Monetary Fund. Not for Redistribution

15International Monetary Fund | April 2021
C H A P T E R 1 T A I L O R I N G F I S C A L R E S P O N S E S
Various liquidity programs have covered one-quarter of the surveyed nonfinancial firms, with larger firms being more likely to receive public support than small and medium-sized enterprises.
As the pandemic persists, governments need to tailor policies that prevent resource misallocation and limit the rise of low-productivity firms that depend on government assistance for survival. The size and type of support will also depend on available fiscal space, type of firm, and the ability of governments to manage programs involving a large number of firms (Box 1.2). Governments should also roll back blanket loans and guarantees, and public support should be limited to circumstances in which there is a clear market fail-ure. Examples include when a high degree of uncer-tainty deters the flow of funds from banks and capital markets to nonfinancial firms in the absence of gov-ernment assistance, or when private sector participants fail to internalize the cost to society of widespread bankruptcies and job losses, or when private and public sector mechanisms are not adequate to resolve insolvency problems in a timely and effective way. To tackle the risk of widespread insolvencies, (quasi) equity injections such as junior “profit participation” loans could be considered, if fiscal space permits and capacity to reach and monitor the intended firms exists (Díez and others 2021).
Budget needs are expected to remain sizable, includ-ing for widespread vaccinations; continued provision of targeted lifelines adapted to recurring waves of contagion; and broad-based demand support, depend-ing on fiscal space and macroeconomic conditions as economies emerge from the pandemic. These challenges will pose formidable policy trade-offs for policymakers— especially in highly indebted emerging market and developing economies that face tight financing constraints and have limited capacity for social protection and domestic revenue mobilization. The situation is even more precarious in fragile states or countries that are at risk of debt distress, limiting the scope for near-term support. In addition to repri-oritizing noncritical spending and seeking efficiency gains, several countries will need assistance from the international community, including grants, conces-sional and emergency loans, and, in some cases, debt restructuring of commercial and official debt. Quickly implementing the G20 Common Framework for Debt Treatments and widening its country coverage of eligible debtors is thus necessary.
Broader Policy Priorities: Anchor Fiscal Support, Transition to a New Post-COVID-19 Economy, and Address Crisis Legacies
The trade-off between continuing to support the economy in the near term and strengthening fiscal positions over time can be made more palatable within credible medium-term fiscal frameworks attuned to economic developments. For example, in countries where recovery is faster and more complete than expected, lifelines could be withdrawn faster and fiscal buffers built more quickly. Once the recovery is firmly in place, calibrated consolidation strategies— supported by pro-growth and inclusive measures—should be implemented. This is especially true in advanced economies that face elevated debt levels and structural pressures such as those related to aging. In highly indebted emerging market and developing economies, low-for-long interest rates are not assured and investor appetite may disappear quickly; large financing needs, foreign currency denomination, and short maturity can be amplifying factors. Early devel-opment and announcement of such strategies could create more near-term fiscal space for maneuver while anchoring fiscal sustainability. Commitment devices, such as strengthened rules-based or principles-based fiscal frameworks with increased transparency and accountability mechanisms and legislation such as “preapproval” of future tax reforms can also enhance policy credibility. The use of escape clauses or tem-porary suspension of fiscal rules has provided many countries with flexibility in accommodating fiscal sup-port during the pandemic (Box 1.3). To avoid under-mining the credibility of rules-based fiscal frameworks, countries should clearly communicate pathways for reinstating the rules (and, in some cases, recalibrate the rules’ limits or improve their design) and reducing deficits and debt below the required limits.
In low-income developing countries, achieving debt sustainability while addressing development needs requires raising domestic revenues, improving spending efficiency, and facilitating private sector activity through structural reforms and improvements in governance and the rule of law. The COVID-19 pandemic has set back countries’ progress toward achieving the SDGs. Financing needs for SDGs were already large before the pandemic and, based on an in-depth analysis of four low-income countries and emerging market economies, would likely rise further by 2.5 percentage points to 4 percentage points of
©International Monetary Fund. Not for Redistribution

16 International Monetary Fund | April 2021
F I S C A L M O N I T O R: A F A I R S H O T
GDP in those countries, depending on the potential scarring effects of the pandemic (Benedek and others 2021). Revenue collection should be bolstered through a medium-term revenue strategy in which both tax policy and revenue administration efforts are well coor-dinated. Measures include implementing well-designed value-added taxes with timely refunds; building capac-ity for property taxation; gradually expanding the base for corporate and personal income taxes, including by eliminating costly tax exemptions; and efficiently taxing extractive industries (IMF 2019a). Adopting a comprehensive risk-based strategy (by focusing on large taxpayers) could improve compliance. Concerns that the value-added tax would affect low-income house-holds disproportionately can be better addressed by strengthening social safety nets (Chapter 2).
The effect of the crisis on countries’ public finances also reinforces the need to improve debt manage-ment and transparency. Advanced economies and some emerging markets could lock in historically low borrowing costs and extend average debt maturities. Low-income countries should close gaps in their debt operations, including weak legal frameworks, lack of operational risk management, insufficient audits, and incomplete coverage of debt statistics (particularly debt contracted through autonomous public entities, extrabudgetary funds, and state-owned enterprises that remains off budget). Further efforts are needed to man-age risks and keep up with the evolving complexity of public debt structures. Measures include publishing
regular debt reports, broadening the coverage of debt statistics, and limiting risks from contingent liabilities. All governments need to monitor and manage fiscal risks associated with pandemic-related support (which, if realized, would further add to public debt) and disclose contingent liabilities comprehensively.
A well-designed and timely fiscal package can support an inclusive economic recovery while reduc-ing public debt over time. Model simulations for a typical advanced economy or an emerging mar-ket with manageable financing costs—calibrated to roughly match the deep contraction of global GDP in 2020—could help inform the design of such a package (Online Annex 1.1). The simulations consist of temporary transfers to lower-income households, frontloaded public investment, and higher labor income taxes in the medium term. The model offers two distinctive insights. First, timing is critical. It is beneficial to provide greater short-term fiscal sup-port when interest rates are low and economic slack is high and to strengthen fiscal positions once a recovery is under way. Second, the composition of measures matters. Reliance on high-multiplier expen-diture measures and progressive personal income taxation can raise growth and mitigate income inequality while containing the increase in public debt over time. Transfers boost income and con-sumption for low-income households, and increased taxes are borne by high-income households over the medium term (Figure 1.15).
BaselineBenchmark package
BaselineBenchmark package
BaselineBenchmark package
–6
–4
–2
0
2
–7
–5
–3
–1
1
3
98
99
100
101
102
Source: IMF staff estimates.Note: The baseline has no additional fiscal actions relative to what was deployed in 2020. The benchmark package consists of targeted transfers to low-income households (2 percent and 1.5 percent of GDP for years one and two, respectively), public investment (0.5 percent of GDP for the first two years and declining gradually), and a delayed increase in labor income tax rates for high-income households by 0.5 percentage points at the peak (Online Annex 1.1).
1. Output(Percent deviation from the precrisis level)
2. Consumption, Lower-Income Group(Percent deviation from the precrisis level)
3. Public Debt(Percent of GDP)
Figure 1.15. Balancing Greater Short-Term Support and Medium-Term Fiscal Discipline
Years1 2 3 4 5 6 7 8 9 10 1 2 3 4 5 6 7 8 9 10 1 2 3 4 5 6 7 8 9 10
Years Years
Simulations show that a well-designed fiscal package can raise growth and mitigate income inequality while containing the increase in public debt over time.
©International Monetary Fund. Not for Redistribution

17International Monetary Fund | April 2021
C H A P T E R 1 T A I L O R I N G F I S C A L R E S P O N S E S
At present, a deep recession and accommodative monetary policy would increase the size of multipliers (Auerbach and Gorodnichenko 2012; Erceg and Lindé 2014), but high public debt and pandemic-induced supply constraints tend to lower it (Bi, Shen, and Yang 2016). The fiscal package discussed previously and in Online Annex 1.1 would increase output with a two-year cumulative output multiplier of slightly more than 1, considering the low-interest-rate envi-ronment and accommodative monetary stance, spike in unemployment and its partial recovery, firm-level excess capacity, and composition of fiscal measures— including targeted transfers to those who are more likely to spend rather than save them. The long-term multiplier could be close to 2, assuming a persistent increase in productive public investment. However, many other factors could affect the size of fiscal multi-pliers, including mobility restrictions, the productivity of public capital, the efficiency of public investment, the size of economic slack, and government indebted-ness (October 2020 Fiscal Monitor).
Another factor is the timing and quality of the spending mix, including frontloaded public invest-ment. Postponing quality public investment will likely limit the expansionary effect of targeted transfers because of its knock-on effects on private firms’ incen-tives to invest (given that public capital is comple-mentary to private investment in a low-interest-rate environment). In addition, delaying the push for high-return public investment would increase aggre-gate demand when the recovery is more advanced and interest rates are likely higher. This would make the same public investment less expansionary. Thus, for countries with fiscal space, an early push for quality public investment maximizes its growth effects. Refin-ing the pipeline of appraised projects and resolving bottlenecks can help with scale-up. As a priority, pandemic-related investments in health care and vaccination should be maintained.
When the recovery is under way, policy should increasingly change focus to rebuilding buffers and reducing debt vulnerabilities. Model simulations illus-trate several factors related to the quality and timing of short-term support, long-term adjustment needs for debt stabilization, and instrument choices. Medium- term adjustment needs, in particular, would be smaller if short-term support is based on high- quality and frontloaded measures (as outlined previously and detailed in Online Annex 1.1). Fiscal positions
strengthened through more progressive personal income taxation over the medium term tend to be more equita-ble. In contrast, fiscal adjustments through higher cap-ital income tax rates (if not on rents) generate a fiscal multiplier below 1 in the long term. Although raising capital income tax rates can mitigate income inequality (as can more progressive labor income taxes in the benchmark package), it has a stronger negative effect on private investment and, hence, long-term growth.
As part of recovery efforts, expenditures could be prioritized toward measures that bolster inclusive and robust growth, such as an investment push by econ-omies with fiscal space. Investment projects—ideally with the participation of the private sector—should aim at mitigating climate change and facilitating digitalization, and can be partly financed with higher carbon taxes (October 2019 and October 2020 Fiscal Monitor). In low-income countries, green investment can be facilitated through official support, especially if combined with domestic and international private finance and improved public investment management frameworks. Strengthening social safety nets and addressing the weaknesses in tax systems—including by improving progressivity in domestic taxes and reform-ing international tax systems—could support inclusive growth. Progressivity and revenue performance could be improved through broader tax bases; more progres-sive personal income taxation; more neutral capital taxation; improvements in the design of value-added taxes; more and better use of carbon, property, and inheritance taxes; digital enhancements; and institu-tional strengthening to enable revenue administrations to implement and manage these tax reforms (de Mooij and others 2020; IMF 2019b; October 2019 Fiscal Monitor; October 2020 World Economic Outlook). The appropriate mix of measures would depend on individ-ual countries’ tax systems, the size of informal sector, and other economic structures. On international tax, reaching a political agreement under the Organisa-tion of Economic Co-operation and Development’s “Inclusive Framework” will help prevent unfettered tax competition that undermines revenue mobilization efforts and a proliferation of unilateral measures that could catalyze tax or trade wars with large economic costs (Box 1.4).
As vaccinations advance and economies recover, fiscal policy needs to focus on enabling a green, digital, and inclusive transformation of the economy, while managing fiscal and financing risks. Priority areas
©International Monetary Fund. Not for Redistribution

18 International Monetary Fund | April 2021
F I S C A L M O N I T O R: A F A I R S H O T
include (1) investing for the future and improving health care and education outcomes; (2) facilitating the reallocation of labor and capital; (3) improving the coverage and adequacy of social protections in a cost-effective way—thereby countering the rise of inequality and poverty (Chapter 2); (4) reforming tax systems, including at the international level; and
(5) reducing debt vulnerabilities and enhancing debt transparency. Once the recovery is firmly in place, long-standing weaknesses in public finances must be tackled by rebuilding fiscal buffers, addressing crisis legacies, and in low-income developing countries, renewing efforts to achieve the SDGs that have suf-fered a setback during the pandemic.
©International Monetary Fund. Not for Redistribution

19International Monetary Fund | April 2021
C H A P T E R 1 T A I L O R I N G F I S C A L R E S P O N S E S
Since the onset of the COVID-19 pandemic, governments have been advised to “Do what it takes, but keep the receipts” to protect lives and livelihoods (April 2020 Fiscal Monitor). Many countries have demonstrated a commitment to tracking and transpar-ently reporting on emergency COVID-19 spending1 and the IMF has provided advice on how to keep (and verify) the receipts (IMF 2020a). This box highlights innovative practices implemented by various coun-tries in the following areas: (1) tracking COVID-19 spending; (2) ensuring transparency of COVID-19 responses, including for procurement contracts; and (3) auditing COVID-19 spending.
Tracking COVID-19 spending: Where possible, countries have built on recent reforms of their public financial management systems to implement ad hoc measures and track, report, control, and oversee their COVID-19 response: • Some countries have implemented their measures
through normal budget channels while adapting their budget nomenclature and programs and their financial management information systems to better track the budgeting and execution of these measures (IMF 2020b). Burkina Faso and France have used their programmatic budget frameworks to intro-duce specific COVID-19 programs or actions that cut across ministries and agencies. Countries with modern charts of accounts and financial manage-ment information systems, such as Honduras and Rwanda, have tagged COVID-19 spending in their information systems. Because some implementing agencies are off budget (for example, national devel-opment banks), other countries—such as Benin—have achieved more comprehensive monitoring with innovative tracking mechanisms beyond the perimeter covered by their financial management information systems.
• More than 40 countries have established dedicated COVID-19 funds to centralize their emergency response and keep an audit trail (IMF 2020c). Some countries—such as Botswana—have also made use of such funds to combine and track pub-lic and private support. A COVID-19 fund, backed by strong safeguards, can be a pragmatic approach
1In addition, countries have committed to publish informa-tion on COVID-19–related procurement contracts, including on the true owner (“beneficial ownership”) of the contracted companies, and to audit the COVID-19 response. The IMF has kept track of these commitments.
when public financial management systems are weak (for example, where key processes and controls are not automated). These safeguards include strong legal backing, a clear “sunset clause,” well-defined public financial management processes, and robust accounting and reporting standards. Learning from the Ebola crisis, Sierra Leone has set up such a fund, which contributed to the rapid deployment of emergency operations, and facilitated a recent real-time audit on the use of emergency funds by the country’s supreme audit institution (Audit Services of Sierra Leone 2020).Ensuring transparency of COVID-19 measures:
In addition to tracking and monitoring, it is equally important to demonstrate that funds have been effec-tively allocated and used for their intended purposes, particularly given the exceptional nature—in size, composition, and speed—of the fiscal response to COVID-19. Many countries across income groups have done so: • COVID-19–related information is typically
included in regular budget execution reports. For example, Austria includes COVID-19 spending and guarantees in its monthly budget report and provides information on COVID-19 response in its report on state-owned enterprises. But some countries, such as the Maldives, have prepared dedicated reports, sometimes on a weekly basis. Others—such as Colombia, France, Honduras, and Peru—have published spending information on dedicated transparency portals, providing a comprehensive picture of support expenditure that is updated promptly. Emerging good practice on transparency portals suggests that they provide an overview of the COVID-19 response (including off-budget measures), such as in the Philippines; show cross-sectional information on spending, such as in Brazil (for example, by administrative, economic, and functional groups; by beneficiary; and by region); and allow open access to microdata, such as in Paraguay and the United States.
• Countries such as Jordan and Papua New Guinea also publish information on procurement contracts, including their beneficial ownership, in line with their commitment when accessing IMF emergency funding. Countries such as Ecuador, Kenya, Kyrgyz Republic, and Nicaragua went further to amend their procurement legal framework to require the collection of beneficial ownership information for
Box 1.1. Keeping the Receipts: One Year On, Some Innovative Practices
©International Monetary Fund. Not for Redistribution
20 International Monetary Fund | April 2021
F I S C A L M O N I T O R: A F A I R S H O T
all contracts on a permanent basis. Countries such as Colombia, Honduras, and Ukraine have added a module in their e-procurement platforms that presents detailed information on all emergency procurement related to COVID-19.
• Civil society and the media have aided external oversight, making the data more easily available and, in some cases, complementing government efforts on transparency. In South Africa, where procure-ment data have been published by the government, volunteers disseminated the data by making it available on a platform called “Keep the Receipts.” The Latin American Journalists Network for Trans-parency and Anti-Corruption, Red PALTA, has used procurement data from seven Latin American countries to publish articles tracing overpricing and corruption in the purchase of medical equipment.Adequately scrutinizing and auditing COVID-19
spending: Legislatures and the public must be confi-dent that COVID-19 expenditures have been used as intended and that waste has been avoided. • To mitigate the relaxation of ex ante controls done
to respond swiftly to the pandemic (IMF 2020d), supreme audit institutions have stepped in to provide stronger and more timely ex post controls.
In Honduras, Peru, Sierra Leone, and South Africa, the respective supreme audit institutions have undertaken interim audits to uncover irregulari-ties and tackle governance vulnerabilities as they happen. These audits are bearing results. In South Africa, more than one-third of the auditees have taken actions to address identified irregularities; the Unemployment Insurance Fund has recov-ered R3.4 billion (US$220 million) of incorrect payments, and the president has set up a high-level task force to address allegations of corruption (Auditor General of South Africa 2020). In January 2021 the European Court of Auditors published a first review of the European Union’s emergency response until mid-2020 and announced that one-quarter of its audits in 2021 would focus on the European response to fighting the pandemic.
• Other independent watchdog institutions will ensure accountability of COVID-19 spending. In Austria, the Parliamentary Budget Office has spearheaded transparency efforts. In Kenya, the Ethics and Anti-Corruption Commission recently issued a report indicating that pro-curement laws were violated in the purchase of COVID-19–related supplies.
Box 1.1 (continued)
©International Monetary Fund. Not for Redistribution
21International Monetary Fund | April 2021
C H A P T E R 1 T A I L O R I N G F I S C A L R E S P O N S E S
As the COVID-19 pandemic dramatically changes household behavior and business operations, a growing share of firms, particularly small and medium-sized enterprises, are incurring sustained losses. If the pan-demic persists, widespread corporate insolvencies could follow, destroying millions of jobs and weakening the recovery (Díez and others 2021). This box highlights the key elements of support to firms:
Partnering with the private sector to assess the viability of firms: Where governments do not have the capacity to assess the financial health of each firm (especially small and medium-size enterprises), that function may be better served by the private banking sector, the capital markets, or even sovereign wealth funds or development banks. To avoid moral hazard among private lenders, loan guarantees should gradually be made partial.
Targeting support to viable firms (Figure 1.2.1): The April 2021 Global Financial Stability Report discusses how to identify illiquidity and solvency risks (applying to firms with access to capital markets or banks). Fiscal support to such firms (together with regulatory measures) would prevent a large increase of bankruptcies (Blanchard, Philippon, and Pisani-Ferry 2020; Gourinchas and others 2020). Governments could facilitate the restructuring of firms that have a viable business plan but are insolvent, for example, by making loan write-offs tax deductible for creditors. For firms that are difficult to reach, such as microenter-prises or those operating in the informal sector, gov-ernment support may need to be channeled through other means, including institutions that provide microcredit to households that own small businesses. Policymakers should allow a gradual process whereby nonviable firms shrink or close and new ones open, and some workers move between companies and sectors with help from targeted time-bound hiring subsidies, wage-loss insurance programs, and increased training. This could be facilitated by streamlined, standardized restructuring or bankruptcy procedures. Support could depend on objectives such as fostering digitalization and improving energy efficiency.
Encouraging greater reliance on equity financing:1 Government guarantees on bank loans should be reduced over time and linked to restrictions on div-idends and share buybacks. Guarantees or insurance could be offered for portfolios of privately funded and managed distressed assets rather than individual loans, and involve better risk pricing such that viable firms could access credit at lower rates. If the social cost of mass bankruptcies exceeds the private cost to debtors and creditors, governments could consider targeted quasi equity injections, including into small and medium-sized enterprises, such as through profit participation loans (Díez and others 2021). Govern-ments could also consider conversion of guaranteed debt into equity and quasi equity for highly indebted but viable firms, especially for large firms or cases with a strong economic and social rationale for inter-vention. For example, in Germany, the government has introduced a temporary “umbrella” program—authorized by the European Commission—that uses all classes of equity and hybrid instruments to support firms affected by the pandemic. Even so, government equity stakes come with potential costs for the firm (political interference), the government (oversight responsibilities and governance issues), and the econ-omy (competitive neutrality concerns) (April 2020 Fiscal Monitor). Experience during the global financial crisis suggests that government’s direct involvement in private balance sheet restructurings (for instance, by injecting equity capital or subordinating its tax or debt claims on firms) could, in some cases, prevent tail-risk events (October 2009 Global Financial Stability Report; Group of Thirty 2020). However, it will be crucial to ensure that public support is done transparently at arm’s length for good governance, consistent with overall policy goals, and that there is a clear exit strat-egy (including to minimize fiscal risks).
1Persistent corporate debt accumulation may lower productiv-ity growth in the long term and raise vulnerabilities (Gopinath and others 2017; Lam and others 2017; Diamond, Hu, and Rajan 2020; Anderson and Raissi 2021).
Box 1.2. Considerations When Supporting Firms
©International Monetary Fund. Not for Redistribution
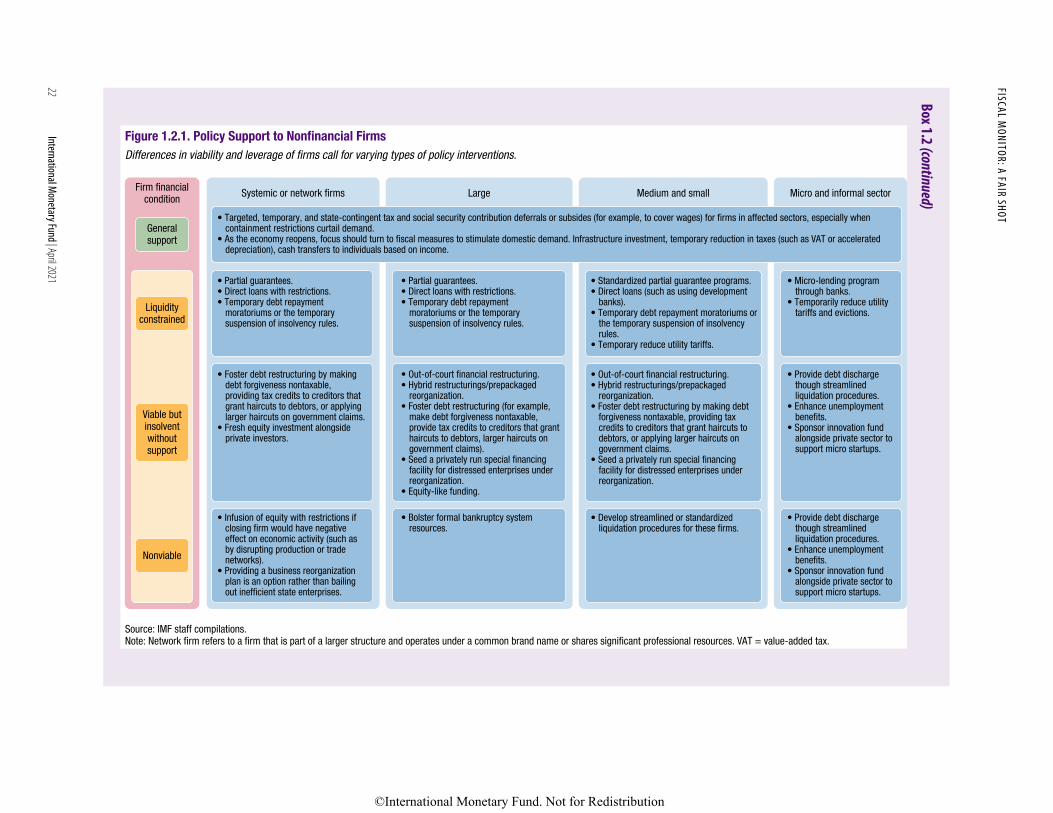
22International M
onetary Fund | April 2021
FISCAL MONITOR: A FAIR SHOT
Source: IMF staff compilations.Note: Network firm refers to a firm that is part of a larger structure and operates under a common brand name or shares significant professional resources. VAT = value-added tax.
Differences in viability and leverage of firms call for varying types of policy interventions.
Firm financialcondition Systemic or network firms Large Medium and small Micro and informal sector
Generalsupport
Liquidityconstrained
Viable butinsolventwithoutsupport
Nonviable
• Targeted, temporary, and state-contingent tax and social security contribution deferrals or subsides (for example, to cover wages) for firms in affected sectors, especially when containment restrictions curtail demand.
• As the economy reopens, focus should turn to fiscal measures to stimulate domestic demand. Infrastructure investment, temporary reduction in taxes (such as VAT or accelerated depreciation), cash transfers to individuals based on income.
• Partial guarantees.• Direct loans with restrictions.• Temporary debt repayment
moratoriums or the temporary suspension of insolvency rules.
• Partial guarantees.• Direct loans with restrictions.• Temporary debt repayment
moratoriums or the temporary suspension of insolvency rules.
• Standardized partial guarantee programs.• Direct loans (such as using development
banks).• Temporary debt repayment moratoriums or
the temporary suspension of insolvency rules.
• Temporary reduce utility tariffs.
• Micro-lending program through banks.
• Temporarily reduce utility tariffs and evictions.
• Provide debt discharge though streamlined liquidation procedures.
• Enhance unemployment benefits.
• Sponsor innovation fund alongside private sector to support micro startups.
• Provide debt discharge though streamlined liquidation procedures.
• Enhance unemployment benefits.
• Sponsor innovation fund alongside private sector to support micro startups.
• Out-of-court financial restructuring.• Hybrid restructurings/prepackaged
reorganization.• Foster debt restructuring by making debt
forgiveness nontaxable, providing tax credits to creditors that grant haircuts to debtors, or applying larger haircuts on government claims.
• Seed a privately run special financing facility for distressed enterprises under reorganization.
• Develop streamlined or standardized liquidation procedures for these firms.
• Out-of-court financial restructuring.• Hybrid restructurings/prepackaged
reorganization.• Foster debt restructuring (for example,
make debt forgiveness nontaxable, provide tax credits to creditors that grant haircuts to debtors, larger haircuts on government claims).
• Seed a privately run special financing facility for distressed enterprises under reorganization.
• Equity-like funding.
• Bolster formal bankruptcy system resources.
• Foster debt restructuring by making debt forgiveness nontaxable, providing tax credits to creditors that grant haircuts to debtors, or applying larger haircuts on government claims.
• Fresh equity investment alongside private investors.
• Infusion of equity with restrictions if closing firm would have negative effect on economic activity (such as by disrupting production or trade networks).
• Providing a business reorganization plan is an option rather than bailing out inefficient state enterprises.
Figure 1.2.1. Policy Support to Nonfinancial FirmsBox 1.2 (continued)
©International Monetary Fund. Not for Redistribution

23International Monetary Fund | April 2021
C H A P T E R 1 T A I L O R I N G F I S C A L R E S P O N S E S
The COVID-19 pandemic continues to test the flexibility of rules-based fiscal frameworks and highlight the need for a return pathway to the rules (and, in some cases, a recalibration of the rules’ limits). In 2020, many countries appropriately used escape clauses to deviate from or suspend the fiscal rules, on the basis of a pre-defined process that includes governments, parliaments, and, in some cases, fiscal councils (including to facilitate communications) (Figure 1.3.1). Commonly used pro-visions include the following: • Supranational escape clauses: The activation of
supranational escape clauses—such as those in the Central African Economic and Monetary Com-munity, the Eastern Caribbean Currency Union, and the European Union—automatically triggered the national ones in some countries (France, Italy, Portugal). Others relied on separate national escape clauses (Czech Republic, Germany), including differ-ent sets of triggers and suspension periods.
• National escape clauses: Countries with escape clauses resorted to them (Armenia, Austria, Azerbaijan, Brazil, Costa Rica, Croatia, Estonia, Grenada, Honduras). In some countries, escape clauses include quantitative triggers, such as in India, where the fiscal rule allows for temporary deviations from the target fiscal deficit (not exceeding 0.5 percentage points in a year) if real output growth declines by at least 3 percentage points below the average for the previous four quarters. Brazil adopted a “war budget” that excluded COVID-19 spending from the constitutional expenditure ceiling and declared a state of public calamity that lifted the obligation to comply with a primary balance target in 2020.
• Suspension of the fiscal rules or changes to numerical targets: Several countries without escape clauses temporarily suspended their fiscal rules (Colombia, Ghana, Poland, Russian Federation). Paraguay and Peru, despite having escape clauses, suspended their fiscal rules entirely until the end of 2021 to offer more flexibility. In some cases, the suspension of the rule was verified by independent fiscal councils, adding credibility to government decisions. Indonesia suspended the balance budget target of 3 percent of GDP for three years. Chile, Mexico, and Uruguay have modified their fiscal targets within their existing fiscal frameworks to allow for greater spending.
Countries are contemplating when and how to transition back to the rules (that is, to exit the escape clause or end the suspension). For example, Canada plans to gradually unwind support measures on the basis of data-driven triggers such as employ-ment or total hours worked rather than a predeter-mined calendar. Policymakers need to balance the need for continued flexibility to counter the pan-demic and support the recovery against the need to keep market confidence, especially when debt and gross financing needs are high. Brazil has prioritized debt stability by withdrawing most COVID-related fiscal support measures at the end of last year and aiming to meet the expenditure ceiling in 2021. This reinforces credibility, though it requires a large upfront adjustment. A constitutional amendment exempted the recently announced round of cash transfers from the rule but limited it to 0.6 percent of GDP. For all countries, preserving the credibility of the framework requires ensuring that flexibil-ity is temporary and transparent—including by communicating the process of returning to the rule, announcing a realistic medium-term path, and, in some cases, improving the design of the rules or recalibrating its limits to fit postpandemic circumstances.
Revision to deficit target Use of escape clause Cyclical relaxation Temporary rule
suspension
Sources: Country reports; national authorities; and IMF staff calculations.Note: Data labels use International Organization for Standardization (ISO) country codes.
Figure 1.3.1. Policy Relaxation Relative to Fiscal Rule Limits, 2020(Percent of GDP)
Many countries have used the built-in adjustments of fiscal rules during the COVID-19 pandemic.
0
2
4
6
8
1
3
5
7
9
BRA
CHL
COL
CRI
GRD
JAM
MEX
PAN
PRY
PER
IDN
GHN
URY
SEN
CIV
HND
DEU
RUS
IND
ARM ITA
POL
Box 1.3. The Flexibility of Fiscal Rules during the COVID-19 Pandemic
©International Monetary Fund. Not for Redistribution
24 International Monetary Fund | April 2021
F I S C A L M O N I T O R: A F A I R S H O T
The taxation of multinational corporations has been under severe stress in recent decades.1 The way in which profits are attributed among affiliates of a multinational group in different countries not only is challenging to implement but leaves considerable scope for cross-bor-der profit shifting. Especially in developing countries, anti-tax avoidance measures often remain ineffective—owing to limited administrative capacity—and do not address structural weaknesses in international tax rules. Digitalization has exacerbated the shortcomings of the current framework, which assigns taxing rights primarily on the basis of physical presence and enables highly digitalized firms to earn significant profits in “market countries” without incurring any income tax liability there. A potentially even larger revenue risk for govern-ments comes from unrestricted tax competition among countries, an issue that is yet to be addressed.
The G20/OECD Base Erosion and Profit Shifting project, which concluded in 2015, partly addressed issues of tax avoidance by multinationals. But it did not fundamentally reform the system, leaving deep-rooted problems unresolved. Recognizing that more needs to be done, the now 139 members of the OECD’s “Inclusive Framework” have since discussed reform proposals for a more fundamental departure from the current century-old norms. In October 2020, these were detailed in Blueprints on two pillars, which are currently being discussed. • Pillar One aims to address the digitalization chal-
lenge through a new approach that assigns some taxing rights to market countries. It would use a formula based on the share of sales to reallocate a share of “residual” profits—those, roughly, in excess of a normal return—earned by large multination-als operating in some sectors (that is, automated digital services and consumer-facing businesses) to market countries. These new features are welcome to address some of the weaknesses of the current system (IMF 2019b). However, while offering a compromise, the proposal lacks a coherent eco-nomic rationale, is highly complex, and does not yet specify several issues of substance (such as the portion of profit to be reallocated). According to OECD (2020), it would increase global corporate tax revenues by ¼ to ½ percent.
• Pillar Two targets tax competition and further limits profit shifting by ensuring that profits of large
1The issues are discussed in more depth in de Mooij, Klemm, and Perry (2021) and Devereux and others (2021).
multinationals are subject to at least some mini-mum level of taxation. It envisages an “outbound” tax rule (an “income inclusion rule”) charged by residence countries on low-taxed foreign earnings, and two “inbound” rules (a principal “undertaxed payment rule” denying deductions for payments not taxed at a sufficient rate elsewhere, and a separate “subject to tax rule” permitting source countries under tax treaties to impose withholding taxes). According to OECD estimates, with this proposal global corporate tax revenues would rise by between 1¾ and 2¾ percent (OECD 2020). The broad intent of this pillar is welcome, but it is also likely to benefit advanced economies more than devel-oping countries. The proposed effective priority of the “outbound” rule over the principal “inbound” rule (given the likely limited impact of the narrow and optional “subject to tax” rule) means that the revenue collected by “topping up” taxes on lightly taxed income in source countries accrues not to those countries, often developing countries, but to residence countries, often advanced economies.Overall, the Blueprints contemplate significant and
welcome departures from long-standing standards and go some way to addressing the fractures in the inter-national tax architecture—paving the way for a more robust and sustainable future system. Agreement by mid-2021 is an ambitious target, calling for renewed efforts to address many implementation issues and excessive complexities of the proposals. Key features to be agreed include (1) the rule order in Pillar Two, with devel-oping countries seeking a greater role for the inbound rule; (2) the scope of Pillar One, with some European countries focusing on automated digital services, and the United States asserting a broader reform beyond digital companies; and (3) the level of the minimum effective tax rate—with the range between 9 percent and 12½ percent being discussed seen as too low by some.
Reaching political agreement on the two pillars will be important to avoid both unfettered tax competition that undermines revenue mobilization efforts and a proliferation of unilateral measures—such as “digi-tal service taxes” of various kinds now enhanced or proposed in many countries (Aslam and Shah 2020)—that could give rise to tax and trade wars with large economic costs for all. Even if agreement is reached, pressures for further reforms, likely expanding upon these newly adopted approaches, will continue given the relatively narrow scope and limited estimated effect of the proposals.
Box 1.4. Toward an Agreement on Reforming International Taxes
©International Monetary Fund. Not for Redistribution

25International Monetary Fund | April 2021
C H A P T E R 1 T A I L O R I N G F I S C A L R E S P O N S E S
ReferencesAnderson, Gareth, and Mehdi Raissi. 2021. “Corporate
Indebtedness and Low Productivity Growth of Italian Firms.” In Advances in Econometrics, vol. 44, Essays in Honor of M. Hashem Pesaran, edited by Alexander Chudik, Cheng Hsiao, and Allan Timmermann. Bingley, UK: Emerald Publishing.
Aslam, Aqib, and Alpa Shah. 2020. “Tec(h)tonic Shifts: Taxing the Digital Economy.” IMF Working Paper 20/76, Interna-tional Monetary Fund, Washington, DC.
Audit Services of Sierra Leone. 2020. “Report on the Audit of Funds Managed by the NaCOVERC and other MDAs.” Government of Sierra Leone, Freetown.
Auditor General South Africa. 2020. “Second Special Report on the Financial Management of Government’s COVID-19 Initiatives.” Government of South Africa, Pretoria.
Auerbach, Alan J., and Yuriy Gorodnichenko. 2012. “Measuring the Output Responses to Fiscal Policy.” American Economic Journal: Economic Policy 4 (2): 1–27.
Barrero, Jose M., Nicholas Bloom, and Steven J. Davis. 2020. “COVID-19 Is Also a Reallocation Shock.” NBER Working Paper 27137, National Bureau of Economic Research, Cambridge, MA.
Benedek, Dora, Edward Gemayel, Abdelhak Senhadji, and Alexander Tieman. 2021. “A Post-Pandemic Assessment of the Sustainable Development Goals.” IMF Staff Discussion Note 21, International Monetary Fund, Washington, DC.
Bi, Huixin, Wenyi Shen, and Shu-Chun S. Yang. 2016. “Debt-Dependent Effects of Fiscal Expansions.” European Economic Review 88: 142–57.
Blanchard, Olivier, Thomas Philippon, and Jean Pisani-Ferry. 2020. “A New Policy Toolkit Is Needed as Countries Exit COVID-19 Lockdowns.” Policy Brief 20–8, Peterson Insti-tute for International Economics, Washington, DC.
Chudik, Alexander, Kamiar Mohaddes, and Mehdi Raissi. 2021. “COVID-19 Fiscal Support and Its Effectiveness.” Cambridge Working Papers in Economics 2116, University of Cambridge, UK.
Cirera, Xavier, Marcio Jose Vargas Da Cruz, Elwyn Adriaan Robin Davies, Arti Goswami Grover, Leonardo Iacovone, Jose Ernesto Lopez Cordova, Denis Medvedev, and others. 2021. “Policies to Support Businesses through the COVID-19 Shock: A Firm-Level Perspective.” Policy Research Working Paper 9505, World Bank, Washington, DC.
Coady, David, and Nghia-Piotr Le. 2020. “Designing Fiscal Redistribution: The Role of Universal and Targeted Transfers.” IMF Working Paper 20/105, International Monetary Fund, Washington, DC.
de Mooij, Ruud, Ricardo Fenochietto, Shafik Hebous, Sébastien Leduc, and Carolina Osorio-Buitron. 2020. “Tax Policy for Inclusive Growth after the Pandemic.” Special Series on COVID-19, Fiscal Affairs Department, International Mone-tary Fund, Washington, DC.
de Mooij, Ruud, Alexander Klemm, and Victoria Perry. 2021. Corporate Income Taxes under Pressure: Why Reform Is Needed and How It Could Be Designed. Washington, DC: Interna-tional Monetary Fund.
Devereux, Michael P., Alan J. Auerbach, Michael Keen, Paul Oosterhuis, Wolfgang Schon and John Vella. 2021. Taxing Profit in a Global Economy Oxford, UK: Oxford University Press.
Diamond, Douglas W., Yunzhi Hu, and Raghuram G. Rajan. 2020. “Pledgeability, Industry Liquidity, and Financing Cycles.” Journal of Finance 75 (1): 419–61.
Díez, Federico J., Romain Duval, Jiayue Fan, Jose Garrido, Sebnem Kalemli-Özcan, Chiara Maggi, Soledad Martinez-Peria, and Nicola Pierri. 2021. “Insolvency Prospects among Small- and Medium-Sized Enterprises in Advanced Economies: Assessment and Policy Options.” IMF Staff Discussion Note, International Monetary Fund, Washington, DC.
Ebeke, Christian, Nemanja Jovanovic, Svitlana Maslova, Francisco Parodi, Laura Valderrama, Svetlana Vtyurina, and Jing Zhou. 2020. “Corporate Liquidity and Solvency in Europe during the COVID-19 Pandemic: The Role of Policies.” IMF Departmental Paper, International Monetary Fund, Washington, DC.
Erceg, Christopher, and Jesper Lindé. 2014. “Is There a Fiscal Free Lunch in a Liquidity Trap?” Journal of the European Economic Association 12 (1): 73–107.
Gentilini, Ugo, Mohamed Almenfi, Ian Orton, and Pamela Dale. 2020. “Social Protection and Jobs Responses to COVID-19: A Real-Time Review of Country Measures.” World Bank, Washington, DC.
Gopinath, Gita, Şebnem Kalemli-Özcan, Loukas Karabarbounis, and Carolina Villegas-Sanchez. 2017. “Capital Allocation and Productivity in South Europe.” Quarterly Journal of Economics 132 (4): 1915–67.
Gourinchas, Pierre-Olivier, Şebnem Kalemli-Özcan, Veronika Penciakova, and Nick Sander. 2020. “COVID-19 and SME Failures.” NBER Working Paper 27877, National Bureau of Economic Research, Cambridge, MA.
Group of Thirty, G30 Working Group on Corporate Sector Revitalization. 2020. Reviving and Restructuring the Corpo-rate Sector Post-Covid: Designing Public Policy Interventions. Washington, DC: Group of Thirty.
International Monetary Fund (IMF). 2019a. “Macroeconomic Developments and Prospects in Low-Income Developing Countries—2019.” IMF Policy Paper 19/039, International Monetary Fund, Washington, DC.
International Monetary Fund (IMF). 2019b. “Corporate Taxation in the Global Economy.” IMF Policy Paper 19/007, International Monetary Fund, Washington. DC.
International Monetary Fund (IMF). 2020a. “Keeping the Receipts: Transparency, Accountability, and Legitimacy in Emergency Responses.” Special Series on COVID-19, Fiscal Affairs Department, International Monetary Fund, Washington, DC.
©International Monetary Fund. Not for Redistribution

26 International Monetary Fund | April 2021
F I S C A L M O N I T O R: A F A I R S H O T
International Monetary Fund (IMF). 2020b. “Budgeting in a Crisis: Guidance for Preparing the 2021 Budget.” Special Series on COVID-19, Fiscal Affairs Department, International Monetary Fund, Washington, DC.
International Monetary Fund (IMF). 2020c. “COVID-19 Funds in Response to the Pandemic.” Special Series on COVID-19, Fiscal Affairs Department, International Monetary Fund, Washington, DC.
International Monetary Fund (IMF). 2020d. “Budget Execu-tion Controls to Mitigate Corruption Risk in Pandemic Spending.” Fiscal Affairs Department, International Monetary Fund, Washington, DC.
International Monetary Fund (IMF). 2020e. “Managing Fiscal Risks under Fiscal Stress.” Special Series on COVID-19, Fiscal Affairs Department, International Monetary Fund, Washington, DC.
Lam, W. Raphael, Alfred Schipke, Yuyan Tan, and Zhibo Tan. 2017. “Resolving China’s Zombies: Tackling Debt and Raising Productivity.” IMF Working Paper 17/266, Interna-tional Monetary Fund, Washington, DC.
Mauro, Paolo, and Jan Zilinsky. 2016. “Reducing Govern-ment Debt Ratios in an Era of Low Growth.” Policy Brief 16–10, Peterson Institute for International Economics, Washington, DC.
Mbaye, Samba, Marialuz Moreno Badia, and Kyungla Chae. 2018. “Bailing Out the People? When Private Debt Becomes Public.” IMF Working Paper 18/141, International Monetary Fund, Washington, DC.
Organisation for Economic Co-operation and Development (OECD). 2020. “Tax Challenges Arising from Digitalization—Economic Impact Assessment.” OECD, Paris.
©International Monetary Fund. Not for Redistribution

The COVID-19 pandemic has worsened preexisting inequalities. It has laid bare inequalities in access to basic services, which, in turn, may cause income gaps to persist generation after generation. For the recovery to benefit all and to strengthen trust in government, action is needed to reduce gaps in incomes and in access to services. For most countries, this will require mobiliz-ing additional revenues and improving service delivery while fostering inclusive growth. In the period ahead, access to vaccines and the progress in vaccination will be decisive. Policymakers should also be responsive to public sentiment that, as a result of the pandemic, may be shifting toward greater demand for inclusive policies.
IntroductionCOVID-19 has exposed and exacerbated preexist-
ing inequalities in incomes and access to basic public services, such as health care and vaccination, both within and across countries.1 Disruptions to education threaten social mobility by leaving long-lasting eff ects on children and youth, especially those from poorer households. Th ese challenges are being compounded by accelerated digitalization and the transformational eff ect of the pandemic on the economy, posing low-skilled workers with diffi culties in fi nding employment. Against this backdrop, societies may experience rising polarization, erosion of trust in government, or social unrest. Th ese factors complicate sound economic policymaking and pose risks to macroeconomic stability and the functioning of society.
1Th e chapter uses several inequality-related concepts: inequality of income, mainly measured using a conventional Gini coeffi -cient in which 0/1 represents perfect equality/inequality; wealth inequality, measured as the share of wealth attributed to the top 1 or 10 percent of the population; inequality of opportunity, which is income inequality driven by factors outside the control of individuals (such as parental education and income, race, gender, and place of birth); intergenerational mobility, which measures the extent to which parental income or education determines their children’s income or education; and access to basic (public) services, which includes typical services governments provide for public consump-tion, with primary focus on education, health, social protection, and infrastructure.
Governments need to provide everyone with a fair shot—enabling all individuals to reach their poten-tial—and to strengthen vulnerable households’ resilience, preserving social stability and, in turn, macroeconomic stability. Th e pandemic has confi rmed the merits of equal access to basic services—health care, quality education, and digital infrastructure—and of inclusive labor markets and eff ective social safety nets. Better performance in these areas has enhanced resilience to the pandemic and is key for the economic recovery to benefi t all and to strengthen trust in government.
Meanwhile, policies to reduce income gaps and improve access to services face a more challenging economic and social environment. Public fi nances have been weakened in most countries as a result of the pan-demic. To fi nance these critical policies and foster inclu-sive growth, many countries will need to raise additional revenues and improve spending effi ciency. Measures will thus need to support inclusive growth in a context of tighter fi scal space. At the same time, policymakers should be aware of public attitudes, which may be shift-ing toward greater demand for inclusive policies.
To discuss these policy challenges, this chapter fi rst reviews trends in inequality before the pandemic, highlighting the tight connections among inequalities in income, wealth, access to basic services, and oppor-tunities. It then reports early evidence that preexisting inequalities have exacerbated poor health and income outcomes from the COVID-19 crisis and that, in addi-tion, the pandemic is worsening inequality, poverty, and educational attainment. Th e chapter then consid-ers two groups of policies: predistributive (policies that aff ect the distribution of market income) and redis-tributive; both are needed to tackle inequalities in the postpandemic world. Th e chapter then explores how to garner popular support for distributive policies.
Trends in Inequality before the COVID-19 Pandemic
Before the pandemic, within-country income inequalities had been rising or remained high in many countries—in some cases, contributing to occasional
A FAIR SHOT 2 CHAP
TER
27International Monetary Fund | April 2021
©International Monetary Fund. Not for Redistribution
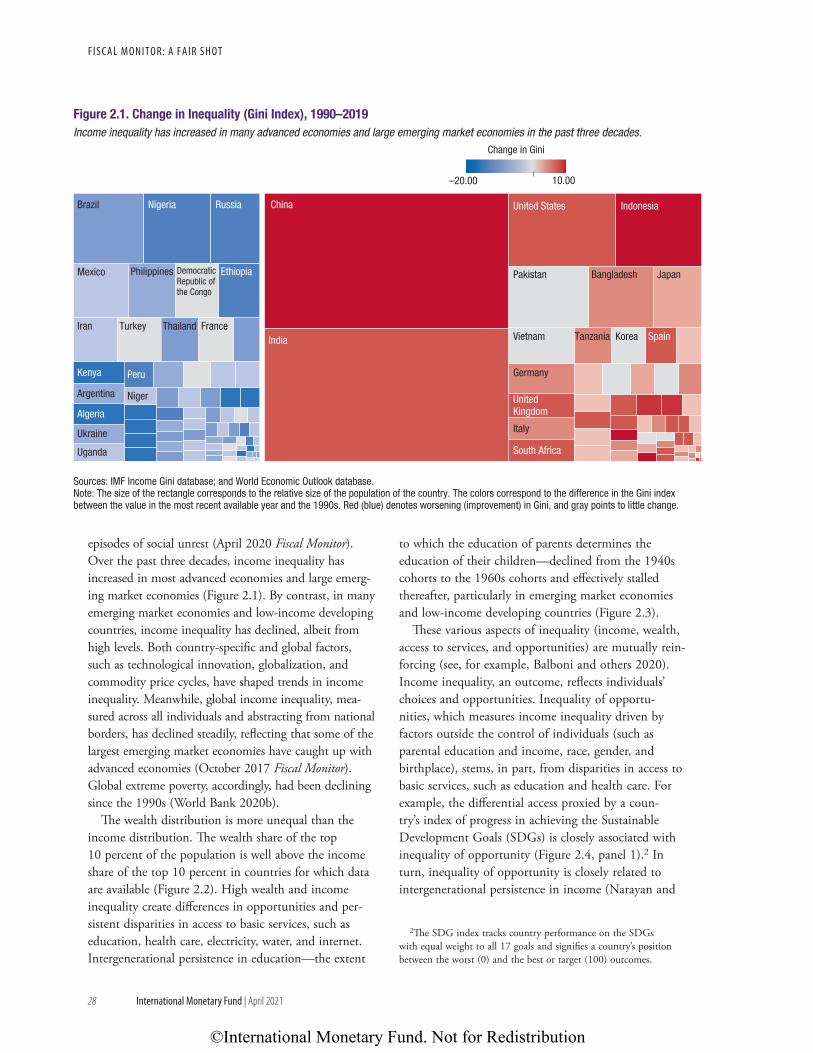
28 International Monetary Fund | April 2021
F I S C A L M O N I T O R : A F A I R S h O T
episodes of social unrest (April 2020 Fiscal Monitor). Over the past three decades, income inequality has increased in most advanced economies and large emerg-ing market economies (Figure 2.1). By contrast, in many emerging market economies and low-income developing countries, income inequality has declined, albeit from high levels. Both country-specific and global factors, such as technological innovation, globalization, and commodity price cycles, have shaped trends in income inequality. Meanwhile, global income inequality, mea-sured across all individuals and abstracting from national borders, has declined steadily, reflecting that some of the largest emerging market economies have caught up with advanced economies (October 2017 Fiscal Monitor). Global extreme poverty, accordingly, had been declining since the 1990s (World Bank 2020b).
The wealth distribution is more unequal than the income distribution. The wealth share of the top 10 percent of the population is well above the income share of the top 10 percent in countries for which data are available (Figure 2.2). High wealth and income inequality create differences in opportunities and per-sistent disparities in access to basic services, such as education, health care, electricity, water, and internet. Intergenerational persistence in education—the extent
to which the education of parents determines the education of their children—declined from the 1940s cohorts to the 1960s cohorts and effectively stalled thereafter, particularly in emerging market economies and low-income developing countries (Figure 2.3).
These various aspects of inequality (income, wealth, access to services, and opportunities) are mutually rein-forcing (see, for example, Balboni and others 2020). Income inequality, an outcome, reflects individuals’ choices and opportunities. Inequality of opportu-nities, which measures income inequality driven by factors outside the control of individuals (such as parental education and income, race, gender, and birthplace), stems, in part, from disparities in access to basic services, such as education and health care. For example, the differential access proxied by a coun-try’s index of progress in achieving the Sustainable Development Goals (SDGs) is closely associated with inequality of opportunity (Figure 2.4, panel 1).2 In turn, inequality of opportunity is closely related to intergenerational persistence in income (Narayan and
2The SDG index tracks country performance on the SDGs with equal weight to all 17 goals and signifies a country’s position between the worst (0) and the best or target (100) outcomes.
10.00–20.00
Change in Gini
Sources: IMF Income Gini database; and World Economic Outlook database.Note: The size of the rectangle corresponds to the relative size of the population of the country. The colors correspond to the difference in the Gini index between the value in the most recent available year and the 1990s. Red (blue) denotes worsening (improvement) in Gini, and gray points to little change.
South Africa
Italy
UnitedKingdom
Germany
Vietnam
Pakistan Bangladesh Japan
IndonesiaUnited States
Tanzania Korea SpainIndia
ChinaRussiaNigeriaBrazil
EthiopiaDemocraticRepublic ofthe Congo
PhilippinesMexico
Iran Turkey Thailand France
Kenya Peru
NigerArgentina
Algeria
Ukraine
Uganda
Figure 2.1. Change in Inequality (Gini Index), 1990–2019Income inequality has increased in many advanced economies and large emerging market economies in the past three decades.
©International Monetary Fund. Not for Redistribution

29International Monetary Fund | April 2021
C H A P T E R 2 A F A I R S h O T
others 2018). Furthermore, income inequality has an adverse feedback loop to disparities in access and intergenerational mobility. Higher-income parents can give their children better access to good education and job opportunities, thus leading to intergenerational persistence in income. Income inequality and inter-generational persistence in income are significantly associated (Figure 2.4, panel 2).3
Income inequality is also related to intergenerational persistence in education. Access to education is an important determinant of intergenerational mobility in education, along with access to information and communication technology and income inequality (Online Annex 2.1). For example, for the 1960s cohort, an increase of 2¾ years in education is associated with an improvement from the third quartile to nearly the median of the distribution of intergenerational mobility in education. Moreover, an increase in income inequality by 9 Gini points is associated with a reduction of educa-tional attainment by 0.9 years, as measured in 1980.
3This association between income inequality and its persistence across generations shown in panel 2 of Figure 2.4, with several countries of all income levels, was previously documented for advanced economies by Corak (2013).
This chapter focuses on disparities in access to basic services, which contribute to uneven lifetime opportunities. This emphasis on disparities in access or in opportunities not only has the virtue of broader acceptance, but also alleviates concerns about trade-offs between equity and efficiency.4
The Pandemic and InequalityEffects of Preexisting Inequalities on Adverse Health Outcomes from the COVID-19 Pandemic
Preexisting inequalities, both across and within countries, have affected health outcomes from the COVID-19 pandemic.5 Considering differences across countries, better access to health care, proxied
4Although empirical evidence on the relationship between income inequality and growth is not conclusive, some researchers report evi-dence that inequalities driven by uneven opportunities are negatively associated with growth (Marrero and Rodríguez 2013; Aiyar and Ebeke 2019). Reducing disparities in access to public services could thus also foster economic growth.
5In addition to its direct effect on wellness, COVID-19 has disrupted normal health care services. These disruptions could cause a substantial medium-term increase in deaths from other diseases such as HIV, tuberculosis, and malaria (Hogan and others 2020).
Income share of thetop 10 percentWealth share of thetop 10 percent
Source: Organisation for Economic Co-operation and Development.Note: Data are taken from the most recent available year, ranging from 2013 to 2017.
Figure 2.2. Income and Wealth Shares of the Top 10 Percent of the PopulationThe wealth distribution is even more unequal than the income distribution.
Percent of total10 20 30 40 50 60 70 80 90
United States
FinlandItaly
BelgiumGreecePolandJapan
Slovak Republic
SpainAustraliaHungarySlovenia
LuxembourgFrance
CanadaNorway
United KingdomPortugal
IrelandAustriaEstonia
ChileGermany
LatviaDenmark
The Netherlands
Cohort birth yearIn
terg
ener
atio
nal p
ersi
sten
ce in
edu
catio
n
1940
0.8
0.7
0.6
0.5
0.4
0.3
0.250 60
Low-income developing countries
Emerging market economies
Advanced economies
70 80
Sources: World Bank Global Database of Intergenerational Mobility 2018; and IMF staff calculations.Note: Values of intergenerational persistence are coefficient estimates from the regression of children’s years of education on the education of their parents. Higher values indicate great intergenerational persistence or lower mobility.
Figure 2.3. Intergenerational Persistence in Education, 1940–80Progress has slowed for intergenerational mobility in education.
©International Monetary Fund. Not for Redistribution
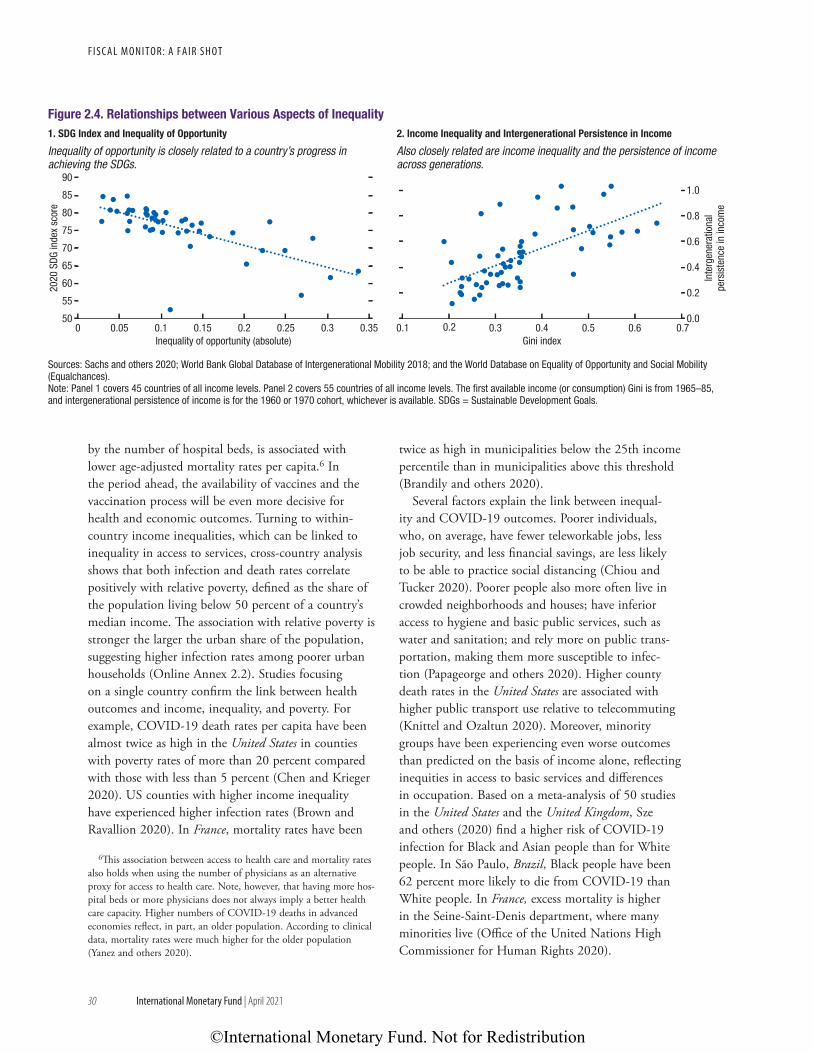
30 International Monetary Fund | April 2021
F I S C A L M O N I T O R : A F A I R S h O T
by the number of hospital beds, is associated with lower age-adjusted mortality rates per capita.6 In the period ahead, the availability of vaccines and the vaccination process will be even more decisive for health and economic outcomes. Turning to within- country income inequalities, which can be linked to inequality in access to services, cross-country analysis shows that both infection and death rates correlate positively with relative poverty, defined as the share of the population living below 50 percent of a country’s median income. The association with relative poverty is stronger the larger the urban share of the population, suggesting higher infection rates among poorer urban households (Online Annex 2.2). Studies focusing on a single country confirm the link between health outcomes and income, inequality, and poverty. For example, COVID-19 death rates per capita have been almost twice as high in the United States in counties with poverty rates of more than 20 percent compared with those with less than 5 percent (Chen and Krieger 2020). US counties with higher income inequality have experienced higher infection rates (Brown and Ravallion 2020). In France, mortality rates have been
6This association between access to health care and mortality rates also holds when using the number of physicians as an alternative proxy for access to health care. Note, however, that having more hos-pital beds or more physicians does not always imply a better health care capacity. Higher numbers of COVID-19 deaths in advanced economies reflect, in part, an older population. According to clinical data, mortality rates were much higher for the older population (Yanez and others 2020).
twice as high in municipalities below the 25th income percentile than in municipalities above this threshold (Brandily and others 2020).
Several factors explain the link between inequal-ity and COVID-19 outcomes. Poorer individuals, who, on average, have fewer teleworkable jobs, less job security, and less financial savings, are less likely to be able to practice social distancing (Chiou and Tucker 2020). Poorer people also more often live in crowded neighborhoods and houses; have inferior access to hygiene and basic public services, such as water and sanitation; and rely more on public trans-portation, making them more susceptible to infec-tion (Papageorge and others 2020). Higher county death rates in the United States are associated with higher public transport use relative to telecommuting (Knittel and Ozaltun 2020). Moreover, minority groups have been experiencing even worse outcomes than predicted on the basis of income alone, reflecting inequities in access to basic services and differences in occupation. Based on a meta- analysis of 50 studies in the United States and the United Kingdom, Sze and others (2020) find a higher risk of COVID-19 infection for Black and Asian people than for White people. In São Paulo, Brazil, Black people have been 62 percent more likely to die from COVID-19 than White people. In France, excess mortality is higher in the Seine-Saint-Denis department, where many minorities live (Office of the United Nations High Commissioner for Human Rights 2020).
Sources: Sachs and others 2020; World Bank Global Database of Intergenerational Mobility 2018; and the World Database on Equality of Opportunity and Social Mobility (Equalchances).Note: Panel 1 covers 45 countries of all income levels. Panel 2 covers 55 countries of all income levels. The first available income (or consumption) Gini is from 1965–85, and intergenerational persistence of income is for the 1960 or 1970 cohort, whichever is available. SDGs = Sustainable Development Goals.
Inequality of opportunity (absolute)
2020
SDG
inde
x sc
ore
0
90
85
80
75
70
65
60
55
500.10.05 0.15 0.25 0.30.2 0.35
1. SDG Index and Inequality of Opportunity
Gini index
Inte
rgen
erat
iona
lpe
rsis
tenc
e in
inco
me
0.1
1.0
0.8
0.6
0.4
0.2
0.00.30.2 0.60.50.4 0.7
2. Income Inequality and Intergenerational Persistence in Income
Figure 2.4. Relationships between Various Aspects of Inequality
Inequality of opportunity is closely related to a country’s progress in achieving the SDGs.
Also closely related are income inequality and the persistence of income across generations.
©International Monetary Fund. Not for Redistribution

31International Monetary Fund | April 2021
C H A P T E R 2 A F A I R S h O T
Effects of the COVID-19 Pandemic on Inequality and Poverty
Because COVID-19 disproportionately affects the most vulnerable groups, poverty and income inequal-ity are projected to rise. Global estimates point to an increase of 95 million people in extreme poverty in 2020 relative to the pre–COVID-19 projec-tions (Chapter 1 of the April 2021 World Economic Outlook). Empirical evidence on previous pandemics, less widespread than COVID-19, indicates increases in inequality after a few years, especially where fiscal policy is constrained (Furceri and others, forthcoming). Technological change may accelerate, inserting further upward pressure on income inequality (October 2020 Regional Economic Outlook: Asia and Pacific). Many people are expected to suffer from the long-term effects of COVID-19 (Huang and others 2021), which may adversely affect their employment prospects.
The effect of the pandemic on labor markets has been staggering in depth and breadth. Developing economies, low-skilled workers, informal workers, and youth have experienced the most pronounced effects. Losses in working hours are estimated at an average of 8.8 percent in 2020 relative to the fourth quarter of 2019, with lower-middle-income countries showing an estimated decline in working hours of 11 percent (ILO 2021). The drop in employment has been sharper for low- and medium-skilled occu-pations. In the United States, high-wage workers’ employment losses lasted only a few weeks, whereas low-wage workers experienced much larger job losses that persisted several months (Chetty and others 2020). Informal sector employment fell more steeply than formal sector employment (October 2020 Regional Economic Outlook: Western Hemisphere). Young workers experienced larger increases in unemployment (Chapter 3 of the April 2021 World Economic Outlook).
Women have been particularly affected by the pan-demic in contrast with past recessions, when men more often lost their jobs (Rubery and Rafferty 2013). In emerging market and developing economies, women’s unemployment rate increased more than men’s, whereas for advanced economies there is not much dif-ference (Chapter 3 of the April 2021 World Economic Outlook). Women are overrepresented in the sectors most affected by COVID-19, accounting for about 60 percent of workers in accommodation and retail ser-vices across member countries of the Organisation for Economic Co-operation and Development (OECD).
Women also make up the bulk of first responders in health care—more than three- quarters of the world’s medical doctors and nursing personnel combined are women (Boniol and others 2019). Working mothers have also borne the brunt of childcare during closures of schools and childcare centers.
High-frequency data confirm the large effect of the pandemic on poverty and inequality and the role of government support in mitigating its impact.7 In Spain, according to Aspachs and others (2020), the post-transfer wage income Gini increased from 38.4 in February 2020 to 49.2 in December 2020, according to commercial bank account data, while Cantó Sánchez and others (2021) found that fis-cal measures had helped to cushion the immediate impact on the loss of income. In Mexico, the share of the population in working poverty jumped from 35.7 percent in the first quarter to 44.5 percent in the third quarter (CONEVAL 2020). In France, bank data show that low-income households experienced a severe decrease in consumption, a decrease in savings, and an increase in debt (suggesting a significant drop in income), unlike the richer households, whose net financial wealth increased (Bounie and others 2020). In Uruguay, the poverty rate in the first three months of the pandemic rose from 8.5 percent to 11.8 per-cent. Government cash transfers had a positive but limited effect in mitigating this spike (Brum and De Rosa 2020).
In contrast, in the United States, with government support, the share of people below the federal poverty level declined from 11 percent in February 2020 to 9.3 percent in June 2020. However, the share rose to 11.8 percent in December 2020 when some benefits expired (Han, Meyer, and Sullivan 2020).8 In Brazil, the new Emergency Aid social assistance more than compensated for the negative effect of COVID-19 on poverty and inequality, but the program ended in December (Al Masri, Flamini, and Toscani 2021). In Ethiopia, participation in the Productive Safety Net Program—the flagship social assistance program—largely offset the adverse effect of the pandemic on food security (Abay and others 2020).
7The timeliness and granularity of cross-country inequality data could be improved. This is a priority of the G20 Data Gaps Initia-tive and of the ongoing international effort to update the System of National Accounts.
8Han, Meyer, and Sullivan (2020) considers total income reported by respondents for the previous 12 months.
©International Monetary Fund. Not for Redistribution

32 International Monetary Fund | April 2021
F I S C A L M O N I T O R : A F A I R S h O T
Effect of School Closures during COVID-19 on Instructional Losses
Future inequalities may be larger because school clo-sures have led to an unprecedented global disruption to education. Country-specific studies on the effect of school closures on instructional losses paint a grim picture. In the Netherlands, average learning loss, measured by changes in nationally standardized test scores, was equivalent to one-fifth of a school year for primary school students, nearly the duration of school closure, and losses were larger among students from less-educated homes, highlighting the role of parents during remote learning (Engzell, Frey, and Verhagen 2020). School closures are expected to be the main reason for education losses, with the pandem-ic-induced income shock to parents playing a secondary role (Fuchs-Schündeln and others 2020).
A grim “COVID-19 slide” (loss in education) also occurred in the United States, with stark differences across race and income (Dorn and others 2020). In England, poorer children had a larger reduction in learning time, less access to learning resources (such as computers and dedicated study space), and less active school support during lockdowns (Andrew and others 2020). Daily learning time during school closures in Germany is esti-mated to have fallen by one-half, and the fall was larger for low-achieving students and boys (Grewenig and others 2020). Children in lower-income countries were less likely to engage in educational activities during school closures than in higher-income countries, according to phone sur-veys conducted by the World Bank (World Bank 2020a). Disruptions to education systems were particularly large in countries with limited infrastructure (Chapter 1 of the April 2021 World Economic Outlook).
Learning losses will be especially large in emerging market and developing economies and for children from poorer families and rural areas lacking access to digital infrastructure. Based on a cross-country analysis, realized education losses from required school closures as of December 31, 2020, are estimated at 20 percent to 25 percent of the school year in advanced economies and between 40 percent and 50 percent in emerging market and developing economies, depending on income quintile and parental education (Figure 2.5 and Online Annex 2.3). Considering both mandatory and recommended school closures, losses could be much larger. These estimates assume that some children will be engaged in remote learning, which will partly mitigate the learning losses, whereas others who do not engage in remote learning would suffer larger education losses.
In addition to the supply-side effect of school closures, the COVID-19 shock could reduce demand for education. Reduced demand is especially relevant for developing countries and households whose income has fallen. Considering past recessions and the expected GDP growth for emerging market and developing economies in 2020, net school enrollment rates could fall by 1 percentage point in 2021 (Online Annex 2.3). Children who drop out of school are expected to suffer lifelong losses in income and opportunities.
Policies to Tackle Rising Inequality: Predistribution and RedistributionPolicy Interventions
Policymakers would be well advised to focus on the social safety nets and health care and education services that came under severe stress from COVID-19. Gov-ernments should provide near-term emergency financ-ing to the health care sector, including for vaccination campaigns, as well as to the education sector to sup-port students’ remote learning; encourage reenrollment (prioritizing students at higher risk of dropping out,
High-education parents Low-education parents
Sources: Engzell, Frey, and Verhagen 2020; Oxford COVID-19 Government Response Tracker; United Nations Educational, Scientific, and Cultural Organization; World Development Indicators and COVID-19 phone surveys; and IMF staff estimates.Note: Data shown are simple averages. Green bars denote shares of a school year that schools at all grades were subject to mandatory closures between March 1 and December 31, 2020. Blue bars denote children’s estimated learning losses by income quintile and are based on estimated learning efficiency varying by parents’ education.
–50–45–40–35–30–25–20–15–10–5
0
Clos
ure
days 1 2 3 4 5
Advanced economies
Income quintile
Clos
ure
days 1 2 3 4 5
Income quintile
Emerging market anddeveloping economies
Perc
ent o
f sch
ool y
ear
Figure 2.5. Education Losses from School Closures and Remote Learning Efficiency in 2020Learning losses reached about a quarter of children’s normal annual learning progress in advanced economies and almost double this amount in emerging market and developing economies.
©International Monetary Fund. Not for Redistribution

33International Monetary Fund | April 2021
C H A P T E R 2 A F A I R S h O T
including girls); and offset learning losses by adjusting curriculums, modifying school calendars, and provid-ing teachers with development and guidance (World Bank 2020c). Even so, most public policies to reduce inequality and enhance opportunities will be similar to those that would have been appropriate before the pandemic. Predistributive policies reduce market income inequality (before taxes and transfers) and foster inclusive growth by (1) enhancing opportunities and increasing human capital before individuals enter the labor market, and (2) supporting participation in labor markets. Redistributive policies, in turn, can reduce poverty and disposable income inequality (after taxes and transfers) and improve access to basic services in the short term by redistributing income toward lower-income households. Similar to predistributive policies, redistributive policies can also enhance long-term growth, particularly by increasing school enroll-ment among children from disadvantaged backgrounds (Figure 2.6). Governments should take a holistic view in identifying sources of low intergenerational mobil-ity and high inequality, tailoring policies to country- specific circumstances. For example, if education and access to basic services are adequate but mobility is low, then market functioning should be improved.9
9An example of a problem in market functioning is discrimination in labor markets, including by race, ethnicity, or disability.
Public spending on basic services can be a priority where access gaps are large and children’s education is determined by their parents’ education.
Policies to Enhance Access to Basic Services (Predistribution)
Public spending on education, health care, and infrastructure can improve access to basic services and human capital accumulation. Public spending can, in part, compensate for the gap in private investments in children between rich and poor parents. For example, cross-country evidence shows that government spend-ing on education can reduce the importance of family background (Figure 2.7). Reducing market income inequality through better access to education may also diminish the need for fiscal redistribution.
Much remains to be done. Despite expanded access to services over the past few decades, large within- country gaps remain between higher- and lower- income households—for example, in access to education. Gaps between rich and poor households in enrollment rates—which are crude measures of educa-tional attainment—are especially large in the Middle East, North Africa, and sub-Saharan Africa, where they reach 25 percentage points to 30 percentage points (Figure 2.8). More and better spending on educa-tion can reduce these gaps. For example, an increase
Social Mobility
Disposable Income
MarketIncome
Source: IMF staff.
Access toBasic Services
Provision of Public Services
Taxes and TransfersSupportin
g Fair
Mar
ket F
unct
ioni
ng
Predistribution
Redistribution
Figure 2.6. Policies: Conceptual FrameworkPredistributive and redistributive policies work together in multiple and reinforcing ways.
Advanced economiesEmerging market economiesLow-income developing countries
Public spending on education (percentage of GDP)0 1 2 3 4 5 6 7 8
Inte
rgen
erat
iona
l per
sist
ence
in e
duca
tion
(coe
ffici
ent e
stim
ate)
90
80
70
60
50
40
30
20
10
0
Sources: UNESCO; World Bank Global Database of International Mobility; and IMF staff estimates. Note: Education spending (during school years) in percentage of GDP and education persistency in adulthood for the cohort born in the 1980s (derived as the regression coefficient in a simple regression of child’s education on parental education).
Figure 2.7. Spending on Education and Intergenerational MobilityHigher spending on public education is associated with more years of schooling for children compared with their parents.
©International Monetary Fund. Not for Redistribution

34 International Monetary Fund | April 2021
F I S C A L M O N I T O R : A F A I R S h O T
in government spending on primary education of 1 percent of GDP could reduce the gap in enrollment rates between the highest- and the lowest-income quantiles by 2.8 percentage points, or almost one-third of the average enrollment gap (Figure 2.9 and Online Annex 2.4). The effect is similar for secondary educa-tion. Reducing large inefficiencies in education spend-ing can also improve education outcomes (Sutherland, Price, and Gonand 2009; Grigoli 2015). In advanced economies, school enrollment gaps are small, but stu-dents from disadvantaged backgrounds have lower test scores and are less likely to complete upper secondary education or to aspire to tertiary education (OECD 2015). Large gaps also remain between advanced econ-omies and developing countries in the acquisition of higher-level cognitive skills (Hanushek, Peterson, and Woessmann 2012).
Gender gaps in education remain despite some improvement over the past few decades. Gender inequality in education reduces human capital and, hence, productivity and growth. Countries with higher gender gaps in education also have lower life expec-tancy, GDP per capita, and measures of state capacity (Evans, Akmal, and Jakiela 2020). Moreover, better- educated women are more informed about nutrition and health care, have fewer children, marry at a later age, and are more likely to join the formal labor market and earn higher incomes (Duflo 2012; Keats 2018).
Focusing on teacher quality and on early child-hood development can improve education outcomes.
Teacher quality has a strong effect on students’ lifetime earnings (Card, Domnisoru, and Taylor 2018). Higher salaries help attract, retain, and motivate better teach-ers. Some countries give priority to smaller class sizes, which they can fund by holding down teacher salaries. However, in advanced economies, prioritizing teacher quality is associated with better student outcomes (OECD 2016). In developing economies, improve-ments in infrastructure and instructional materials may be necessary before investments in teacher quality can take full effect (OECD 2013). Moreover, better public schoolteachers may not be rewarded with higher wages (Bau and Das 2020). Returns to investment in early childhood education are especially large because cognitive skills are developed early in life, boosting school returns in subsequent education stages (Cunha and Heckman 2007; Attanasio 2015).
Health care investments also foster growth and human capital accumulation, reducing inequality and increasing social mobility. Economic circumstances strongly predict children’s health outcomes, which are related to human capital accumulation, adult health, and productivity (Case, Lubotsky, and Paxson 2002; Currie 2009). Government health care spending can reduce the importance of family background and thus can increase intergenerational mobility (Aizer 2014). Health care must begin before birth because mater-nal health determines health at birth, and in utero deprivations can reduce the effect of postnatal health care (Narayan and others 2018).
2000s2010s
Cauc
asus
and
Cent
ral A
sia
Emer
ging
and
deve
lopi
ng A
sia
Emer
ging
and
deve
lopi
ng E
urop
e
Latin
Am
eric
a an
dth
e Ca
ribbe
an
Mid
dle
East
, Nor
thAf
rica,
Afg
hani
stan
,an
d Pa
kist
an
Sub-
Saha
ran
Afric
a
Enro
llmen
t gap
s in
seco
ndar
y ed
ucat
ion
353025201510
05
Figure 2.8. Differences in Enrollment Rates between the Richest and Poorest Households(Percentage points)
The Middle East and Africa have especially large gaps in school enrollment between rich and poor households.
Sources: United Nations Educational, Scientific, and Cultural Organization; and World Bank.
Coef
ficie
nt e
stim
ate
108642
–6–4–2
0
Poorestquintile
Richestquintile
Gap(richest–poorest)
Poorestquintile
Richestquintile
Gap(richest–poorest)
Primary Secondary
Figure 2.9. Effect of Public Education Spending on School Enrollment RatesIncreasing government spending on primary education by 1 percent of GDP could reduce the average enrollment gap by about 30 percent.
Sources: World Bank; United Nations Educational, Scientific, and Cultural Organization; and IMF staff calculations.Note: Estimated coefficients from panel regressions. Data cover 38 emerging market economies over 2000–18.
©International Monetary Fund. Not for Redistribution

35International Monetary Fund | April 2021
C H A P T E R 2 A F A I R S h O T
Tax policy can affect incentives for human capital investment, especially in one’s children. Particularly in countries with more developed tax systems, child tax credits to lower-income households can have large effects on children’s school attendance, performance, and future earnings (Chetty and others 2015) by allowing parents to buy more learning- and health- related items, but also by relieving the stress of income insecurity, enabling parents to focus on developmental activities. In contrast, there is little evidence that tax incentives encourage individuals to invest in new skills (Bulman and Hoxby 2015).
Policies to Support Free and Competitive Markets (Predistribution)
The economic transformation accelerated by the pandemic is calling for greater policy efforts to help workers to adapt to shifts toward jobs requiring higher- level cognitive skills (Chapter 3 of the April 2021 World Economic Outlook). As the pandemic is brought under control, policies should gradually shift to protecting people rather than jobs. A focus on skills acquisition at all levels and on adapting labor market institutions to new forms of work would help work-ers adjust to and gain from digital change (OECD 2018a). In the short term, governments should invest in active labor market policies—vocational training, job search assistance, wage subsidies, or public work programs—and extend support to microentrepreneurs or independent workers. It will also be critical to avoid discouraging new businesses. For example, limiting the use of tax loss offsets by start-up firms in their first years of operation increases the marginal cost of new investment (Rosenberg and Marron 2015). Simplified small business regimes can ease administration and encourage formalization of small companies, particu-larly in low-income developing countries.
Reducing gender gaps in labor markets can boost growth and enhance equality of opportunities. Mak-ing childcare more widely available and affordable, increasing the transparency of pay, decreasing gender gaps in salaries, and providing more parental leave can create a level playing field that allows women to work and develop their potential (Elborgh-Woytek and others 2013). In addition, refundable tax credits for low- income families and individualization of personal income tax filing could reduce the implicit gender bias against females and encourage female labor force participation (Eissa and Liebman 1996).
Tax and Transfer Policies (Redistribution)
Direct taxes and transfers have, in the long term, reduced income inequality by more than one-third in advanced economies. This redistribution accounts for 85 percent of the difference in disposable income inequality between advanced economies and emerg-ing market and developing economies (October 2017 Fiscal Monitor). Three-quarters of fiscal redistribu-tion in OECD countries is achieved through direct transfers and the remainder through taxes (Causa and Hermansen 2018); the former helps reduce inequality mostly at the bottom, and the latter at the top.10
Coverage and adequacy determine the effective-ness of social assistance programs in reducing poverty and inequality.11 These programs are particularly important in developing economies, where high labor market informality limits social insurance. Countries where both coverage and adequacy are high are more effective in fighting poverty and tend to reduce poverty more for a given amount of social assistance spending (Figure 2.10). Low coverage is a weakness exposed by COVID-19, preventing many countries from providing
10Beyond direct transfers, the distribution of indirect taxes and in-kind transfers also matters.
11Coverage is defined as the share of low-income households that benefit from social assistance. Adequacy is defined as the ratio of social assistance benefits relative to an individual’s income before the transfer.
High coverage, high adequacy Other countries
Sources: World Bank ASPIRE database; and IMF staff calculations.Note: Poverty reduction is defined as the difference between poverty headcount after and before transfers divided by poverty headcount before transfers. Data are taken from the most recent available year, ranging from 2008 to 2018. High coverage/adequacy is defined as the level above the median.
Social assistance spending (percent of GDP)0 0.5 1 1.5 2 2.5 3 3.5 4
Pove
rty re
duct
ion
(per
cent
)
25
20
15
10
5
0
Figure 2.10. Effectiveness of Social Assistance Spending(Percent)
Poverty reduction is higher where both coverage and adequacy are high.
©International Monetary Fund. Not for Redistribution

36 International Monetary Fund | April 2021
F I S C A L M O N I T O R : A F A I R S h O T
timely lifelines to vulnerable households. To improve coverage, governments need comprehensive social registries, including those that cover the informal sector. A reliable citizen identification system, such as a biometric ID, integrated with socioeconomic databases, is essential (Prady 2020). Identification systems need to be complemented by effective payment mechanisms, such as e-payments (Una and others 2020). Where access to bank accounts is limited, governments can use mobile money transfers (Davidovic and others 2020).
Some social assistance programs better reduce poverty than others and could encourage human capital accumulation. Cash transfer programs tend to have the largest effect of all social assistance programs in reducing poverty (Figure 2.11, panel 1). Cash transfer programs, moreover, may improve human capital accumulation and help households to smooth income shocks, reducing future inequality. This is especially true when benefits are conditional on requirements such as children’s school attendance or regular health checkups (Parker and Vogl 2018; Barrera-Osorio, Linden, and Saavedra 2020). In contrast, fee waivers have little effect on poverty, because these programs are not usually well targeted. Spending is not always allocated to the programs with the largest effect on poverty (Figure 2.11, panel 2), suggesting that governments have significant room to increase the alloc-ative efficiency of social assistance spending.
More progressive taxation, along with higher reve-nue mobilization (especially in countries with lower tax capacity) that finances social spending, has significant potential to reduce inequality, especially in countries
where taxation and its progressivity are relatively low. Since the 1980s both the average market income inequality and the capital share of income at the top of distribution have risen (Saez and Zucman 2016). Tax policy has meanwhile become less progressive, with significant declines in top marginal tax rates for both labor and capital incomes (Figure 2.12).12 Various other more complex measures also point to a declining trend in tax progressivity—the degree to which the average tax rate rises with income (October 2017 Fiscal Monitor; Gerber and others 2020).
Several countries may readily increase top mar-ginal income tax rates (October 2013 Fiscal Monitor; Kindermann and Krueger, forthcoming), although bal-ance needs to be struck against labor supply and invest-ment distortions, as well as potential tax avoidance and evasion from higher taxes. Tax deductions that predom-inantly benefit higher incomes can also be reformed, such as some universal deductions proportional to tax-payers’ incomes or mortgage interest deductions. Coun-tries with flat tax rates could grant (in-work) tax credits for low-income households to heighten progressivity. Should they wish to increase progressivity also at the top of the distribution, they could consider raising tax rates on higher incomes. Addressing loopholes in the
12In addition to the decline in statutory rates, tax expenditures can often further weaken the progressivity of the benchmark system. For example, about 75 percent of the benefit of the preferential rates on long-term capital gains and qualified dividends in the United States is estimated to accrue to the top 1 percent of households by income (Toder and Baneman 2012).
Cash transfers Social pensions Fee waivers In-kind (food) Other social assistance programs
Pove
rty h
eadc
ount
redu
ctio
n(p
erce
nt)
1816141210
86
24
0
Spen
ding
(per
cent
of G
DP)
2.01.81.61.41.21.00.8
0.40.2
0.6
0
1. Poverty Reduction 2. Spending
Sources: World Bank ASPIRE database; and IMF staff calculations.Note: Each box shows the 25th and 75th percentiles of the variable of interest. The midline/× corresponds to the median/mean. Poverty reduction is defined as the percentage change in poverty headcount. Data cover 110 emerging market and developing economies for the most recent available year during 2010 to 2018. Examples of in-kind (food) include food stamps, vouchers, nutrition programs, school feeding, school supplies, and in-kind/nonfood emergency support. Examples of fee waivers include reduced medical fees, education fee waivers, subsidies for utilities and agricultural inputs, and transportation benefits.
Figure 2.11. Effectiveness and Allocation of Social Assistance Programs(Percent)
The most spending is not allocated to the programs most effective in reducing poverty.
©International Monetary Fund. Not for Redistribution

37International Monetary Fund | April 2021
C H A P T E R 2 A F A I R S h O T
taxation of capital income (interest, dividends, capital gains) can also increase effective progressivity. Because income from capital is skewed toward the rich, taxing interest, dividends, and capital gains will be progressive, even with a proportional tax rate. It is important to strengthen enforcement to prevent tax avoidance and evasion, particularly by high earners.
In parallel, more progressivity can be achieved by raising additional tax revenues to finance further social spending. Value-added taxes and excises are major revenue sources for most governments, in part owing to their relative ease of enforcement and collection. Consumption taxes can support equity if they are used to finance basic public services, such as health care, education, and infrastructure, because poor households benefit more from these services than rich households, in proportion to their incomes. Carbon taxes, a key tool in curbing incentives for greenhouse emissions, can also provide sizable revenues, which, in turn, can be redeployed to reduce other taxes that may be less progressive or more distortionary, or to fund social spending and needed public investment (October 2019 Fiscal Monitor).13
Wealth taxes have become less prevalent, largely owing to implementation challenges. Recently, the
13Unlike most advanced and emerging market economies, the burden of carbon taxes in many developing countries falls more on higher-income deciles, whose energy expenditure share is larger (Dorband and others 2019). Carbon taxes can also promote inter-generational equality of opportunity in the sense that younger gen-erations will have to bear a greater share of the negative externalities accruing from carbon emissions over their lifetimes.
rising concentration of wealth has spurred renewed calls for wealth taxation.14 Countries should, however, carefully assess trade-offs (Scheuer and Slemrod 2021). In addition to mechanically reducing wealth inequality, wealth taxes15 could also increase the probability of intergenerational mobility. A study of Norway suggests that labor income inequality would have been 1 Gini point higher without a recurrent wealth tax (Box 2.1). In addition, using wealth data from 21 advanced and 3 emerging market economies, this chapter finds that absent behavioral responses, a recurrent 1 percent tax on the wealth of the top 1 percent of the pop-ulation could reduce wealth inequality and increase revenues by up to 0.4 percent to 0.6 percent of GDP (Online Annex 2.5). Nonetheless, several factors weigh against recurrent wealth taxation, especially difficulties in asset valuation and in collecting third-party information, which can impede enforcement (Adam and others 2011).16 Overall, before turning to new instruments, countries should consider closing of loopholes (Sarin, Summers, and Kupferberg 2020), more progressive income taxation, and greater reli-ance on property (Norregaard 2013) and inheritance taxes, which remain underused.17 If these reforms are deemed insufficient to achieve policy objectives, coun-tries could consider taxes on wealth while accounting for design and implementation challenges.
More and Better Spending to Enhance Access to Basic Services
Access to basic services helps give everyone a fair shot but is costly. For example, meeting the SDGs—a broad measure of access to basic services—by 2030 would require $3.0 trillion for 121 emerging market economies
14Among OECD countries, only four (France, Norway, Spain, Switzerland ) currently levy wealth taxes, bringing in 0.2 percent to 1.0 percent of GDP in revenues annually (OECD 2018b).
15Wealth taxes can be imposed as either recurrently on the stock of wealth, or on transfers of wealth (with the latter defined as finan-cial or nonfinancial) and either on a gross or net basis (excluding debt). Wealth taxes could thus conceptually encompass real property and inheritance taxes. The discussion in the chapter focuses on a recurrent tax on net total wealth.
16International cooperation on information sharing and compli-ance enforcement, such as the automatic exchange of information initiative, could reduce future concerns regarding high tax evasion elasticities (including cross-border) observed in the past. Domestic reporting requirements could also be strengthened to help determine the value of annual wealth balances.
17Higher revenues from inheritance/gift taxes in Belgium and France (up to 0.7 percent of GDP) suggest that improvement is often feasible (De Mooij and others 2020).
1980/812016 or latest available year
0
10
20
30
40
50
60
70
Top PITmarginal rate
Dividendincome
Interestearnings
CIT statutoryrate
Capitalgains
Figure 2.12. OECD: Top Income Tax Rates(Percent)
The top marginal tax rates for both labor and capital income have declined sharply since the 1980s.
Sources: Carey, Chouraqui, and Hagemann 1993; and Harding and Marten 2018.Note: CIT = corporate income tax; OECD = Organisation for Economic Co-operation and Development; PIT = personal income tax.
©International Monetary Fund. Not for Redistribution

38 International Monetary Fund | April 2021
F I S C A L M O N I T O R : A F A I R S h O T
and low-income developing countries (2.6 percent of 2030 world GDP). This cost includes additional recur-rent spending to improve education and health care, as well as to build and maintain infrastructure.18 On average, emerging market economies and low-income developing countries face additional spending of 4.7 percentage points and 14.9 percentage points of their own 2030 GDP, respectively (Figure 2.13). For both groups of countries, additional spending on education and health care accounts for half the total, with infra-structure accounting for the other half. COVID-19 is impeding efforts to meet the SDGs mainly by reducing tax revenues—long term for many countries. Further-more, as global value chains are disrupted and resources are shifted to urgent health care and social spending, investment is delayed. An in-depth analysis of four emerging market and developing economies finds that the pandemic could lead to an additional annual financ-ing shortfall of 2 ½ percent of GDP, on average, in that sample (Benedek and others, forthcoming).
While committing to additional spending, ineffi-ciencies should be reduced. The efficiency gap—the difference between the country’s spending efficiency and that of best performers—is wider, on average, the lower per capita income. Gaps range from 7 percent to 35 percent for different sectors in emerging market
18Estimates of additional spending to meet the SDGs follow the framework in Gaspar and others (2019) and reflect more up-to-date key input data and methodological refinements that use information on education quality and rural access.
economies and from about 10 percent to 50 percent in low-income developing countries (Figure 2.14). Weak public investment and social spending governance, poor allocation of education and health care resources, inequality, and limited institutions tend to result in low spending efficiency (Mathai and others 2020; Schwartz and others 2020). Measures to improve efficiency, which heavily depends on strengthening public financial man-agement frameworks, would help governments deliver better outcomes with the same resources and galvanize public support for spending. The COVID-19 pandemic has derailed implementation of the SDGs, highlighting the need for strong national ownership to prioritize the SDG agenda and improve spending efficiency, and for the international community to provide additional support through grants, concessional financing, and, in some cases, debt relief.
Strengthening Tax Capacity to Raise Additional Revenue
Strengthening tax capacity in the postpandemic world will be crucial for advanced and developing econo-mies alike to meet large spending needs. In addition to strengthening revenue administrations, including through better governance and digitalization (especially in emerging market economies and low-income develop-ing countries), reforming tax policy could raise addi-tional revenues in the least-distortive ways. Countries can choose from various tax reforms to raise additional revenue (Abdel-Kader and De Mooij 2020; De Mooij and others 2020) from income, property, and consump-tion taxes (Figure 2.15).19 International cooperation and agreement on effective minimum corporate taxation can help curb further tax competition and allow countries to maintain higher rates and reduce tax expenditures. In the postpandemic world, countries may emphasize the joint effect of taxes and expenditures by communicating that higher tax revenues will finance specific needs, such as health care, as prescribed under a medium-term rev-enue strategy (Platform for Collaboration on Tax 2017) and embedded in the budgets as early as possible. This could boost public confidence that revenues from tax reforms will be used adequately.20
19As digital service firms generate increased profits during the pandemic, taxes on their value have also gained interest. Estimates suggest modest but growing potential yields but should be consid-ered cautiously because they create economic distortions and firms can easily shift their incidence to users (Aslam and Shah 2020).
20Tax financing of specific initiatives is different from standard revenue earmarking through legislation, which usually causes exces-sive budgetary inflexibility and inefficiencies.
02468
1012
1614
024681012
1614
Educ
atio
n
Heal
th
Road
s
Elec
trici
ty
Wat
er
Educ
atio
n
Heal
th
Road
s
Elec
trici
ty
Wat
er
1. Emerging Market Economies 2. Low-Income Developing Countries
Figure 2.13. Additional Spending Requirement forMeeting the SDGs by 2030(Percentage of 2030 GDP)
Additional spending could amount to 4.7 percentage points for emerging market economies and 14.9 percentage points for low-income developing countries of their own 2030 GDP.
Source: IMF staff estimates.Note: SDGs = Sustainable Development Goals.
©International Monetary Fund. Not for Redistribution

39International Monetary Fund | April 2021
C H A P T E R 2 A F A I R S h O T
In addition, countries with robust tax systems may consider levying temporary COVID-19 recovery contri-butions as supplements to top personal income tax rates. Temporary increases in personal income tax rates (often restricted to the highest income brackets) were previously introduced during exceptional circumstances in Germany (1991), Australia (2011), and Japan (2013) (Abdel-Kader and De Mooij 2020).21 Alternatively, taxes on “excess” profits (economic rents in excess of the minimum return required by investors), either in addition to or instead of the regular corporate income tax, can assure a contribu-tion from businesses that prosper during the crisis (such as some pharmaceutical and highly digitalized businesses) and not affect companies (and their workers) otherwise earning minimal profits or incurring losses.
Support for a Fair ShotWhether governments are investing in education,
health care, infrastructure, or social safety nets, they will face difficult policy choices on how to finance these cru-cial expenditures. The policy dilemma will be as acute as ever given more limited fiscal space (Chapter 1). Raising
21Temporary/one-off levies on net wealth would present bigger implementation challenges because they would need to be both unanticipated and believed certain not to be repeated (Keen 2013).
taxes or reallocating spending will require dialogue with society at large to ensure that policies are aligned with people’s preferences. Understanding these preferences, which have likely been affected by the COVID-19 crisis, will be crucial. Miscalculations can lead to political instability. Reinforcing trust in government is key to implementing needed public policies but is also more challenging during a pandemic.
Surveys by the International Social Survey Program before the COVID-19 pandemic, covering thousands of individuals in several advanced and emerging mar-ket economies, suggest that respondents want greater provision of basic public services through higher and more progressive taxes, and some spending cuts and reallocation. Such survey results must be read with cau-tion because they may capture views that are not fully representative of the population and may not force respondents to fully internalize budget constraints. Even so, they provide additional perspectives, especially where budget decisions are influenced by vested inter-ests and may not fully reflect citizens’ views.
Most respondents, particularly in emerging market economies, prefer more spending on education, health care, and pensions (Figure 2.16) and consider the provi-sion of these services as the government responsibility. At the same time, most respondents, especially in emerging market economies, want spending cuts. This may suggest
Infrastructure
Education
Health
Sources: Baum, Mogues, and Verdier 2020; Garcia-Escribano, Juarros, and Mogues (forthcoming); and IMF staff calculations.Note: All estimates are based on Data Envelopment Analysis; for health, output is life expectancy and input is total per capita health expenditure. For education, outputs are test scores and net enrollment rates and input is public education spending per student (Online Annex 2.4). For infrastructure, output is the volume and quality of infrastructure and input is public capital stock and GDP per capita.
0 20 40 60 80 100
Low-incomedeveloping countries
Emerging marketeconomies
Advanced economies
Figure 2.14. Sectoral Spending InefficienciesThere is considerable room for improving the efficiency of spending.
Efficiency gap (percent)
©International Monetary Fund. Not for Redistribution

40 International Monetary Fund | April 2021
F I S C A L M O N I T O R : A F A I R S h O T
a preference for a shift from wasteful or low-priority spending to key basic services such as health care and education. Those most well-off prefer less government spending. Women are in favor of more government spending, especially on health care. Demand for spend-ing cuts is less pronounced among young people.
Most respondents also prefer more progressive taxation. In most countries, more respondents believe that the tax burden is too high for low- and middle- income households compared with that of high- income households (Figure 2.17). This support is broad based, holding for advanced and emerging
Figure 2.16. Survey Results on Preferences for Tax-Financed Spending(Percent of respondents)
Percent of respondents0 25 50 75 100 25 50 750 100
Even before the pandemic, most respondents preferred more spending on education, health, and pensions.
Military
Police
Unemploymentbenefits
Pension
Health
Education
1. Advanced Economies 2. Emerging MarketEconomies
Sources: International Social Survey Program 2016 database; and IMF staff estimates.Note: Results are based on individual-level data on 23 advanced economies and 12 emerging market economies in 2016.
Much more More Same Less Much less
Advanced economiesEmerging market economies
Sources: International Social Survey Program 2016 database; and IMF staff estimates.Note: Results are based on 2016 individual-level data on 23 advanced economies and 12 emerging market economies. Percentages refer to the share of respondents who agree with the statements reported on each axis.
Figure 2.17. People’s Preference for Progressive Taxation(Percent of respondents)
Tax burden is too high for high-income earners (percent)0 20 40 60 80 100
Most respondents preferred progressive taxation, even before the pandemic.
Tax
burd
en is
too
high
for
low
-inco
me
earn
ers
(per
cent
)
100
80
60
40
20
0
Preference for more
progressive taxation
VAT
Source: IMF staff.Note: VAT = value-added tax. 1Especially applicable to advanced economies.2Especially applicable to emerging market economies and low-income developing countries.
Personal Income Tax• Set exemption thresholds below
GDP per capita• Restrain generalized deductions
• Raise top marginal rate, if feasible• Introduce temporary surcharge1
Corporate Income Tax• Rationalize profit-based tax incentives
for foreign direct investment2
• Rationalize special incentives for small and medium enterprises2
• Use antiavoidance rules against profit shifting
• Introduce excess profit taxes• Set extracitive industries under special
fiscal regimes2
Property Taxes• Raise property tax rates
• Update property values to current market prices
• Strengthen property registries and administrative capacity2
• Strengthen inheritance and gift taxes1
Consumption Taxes• Reduce VAT exempt and zero-rated
goods and services• Strengthen excise taxation by better
design, enforcement, and higher rates2
• Introduce or raise carbon taxes
Figure 2.15. Tax Reform Options to Raise Additional RevenueA variety of options are available, some especially suited to emerging market and developing economies.
©International Monetary Fund. Not for Redistribution

41International Monetary Fund | April 2021
C H A P T E R 2 A F A I R S h O T
market economies and for subgroups, including those in the richest decile and those with high or low trust in government (Online Annex 2.6).
Support for higher public spending also depends on people’s perceptions of how the government func-tions. Trust in government can depend on respondents’ view of the government’s integrity and capacity to deliver basic services, such as education and health care (Online Annex 2.6). Respondents who trust their gov-ernments are generally less likely to favor government spending cuts and more likely to favor additional spend-ing in at least one sector without cuts in others (Online Annex 2.6). Previous studies have also found that more trust in governments leads to demand for more distrib-utive policies (Yamamura 2014; Kuziemko and others 2015; Stantcheva 2020). Respondents who held a favor-able perception of government responses to COVID-19 were more willing to support financial relief for the vulnerable (Balasundharam and Dabla-Norris 2021).
Trust in government is low when respondents are dis-satisfied with the quality of basic services. Even if lower trust is associated with demand for spending cuts, it is also associated with demand for more services, suggest-ing that dissatisfied respondents do not consider their governments to provide value for tax money (Online Annex 2.6). When trust in government is low or corrup-tion is perceived to be high, respondents want changes in spending allocation— especially toward spending on education, health care, and pensions.22 With higher distrust in government, respondents also support more progressive taxation. This perhaps is due to the desire to correct inequalities that may be attributed to ill-gotten gains of the rich or weaknesses in tax collection (Di Tella, Dubra, and Lagomarsino 2016; Domonkos 2016; Online Annex 2.6).
The COVID-19 pandemic is likely changing peo-ple’s attitudes toward policies that affect the distribu-tion of income. Studies have found that preferences for distributive policies are influenced by major events.23 For example, after economic recessions (Giuliano
22The share of government spending on health care and education is lower in countries with higher perceived corruption (April 2019 Fiscal Monitor).
23These preferences may also reflect social norms (Alesina and Glaeser 2004), a reaction to the prevailing political regime (Alesina and Fuchs-Schündeln 2004), or perceptions on inequalities and on one’s own prospects of success (Engelhardt and Wagener 2014; Alesina, Stantcheva, and Teso 2018).
and Spilimbergo 2014) and experiences of personal misfortunes such as unemployment (Alesina and Giuliano 2011), people want more redistribution. In this context, several waves of the World Values Survey indicate that individuals with poor health view mea-sures to improve distribution more favorably (Online Annex 2.6). Evidence from a survey undertaken in the United States during the COVID-19 pandemic reveals that respondents who lost employment or suffered from the disease, or personally know someone who has, are more likely to support progressive taxation (Box 2.2).
The pandemic is a vital test for governments’ ability to maintain and reinforce people’s trust. The risk is high that trust in government could deteriorate after COVID-19, especially if a government’s response to the epidemic—including support to people and firms, as well as vaccination—is perceived to be inadequate or marred by favoritism or corruption. Past epidemics have undermined trust in political institutions and leaders in a durable manner (Aksoy, Eichengreen, and Saka 2020). In this context, ensuring fair and afford-able access to safe and effective COVID-19 vaccines for all—starting with frontline workers and those in high-risk groups—irrespective of national boundar-ies, is crucial. Global cooperation, including financial support to COVAX, is needed to provide adequate supplies to countries lagging in vaccination efforts (January 2021 World Economic Outlook Update). Such mass immunization campaigns require adequate fund-ing, organization, and infrastructure.
If governments can meet demands for basic services while strengthening transparency and accountability, trust will improve. With limited fiscal space, govern-ments will need to prioritize efficiency gains and real-location toward those most affected by the COVID-19 crisis before scaling up spending. At the same time, governments should plan medium-term policies for better basic services and better protection from income shocks while fostering a job-rich and inclusive recovery. If governments are unable to meet the challenge, the erosion of trust could lead to more polarized politics in which some call for a smaller government, while those affected by illness or job loss would urge for more gov-ernment services. Although the primary responsibility rests with country governments, the global community can provide financial and technical support as well as policy coordination.
©International Monetary Fund. Not for Redistribution

42 International Monetary Fund | April 2021
F I S C A L M O N I T O R : A F A I R S h O T
A study of Norwegian administrative data (Berg and Hebous 2021) finds that people who grow up in families with more wealth tend to have higher labor income, controlling for the education and incomes of their parents (Figure 2.1.1).
Norway is one of the few countries with a broad net wealth tax. In the 1990s, the liability threshold was net wealth of NKr500,000, with a progressive rate structure reaching 1.5 percent. As of 2020, the thresh-old had been increased to NKr1.5 million (more than
twice the average GDP per capita) and the rate made flat at 0.85 percent.
Berg and Hebous simulate a hypothetical income distribution in the absence of a wealth tax in the late 1990s and early 2000s by exploiting variation in tax liability for the same wealth. The counterfactual labor income distribution is more unequal than the actual income distribution (raising the Gini coefficient by about 1 point).
Percentile in the wage distributionPercentile in the capital income distribution
Source: Berg and Hebous 2021.
Log of net parental wealth, 1993–996 8 9 11 137 10 12 14 15 16
Figure 2.1.1. Norway: Percentile in the Income Distribution of Children versus Parental WealthNorwegians who grow up in families with more wealth tend to have higher labor income.
30
35
40
45
50
55
60
65
70
75
80
Perc
entil
e in
the
inco
me
dist
ribut
ion,
2013
–17
Box 2.1. Persistent Consequences of Wealth Inequality for the Next Generation’s Income: The Case of Norway
©International Monetary Fund. Not for Redistribution

43International Monetary Fund | April 2021
C H A P T E R 2 A F A I R S h O T
In the first survey-based analysis on progressive taxation after the onset of the coronavirus disease 2019 (COVID-19) crisis, Klemm and Mauro (2021) gauge how attitudes toward fiscal policy choices have changed in the context of the pandemic. Their study is based on an analysis of survey responses from a rep-resentative sample of 2,500 individuals in the United States in October 2020.
Respondents affected by the COVID-19 pan-demic report a stronger preference for progressive taxation— both a temporary recovery levy and permanent structural reform—than those who were not so affected. Roughly one-half of the respondents reported experiencing job loss or serious COVID-19 illness or knowing (well) someone who did. Those who experienced serious illness or job loss favored progressive taxation with a likelihood of 15 percent-age points higher than those who did not, controlling for socioeconomic and demographic factors. Even just knowing someone who was affected by the pandemic raised the likelihood of support. This result is consistent with previous findings that attitudes can
be molded by personal experiences during crises and other upheavals that have major economic effects. The increase in the likelihood of supporting pro-gressive tax reform is especially strong in groups—identified through their spending preferences—that are otherwise skeptical of such taxes.
This result needs to be interpreted with caution. First, it is unclear how long the effect will last. Previ-ous studies have documented that the effect of job loss during the global financial crisis on attitudes toward welfare programs was short lived (Margalit 2013). Yet, the effect of recessions (Giuliano and Spilimbergo 2014) and epidemics (Aksoy, Eichengreen, and Saka 2020) was found to be longer lasting by forging the attitudes of cohorts that experienced such upheavals as young adults, then entered the job market during their “impressionable age.” Second, to establish more general validity, further work will be necessary in other countries. Third, the survey is a static snapshot: it does not allow researchers to test whether the opposition to progressive taxation becomes more entrenched over time.
Box 2.2. Public Preferences for Progressive Taxation in the Post–COVID-19 World
©International Monetary Fund. Not for Redistribution

44 International Monetary Fund | April 2021
F I S C A L M O N I T O R : A F A I R S h O T
ReferencesAbay, K., G. Berhane, J. Hoddinott, and K. Tafere. 2020.
“COVID-19 and Food Security in Ethiopia: Do Social Protec-tion Programs Protect?” IFPRI Discussion Paper 1972, Inter-national Food Policy Research Institute, Washington, DC.
Abdel-Kader, K., and R. De Mooij. 2020. “Tax Policy and Inclusive Growth.” IMF Working Paper 20/271, International Monetary Fund, Washington, DC.
Adam, S., T. Besley, R. Blundell, S. Bond, R. Chote, M. Gammie, P. Johnson, G. Myles, and J. Poterba. 2011. “Taxes on Wealth Transfers.” In Tax by Design: The Mirrlees Review, edited by S. Adam, T. Besley, R. Blundell, S. Bond, R. Chote, M. Gammie, P. Johnson, G. Myles, and J. Poterba. Oxford: Oxford University Press.
Aiyar, S., and C. Ebeke. 2019. “Inequality of Opportunity, Inequality of Income, and Economic Growth.” IMF Working Paper 19/34, International Monetary Fund, Washington, DC.
Aizer, A. 2014. “Rising Inequality and Intergenerational Mobility: The Role of Public Investments in Human Capital.” CESifo Economic Studies 60 (2): 280–311.
Aksoy, C., B. Eichengreen, and O. Saka. 2020. “The Political Scar of Epidemics.” NBER Working Paper 27401, National Bureau of Economic Research, Cambridge, MA.
Alesina, A., and N. Fuchs-Schündeln. 2004. “Goodbye Lenin (or Not?): The Effect of Communism on People’s Prefer-ences.” American Economic Review 97 (4): 1507–28.
Alesina, A., and P. Giuliano. 2011. “Preferences for Redistri-bution.” In Handbook of Social Economics, Vol. 1A, edited by J. Benhabib, A. Bisin, and M. O. Jackson. Amsterdam: Elsevier.
Alesina, A., and E. Glaeser. 2004. Fighting Poverty in the US and Europe: A World of Difference. Oxford: Oxford University Press.
Alesina, A., S. Stantcheva, and E. Teso. 2018. “Intergenerational Mobility and Preferences for Redistribution.” American Economic Review 108 (2): 521–54.
Al Masri, D., V. Flamini, and F. Toscani. 2021. “The Short-Term Impact of COVID-19 on Labor Markets and Inequality in Brazil.” IMF Working Paper 21/66, International Monetary Fund, Washington, DC.
Andrew, A., S. Cattan, M. C. Dias, C. Farquharson, L. Kraftman, S. Krutikova, A. Phimister, and A. Sevilla. 2020. “Inequalities in Children’s Experiences of Home Learning during the COVID-19 Lockdown in England.” Working Paper 20/26, Institute for Fiscal Studies, London.
Aslam, A., and A. Shah. 2020. “Tec(h)tonic Shifts: Taxing the ‘Digital Economy.’” IMF Working Paper 20/76, International Monetary Fund, Washington, DC.
Aspachs, O., R. Durante, J. García Montalvo, A. Graziano, J. Mestres, and M. Reynal-Querol. 2020. “Real-Time Inequality and the Welfare State in Motion: Evidence from COVID-19 in Spain.” CEPR Discussion Paper 15118, Center for Economic and Policy Research, Washington, DC.
Attanasio, O. 2015. “The Determinants of Human Capital Formation during the Early Years of Life: Theory, Mea-surement, and Policies.” Journal of the European Economic Association 13 (6): 949–97.
Balasundharam, V., and E. Dabla-Norris. 2021. “Pandemics and Inequality: Perceptions and Preferences for Redistribution.” IMF Working Paper 21/53, International Monetary Fund, Washington, DC.
Balboni, C., O. Bandiera, R. Burgess, M. Ghatak, and A. Heil. 2020. “Why Do People Stay Poor?” STICERD–Economic Organisation and Public Policy Discussion Paper 067, Suntory and Toyota International Centres for Economics and Related Disciplines, London School of Economics and Political Science, London.
Barrera-Osorio, F., L. Linden, and J. Saavedra. 2020. “Medium- and Long-Term Educational Consequences of Alternative Conditional Cash Transfer Designs: Experimental Evidence from Colombia.” NBER Working Paper 23275, National Bureau of Economic Research, Cambridge, MA.
Bau, N., and J. Das. 2020. “Teacher Value Added in a Low-Income Country.” American Economic Journal: Economic Policy 12 (1): 62–96.
Baum, A., T. Mogues, and G. Verdier. 2020. “Getting the Most from Public Investment.” In Well Spent: How Strong Infrastructure Governance Can End Waste in Public Investment, edited by G. Schwartz, M. Fouad, T. Hansen, and G. Verdier, pp. 30–49. Washington, DC: International Monetary Fund.
Benedek, D., E. Gemayel, A. Senhadji, and A. Tieman. Forthcoming. “Post-Pandemic Assessment of the Sustain-able Development Goals.” IMF Staff Discussion Note, International Monetary Fund, Washington, DC.
Berg, K., and S. Hebous. 2021. “Does the Wealth Tax Improve Equality of Opportunity? Evidence from Norway.” IMF Working Paper 21/85, International Monetary Fund, Washington, DC.
Boniol, M., M. McIsaac, L. Xu, T. Wuliji, K. Diallo, and J. Campbell. 2019. “Gender Equity in the Health Workforce: Analysis of 104 Countries.” Working Paper 1, World Health Organization, Geneva.
Bounie, D., Y. Camara, E. Fize, J. Galbraith, C. Landais, C. Lavest, T. Pazem, and B. Savatier. 2020. “Consumption Dynamics in the COVID Crisis: Real-Time Insights from French Transaction and Bank Data.” CEPR Discussion Paper 15474, Center for Economic and Policy Research, Washington, DC.
Brandily, P., C. Brebion, S. Briole, and L. Khoury. 2020. “A Poorly Understood Disease? The Unequal Distribution of Excess Mortality due to COVID-19 across French Munici-palities.” NHH Department of Economics Discussion Paper 15/2020, Norwegian School of Economics, Bergen, Norway.
Brown, C. S., and M. Ravallion. 2020. “Inequality and the Coronavirus: Socioeconomic Covariates of Behavioral Responses and Viral Outcomes across US Counties.” NBER Working Paper 27549, National Bureau of Economic Research, Cambridge, MA.
©International Monetary Fund. Not for Redistribution
45International Monetary Fund | April 2021
C H A P T E R 2 A F A I R S h O T
Brum, M., and M. De Rosa. 2020. “Too Little but Not Too Late: Nowcasting Poverty and Cash Transfers’ Incidence during COVID-19’s Crisis.” World Development 140: Article 105227.
Bulman, G. B., and C. M. Hoxby. 2015. “The Returns to the Federal Tax Credits for Higher Education.” NBER Working Paper 20833, National Bureau of Economic Research, Cambridge, MA.
Cantó Sánchez, O., F. Figari, C. Fiorio, S. Kuypers, S. Marchal, M. Romaguera de la Cruz, I. Tasseva, and G. Verbist. 2021. “Welfare Resilience at the Onset of the COVID-19 Pandemic in a Selection of European Countries: Impact on Public Finance and Household Incomes.” Euromod Working Paper Series 4/21, University of Essex, Essex, UK.
Card, D., C. Domnisoru, and L. Taylor. 2018. “The Intergener-ational Transmission of Human Capital: Evidence from the Golden Age of Upward Mobility.” NBER Working Paper 25000, National Bureau of Economic Research, Cambridge, MA.
Carey, D., J. Chouraqui, and R. Hagemann. 1993. “The Future of Capital Income Taxation in a Liberalised Financial Environment.” Organisation for Economic Co-operation and Development, Paris.
Case, A., D. Lubotsky, and C. Paxson. 2002. “Economic Status and Health in Childhood: The Origins of the Gradient.” American Economic Review 92 (5): 1308–34.
Causa, O., and M. Hermansen. 2018. “Income Redistribution through Taxes and Transfers across OECD Countries.” LIS Working Paper 729, LIS Cross-National Data Center, Luxembourg.
Chen, J. T., and N. Krieger. 2020. “Revealing the Unequal Burden of COVID-19 by Income, Race/Ethnicity, and Household Crowding: US County vs Zip Code Analyses.” Working Paper 19 (1), Harvard Center for Population and Development Studies, Cambridge, MA.
Chetty, R., J. Friedman, N. Hendren, M. Stepner, and the Opportunity Insights Team. 2020. “The Economic Impacts of COVID-19: Evidence from a New Public Database Built from Private Sector Data.” Opportunity Insights (blog), Center for First-Generation Student Success, September. https:// firstgen .naspa .org/ scholarly -article/ the -economic -impacts -of -covid -19 -evidence -from -a -new -public -database -built -from -private -sector -data.
Chetty, R., N. Hendren, P. Kline, and E. Saez. 2015. “The Economic Impacts of Tax Expenditures: Evidence from Spatial Variation across the US.” US Internal Revenue Service, Washington, DC.
Chiou, L., and C. Tucker. 2020. “Social Distancing, Internet Access and Inequality.” NBER Working Paper 26982, National Bureau of Economic Research, Cambridge, MA.
CONEVAL (Consejo Nacional de Evaluación de la Política de Desarrallo Social, National Council for the Evaluation of Social Development Policy). 2020. “CONEVAL Presents Information about the Trend Index Labor Poverty and Labor
Poverty for the Third Quarter of 2020.” Direccion de Infor-mation y Comunication Social, Comunicado 32, Mexico City.
Corak, M. 2013. “Income Inequality, Equality of Opportunity, and Intergenerational Mobility. Journal of Economic Perspec-tives 27 (3, Summer): 79–102.
Cunha, F., and J. Heckman. 2007. “The Technology of Skill Formation.” American Economic Review 97 (2): 31–47.
Currie, J. 2009. “Healthy, Wealthy, and Wise? Socioeconomic Status, Poor Health in Childhood, and Human Capital Development.” Journal of Economic Literature 47: 87–122.
Davidovic, S., S. Nunhuck, D. Prady, and H. Tourpe. 2020. “Beyond the COVID-19 Crisis: A Framework for Sustainable Government-to-Person Mobile Money Transfers.” IMF Work-ing Paper 20/198, International Monetary Fund, Washington, DC.
De Mooij, R., R. Fenochietto, S. Hebous, S. Leduc, and C. Osorio-Buitron. 2020. “Tax Policy for Inclusive Growth after the Pandemic.” Special Series on COVID-19, International Monetary Fund, Washington, DC.
Di Tella, R., J. Dubra, and A. Lagomarsino. 2016. “Meet the Oligarchs: Business Legitimacy, State Capacity and Taxation.” NBER Working Paper 22934, National Bureau of Economic Research, Cambridge, MA.
Domonkos, S. 2016. “Determinants of Tax Policy Preferences in Post-Socialist Eastern Europe.” East European Politics and Societies and Cultures 30 (2): 423–48.
Dorband, I. I., M. Jakob, M. M. Kalkuhl, and J. C. Steckel. 2019. “Poverty and Distributional Effects of Carbon Pricing in Low- and Middle-Income Countries: A Global Comparative Analysis.” World Development 115 (C): 246–57.
Dorn, E., B. Hancock, J. Sarakatsannis, and E. Viruleg. 2020. “COVID-19 and Learning Loss–Disparities Grow and Stu-dents Need Help.” McKinsey & Company, Chicago.
Duflo, E. 2012. “Women Empowerment and Economic Devel-opment.” Journal of Economic Literature 50 (4): 1051–79.
Eissa, N., and J. Liebman. 1996. “Labor Supply Responses to the Earned Income Tax Credit.” Quarterly Journal of Economics 11 (2): 605–37.
Elborgh-Woytek, K., M. Newiak, K. Kochhar, S. Fabrizio, K. Kpodar, P. Wingender, B. Clements, and G. Schwartz. 2013. “Women, Work, and the Economy: Macroeconomic Gains from Gender Equity.” IMF Staff Discussion Note 13/10, International Monetary Fund, Washington, DC.
Engelhardt, C., and A. Wagener. 2014. “Biased Perceptions of Income Inequality and Redistribution.” CESifo Working Paper Series 4838, CESifo, Munich.
Engzell, P., A. Frey, and M. D. Verhagen. 2020. “Learning Inequality during the COVID-19 Pandemic.” SocArXiv Paper ve4z7, Center for Open Science, Charlottesville, VA.
Evans, D., M. Akmal, and P. Jakiela. 2020. “Gender Gaps in Education: The Long View.” CGD Working Paper 523, Center for Global Development, Washington, DC.
©International Monetary Fund. Not for Redistribution

46 International Monetary Fund | April 2021
F I S C A L M O N I T O R : A F A I R S h O T
Fuchs-Schündeln, N., D. Krueger, A. Ludwig, and I. Popova. 2020. “The Long-Term Distributional and Welfare Effects of COVID-19 School Closures.” NBER Working Paper 27773, National Bureau of Economic Research, Cambridge, MA.
Furceri, D., P. Loungani, J. D. Ostry, and P. Pizzuto. Forthcoming. “The Rise in Inequality after Pandemics: Can Fiscal Support Play a Mitigating Role?” IMF Working Paper, International Monetary Fund, Washington, DC.
Garcia-Escribano, M., P. Juarros, and T. Mogues. Forthcoming. “Patterns and Drivers of Health Spending Efficiency.” Unpublished Report.
Gaspar, V., D. Amaglobeli, M. Garcia-Escribano, D. Prady, and M. Soto. 2019. “Fiscal Policy and Development: Human, Social, and Physical Investments for the SDGs.” IMF Staff Discussion Note 19/03, International Monetary Fund, Washington, DC.
Gerber, C., A. Klemm, L. Liu, and V. Mylonas. 2020. “Income Tax Progressivity: Trends and Implications” Oxford Bulletin of Economics and Statistics 82 (2): 365–86.
Giuliano, P., and A. Spilimbergo. 2014. “Growing Up in a Recession.” Review of Economic Studies 81 (2): 787–817.
Grewenig, E., P. Lergetporer, L. Woessmann, and L. Zierow. 2020. “COVID-19 and Educational Inequality: How School Closures Affect Low- and High-Achieving Students.” CESifo Working Paper 8640 2020, CESifo, Munich.
Grigoli, F. 2015. “A Hybrid Approach to Estimating the Efficiency of Public Spending on Education in Emerging and Developing Economies.” Applied Economics and Finance 2 (1): 19–32.
Han, J., B. Meyer, and J. Sullivan. 2020. “Income and Poverty in the COVID-19 Pandemic.” NBER Working Paper 27729, National Bureau of Economic Research, Cambridge, MA.
Hanushek, E., P. Peterson, and L. Woessmann. 2012. “Achieve-ment Growth: International and US State Trends in Student Performance.” PEPG Report 12–03, Program on Education Policy and Governance, Harvard University, Cambridge, MA.
Harding, M., and M. Marten. 2018. “Statutory Tax Rates on Dividends, Interest, and Capital Gains: The Debt-Equity Bias at the Personal Level.” OECD Taxation Working Paper 34, OECD Publishing, Paris.
Hogan, A., B. Jewell, E. Sherrard-Smith, J. Vesga, O. Watson, C. Whittaker, and T. Hallett. 2020. “Potential Impact of the COVID-19 Pandemic on HIV, Tuberculosis, and Malaria in Low-Income and Middle-Income Countries: A Modelling Study.” Lancet Global Health 2020 (8): e1132–41.
Huang, C., L. Huang, Y. Wang, X. Li, L. Ren, X. Gu, L. Kang, L. Guo, M. Liu, X. Zhou, J. Luo, Z. Huang, S. Tu, Y. Zhao, L. Chen, D. Xu, Y. Li, C. Li, L. Peng, Y. Li, W. Xie. D. Cui, L. Shang, G. Fan, J. Xu, G. Wang, Y. Wang, J. Zhong, C. Wang, J. Wang, D. Zhang, and B. Cao. 2021. “6-Month Consequences of COVID-19 in Patients Discharged from Hospital: A Cohort Study.” Lancet 397: 220–32.
International Labour Organization (ILO). 2021. “ILO Monitor: COVID-19 and the World of Work. Seventh Edition.” Inter-national Labour Organization, Geneva.
Keats, A. 2018. “Women’s Schooling, Fertility, and Child Health Outcomes: Evidence from Uganda’s Free Primary Education Program.” Journal of Development Economics 135 (November): 142–59.
Keen, M. 2013. “Once and for All: Why Capital Levies are Not the Answer.” IMF Blog, International Monetary Fund, November 6.
Kindermann, F., and D. Krueger. Forthcoming. “High Marginal Tax Rates on the Top 1%? Lessons from a Life-Cycle Model with Idiosyncratic Income Risk.” American Economic Journal: Macroeconomics.
Klemm, A., and P. Mauro. 2021. “Pandemic and Progressivity.” IMF Working Paper 21/24, International Monetary Fund, Washington, DC.
Knittel, C. R., and B. Ozaltun. 2020. “What Does and Does Not Correlate with COVID-19 Death Rates.” NBER Working Paper 27391, National Bureau of Economic Research, Cambridge, MA.
Kuziemko, I., M. Norton, E. Saez, and S. Stantcheva. 2015. “How Elastic Are Preferences for Redistribution? Evidence from Randomized Survey Experiments.” NBER Working Paper 18865, National Bureau of Economic Research, Cambridge, MA.
Margalit, Y. 2013. “Explaining Social Policy Preferences: Evi-dence from the Great Recession.” American Political Science Review 107 (1): 80–103.
Marrero, G., and J. Rodríguez. 2013. “Inequality of Oppor-tunity and Growth.” Journal of Development Economics 104 (September): 107–22.
Mathai, K., C. Duenwald, Guscina, A., R. Al-Farah, H. Bukhari, A. Chaudry, M. El-Said, F. Fareed, K. Gerling, N. Le, F. Ricka, C. Serra, T. Sydorenko, S. Walker, and M. Zaher. 2020. “Social Spending for Inclusive Growth in the Middle East and Central Asia.” IMF Departmental Paper 20/12, International Monetary Fund, Washington, DC.
Narayan, A., R. Van der Weide, A. Cojocaru, C. Lakner, S. Redaelli, D. Mahler, R. Ramasubbaiah, and S. Thewissen. 2018. Fair Progress? Economic Mobility across Generations around the World. Washington, DC: World Bank.
Norregaard, J. 2013. “Taxing Immovable Property Revenue Potential and Implementation Challenges.” IMF Working Paper 13/129, International Monetary Fund, Washington, DC.
Office of the United Nations High Commissioner for Human Rights. 2020. “Disproportionate Impact of COVID-19 on Racial and Ethnic Minorities Needs to Be Urgently Addressed.” Press Release, June 2.
Organisation for Economic Co-operation and Development (OECD). 2013. PISA 2012 Results: What Makes Schools Successful? Resources, Policies and Practices. Volume IV. Paris: OECD Publishing.
Organisation for Economic Co-operation and Development (OECD). 2015. “How Do Differences in Social and Cultural
©International Monetary Fund. Not for Redistribution

47International Monetary Fund | April 2021
C H A P T E R 2 A F A I R S h O T
Background Influence Access to Higher Education and the Completion of Studies?” Education Indicators in Focus 35, OECD Publishing, Paris.
Organisation for Economic Co-operation and Development (OECD). 2016. “What Influences Spending on Education?” Education Indicators in Focus 46, OECD Publishing, Paris.
Organisation for Economic Co-operation and Development (OECD). 2018a. “Achieving Inclusive Growth in the Face of Digital Transformation and the Future of Work.” OECD Report to the G20 Finance Ministers, OECD Publishing, Paris.
Organisation for Economic Co-operation and Development (OECD). 2018b. “The Role and Design of Net Wealth Taxes in the OECD.” OECD Tax Policy Study 26, OECD Publishing, Paris.
Papageorge, N., M. Zahn, M. Belot, E. van den Broek- Altenburg, S. Choi, J. Jamison, and E. Tripodi. 2020. “Socio-Demographic Factors Associated with Self-Protecting Behavior during the COVID-19 Pandemic.” IZA Discussion Paper 13333, Institute of Labor Economics, Bonn.
Parker, S., and T. Vogl. 2018. “Do Conditional Cash Transfers Improve Economic Outcomes?” NBER Working Paper 24303, National Bureau of Economic Research, Cambridge, MA.
Platform for Collaboration on Tax. 2017. “Embarking on a Medium-Term Revenue Strategy.” MTRS Concept Note, Platform for Collaboration on Tax, Washington, DC.
Prady, D. 2020. “Reaching Households in Emerging and Devel-oping Economies: Citizen ID, Socioeconomic Data, and Digital Delivery.” Special Series on COVID-19, International Monetary Fund, Washington, DC.
Rosenberg, J., and D. Marron. 2015. “Tax Policy and Invest-ment by Startups and Innovative Firms.” Research Report, Urban-Brookings Tax Policy Center, Washington, DC.
Rubery, J., and A. Rafferty. 2013. “Women and Recession Revis-ited.” Work, Employment and Society 27 (3): 414–32.
Sachs, J., G. Schmidt-Traub, C. Kroll, G. Lafortune, G. Fuller, and F. Woelm. 2020. “The Sustainable Development Goals and COVID-19. Sustainable Development Report 2020.” Cambridge University Press, Cambridge, UK.
Saez, E., and G. Zucman. 2016. “Wealth Inequality in the United States since 1913: Evidence from Capitalized Income Tax Data.” Quarterly Journal of Economics 131 (2): 519–78.
Sarin, N., L. Summers, and J. Kupferberg. 2020. “Tax Reform for Progressivity: A Pragmatic Approach.” Policy Proposal, Hamilton Project, Brookings Institution, Washington, DC.
Scheuer, F., and J. Slemrod. 2021. “Taxing Our Wealth.” Journal of Economic Perspectives 35 (1): 207–30.
Schwartz, G., M. Fouad, T. Hansen, and G. Verdier, eds. 2020. Well Spent: How Strong Infrastructure Governance Can End Waste in Public Investment. Washington, DC: International Monetary Fund.
Stantcheva, S. 2020. “Understanding Tax Policy: How Do Peo-ple Reason?” NBER Working Paper 27699, National Bureau of Economic Research, Cambridge, MA.
Sutherland, D., R. Price, and F. Gonand. 2009. “Improving Public Spending Efficiency in Primary and Secondary Educa-tion.” OECD Journal: Economic Studies 1: 4.
Sze, S., D. Pan, C. Nevill, L. Gray, C. Martin, J. Nazareth, J. Minhas, P. Divall, K. Khunti, K. R. Abrams, L. B. Nellums, and M. Pareek. 2020. “Ethnicity and Clinical Outcomes in COVID-19: A Systematic Review and Meta-Analysis.” EClinicalMedicine 29–30: 100630.
Toder, E., and D. Baneman. 2012. “Distributional Effects of Individual Income Tax Expenditures: An Update.” Research Report, Urban-Brookings Tax Policy Center, Washington, DC.
Una, G., R. Allen, S. Pattanayak, and G. Suc. 2020. “Digital Solutions for Direct Cash Transfers in Emergencies.” Special Series on COVID-19, International Monetary Fund, Washington, DC.
World Bank. 2020a. COVID-19 High-Frequency Monitoring Dashboard. Washington, DC: World Bank, October.
World Bank. 2020b. Poverty and Shared Prosperity 2020: Reversals of Fortune. Washington, DC: World Bank.
World Bank. 2020c. “The COVID-19 Pandemic: Shocks to Education and Policy Responses.” World Bank, Washington, DC.
Yamamura, E. 2014. “Trust in Government and Its Effect on Preferences for Income Redistribution and Perceived Tax Burden.” Economics of Governance 15 (1): 71–100.
Yanez, D., N. Weiss, J. Romand, and M. Treggiari. 2020. “COVID-19 Mortality Risk for Older Men and Women.” BMC Public Health 20: 1742.
©International Monetary Fund. Not for Redistribution

This page intentionally left blank
©International Monetary Fund. Not for Redistribution

International Monetary Fund | April 2021 49
ECONOMY ABBREVIATIONS
Code Name
AFG AfghanistanAGO AngolaALB AlbaniaARE United Arab EmiratesARG ArgentinaARM ArmeniaATG Antigua and BarbudaAUS AustraliaAUT AustriaAZE AzerbaijanBDI BurundiBEL BelgiumBEN BeninBFA Burkina FasoBGD BangladeshBGR BulgariaBHR BahrainBHS Bahamas, TheBIH Bosnia and HerzegovinaBLR BelarusBLZ BelizeBOL BoliviaBRA BrazilBRB BarbadosBRN Brunei DarussalamBTN BhutanBWA BotswanaCAF Central African RepublicCAN CanadaCHE SwitzerlandCHL ChileCHN ChinaCIV Côte d’IvoireCMR CameroonCOD Congo, Democratic Republic of theCOG Congo, Republic ofCOL ColombiaCOM ComorosCPV Cabo VerdeCRI Costa RicaCYP CyprusCZE Czech RepublicDEU GermanyDJI DjiboutiDMA DominicaDNK Denmark
Code Name
DOM Dominican RepublicDZA AlgeriaECU EcuadorEGY EgyptERI EritreaESP SpainEST EstoniaETH EthiopiaFIN FinlandFJI FijiFRA FranceFSM Micronesia, Federated States ofGAB GabonGBR United KingdomGEO GeorgiaGHA GhanaGIN GuineaGMB Gambia, TheGNB Guinea-BissauGNQ Equatorial GuineaGRC GreeceGRD GrenadaGTM GuatemalaGUY GuyanaHKG Hong Kong Special Administrative RegionHND HondurasHRV CroatiaHTI HaitiHUN HungaryIDN IndonesiaIND IndiaIRL IrelandIRN IranIRQ IraqISL IcelandISR IsraelITA ItalyJAM JamaicaJOR JordanJPN JapanKAZ KazakhstanKEN KenyaKGZ Kyrgyz RepublicKHM CambodiaKIR KiribatiKNA St. Kitts and Nevis
©International Monetary Fund. Not for Redistribution

F I S C A L M O N I TO R: A FA I R S H OT
50 International Monetary Fund | April 2021
Code Name
KOR KoreaKWT KuwaitLAO Lao P.D.R.LBN LebanonLBR LiberiaLBY LibyaLCA St. LuciaLKA Sri LankaLSO LesothoLTU LithuaniaLUX LuxembourgLVA LatviaMAR MoroccoMDA MoldovaMDG MadagascarMDV MaldivesMEX MexicoMHL Marshall IslandsMKD North MacedoniaMLI MaliMLT MaltaMMR Myanmar MNE MontenegroMNG MongoliaMOZ MozambiqueMRT MauritaniaMUS MauritiusMWI MalawiMYS MalaysiaNAM NamibiaNER NigerNGA NigeriaNIC NicaraguaNLD Netherlands, TheNOR NorwayNPL NepalNZL New ZealandOMN OmanPAK PakistanPAN PanamaPER PeruPHL PhilippinesPLW PalauPNG Papua New GuineaPOL PolandPRT PortugalPRY ParaguayQAT Qatar
Code Name
ROU RomaniaRUS Russian FederationRWA RwandaSAU Saudi ArabiaSDN SudanSEN SenegalSGP SingaporeSLB Solomon IslandsSLE Sierra LeoneSLV El SalvadorSMR San MarinoSOM SomaliaSRB SerbiaSTP São Tomé and PríncipeSUR SurinameSVK Slovak RepublicSVN SloveniaSWE SwedenSWZ EswatiniSYC SeychellesSYR SyriaTCD ChadTGO TogoTHA ThailandTJK TajikistanTKM TurkmenistanTLS Timor-LesteTON TongaTTO Trinidad and TobagoTUN TunisiaTUR TurkeyTUV TuvaluTWN Taiwan Province of ChinaTZA TanzaniaUGA UgandaUKR UkraineURY UruguayUSA United StatesUZB UzbekistanVCT St. Vincent and the GrenadinesVEN VenezuelaVNM VietnamVUT VanuatuWSM SamoaYEM YemenZAF South AfricaZMB ZambiaZWE Zimbabwe
©International Monetary Fund. Not for Redistribution

International Monetary Fund | April 2021 51
GLOSSARY
Accelerated depreciation deductions Tax measures that reduce the taxable income of a firm, by allowing for greater deductions for depreciation of an asset (e.g., machinery) in its earlier years of use.
Automatic stabilizers Revenue and some expenditure items that adjust automatically to cyclical changes in the economy—for example, as output falls, revenue collections decline and unemployment benefits increase, which “automatically” provides demand support.
Balance sheet Statement of the values of the stock positions of assets owned and liabilities owed by a unit, or group of units, drawn up in respect of a particular point in time.
Contingent liabilities Obligations that are not explicitly recorded on government balance sheets and that arise only in the event of a particular discrete situation, such as a crisis.
Countercyclical fiscal policy Active changes in expenditure and tax policies to smooth the economic cycle (by contrast with the operation of automatic stabilizers); for instance, by cutting taxes or raising expenditures during an economic downturn.
Coverage of public benefits Share of individuals or households of a particular socioeconomic group who receive a public benefit.
Cyclically adjusted balance (CAB) Difference between the overall balance and the automatic stabilizers; equivalently, an estimate of the fiscal balance that would apply under current policies if output were equal to potential.
Cyclically adjusted primary balance (CAPB) Cyclically adjusted balance excluding net interest payments (interest expenditure minus interest revenue).
Equity injections by the public sector Purchase of shares (ownership) of a firm by governments or public corporations, to provide it with the required capital to continue operations.
Fiscal buffer Fiscal space created by saving budgetary resources and reducing public debt in good times.
Fiscal multiplier Measures the short-term impact of discretionary fiscal policy on output. Usually defined as the ratio of a change in output to an exogenous change in the fiscal deficit with respect to their respective baselines.
General government All government units and all nonmarket, nonprofit institutions that are controlled and mainly financed by government units comprising the central, state, and local governments; includes social security funds and does not include public corporations or quasi corporations.
Government guarantees Government can provide coverage on the potential losses of the liabilities incurred by banks, firms, or households. They usually have no immediate upfront cost in the form of deficit or debt unless the expected cost is budgeted, but they create a contingent liability, with the government exposed to future calls on guarantees and fiscal risks.
Gross debt All liabilities that require future payment of interest and/or principal by the debtor to the creditor. This includes debt liabilities in the form of special drawing rights, currency, and deposits; debt securities; loans; insurance, pension, and standardized guarantee programs; and other accounts payable. (See the IMF’s 2001 Government Finance Statistics Manual and Public Sector Debt Statistics Manual.) The term “public debt” is used in the Fiscal Monitor, for simplicity, as synonymous with gross debt of the general government, unless specified otherwise. (Strictly speaking, public debt refers to the debt of the public sector as a whole, which includes financial and nonfinancial public enterprises and the central bank.)
In-kind benefits/transfers Government social assistance provided in terms of specific goods (e.g., food) or services (e.g., healthcare) instead of cash.
Job retention schemes Government programs that provide payments to employers to retain current employees, either part or full time. The payments typically cover part or all of an employees’ hours worked, or top up an employees’ pay for hours reduced (i.e., lost wages).
©International Monetary Fund. Not for Redistribution

F I S C A L M O N I TO R: A FA I R S H OT
52 International Monetary Fund | April 2021
Liquid assets Assets that can be readily converted to cash.
Net debt Gross debt minus financial assets corresponding to debt instruments. These financial assets are monetary gold and special drawing rights; currency and deposits; debt securities; loans, insurance, pensions, and standardized guarantee programs; and other accounts receivable. In some countries, the reported net debt can deviate from this definition based on available information and national fiscal accounting practices.
Output gap Deviation of actual from potential GDP, in percent of potential GDP.
Overall fiscal balance (also “headline” fiscal balance) Net lending and borrowing, defined as the difference between revenue and total expenditure, using the IMF’s 2001 Government Finance Statistics Manual (GFSM 2001). Does not include policy lending. For some countries, the overall balance is still based on the GFSM 1986, which defines it as total revenue and grants minus total expenditure and net lending.
Potential output Estimate of the level of GDP that can be reached if the economy’s resources are fully employed.
Primary balance Overall balance excluding net interest payments (interest expenditure minus interest revenue).
Progressive (or regressive) taxes Taxes that feature an average tax rate that rises (or falls) with income.
Public debt See gross debt.
Public sector Includes all resident institutional units that are deemed to be controlled by the government. It includes general government and resident public corporations.
Quasi-fiscal activities Non-commercial activities (such as subsidies or loans) undertaken by public corporations (such as state-owned enterprises or banks) on behalf of the government, outside their regular mandate.
Social insurance Programs aimed at protecting households from shocks that can adversely impact their incomes and welfare; typically financed by contributions or payroll taxes.
Social protection Comprise social insurance and social safety nets.
Social safety nets Noncontributory transfer programs financed by general government revenue.
Structural primary balance Extension of the cyclically adjusted primary balance that also corrects for other nonrecurrent effects that go beyond the cycle, such as one-off operations and other factors whose cyclical fluctuations do not coincide with the output cycle (for instance, asset and commodity prices and output composition effects).
Wage subsidies Government payments to workers or their employers to incentivize employers to recruit or retain (often disadvantaged) workers.
©International Monetary Fund. Not for Redistribution

This appendix comprises four sections. “Data and Conventions” provides a general description of the data and conventions used to calculate economy group composites. “Fiscal Policy Assumptions” summarizes the country-specific assumptions underlying the esti-mates and projections for 2021–26. “Definition and Coverage of Fiscal Data” summarizes the classification of countries in the various groups presented in the Fiscal Monitor and provides details on the coverage and accounting practices underlying each country’s Fiscal Monitor data. Statistical tables on key fiscal variables complete the appendix. Data in these tables have been compiled based on the information available through March 23, 2021.
Data and Conventions Country-specific data and projections for key fiscal
variables are based on the April 2021 World Economic Outlook database, unless indicated otherwise, and com-piled by IMF staff. Historical data and projections are based on information gathered by IMF country desk officers in the context of their missions and through their ongoing analysis of the evolving situation in each country; they are updated on a continual basis as more information becomes available. Structural breaks in data may be adjusted to produce smooth series through splicing and other techniques. IMF staff estimates serve as proxies when complete information is unavailable. As a result, Fiscal Monitor data may differ from official data in other sources, including the IMF’s International Financial Statistics and Government Financial Statistics.
Sources for fiscal data and projections not covered by the World Economic Outlook database are listed in the respective tables and figures.
The country classification in the Fiscal Monitor divides the world into three major groups: 39 advanced economies, 96 emerging market and middle-income economies, and 59 low-income developing countries. Fiscal Monitor tables display 35 advanced economies, 40 emerging market and middle-income econo-mies, and 40 low-income developing countries. The countries in the tables generally represent the largest countries within each group based on the size of their
GDP in current US dollars. Data for full list of econo-mies can be found here: https://www.imf.org/external/datamapper/datasets/FM. The seven largest advanced economies as measured by GDP (Canada, France, Germany, Italy, Japan, United Kingdom, United States) constitute the subgroup of major advanced economies, often referred to as the Group of Seven. The members of the euro area are also distinguished as a subgroup. Composite data shown in the tables for the euro area cover the current members for all years, even though the membership has increased over time. Data for most European Union member countries have been revised following the adoption of the new European System of National and Regional Accounts (ESA 2010). Low-income developing countries are countries that have per capita income levels below a certain threshold (currently set at $2,700, as of 2016, as measured by the World Bank’s Atlas method), structural features consistent with limited development and structural transformation, and external finan-cial linkages insufficiently open to be considered as emerging market economies. Emerging market and middle-income economies include those not classified as advanced economies or low-income developing countries. See Table A, “Economy Groupings,” for more details.
Most fiscal data refer to the general government for advanced economies, while for emerging market and developing economies, data often refer to the central government or budgetary central government only (for specific details, see Tables B–D). All fiscal data refer to calendar years, except in the cases of The Bahamas, Bangladesh, Barbados, Bhutan, Botswana, Dominica, Egypt, Eswatini, Ethiopia, Haiti, Hong Kong Special Administrative Region, India, the Islamic Republic of Iran, Jamaica, Lesotho, Malawi, Marshall Islands, Mauritius, Micronesia, Myanmar, Namibia, Nauru, Nepal, Pakistan, Palau, Puerto Rico, Rwanda, St. Lucia, Samoa, Singapore, Thailand, Tonga, and Trinidad and Tobago, for which they refer to the fiscal year. For economies whose fiscal years end before June 30, data are recorded in the previous calendar year. For economies whose fiscal years end on or after June 30, data are recorded in the current calendar year.
METHODOLOGICAL AND STATISTICAL APPENDIX
53International Monetary Fund | April 2021
©International Monetary Fund. Not for Redistribution
54
F I S C A L M O N I T O R : A F A I R S h O T
International Monetary Fund | April 2021
Composite data for country groups are weighted averages of individual-country data, unless specified otherwise. Data are weighted by annual nominal GDP converted to US dollars at average market exchange rates as a share of the group GDP.
For the purpose of data reporting in the Fiscal Monitor, the Group of 20 member aggregate refers to the 19 country members and does not include the European Union.
In the majority of advanced economies, and some large emerging market and middle-income economies, fiscal data follow the IMF’s 2014 Government Finance Statistics Manual (GFSM 2014) or are produced using national accounts methodology that follow the System of National Accounts 2008 (SNA 2008) or ESA 2010, both of which are broadly aligned with the GFSM 2014. Most other countries follow the GFSM 2001, but some countries, including a significant proportion of low-income developing countries, have fiscal data that are based on the 1986 GFSM. The overall fiscal balance refers to net lending (+) and borrowing (−) of the general government. In some cases, however, the overall balance refers to total revenue and grants minus total expenditure and net lending.
The fiscal gross and net debt data reported in the Fiscal Monitor are drawn from official data sources and IMF staff estimates. While attempts are made to align gross and net debt data with the definitions in the GFSM, as a result of data limitations or specific country circumstances, these data can sometimes deviate from the formal definitions. Although every effort is made to ensure the debt data are relevant and internationally comparable, differences in both sectoral and instrument coverage mean that the data are not universally comparable. As more information becomes available, changes in either data sources or instrument coverage can give rise to data revisions that are some-times substantial.
As used in the Fiscal Monitor, the term “country” does not in all cases refer to a territorial entity that is a state as understood by international law and prac-tice. As used here, the term also covers some territorial entities that are not states but whose statistical data are maintained on a separate and independent basis.
Australia: For cross-economy comparability, gross and net debt levels reported by national statistical agencies for economies that have adopted the 2008 System of National Accounts (2008 SNA—Australia, Canada, Hong Kong Special Administrative Region,
United States) are adjusted to exclude unfunded pension liabilities of government employees’ defined-benefit pension plans.
Bangladesh: Data are on a fiscal year basis. Brazil: General government data refer to the non-
financial public sector—which includes the federal, state, and local governments, as well as public enter-prises (excluding Petrobras and Eletrobras)—and are consolidated with those for the sovereign wealth fund. Revenue and expenditures of federal public enterprises are added in full to the respective aggregates. Transfers and withdrawals from the sovereign wealth fund do not affect the primary balance. Disaggregated data on gross interest payments and interest receipts are available only from 2003 onward. Before 2003, total revenue of the general government excludes interest receipts; total expenditure of the general government includes net interest payments. Gross public debt includes the Treasury bills on the central bank’s balance sheet, including those not used under repurchase agreements. Net public debt consolidates nonfinancial public sector and central bank debt. The national defi-nition of general government gross debt excludes gov-ernment securities held by the central bank, except the stock of Treasury securities used for monetary policy purposes by the central bank (those pledged as security reverse repurchase agreement operations). According to this national definition, gross debt amounted to 88.8 percent of GDP at the end of 2020.
Canada: For cross-economy comparability, gross and net debt levels reported by national statistical agencies for economies that have adopted the 2008 SNA (Australia, Canada, Hong Kong Special Admin-istrative Region, United States) are adjusted to exclude unfunded pension liabilities of government employees’ defined-benefit pension plans.
Chile: Cyclically adjusted balances refer to the struc-tural balance, which includes adjustments for output and commodity price developments.
China: Public debt data include central government debt as reported by the Ministry of Finance, explicit local government debt, and shares based on estimates from the National Audit Office estimate—of contin-gent liabilities the government may incur. IMF staff estimates exclude central government debt issued for the China Railway Corporation. Relative to the author-ities’ definition, consolidated general government net borrowing includes (1) transfers to and from stabiliza-tion funds; (2) state-administered funds, state-owned
©International Monetary Fund. Not for Redistribution

55International Monetary Fund | April 2021
M E T h O D O L O G I C A L A N D S T A T I S T I C A L A P P E N D I X
enterprise funds, and social security contributions and expenses; and (3) some off-budget spending by local governments. Deficit numbers do not include some expenditure items, mostly infrastructure invest-ment financed off budget through land sales and local government financing vehicles. Fiscal balances are not consistent with reported debt, because no time series of data in line with the National Audit Office debt definition is published officially.
Colombia: Gross public debt refers to the combined public sector, including Ecopetrol and excluding Banco de la República’s outstanding external debt.
Dominican Republic: The fiscal series have the following coverage: the public debt, debt service, and cyclically adjusted or structural balances are for the consolidated public sector (which includes the central government, the rest of the nonfinancial public sector, and the central bank); and the remaining fiscal series are for the central government.
Egypt: Data are on a fiscal year basis. Ethiopia: Data are on a fiscal year basis. Greece: General government gross debt follows the
Maastricht definition, and includes short-term debt and loans of state-owned enterprises.
Haiti: Data are on a fiscal year basis.Hong Kong Special Administrative Region: Data are
on a fiscal year basis. Cyclically adjusted balances include adjustments for land revenue and investment income. For cross-economy comparability, gross and net debt levels reported by national statistical agen-cies for countries that have adopted the 2008 SNA (Australia, Canada, Hong Kong Special Administra-tive Region, United States) are adjusted to exclude unfunded pension liabilities of government employees’ defined-benefit pension plans.
Iceland: Gross debt excludes insurance technical reserves (including pension liabilities) and other accounts payable.
India: Data are on a fiscal year basis.Islamic Republic of Iran: Data are on a fiscal year basis. Ireland: General government balances for 2012
reflect the impact of banking sector support. Fiscal bal-ance, estimates excluding these measures, are −7.9 per-cent of GDP for 2012. For 2015, if the conversion of the government’s remaining preference shares to ordi-nary shares in one bank is excluded, the fiscal balance is −1.1 percent of GDP. Cyclically adjusted balances reported in Tables A3 and A4 exclude financial sector support measures. Ireland’s 2015 national accounts
were revised as a result of restructuring and relocation of multinational companies, which resulted in a level shift of nominal and real GDP. For more information, see “National Income and Expenditure Annual Results 2015.” http://www.cso.ie/en/releasesandpublications/er/nie/nationalincomeandexpenditureannualresults2015/.
Japan: Gross debt is on an unconsolidated basis.Latvia: The fiscal deficit includes bank restructur-
ing costs and thus is higher than the deficit in official statistics.
Mexico: General government refers to the central government, social security funds, public enterprises, development banks, the national insurance corpo-ration, and the National Infrastructure Fund, but excludes subnational governments.
Myanmar: Data are on a fiscal year basis.Nepal: Data are on a fiscal year basis.Norway: Cyclically adjusted balances correspond
to the cyclically adjusted non-oil overall or primary balance. These variables are in percent of non-oil potential GDP.
Pakistan: Data are on a fiscal year basis. Peru: Cyclically adjusted balances include adjust-
ments for commodity price developments.Singapore: Data are on a fiscal year basis. Spain: Overall and primary balances include finan-
cial sector support measures estimated to be 3.7 per-cent of GDP for 2012, 0.3 percent of GDP for 2013, 0.1 percent of GDP for 2014, 0.1 percent of GDP for 2015, and 0.2 percent of GDP for 2016.
Sweden: Cyclically adjusted balances take into account output and employment gaps.
Switzerland: Data submissions at the cantonal and commune levels are received with a long and variable lag and are subject to sizable revisions. Cyclically adjusted balances include adjustments for extraordinary operations related to the banking sector.
Thailand: Data are on a fiscal year basis.Turkey: The fiscal projections assume a more
negative primary and overall balance than envisaged in the authorities’ New Economic Program 2021–23 (September 2020), partly due to the deterioration in the growth outlook related to the COVID-19 pandemic, and partly due to definitional differences. The basis for the projections in the World Economic Outlook and Fiscal Monitor is the IMF-defined fiscal balance, which excludes some revenue and expen-diture items included in the authorities’ headline balance.
©International Monetary Fund. Not for Redistribution

56
F I S C A L M O N I T O R : A F A I R S h O T
International Monetary Fund | April 2021
United States: Cyclically adjusted balances exclude financial sector support estimated at 0.1 percent of potential GDP for 2012, and 0.0 percent of potential GDP for 2013. For cross-economy comparability, expenditure and fiscal balances of the United States are adjusted to exclude the imputed interest on unfunded pension liabilities and the imputed compensation of employees, which are counted as expenditures under the 2008 SNA adopted by the United States, but not for countries that have not yet adopted the 2008 SNA. Data for the United States may thus differ from data published by the US Bureau of Economic Analysis (BEA). In addition, gross and net debt levels reported by the BEA and national statistical agencies for other economies that have adopted the 2008 SNA (Australia, Canada, Hong Kong Special Administrative Region) are adjusted to exclude unfunded pension liabilities of government employees’ defined-benefit pension plans.
Uruguay: Data are for the nonfinancial public sector (NFPS), which includes the central government, the local government, social security funds, nonfinan-cial public corporations, and Banco de Seguros del Estado. The coverage of fiscal data was changed from the consolidated public sector to the NFPS with the October 2019 submission. Because of this narrower coverage, central bank balances are not included in the fiscal data.
Venezuela: Fiscal accounts include the budgetary central government; social security funds; FOGADE (insurance deposit institution); and a sample of public enterprises, including Petróleos de Venezuela, S.A. (PDVSA). Data for 2018–19 are IMF staff estimates.
Fiscal Policy Assumptions Historical data and projections of key fiscal aggre-
gates are in line with those of the April 2021 World Economic Outlook, unless noted otherwise. For under-lying assumptions other than on fiscal policy, see the April 2021 World Economic Outlook.
Short-term fiscal policy assumptions are based on officially announced budgets, adjusted for differences between the national authorities and IMF staff regard-ing macroeconomic assumptions and projected fiscal outturns. Medium-term fiscal projections incorporate policy measures that are judged likely to be imple-mented. When IMF staff have insufficient informa-tion to assess the authorities’ budget intentions and prospects for policy implementation, an unchanged
structural primary balance is assumed, unless indicated otherwise.
Argentina: Fiscal projections are based on the avail-able information regarding budget outturn and budget plans for the federal and provincial governments, fiscal measures announced by the authorities, and IMF staff projections.
Australia: Fiscal projections are based on data from the Australian Bureau of Statistics, the fiscal year 2020/21 midyear Economic and Fiscal Outlook of the Commonwealth and government, the fiscal year 2020/21 budget published by each state/territory gov-ernment, and IMF staff estimates and projections.
Austria: Fiscal projections are based on data from Statistics Austria, the authorities’ projections, and IMF staff estimates and projections.
Belgium: Projections are based on the 2020–21 Stability Programme, the Draft Budgetary Plan 2020, the 2021 budget, and other available information on the authorities’ fiscal plans, with adjustments for IMF staff assumptions.
Brazil: Fiscal projections for 2021 reflect policy announcements as of March 12, 2021. Medium-term projections reflect full compliance with Brazil’s constitu-tional expenditure ceiling.
Cambodia: Historical fiscal and monetary data are from the Cambodian authorities. Projections are based on the IMF staff assumptions following discussions with the authorities.
Canada: Projections use baseline forecasts from the Fall Economic Statement 2020, and the most recent provincial budgets available. The IMF staff makes some adjustments to this forecast, including for differences in macroeconomic projections. The IMF staff fore-cast also incorporates the most recent data releases from Statistics Canada’s Canadian System of National Economic Accounts, including federal, provincial, and territorial budgetary outturns through the third quarter of 2020.
Chile: Projections are based on the authorities’ quarterly fiscal reports, adjusted to reflect IMF staff projections for GDP and copper prices.
China: After a large fiscal expansion in 2020, a mild tightening is projected for 2021 based on government policy announcements.
Colombia: Projections are based on the authorities’ policies and projections reflected in the Medium-Term Fiscal Framework 2019, adjusted to reflect IMF staff macroeconomic assumptions.
©International Monetary Fund. Not for Redistribution
57International Monetary Fund | April 2021
M E T h O D O L O G I C A L A N D S T A T I S T I C A L A P P E N D I X
Croatia: Projections are based on the macroeco-nomic framework and the authorities’ medium-term fiscal guidelines.
Cyprus: Projections are based on IMF staff assess-ments of authorities’ budget plans and IMF staff macroeconomic assumptions.
Czech Republic: Projections are based on the authori-ties’ budget forecast for 2018–19, with adjustments for IMF staff macroeconomic projections. Projections for 2019 onward are based on the country’s Convergence Programme and Fiscal Outlook.
Denmark: Estimates for 2020 are aligned with the latest official budget numbers, adjusted where appro-priate for IMF staff macroeconomic assumptions. For 2020, the projections incorporate key features of the medium-term fiscal plan as embodied in the authori-ties’ latest budget.
Egypt: Fiscal projections are mainly based on budget sector operations. Projections are based on the budget for the fiscal year 2020/21 and the IMF’s macroeco-nomic outlook.
Estonia: The forecast incorporates the authorities’ approved supplementary budget for 2020, adjusted for newly available information and for IMF staff’s macro-economic scenario.
Finland: Projections are based on the authorities’ announced policies, adjusted for the IMF staff macro-economic scenario.
France: Estimates for 2020 and projections for 2021 onward are based on the measures of the 2018, 2019, and 2020 budget laws; the four amending budget laws voted in 2020; the draft 2021 budget laws, adjusted for differences in assumptions on macroeconomic and financial variables; and revenue projections.
Germany: IMF staff estimates and projections for 2021 and beyond are based on the 2021 budgets and data updates from the national statistical agency and Ministry of Finance, adjusted for the differences in IMF staff mac-roeconomic framework and assumptions concerning rev-enue elasticities. The projections do not reflect the 2021 supplementary budget or draft 2022 federal budget. The estimate of gross debt includes portfolios of impaired assets and noncore businesses transferred to institutions that are winding up, as well as other financial sector and European Union support operations.
Greece: Greece’s general government primary balance estimate for 2020 is based on the preliminary budget execution data by the Greek authorities. Historical data since 2011 reflect adjustments in line with the primary
balance definition under the enhanced surveillance framework for Greece.
Hong Kong Special Administrative Region: Projec-tions are based on the authorities’ medium-term fiscal projections on expenditure.
Hungary: Fiscal projections include IMF staff pro-jections of the macroeconomic framework and fiscal policy plans announced in the 2020 budget.
India: Historical data are based on budgetary execu-tion data. Projections are based on available informa-tion on the authorities’ fiscal plans, with adjustments for IMF staff assumptions. Subnational data are incorporated with a lag of up to one year; general government data are thus finalized well after central government data. IMF and Indian presentations differ, particularly regarding divestment and license auction proceeds, net versus gross recording of revenues in cer-tain minor categories, and some public sector lending.
Indonesia: Fiscal projections are consistent with a gradual unwinding of the large fiscal stimulus in 2020, including returning the fiscal deficit to below 3 percent of GDP by 2023.
Ireland: Fiscal projections are based on the country’s Budget 2021 and Stability Programme Update 2020.
Israel: Historical data are based on Government Finance Statistics data prepared by the Central Bureau of Statistics. Projections are based on figures from the Ministry of Finance for the execution of the COVID fiscal package during 2020, and assumes partial imple-mentation of the package for 2021.
Italy: IMF staff estimates, and projections are informed by the fiscal plans included in the govern-ment’s 2021 budget. The stock of maturing postal saving bonds (BPF) is included in the debt projections.
Japan: The projections reflect fiscal measures already announced by the government as of March 9, 2021, with adjustments for IMF staff assumptions.
Kazakhstan: Fiscal projections are based on the bud-get code and IMF staff projections.
Korea: The forecast incorporates the overall fiscal balance in the 2021 annual and supplementary budget and the medium-term fiscal plan announced with the 2021 budget, and IMF staff adjustments.
Libya: Against the backdrop of a civil war and weak capacity, the reliability of Libya’s data, especially medium-term projections, is low.
Malaysia: Fiscal projections are based on budget numbers, discussions with the authorities, and IMF staff estimates.
©International Monetary Fund. Not for Redistribution
58
F I S C A L M O N I T O R : A F A I R S h O T
International Monetary Fund | April 2021
Malta: Projections are based on the latest Stability Programme Update by the authorities and on budget documents, which also take into account other recently adopted fiscal measures, adjusted for IMF staff macro-economic and other assumptions.
Mexico: The 2020 Public Sector Borrowing Require-ment estimate by IMF staff adjusts for some statistical discrepancies between above-the-line and below-the-line numbers, and proceeds from the oil hedge program as recommended in the 2018 Fiscal Transparency Evalua-tion report for Mexico. Fiscal projections for 2021 are broadly in line with the approved budget; projections for 2022 onward assume compliance with rules estab-lished in the Fiscal Responsibility Law.
Moldova: Fiscal projections are based on vari-ous bases and growth rates for GDP, consumption, imports, wages, and energy prices and on demographic changes.
Myanmar: Fiscal projections are based on budget numbers, discussions with the authorities, and IMF staff estimates.
Netherlands: Fiscal projections for the period 2020–25 are based on IMF staff forecast frameworks, and also informed by authorities’ draft budget plan and the Bureau for Economic Policy Analysis pro-jections. Historical data were revised following the June 2014 Central Bureau of Statistics release of macro data because of the adoption of the European System of National and Regional Accounts (ESA 2010) and the revisions of data sources.
New Zealand: Fiscal projections are based on Half Year Economic and Fiscal Update 2020 and IMF staff estimates.
Nigeria: Fiscal projections assume unchanged policies and differ from the authorities’ active policy scenario.
Norway: Fiscal projections are based on the 2020 budget and subsequent ad-hoc updates.
Philippines: Revenue projections reflect IMF staff macroeconomic assumptions and incorporate the updated data. Expenditure projections are based on budgeted figures, institutional arrangements, and cur-rent data in each year.
Poland: Data are based on ESA 1995 for 2004 and earlier. Data are based on ESA 2010 beginning in 2005 on an accrual basis. Projections are based on the 2020 budget and take into account additional fiscal measures that will subsequently be incorporated into a revised 2020 budget later this year.
Portugal: The projections for the current year are based on the authorities’ approved budget, adjusted to reflect the IMF staff’s macroeconomic forecast. Projections thereafter are based on the assumption of unchanged policies.
Romania: Projections for 2020 mainly reflect legis-lated changes up to the end of 2020. Medium-term projections include a gradual implementation of recov-ery measures from the temporary recovery instrument (Next Generation EU).
Russia: Fiscal policy was countercyclical in 2020. There will be some degree of consolidation in 2021 in line with economic recovery, and the deficit is likely to come back to the fiscal rule’s limit in 2022.
Saudi Arabia: IMF staff baseline fiscal projections are based on IMF staff’s understanding of government policies as outlined in the 2021 budget. Exported oil revenues are based on World Economic Outlook baseline oil price assumptions and IMF staff’s under-standing of Saudi Arabia’s current oil export policy under the OPEC+ agreement.
Singapore: For fiscal year 2020, projections are based on the initial budget, subsequent supplementary bud-gets, and budget execution through end of 2020. Fiscal year 2021 projections are based on the initial budget of February 16, 2021. IMF staff assumes gradual with-drawal of remaining exceptional measures in fiscal year 2022 and unchanged policies for the remainder of the projection period.
Slovak Republic: Fiscal projections are based on the 2021 budget but take into consideration available data for 2020 and include the new EU recovery funds (not included in the budget) for projection years.
Spain: The 2020 fiscal projections include the discretionary measures adopted in response to the COVID-19 crisis, the legislated pension and public wage, and the minimum vital income support. For 2021, the projections include COVID-19–related sup-port measures, the legislated increase in pensions, and the legislated revenue measures. Fiscal projections from 2022 onward assume no policy changes. Disbursement under the EU Recovery and Resilience Facility are reflected in the projections for 2021–24.
Sri Lanka: Fiscal projections are based on IMF staff assessments.
Sweden: Projections for 2020 are based on prelimi-nary information on the fall of 2020 budget bill. The fiscal impact of cyclical developments is calculated using the 2014 Organisation for Economic Co-operation
©International Monetary Fund. Not for Redistribution

59International Monetary Fund | April 2021
M E T h O D O L O G I C A L A N D S T A T I S T I C A L A P P E N D I X
and Development elasticity,1 which takes into account output and employment gaps.
Switzerland: The authorities’ announced a discre-tionary stimulus—as reflected in the fiscal projections for 2020 and 2021—which is permitted within the context of the debt brake rule in the event of “excep-tional circumstances.”
Turkey: The basis for the projections in the World Economic Outlook and Fiscal Monitor is the IMF-defined fiscal balance, which excludes some revenues and expen-diture items that are included in the authorities’ headline balance.
United Kingdom: Fiscal projections are based on the latest GDP data published by the Office for National Statistics on February 12, 2021, and on forecasts by the Office for Budget Responsibility from November 23, 2020. Revenue projections are adjusted for differences between IMF staff forecasts of macroeconomic variables (such as GDP growth and inflation) and the forecasts of these variables assumed in the authorities’ fiscal projections. Projections assume that the measures taken in response to the COVID-19 outbreak expire as announced. It is also assumed there is some additional fiscal consolidation relative to the policies announced to date starting in fiscal year 2023–24 with the goal of stabilizing public debt within five years. IMF staff data exclude public sector banks and the effect of transferring assets from the Royal Mail Pension Plan to the public sector in April 2012. Real government consumption and invest-ment are part of the real GDP path, which, according to the IMF staff, may or may not be the same as projected by the UK Office for Budget Responsibility. Data are presented on a calendar year basis.
United States: Fiscal projections are based on the September 2020 Congressional Budget Office baseline adjusted for IMF staff policy and macroeconomic assumptions. Projections then incorporate the effects of the American Rescue Plan; the Coronavirus Prepared-ness and Response Supplemental Appropriations Act; the Families First Coronavirus Response Act; and the Coronavirus Aid, Relief, Paycheck Protection Program
1Price, R., T. Dang, and Y. Guillemette. 2014. “New Tax and Expendi-ture Elasticity Estimates for EU Budget Surveillance.” OECD Economics Department Working Papers 1174. OECD Publishing, Paris.
and Health Care Enhancement Act. Finally, fiscal projections are adjusted to reflect IMF staff forecasts for key macroeconomic and financial variables, differ-ent accounting treatments of financial sector support, and defined-benefit pension plans, all of which are converted to a general government basis. Data are compiled using the 2008 System of National Accounts, and when translated into government financial statis-tics, this is in accordance with the Government Finance Statistics Manual 2014. Because of data limitations, most series begin in 2001.
Venezuela: Projecting the economic outlook in Venezuela, including assessing past and current eco-nomic developments as the basis for the projections, is complicated by the lack of discussions with the authorities (the last Article IV consultation took place in 2004), incomplete understanding of the reported data, and difficulties in interpreting certain reported economic indicators given economic developments. The fiscal accounts include the budgetary central gov-ernment, social security funds, FOGADE (insurance deposit institution), and a sample of public enterprises including PDVSA. The data for 2018–21 are IMF staff estimates. The effects of hyperinflation and the lack of reported data mean that IMF staff-projected macroeconomic indicators should be interpreted with caution. For example, nominal GDP is estimated assuming that the GDP deflator rises in line with IMF staff projections of average inflation. Public external debt in relation to GDP is projected using IMF staff estimates of the average exchange rate for the year. Considerable uncertainty surrounds these projections.
Vietnam: Fiscal data for 2015–17 are the authorities’ estimates. From 2018 onward, fiscal data are based on IMF staff projections.
Yemen: Hydrocarbon revenue projections are based on World Economic Outlook assumptions for oil and gas prices and authorities’ projections of production of oil and gas. Non-hydrocarbon revenues largely reflect the authorities’ projections, as do most of the expenditure categories, with the exception of fuel subsidies, which are projected based on the World Economic Outlook price consistent with revenues. Monetary projections are based on key macroeconomic assumptions about the growth rate of broad money, credit to the private sector, and deposit growth.
©International Monetary Fund. Not for Redistribution

60
F I S C A L M O N I T O R : A F A I R S h O T
International Monetary Fund | April 2021
Definition and Coverage of Fiscal DataTable A. Economy Groupings
The following groupings of economies are used in the Fiscal Monitor. Data for all the economies can be found here: https://www.imf.org/external/datamapper/datasets/FM
Advanced Economies
Emerging Market and Middle-Income Economies
Low-Income Developing Countries
G7 Countries
G20 Countries1
Advanced G20 Countries1
Emerging G20 Countries
AustraliaAustriaBelgiumCanadaCyprusCzech RepublicDenmarkEstoniaFinlandFranceGermanyGreeceHong Kong SARIcelandIrelandIsraelItalyJapanKoreaLatviaLithuaniaLuxembourgMacao SARMaltaNetherlandsNew ZealandNorwayPortugalPuerto RicoSan MarinoSingaporeSlovak RepublicSloveniaSpainSwedenSwitzerlandTaiwan Province
of ChinaUnited KingdomUnited States
AlbaniaAlgeriaAngolaAntigua and
BarbudaArgentinaArmeniaArubaAzerbaijanBahamas, TheBahrainBarbadosBelarusBelizeBoliviaBosnia and
HerzegovinaBrazilBrunei DarussalamBulgariaCabo VerdeChileChinaColombiaCosta RicaCroatiaDominicaDominican
RepublicEcuadorEgyptEl SalvadorEquatorial GuineaEswatiniFijiGabonGeorgiaGrenadaGuatemalaGuyanaHungaryIndiaIndonesiaIranIraqJamaicaJordanKazakhstanKosovoKuwaitLebanonLibyaMalaysiaMaldives
AfghanistanBangladeshBeninBhutanBurkina FasoBurundiCambodiaCameroonCentral Africa
RepublicChadComorosCongo, Democratic
Republic of theCongo, Republic ofCôte d’IvoireDjiboutiEritreaEthiopiaGambia, TheGhanaGuineaGuinea-BissauHaitiHondurasKenyaKiribatiKyrgyz RepublicLao P.D.R.LesothoLiberiaMadagascarMalawiMaliMauritaniaMoldovaMozambiqueMyanmarNepalNicaraguaNigerNigeriaPapua New GuineaRwandaSão Tomé and
PríncipeSenegalSierra LeoneSolomon IslandsSouth SudanSomaliaSudanTajikistanTanzania
CanadaFranceGermanyItalyJapanUnited
KingdomUnited States
ArgentinaAustraliaBrazilCanadaChinaFranceGermanyIndiaIndonesiaItalyJapanKoreaMexicoRussiaSaudi ArabiaSouth AfricaTurkeyUnited
KingdomUnited States
AustraliaCanadaFranceGermanyItalyJapanKoreaUnited
KingdomUnited States
ArgentinaBrazilChinaIndiaIndonesiaMexicoRussiaSaudi ArabiaSouth AfricaTurkey
©International Monetary Fund. Not for Redistribution
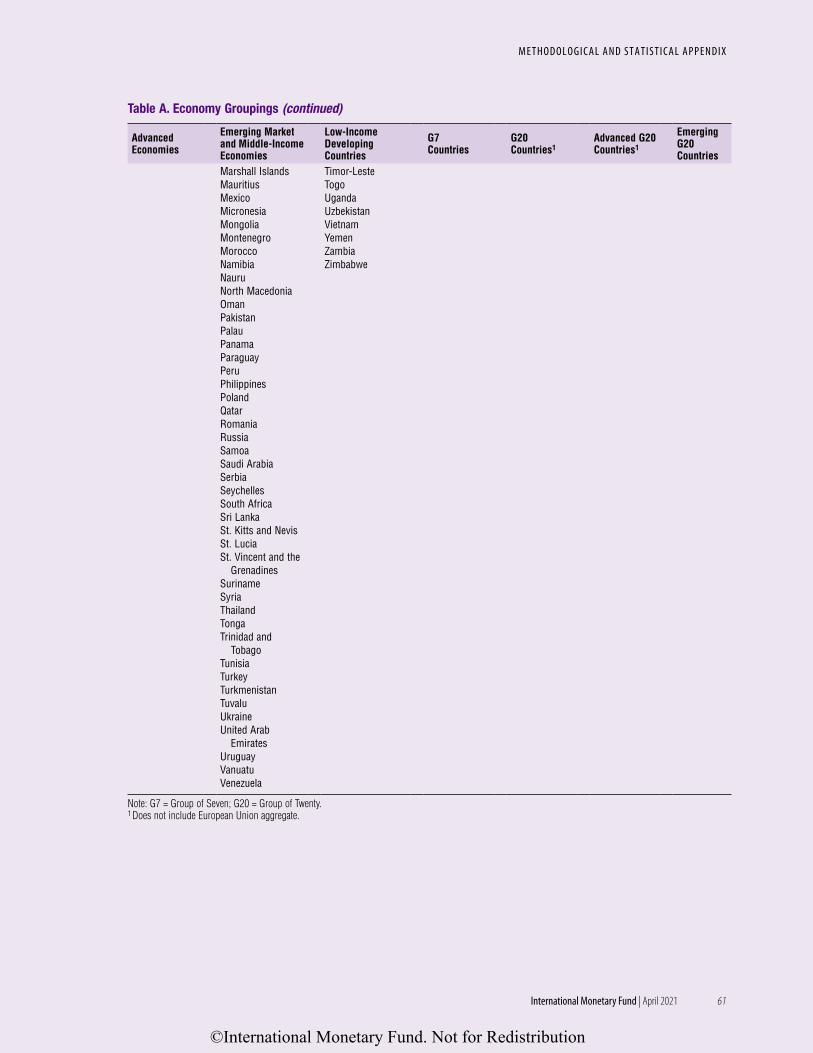
61International Monetary Fund | April 2021
M E T h O D O L O G I C A L A N D S T A T I S T I C A L A P P E N D I X
METHODOLOGICAL AND STATISTICAL APPENDIX
Table A. Economy Groupings (continued)
Advanced Economies
Emerging Market and Middle-Income Economies
Low-Income Developing Countries
G7 Countries
G20 Countries1
Advanced G20 Countries1
Emerging G20 Countries
Marshall IslandsMauritiusMexicoMicronesiaMongoliaMontenegroMoroccoNamibiaNauruNorth MacedoniaOmanPakistanPalauPanamaParaguayPeruPhilippinesPolandQatarRomaniaRussiaSamoaSaudi ArabiaSerbiaSeychellesSouth AfricaSri LankaSt. Kitts and NevisSt. LuciaSt. Vincent and the
GrenadinesSurinameSyriaThailandTongaTrinidad and
TobagoTunisiaTurkeyTurkmenistanTuvaluUkraineUnited Arab
EmiratesUruguayVanuatuVenezuela
Timor-LesteTogoUgandaUzbekistanVietnamYemenZambiaZimbabwe
Note: G7 = Group of Seven; G20 = Group of Twenty.1 Does not include European Union aggregate.
©International Monetary Fund. Not for Redistribution

62
F I S C A L M O N I T O R : A F A I R S h O T
International Monetary Fund | April 2021
Table A. Economy Groupings (continued)
Euro AreaEmerging Market and Middle-Income Asia
Emerging Market and Middle-Income Europe
Emerging Market and Middle-Income Latin America
Emerging Market and Middle-Income Middle East, North Africa, and Pakistan
Emerging Market and Middle-Income Africa
AustriaBelgiumCyprusEstoniaFinlandFranceGermanyGreeceIrelandItalyLatviaLithuaniaLuxembourgMaltaNetherlandsPortugalSlovak RepublicSloveniaSpain
Brunei DarussalamChinaFijiIndiaIndonesiaMalaysiaMaldivesMarshall IslandsMicronesiaMongoliaNauruPalauPhilippinesSamoaSri LankaThailandTongaTuvaluVanuatu
AlbaniaAzerbaijanBelarusBosnia and
HerzegovinaBulgariaCroatiaHungaryKazakhstanKosovoMontenegroNorth MacedoniaPolandRomaniaRussiaSerbiaTurkeyUkraine
Antigua and Barbuda
ArgentinaArubaBahamas, TheBarbadosBelizeBoliviaBrazilChileColombiaCosta RicaDominicaDominican RepublicEcuadorEl SalvadorGrenadaGuatemalaGuyanaJamaicaMexicoPanamaParaguayPeruSt. Kitts and NevisSt. LuciaSt. Vincent and the
GrenadinesSurinameTrinidad and TobagoUruguayVenezuela
AlgeriaBahrainEgyptIranIraqJordanKuwaitLebanonLibyaMoroccoOmanPakistanQatarSaudi ArabiaSyriaTunisiaUnited Arab Emirates
AngolaSouth Africa
©International Monetary Fund. Not for Redistribution
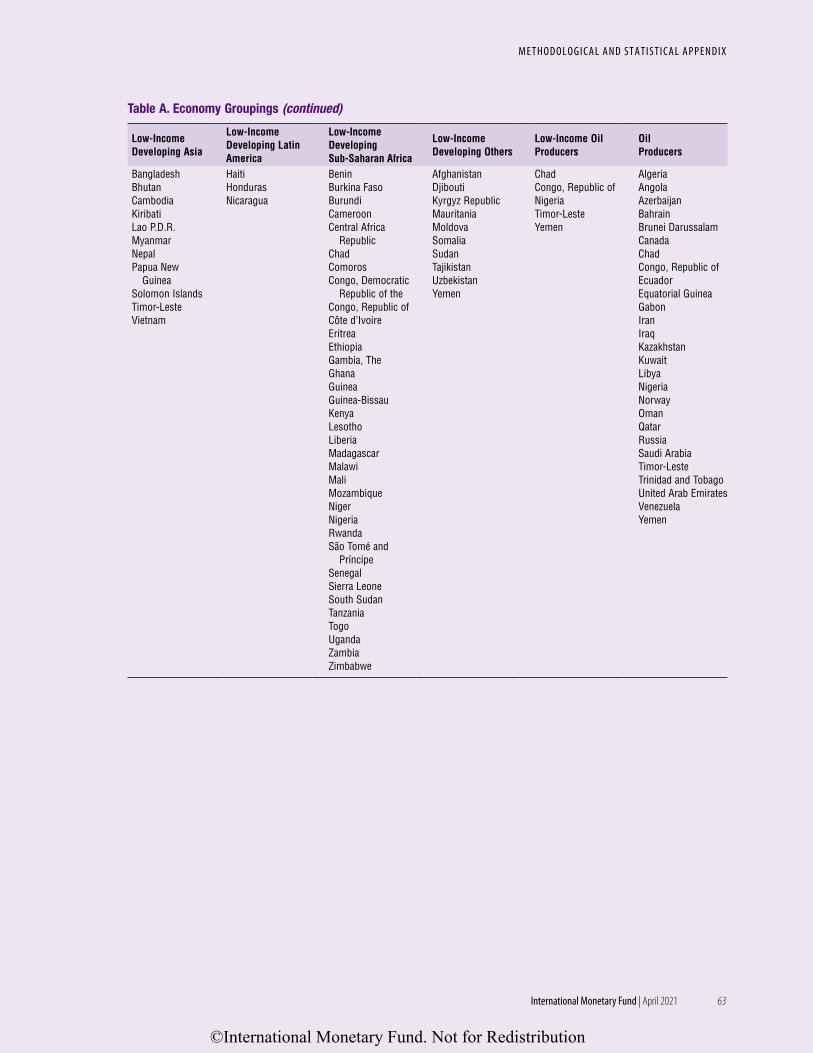
63International Monetary Fund | April 2021
M E T h O D O L O G I C A L A N D S T A T I S T I C A L A P P E N D I X
Table A. Economy Groupings (continued)
Low-Income Developing Asia
Low-Income Developing Latin America
Low-Income Developing Sub-Saharan Africa
Low-Income Developing Others
Low-Income Oil Producers
Oil Producers
BangladeshBhutanCambodiaKiribatiLao P.D.R.MyanmarNepalPapua New
GuineaSolomon IslandsTimor-LesteVietnam
Haiti HondurasNicaragua
BeninBurkina FasoBurundiCameroonCentral Africa
RepublicChadComorosCongo, Democratic
Republic of theCongo, Republic ofCôte d’IvoireEritreaEthiopiaGambia, TheGhanaGuineaGuinea-BissauKenyaLesothoLiberiaMadagascarMalawiMaliMozambiqueNigerNigeriaRwandaSão Tomé and
PríncipeSenegalSierra LeoneSouth SudanTanzaniaTogoUgandaZambiaZimbabwe
AfghanistanDjiboutiKyrgyz RepublicMauritaniaMoldovaSomaliaSudanTajikistanUzbekistanYemen
ChadCongo, Republic ofNigeriaTimor-LesteYemen
AlgeriaAngolaAzerbaijanBahrainBrunei DarussalamCanadaChadCongo, Republic ofEcuadorEquatorial GuineaGabonIranIraqKazakhstanKuwaitLibyaNigeriaNorwayOmanQatarRussiaSaudi ArabiaTimor-LesteTrinidad and TobagoUnited Arab EmiratesVenezuelaYemen
©International Monetary Fund. Not for Redistribution

64 FISCAL MONITOR : A FAIR ShOT
International Monetary Fund | April 2021
Table B. Advanced Economies: Definition and Coverage of Fiscal Monitor DataOverall Fiscal Balance1 Cyclically Adjusted Balance Gross Debt
Coverage Accounting Practice
Coverage Accounting Practice
Coverage Valuation of Debt2Aggregate Subsectors Aggregate Subsectors Aggregate Subsectors
Australia GG CG,SG,LG,TG A GG CG,SG,LG,TG A GG CG,SG,LG,TG Current market
Austria GG CG,SG,LG,SS A GG CG,SG,LG,SS A GG CG,SG,LG,SS Face
Belgium GG CG,SG,LG,SS A GG CG,SG,LG,SS A GG CG,SG,LG,SS Face
Canada GG CG,SG,LG,SS A GG CG,SG,LG,SS A GG CG,SG,LG,SS Face
Cyprus GG CG,LG,SS A GG CG,LG,SS A GG CG,LG,SS Face
Czech Republic GG CG,LG,SS A GG CG,LG,SS A GG CG,LG,SS Nominal
Denmark GG CG,LG,SS A GG CG,LG,SS A GG CG,LG,SS Face
Estonia GG CG,LG,SS C . . . . . . . . . GG CG,LG,SS Nominal
Finland GG CG,LG,SS A GG CG,LG,SS A GG CG,LG,SS Face
France GG CG,LG,SS A GG CG,LG,SS A GG CG,LG,SS Face
Germany GG CG,SG,LG,SS A GG CG,SG,LG,SS A GG CG,SG,LG,SS Face
Greece GG CG,LG,SS A GG CG,LG,SS A GG CG,LG,SS Nominal
Hong Kong SAR GG CG C GG CG C GG CG Face
Iceland GG CG,LG,SS A GG CG,LG,SS A GG CG,LG,SS Face
Ireland GG CG,LG,SS A GG CG,LG,SS A GG CG,LG,SS Nominal
Israel GG CG,LG,SS Mixed GG CG,LG,SS Mixed GG CG,LG,SS Nominal
Italy GG CG,LG,SS A GG CG,LG,SS A GG CG,LG,SS Face
Japan GG CG,LG,SS A GG CG,LG,SS A GG CG,LG,SS Current market
Korea CG CG,SS C CG CG,SS C CG CG,SS Nominal
Latvia GG CG,LG,SS C GG CG,LG,SS C GG CG,LG,SS Nominal
Lithuania GG CG,LG,SS A GG CG,LG,SS A GG CG,LG,SS Nominal
Luxembourg GG CG,LG,SS A GG CG,LG,SS A GG CG,LG,SS Face
Malta GG CG,SS A GG CG,SS A GG CG,SS Nominal
The Netherlands GG CG,LG,SS A GG CG,LG,SS A GG CG,LG,SS Nominal
New Zealand GG CG,LG A GG CG,LG A GG CG,LG Current market
Norway GG CG,LG,SS A GG CG,LG,SS A GG CG,LG,SS Current market
Portugal GG CG,LG,SS A GG CG,LG,SS A GG CG,LG,SS Nominal
Singapore GG CG C GG CG C GG CG Nominal
Slovak Republic GG CG,LG,SS A GG CG,LG,SS A GG CG,LG,SS Face
Slovenia GG CG,LG,SS A GG CG,LG,SS A GG CG,LG,SS Face
Spain GG CG,SG,LG,SS A GG CG,SG,LG,SS A GG CG,SG,LG,SS Nominal
Sweden GG CG,LG,SS A GG CG,LG,SS A GG CG,LG,SS Nominal
Switzerland GG CG,SG,LG,SS A GG CG,SG,LG,SS A GG CG,SG,LG,SS Nominal
United Kingdom GG CG,LG A GG CG,LG A GG CG,LG Nominal
United States GG CG,SG,LG A GG CG,SG,LG A GG CG,SG,LG Nominal
Note: Coverage: CG = central government; GG = general government; LG = local governments; PS = public sector; SG = state governments; SS = social security funds; TG = territorial governments. Accounting standard: A = accrual; C = cash; Mixed = combination of accrual and cash accounting.1 In many economies, fiscal data follow the IMF’s Government Finance Statistics Manual 2014. The concept of overall fiscal balance refers to net lending (+) and borrowing (–) of the general government. In some cases, however, the overall balance refers to total revenue and grants minus total expenditure and net lending.2 “Nominal” refers to debt securities that are valued at their nominal values, that is, the nominal value of a debt instrument at any moment in time is the amount that the debtor owes to the creditor. “Face” refers to the undiscounted amount of principal to be repaid at (or before) maturity. The use of face value as a proxy for nominal value in measuring the gross debt position can result in an inconsistent approach across all instruments and is not recommended, unless nominal and market values are not available. “Current market” refers to debt securities that are valued at market prices; insurance, pension, and standardized guarantee schemes are valued according to principles that are equivalent to market valuation; and all other debt instruments are valued at nominal prices, which are considered to be the best generally available proxies for their market prices.
©International Monetary Fund. Not for Redistribution

65International M
onetary Fund | April 2021
METhODOLOGICAL AND STATISTICAL APPENDIX
Table C. Emerging Market and Middle-Income Economies: Definition and Coverage of Fiscal Monitor DataOverall Fiscal Balance1 Cyclically Adjusted Balance Gross Debt
Coverage Accounting Practice
Coverage Accounting Practice
Coverage Valuation of Debt2Aggregate Subsectors Aggregate Subsectors Aggregate Subsectors
Algeria CG CG C . . . . . . . . . CG CG FaceAngola GG CG,LG Mixed . . . . . . . . . GG CG,LG NominalArgentina GG CG,SG,SS C CG CG C CG CG NominalBelarus3 GG CG,LG,SS C . . . . . . . . . GG CG,LG,SS NominalBrazil4 NFPS CG,SG,LG,SS,NFPC C NFPS CG,SG,LG,SS,NFPC C NFPS CG,SG,LG,SS,NFPC NominalBulgaria GG CG,LG,SS C GG CG,LG,SS C GG CG,LG,SS NominalChile GG CG,LG A CG CG A GG CG,LG FaceChina GG CG,LG C GG CG,LG C GG CG,LG FaceColombia5 GG CG,SG,LG,SS Mixed GG CG,SG,LG,SS Mixed GG CG,SG,LG,SS FaceCroatia GG CG,LG A GG CG,LG A GG CG,LG NominalDominican Republic CG CG,LG,SS,NMPC Mixed PS CG,LG,SS,NMPC Mixed PS CG,LG,SS,NMPC FaceEcuador NFPS CG,SG,LG,SS,NFPC C NFPS CG,SG,LG,SS,NFPC C NFPS CG,SG,LG,SS,NFPC NominalEgypt GG CG,LG,SS C GG CG,LG,SS C GG CG,LG,SS NominalHungary GG CG,LG,SS,NMPC A GG CG,LG,SS,NMPC A GG CG,LG,SS,NMPC FaceIndia GG CG,SG C GG CG,SG C GG CG,SG NominalIndonesia GG CG,LG C GG CG,LG C GG CG,LG FaceIran CG CG C . . . . . . . . . CG CG NominalKazakhstan GG CG,LG C . . . . . . . . . GG CG,LG NominalKuwait GG CG,SS Mixed . . . . . . . . . GG CG,SS NominalLebanon CG CG Mixed CG CG Mixed CG CG NominalMalaysia GG CG,SG,LG C GG CG,SG,LG C GG CG,SG,LG NominalMexico PS CG,SS,NMPC,NFPC C PS CG,SS,NMPC,NFPC C PS CG,SS,NMPC,NFPC FaceMorocco CG CG A . . . . . . . . . CG CG FaceOman CG CG C . . . . . . . . . CG CG NominalPakistan GG CG,SG,LG C . . . . . . . . . GG CG,SG,LG NominalPeru GG CG,SG,LG,SS C GG CG,SG,LG,SS C NFPS CG,SG,LG,SS,NFPC FacePhilippines GG CG,LG,SS C GG CG,LG,SS C GG CG,LG,SS NominalPoland GG CG,LG,SS A GG CG,LG,SS A GG CG,LG,SS FaceQatar CG CG C . . . . . . . . . CG CG NominalRomania GG CG,LG,SS C GG CG,LG,SS C GG CG,LG,SS FaceRussia GG CG,SG,SS Mixed GG CG,SG,SS Mixed GG CG,SG,SS Current marketSaudi Arabia CG CG C . . . . . . . . . CG CG NominalSouth Africa6 GG CG,SG,SS C GG CG,SG,SS C GG CG,SG,SS NominalSri Lanka CG CG C . . . . . . . . . CG CG NominalThailand7 PS CG,BCG,LG,SS A PS CG,BCG,LG,SS A PS CG,BCG,LG,SS NominalTurkey GG CG,LG,SS A GG CG,LG,SS A GG CG,LG,SS NominalUkraine GG CG,LG,SS C GG CG,LG,SS C GG CG,LG,SS NominalUnited Arab Emirates8 GG CG,BCG,SG,SS Mixed . . . . . . . . . GG CG,BCG,SG,SS NominalUruguay NFPS CG,LG,SS,NMPC,NFPC A . . . . . . . . . NFPS CG,LG,SS,NMPC,NFPC FaceVenezuela9 GG BCG,NFPC C GG BCG,NFPC C GG BCG,NFPC Nominal
Note: Coverage: BCG = budgetary central government; CG = central government; GG = general government; LG = local governments; NFPC = nonfinancial public corporations; NFPS = nonfinancial public sector; NMPC = nonmonetary financial public corporations; PS = public sector; SG = state governments; SS = social security funds. Accounting standard: A = accrual; C = cash; Mixed = combination of accrual and cash accounting.1 In many countries, fiscal data follow the IMF’s Government Finance Statistics Manual 2014. The concept of overall fiscal balance refers to net lending (+) and borrowing (–) of the general government. In some cases, however, the overall balance refers to total revenue and grants minus total expenditure and net lending.2 “Nominal” refers to debt securities that are valued at their nominal values, that is, the nominal value of a debt instrument at any moment in time is the amount that the debtor owes to the creditor. “Face” refers to the undiscounted amount of principal to be repaid at (or before) maturity. The use of face value as a proxy for nominal value in measuring the gross debt position can result in an inconsistent approach across all instruments and is not recommended, unless nominal and market values are not available. “Current market” refers to debt securities that are valued at mar-ket prices; insurance, pension, and standardized guarantee schemes are valued according to principles that are equivalent to market valuation; and all other debt instruments are valued at nominal prices, which are considered to be the best generally available proxies of their market prices.3 Gross debt refers to general government public debt, including publicly guaranteed debt.4 Gross debt refers to the nonfinancial public sector, excluding Eletrobras and Petrobras, and includes sovereign debt held on the balance sheet of the central bank. The overall balance combines the cash primary balance of the nonfinancial public sector and the net interest of the public sector on an accrual basis5 Revenue is recorded on a cash basis and expenditure on an accrual basis.6 Coverage for South Africa is central government, but it serves a good proxy for the general government. It includes the national and provincial governments and certain public entities, while local governments are only partly covered. The subnational government debt is estimated to be limited given the available data from the South African Reserve Bank.7 Data for Thailand do not include the debt of specialized financial institutions (SFIs/NMPC) without a government guarantee.8 Gross debt covers banking system claims only.9 The fiscal accounts include the budgetary central government, social security, FOGADE (an insurance deposit institution), and a sample of public enterprises, including Petróleos de Venezuela, S.A. (PDVSA). Data for 2018–19 are IMF staff estimates.
©International Monetary Fund. Not for Redistribution

66 FISCAL MONITOR : A FAIR ShOT
International Monetary Fund | April 2021
Table D. Low-Income Developing Countries: Definition and Coverage of Fiscal Monitor DataOverall Fiscal Balance1 Cyclically Adjusted Balance Gross Debt
Coverage Accounting Practice
Coverage Accounting Practice
Coverage Valuation of Debt2Aggregate Subsectors Aggregate Subsectors Aggregate Subsectors
Afghanistan CG CG C . . . . . . . . . CG CG NominalBangladesh CG CG C CG CG C CG CG NominalBenin CG CG C . . . . . . . . . CG CG NominalBurkina Faso CG CG CB . . . . . . . . . CG CG FaceCambodia CG CG,LG A CG CG,LG A CG CG,LG FaceCameroon CG CG C . . . . . . . . . CG CG NominalChad NFPS CG,NFPC C . . . . . . . . . NFPS CG,NFPC FaceDemocratic Republic of
the CongoCG CG,LG A . . . . . . . . . CG CG,LG,NFPC Nominal
Republic of Congo CG CG A . . . . . . . . . CG CG NominalCôte d’Ivoire CG CG,SS A . . . . . . . . . CG CG,SS NominalEthiopia GG CG,SG,LG C . . . . . . . . . NFPS CG,SG,LG,NFPC NominalGhana CG CG C . . . . . . . . . CG CG FaceGuinea CG CG C . . . . . . . . . CG CG NominalHaiti3 CG CG C . . . . . . . . . CG CG NominalHonduras GG CG,LG,SS Mixed GG CG,LG,SS Mixed GG CG,LG,SS NominalKenya CG CG C . . . . . . . . . CG CG Current marketKyrgyz Republic GG CG,LG,SS C . . . . . . . . . GG CG,LG,SS FaceLao P.D.R.4 CG CG C CG CG C CG CG NominalMadagascar CG CG,LG C . . . . . . . . . CG CG,LG NominalMalawi CG CG C . . . . . . . . . CG CG …Mali CG CG Mixed . . . . . . . . . CG CG NominalMoldova GG CG,LG,SS C GG CG,LG,SS C GG CG,LG,SS NominalMozambique CG CG,SG Mixed CG CG,SG Mixed CG CG,SG NominalMyanmar5 NFPS CG,NFPC C . . . . . . . . . NFPS CG,NFPC FaceNepal CG CG C CG CG C CG CG FaceNicaragua GG CG,LG,SS C GG CG,LG,SS C GG CG,LG,SS NominalNiger CG CG A . . . . . . . . . CG CG NominalNigeria GG CG,SG,LG C . . . . . . . . . GG CG,SG,LG Current marketPapua New Guinea CG CG C . . . . . . . . . CG CG FaceRwanda GG CG,LG Mixed . . . . . . . . . GG CG,LG NominalSenegal CG CG C . . . . . . . . . PS CG NominalSudan CG CG Mixed . . . . . . . . . CG CG NominalTajikistan GG CG,LG,SS C . . . . . . . . . GG CG,LG,SS NominalTanzania CG CG,LG C . . . . . . . . . CG CG,LG NominalUganda CG CG C . . . . . . . . . CG CG NominalUzbekistan6 GG CG,SG,LG,SS C . . . . . . . . . GG CG,SG,LG,SS NominalVietnam GG CG,SG,LG C GG CG,SG,LG C GG CG,SG,LG NominalYemen GG CG,LG C . . . . . . . . . GG CG,LG NominalZambia CG CG C . . . . . . . . . CG CG NominalZimbabwe CG CG C . . . . . . . . . CG CG Current market
Note: Coverage: CG = central government; GG = general government; LG = local governments; NFPC = nonfinancial public corporations; NFPS = nonfinancial public sector; SG = state governments; SS = social security funds. Accounting standard: A = accrual; C = cash; CB = commitments-based; Mixed = combination of accrual and cash accounting.1 In many countries, fiscal data follow the IMF’s Government Finance Statistics Manual 2014. The concept of overall fiscal balance refers to net lending (+) and borrowing (–) of the general government. In some cases, however, the overall balance refers to total revenue and grants minus total expenditure and net lending.2 “Nominal” refers to debt securities that are valued at their nominal values, that is, the nominal value of a debt instrument at any moment in time is the amount that the debtor owes to the creditor. “Face” refers to the undiscounted amount of principal to be repaid at (or before) maturity. The use of face value as a proxy for nominal value in measuring the gross debt position can result in an inconsistent approach across all instruments and is not recommended, unless nominal and market values are not available. “Current market” refers to debt securities that are valued at market prices; insurance, pension, and standardized guarantee schemes are valued according to principles that are equivalent to market valuation; and all other debt instruments are valued at nominal prices, which are considered to be the best generally available proxies of their market prices.3 Haiti’s fiscal balance and debt data cover the central government, special funds and programs (Fonds d’Entretien Routier and Programme de Scolarisation Universelle, Gratuite, et Obligatoire), and the state-owned electricity company EDH.4 Lao P.D.R.’s fiscal spending includes capital spending by local governments financed by loans provided by the central bank.5 Overall and primary balances in 2012 are based on monetary statistics and are different from the balances calculated from expenditure and revenue data.6 Uzbekistan’s listing includes the Fund for Reconstruction and Development.
©International Monetary Fund. Not for Redistribution

67International Monetary Fund | April 2021
M E T H O D O L O G I C A L A N D S T A T I S T I C A L A P P E N D I X
Table A1. Advanced Economies: General Government Overall Balance, 2012–26(Percent of GDP)
2012 2013 2014 2015 2016 2017 2018 2019 2020 2021 2022 2023 2024 2025 2026
Average –5.5 –3.7 –3.1 –2.6 –2.7 –2.4 –2.5 –2.9 –11.7 –10.4 –4.6 –3.2 –3.0 –3.0 –2.8
Euro Area –3.7 –3.0 –2.5 –2.0 –1.5 –0.9 –0.5 –0.6 –7.6 –6.7 –3.3 –2.3 –1.8 –1.6 –1.6
G7 –6.5 –4.3 –3.6 –3.0 –3.3 –3.3 –3.4 –3.7 –13.2 –11.9 –5.0 –3.5 –3.4 –3.5 –3.3
G20 Advanced –6.1 –4.1 –3.5 –2.9 –3.1 –3.0 –3.1 –3.6 –12.7 –11.5 –5.0 –3.5 –3.3 –3.4 –3.2
Australia –3.5 –2.8 –2.9 –2.8 –2.4 –1.7 –1.2 –3.8 –9.9 –10.4 –6.8 –4.9 –3.8 –3.1 –2.7
Austria –2.2 –2.0 –2.7 –1.0 –1.6 –0.7 0.2 0.7 –9.6 –6.5 –3.6 –2.2 –1.4 –1.0 –0.9
Belgium –4.3 –3.1 –3.1 –2.4 –2.4 –0.7 –0.8 –1.9 –10.2 –7.3 –5.0 –4.9 –5.0 –4.9 –4.9
Canada –2.5 –1.5 0.2 –0.1 –0.5 –0.1 0.3 0.5 –10.7 –7.8 –3.9 –1.3 –0.2 0.1 0.2
Cyprus1 –5.6 –5.2 –0.2 0.2 0.2 2.0 –3.5 1.5 –5.0 –3.2 –0.8 –0.4 0.0 0.6 0.8
Czech Republic –3.9 –1.2 –2.1 –0.6 0.7 1.5 0.9 0.3 –5.9 –7.8 –6.3 –5.6 –5.1 –4.5 –4.0
Denmark –3.5 –1.2 1.1 –1.3 –0.1 1.8 0.7 3.8 –3.5 –1.8 –1.8 –1.2 –0.8 0.0 0.0
Estonia –0.3 –0.2 0.7 0.1 –0.3 –0.4 –0.5 0.0 –5.4 –7.1 –6.3 –5.2 –4.4 –3.6 –3.0
Finland –2.2 –2.5 –3.0 –2.4 –1.7 –0.7 –0.9 –1.0 –4.8 –4.3 –3.0 –2.2 –2.0 –1.8 –1.6
France –5.0 –4.1 –3.9 –3.6 –3.6 –2.9 –2.3 –3.0 –9.9 –7.2 –4.4 –3.8 –3.6 –3.5 –3.5
Germany 0.0 0.0 0.6 1.0 1.2 1.4 1.8 1.5 –4.2 –5.5 –0.4 0.4 0.5 0.6 0.6
Greece –6.7 –3.6 –4.1 –2.8 0.6 1.1 0.9 0.6 –9.9 –8.9 –2.6 –2.0 –1.8 –1.7 –1.5
Hong Kong SAR 3.1 1.0 3.6 0.6 4.4 5.5 2.3 –0.6 –10.0 –4.7 –0.1 –0.1 –0.1 –0.1 –0.1
Iceland –2.6 –1.2 0.3 –0.4 12.5 1.0 0.9 –1.5 –7.3 –10.2 –8.9 –6.9 –4.1 –3.1 –3.2
Ireland1 –8.1 –6.2 –3.6 –2.0 –0.7 –0.3 0.1 0.5 –5.3 –5.5 –2.8 –1.4 –1.0 –0.4 –0.3
Israel –4.4 –4.1 –2.4 –1.1 –1.4 –1.1 –3.6 –3.9 –11.8 –8.9 –4.4 –4.1 –3.9 –3.8 –3.7
Italy –2.9 –2.9 –3.0 –2.6 –2.4 –2.4 –2.2 –1.6 –9.5 –8.8 –5.5 –3.8 –2.2 –2.0 –1.8
Japan –8.5 –7.9 –5.9 –3.9 –3.8 –3.3 –2.7 –3.1 –12.6 –9.4 –3.8 –2.5 –2.3 –2.3 –2.4
Korea 1.5 0.6 0.4 0.5 1.6 2.2 2.6 0.4 –2.8 –2.9 –2.4 –2.5 –2.4 –2.3 –2.0
Latvia 0.2 –0.6 –1.7 –1.5 –0.4 –0.8 –0.7 –0.4 –3.9 –6.7 –1.8 –0.9 –0.5 –0.6 –0.5
Lithuania –3.1 –2.6 –0.7 –0.2 0.3 0.5 0.6 0.3 –8.0 –6.1 –1.8 –0.8 –0.4 0.0 0.4
Luxembourg 0.5 0.9 1.4 1.3 1.9 1.3 3.1 2.4 –3.8 –1.5 –0.5 –0.1 0.0 0.0 0.0
Malta –3.4 –2.3 –1.7 –1.0 0.9 3.2 2.0 0.5 –9.0 –5.7 –3.1 –2.5 –2.0 –1.5 –0.9
The Netherlands –3.9 –2.9 –2.2 –2.0 0.0 1.3 1.4 2.5 –5.6 –4.3 –2.5 –1.6 –0.9 –0.3 –0.1
New Zealand –2.2 –1.3 –0.4 0.3 1.0 1.3 1.1 –2.3 –5.7 –5.1 –3.9 –2.7 –1.7 –0.7 –0.2
Norway 13.8 10.7 8.6 6.0 4.1 5.0 6.9 5.6 –7.0 –0.2 1.4 2.9 3.9 4.5 4.3
Portugal –6.2 –5.1 –7.3 –4.4 –1.9 –3.0 –0.3 0.1 –6.1 –5.0 –1.9 –1.4 0.5 0.3 0.3
Singapore 7.3 6.0 4.6 2.9 3.7 5.3 3.7 3.8 –8.9 –0.2 3.1 3.1 3.1 2.5 2.6
Slovak Republic –4.4 –2.9 –3.1 –2.7 –2.6 –0.9 –1.0 –1.4 –7.3 –7.1 –4.9 –4.4 –3.9 –3.6 –3.3
Slovenia –4.0 –14.6 –5.5 –2.8 –1.9 –0.1 0.7 0.5 –8.5 –6.2 –4.2 –3.4 –2.8 –2.2 –2.0
Spain1 –10.7 –7.0 –5.9 –5.2 –4.3 –3.0 –2.5 –2.9 –11.5 –9.0 –5.8 –4.9 –4.3 –4.3 –4.3
Sweden –1.0 –1.4 –1.5 0.0 1.0 1.4 0.8 0.5 –4.0 –3.9 –1.8 –0.2 0.1 0.3 0.3
Switzerland 0.2 –0.4 –0.2 0.5 0.2 1.1 1.3 1.4 –2.6 –3.4 –0.7 –0.1 –0.1 0.0 0.0
United Kingdom –7.6 –5.5 –5.5 –4.5 –3.3 –2.4 –2.2 –2.3 –13.4 –11.8 –6.2 –4.0 –3.4 –3.3 –3.3
United States2 –8.0 –4.6 –4.1 –3.5 –4.3 –4.6 –5.4 –5.7 –15.8 –15.0 –6.1 –4.6 –4.7 –5.0 –4.7
Source: IMF staff estimates and projections. Projections are based on staff assessments of current policies (see “Fiscal Policy Assumptions” in text).Note: For country-specific details, see “Data and Conventions” in text, and Table B.1 Data include financial sector support. For Cyprus, 2014 and 2015 balances exclude financial sector support.2 For cross-economy comparison, the expenditures and fiscal balances of the United States are adjusted to exclude the imputed interest on unfunded pension liabilities and the imputed compensation of employees, which are counted as expenditures under the 2008 System of National Accounts (2008 SNA) adopted by the United States, but not in economies that have not yet adopted the 2008 SNA. Data for the United States in this table may thus differ from data published by the US Bureau of Economic Analysis.
©International Monetary Fund. Not for Redistribution
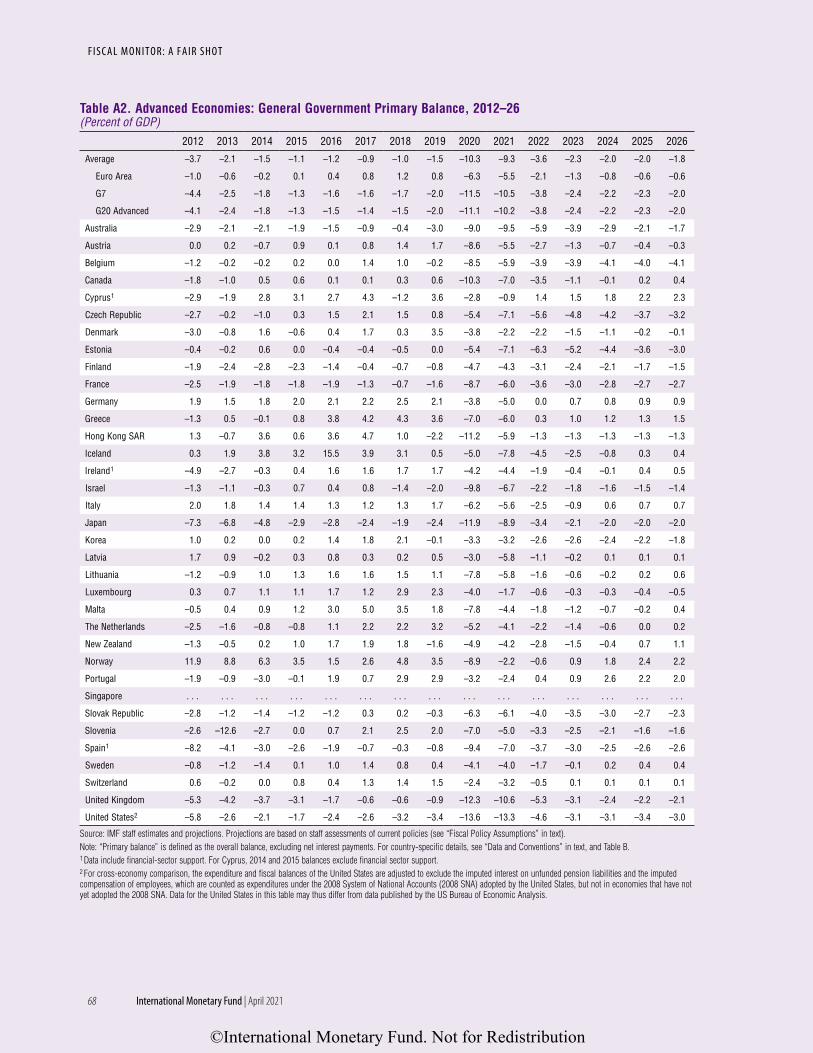
68
F I S C A L M O N I T O R : A F A I R S H O T
International Monetary Fund | April 2021
Table A2. Advanced Economies: General Government Primary Balance, 2012–26(Percent of GDP)
2012 2013 2014 2015 2016 2017 2018 2019 2020 2021 2022 2023 2024 2025 2026
Average –3.7 –2.1 –1.5 –1.1 –1.2 –0.9 –1.0 –1.5 –10.3 –9.3 –3.6 –2.3 –2.0 –2.0 –1.8
Euro Area –1.0 –0.6 –0.2 0.1 0.4 0.8 1.2 0.8 –6.3 –5.5 –2.1 –1.3 –0.8 –0.6 –0.6
G7 –4.4 –2.5 –1.8 –1.3 –1.6 –1.6 –1.7 –2.0 –11.5 –10.5 –3.8 –2.4 –2.2 –2.3 –2.0
G20 Advanced –4.1 –2.4 –1.8 –1.3 –1.5 –1.4 –1.5 –2.0 –11.1 –10.2 –3.8 –2.4 –2.2 –2.3 –2.0
Australia –2.9 –2.1 –2.1 –1.9 –1.5 –0.9 –0.4 –3.0 –9.0 –9.5 –5.9 –3.9 –2.9 –2.1 –1.7
Austria 0.0 0.2 –0.7 0.9 0.1 0.8 1.4 1.7 –8.6 –5.5 –2.7 –1.3 –0.7 –0.4 –0.3
Belgium –1.2 –0.2 –0.2 0.2 0.0 1.4 1.0 –0.2 –8.5 –5.9 –3.9 –3.9 –4.1 –4.0 –4.1
Canada –1.8 –1.0 0.5 0.6 0.1 0.1 0.3 0.6 –10.3 –7.0 –3.5 –1.1 –0.1 0.2 0.4
Cyprus1 –2.9 –1.9 2.8 3.1 2.7 4.3 –1.2 3.6 –2.8 –0.9 1.4 1.5 1.8 2.2 2.3
Czech Republic –2.7 –0.2 –1.0 0.3 1.5 2.1 1.5 0.8 –5.4 –7.1 –5.6 –4.8 –4.2 –3.7 –3.2
Denmark –3.0 –0.8 1.6 –0.6 0.4 1.7 0.3 3.5 –3.8 –2.2 –2.2 –1.5 –1.1 –0.2 –0.1
Estonia –0.4 –0.2 0.6 0.0 –0.4 –0.4 –0.5 0.0 –5.4 –7.1 –6.3 –5.2 –4.4 –3.6 –3.0
Finland –1.9 –2.4 –2.8 –2.3 –1.4 –0.4 –0.7 –0.8 –4.7 –4.3 –3.1 –2.4 –2.1 –1.7 –1.5
France –2.5 –1.9 –1.8 –1.8 –1.9 –1.3 –0.7 –1.6 –8.7 –6.0 –3.6 –3.0 –2.8 –2.7 –2.7
Germany 1.9 1.5 1.8 2.0 2.1 2.2 2.5 2.1 –3.8 –5.0 0.0 0.7 0.8 0.9 0.9
Greece –1.3 0.5 –0.1 0.8 3.8 4.2 4.3 3.6 –7.0 –6.0 0.3 1.0 1.2 1.3 1.5
Hong Kong SAR 1.3 –0.7 3.6 0.6 3.6 4.7 1.0 –2.2 –11.2 –5.9 –1.3 –1.3 –1.3 –1.3 –1.3
Iceland 0.3 1.9 3.8 3.2 15.5 3.9 3.1 0.5 –5.0 –7.8 –4.5 –2.5 –0.8 0.3 0.4
Ireland1 –4.9 –2.7 –0.3 0.4 1.6 1.6 1.7 1.7 –4.2 –4.4 –1.9 –0.4 –0.1 0.4 0.5
Israel –1.3 –1.1 –0.3 0.7 0.4 0.8 –1.4 –2.0 –9.8 –6.7 –2.2 –1.8 –1.6 –1.5 –1.4
Italy 2.0 1.8 1.4 1.4 1.3 1.2 1.3 1.7 –6.2 –5.6 –2.5 –0.9 0.6 0.7 0.7
Japan –7.3 –6.8 –4.8 –2.9 –2.8 –2.4 –1.9 –2.4 –11.9 –8.9 –3.4 –2.1 –2.0 –2.0 –2.0
Korea 1.0 0.2 0.0 0.2 1.4 1.8 2.1 –0.1 –3.3 –3.2 –2.6 –2.6 –2.4 –2.2 –1.8
Latvia 1.7 0.9 –0.2 0.3 0.8 0.3 0.2 0.5 –3.0 –5.8 –1.1 –0.2 0.1 0.1 0.1
Lithuania –1.2 –0.9 1.0 1.3 1.6 1.6 1.5 1.1 –7.8 –5.8 –1.6 –0.6 –0.2 0.2 0.6
Luxembourg 0.3 0.7 1.1 1.1 1.7 1.2 2.9 2.3 –4.0 –1.7 –0.6 –0.3 –0.3 –0.4 –0.5
Malta –0.5 0.4 0.9 1.2 3.0 5.0 3.5 1.8 –7.8 –4.4 –1.8 –1.2 –0.7 –0.2 0.4
The Netherlands –2.5 –1.6 –0.8 –0.8 1.1 2.2 2.2 3.2 –5.2 –4.1 –2.2 –1.4 –0.6 0.0 0.2
New Zealand –1.3 –0.5 0.2 1.0 1.7 1.9 1.8 –1.6 –4.9 –4.2 –2.8 –1.5 –0.4 0.7 1.1
Norway 11.9 8.8 6.3 3.5 1.5 2.6 4.8 3.5 –8.9 –2.2 –0.6 0.9 1.8 2.4 2.2
Portugal –1.9 –0.9 –3.0 –0.1 1.9 0.7 2.9 2.9 –3.2 –2.4 0.4 0.9 2.6 2.2 2.0
Singapore . . . . . . . . . . . . . . . . . . . . . . . . . . . . . . . . . . . . . . . . . . . . .
Slovak Republic –2.8 –1.2 –1.4 –1.2 –1.2 0.3 0.2 –0.3 –6.3 –6.1 –4.0 –3.5 –3.0 –2.7 –2.3
Slovenia –2.6 –12.6 –2.7 0.0 0.7 2.1 2.5 2.0 –7.0 –5.0 –3.3 –2.5 –2.1 –1.6 –1.6
Spain1 –8.2 –4.1 –3.0 –2.6 –1.9 –0.7 –0.3 –0.8 –9.4 –7.0 –3.7 –3.0 –2.5 –2.6 –2.6
Sweden –0.8 –1.2 –1.4 0.1 1.0 1.4 0.8 0.4 –4.1 –4.0 –1.7 –0.1 0.2 0.4 0.4
Switzerland 0.6 –0.2 0.0 0.8 0.4 1.3 1.4 1.5 –2.4 –3.2 –0.5 0.1 0.1 0.1 0.1
United Kingdom –5.3 –4.2 –3.7 –3.1 –1.7 –0.6 –0.6 –0.9 –12.3 –10.6 –5.3 –3.1 –2.4 –2.2 –2.1
United States2 –5.8 –2.6 –2.1 –1.7 –2.4 –2.6 –3.2 –3.4 –13.6 –13.3 –4.6 –3.1 –3.1 –3.4 –3.0
Source: IMF staff estimates and projections. Projections are based on staff assessments of current policies (see “Fiscal Policy Assumptions” in text).Note: “Primary balance” is defined as the overall balance, excluding net interest payments. For country-specific details, see “Data and Conventions” in text, and Table B.1 Data include financial-sector support. For Cyprus, 2014 and 2015 balances exclude financial sector support.2 For cross-economy comparison, the expenditure and fiscal balances of the United States are adjusted to exclude the imputed interest on unfunded pension liabilities and the imputed compensation of employees, which are counted as expenditures under the 2008 System of National Accounts (2008 SNA) adopted by the United States, but not in economies that have not yet adopted the 2008 SNA. Data for the United States in this table may thus differ from data published by the US Bureau of Economic Analysis.
©International Monetary Fund. Not for Redistribution

69International Monetary Fund | April 2021
M E T H O D O L O G I C A L A N D S T A T I S T I C A L A P P E N D I X
Table A3. Advanced Economies: General Government Cyclically Adjusted Balance, 2012–26(Percent of potential GDP)
2012 2013 2014 2015 2016 2017 2018 2019 2020 2021 2022 2023 2024 2025 2026
Average –4.0 –2.8 –2.3 –2.1 –2.4 –2.4 –2.7 –3.3 –9.0 –8.8 –4.7 –3.5 –3.3 –3.3 –3.2
Euro Area –2.4 –1.1 –0.9 –0.7 –0.6 –0.7 –0.5 –0.7 –5.1 –4.8 –2.6 –2.1 –1.7 –1.5 –1.5
G7 –4.6 –3.2 –2.6 –2.4 –2.9 –3.1 –3.4 –3.9 –10.0 –9.9 –5.1 –3.7 –3.5 –3.7 –3.5
G20 Advanced –4.3 –3.0 –2.5 –2.3 –2.7 –2.8 –3.1 –3.7 –9.7 –9.6 –5.0 –3.7 –3.5 –3.6 –3.4
Australia –3.5 –2.7 –2.7 –2.6 –2.3 –1.6 –1.2 –3.6 –9.1 –10.1 –6.9 –5.0 –3.9 –3.1 –2.7
Austria –2.5 –1.6 –2.0 –0.4 –1.1 –0.7 –0.4 –0.7 –8.3 –4.8 –2.7 –1.7 –1.2 –0.9 –0.9
Belgium –3.8 –2.2 –2.2 –1.8 –1.7 –0.2 –0.6 –2.0 –8.2 –6.0 –4.5 –4.8 –5.0 –4.9 –4.9
Canada –2.4 –1.5 –0.2 0.0 –0.1 –0.3 0.0 0.4 –9.0 –7.0 –4.2 –1.5 –0.3 0.1 0.2
Cyprus –4.3 –2.0 2.2 2.1 1.0 1.5 2.1 –0.1 –3.3 –2.1 –0.5 –0.2 0.0 0.5 0.6
Czech Republic –2.9 0.4 –0.7 –0.4 0.7 0.8 0.2 –0.6 –5.4 –7.3 –6.0 –5.5 –5.0 –4.5 –4.0
Denmark –2.0 0.5 2.6 –0.5 –0.4 0.7 –0.7 1.6 –2.0 –1.1 –1.8 –1.2 –0.8 0.0 0.0
Estonia 0.1 0.4 1.1 0.6 0.0 –0.8 –1.3 –1.0 –4.8 –6.7 –6.1 –5.1 –4.3 –3.6 –3.0
Finland –1.6 –0.9 –0.7 0.5 0.3 0.1 –0.1 –0.3 –1.9 –2.8 –2.4 –2.2 –2.0 –1.7 –1.6
France –4.2 –2.9 –2.6 –2.3 –2.2 –2.2 –2.0 –3.0 –6.8 –5.3 –4.1 –3.7 –3.5 –3.4 –3.5
Germany –0.1 0.5 0.8 1.1 1.1 0.8 1.2 1.3 –2.8 –4.4 –0.3 0.4 0.5 0.6 0.6
Greece 2.4 5.0 3.0 3.2 5.9 5.0 4.2 3.6 –4.8 –5.6 –0.2 –1.9 –1.9 –1.9 –1.7
Hong Kong SAR1 –0.8 –3.8 –0.8 –3.0 –0.9 –1.9 –3.2 –3.3 –10.6 –8.0 –4.3 –4.5 –4.6 –4.5 –4.5
Iceland –1.4 –1.3 1.1 0.2 12.0 0.3 –0.7 –2.8 –4.6 –8.9 –8.4 –6.6 –3.9 –3.0 –3.2
Ireland1 –5.4 –4.6 –3.1 –1.3 –1.3 –1.0 –0.4 0.0 –4.5 –4.7 –2.5 –1.3 –0.9 –0.4 –0.3
Israel –4.3 –4.2 –2.6 –0.8 –1.3 –1.1 –3.6 –4.1 –10.1 –7.9 –3.9 –3.8 –3.7 –3.7 –3.7
Italy –1.5 –0.7 –0.8 –0.8 –1.1 –1.7 –1.8 –1.1 –6.1 –5.2 –4.0 –3.1 –1.7 –1.6 –1.5
Japan –7.5 –7.4 –5.6 –4.4 –4.3 –3.5 –2.7 –2.6 –11.3 –8.5 –3.6 –2.5 –2.3 –2.3 –2.4
Korea 1.6 0.7 0.5 0.7 1.8 2.3 2.6 0.6 –2.1 –2.4 –2.2 –2.4 –2.4 –2.2 –2.0
Latvia 0.0 –1.4 –1.4 –1.6 –0.8 –1.7 –2.0 –1.4 –2.7 –5.9 –1.6 –0.7 –0.5 –0.6 –0.5
Lithuania –2.2 –2.1 –0.6 0.2 0.8 0.5 0.4 –0.3 –7.8 –5.9 –1.7 –0.7 –0.3 0.0 0.4
Luxembourg 1.4 1.4 1.5 1.1 1.2 0.7 2.5 2.2 –2.9 –1.2 –0.4 0.0 0.1 0.1 0.0
Malta –2.3 –1.1 –1.3 –2.1 0.6 3.0 1.4 0.2 –6.5 –3.5 –1.7 –1.4 –1.2 –1.1 –1.0
The Netherlands –2.7 –1.1 –0.5 –0.8 0.8 1.3 0.8 1.8 –4.5 –3.4 –2.0 –1.3 –0.7 –0.1 –0.1
New Zealand –1.1 –0.2 0.3 0.6 1.0 1.0 0.8 –1.7 –4.4 –4.4 –3.5 –2.6 –1.7 –0.7 –0.2
Norway1 –4.8 –5.2 –6.1 –7.2 –8.3 –8.4 –7.5 –8.1 –14.2 –12.5 –12.1 –11.7 –11.3 –11.0 –10.6
Portugal –2.4 –0.9 –3.5 –1.7 –0.2 –2.4 –0.5 –0.5 –4.2 –3.8 –1.5 –1.1 0.6 0.3 0.2
Singapore 2.4 1.5 1.0 –0.7 1.2 1.8 0.6 1.7 –9.8 –2.5 0.8 0.8 0.7 0.2 0.3
Slovak Republic –3.3 –1.7 –2.5 –3.2 –3.1 –1.6 –1.7 –1.8 –4.8 –5.7 –4.2 –4.1 –3.7 –3.5 –3.3
Slovenia –3.0 –12.8 –4.4 –1.9 –1.8 0.0 0.6 0.3 –5.9 –4.9 –3.8 –3.2 –2.7 –2.2 –2.0
Spain1 –2.8 –1.8 –1.3 –2.2 –2.6 –2.5 –2.3 –3.1 –5.8 –6.0 –4.7 –4.6 –4.6 –4.5 –4.5
Sweden1 –0.8 –0.9 –1.0 –0.8 0.6 0.7 0.0 –0.4 –3.5 –3.6 –1.5 0.0 0.2 0.3 0.3
Switzerland1 0.3 –0.3 –0.2 0.5 0.2 1.1 0.9 1.2 –1.7 –2.7 –0.3 0.1 0.0 0.0 0.0
United Kingdom1 –6.0 –4.2 –4.9 –4.4 –3.3 –2.5 –2.3 –2.3 –10.8 –9.0 –4.8 –3.3 –3.1 –3.2 –3.2
United States1,2 –4.9 –3.0 –2.6 –2.6 –3.7 –4.3 –5.4 –6.1 –11.7 –12.9 –6.8 –5.1 –5.1 –5.4 –5.1
Source: IMF staff estimates and projections. Projections are based on staff assessments of current policies (see “Fiscal Policy Assumptions” in text).Note: For country-specific details, see “Data and Conventions” in text, and Table B.1 Data for these economies include adjustments beyond the output cycle.2 For cross-economy comparison, the expenditure and fiscal balances of the United States are adjusted to exclude the imputed interest on unfunded pension liabilities and the imputed compensation of employees, which are counted as expenditures under the 2008 System of National Accounts (2008 SNA) adopted by the United States, but not in economies that have not yet adopted the 2008 SNA. Data for the United States in this table may thus differ from data published by the US Bureau of Economic Analysis.
©International Monetary Fund. Not for Redistribution

70
F I S C A L M O N I T O R : A F A I R S H O T
International Monetary Fund | April 2021
Table A4. Advanced Economies: General Government Cyclically Adjusted Primary Balance, 2012–26(Percent of potential GDP)
2012 2013 2014 2015 2016 2017 2018 2019 2020 2021 2022 2023 2024 2025 2026
Average –2.2 –1.2 –0.7 –0.6 –0.9 –1.0 –1.2 –1.8 –7.6 –7.7 –3.7 –2.5 –2.3 –2.3 –2.1
Euro Area 0.2 1.2 1.3 1.3 1.2 1.1 1.1 0.8 –3.8 –3.6 –1.5 –1.0 –0.7 –0.6 –0.5
G7 –2.6 –1.4 –0.9 –0.7 –1.2 –1.4 –1.7 –2.2 –8.4 –8.6 –3.9 –2.5 –2.4 –2.5 –2.2
G20 Advanced –2.4 –1.4 –0.9 –0.7 –1.1 –1.2 –1.5 –2.1 –8.1 –8.3 –3.9 –2.6 –2.4 –2.4 –2.2
Australia –2.8 –2.0 –1.9 –1.7 –1.4 –0.7 –0.3 –2.7 –8.2 –9.1 –5.9 –4.0 –3.0 –2.2 –1.7
Austria –0.3 0.5 –0.1 1.5 0.5 0.7 0.8 0.3 –7.3 –3.8 –1.7 –0.8 –0.4 –0.3 –0.3
Belgium –0.7 0.7 0.6 0.7 0.6 1.8 1.2 –0.3 –6.6 –4.7 –3.5 –3.8 –4.1 –4.0 –4.1
Canada –1.7 –1.0 0.1 0.6 0.5 –0.1 0.1 0.4 –8.6 –6.3 –3.8 –1.3 –0.2 0.2 0.4
Cyprus –2.3 0.3 4.3 4.2 2.8 3.3 3.8 1.6 –1.6 –0.3 1.2 1.2 1.4 1.7 1.7
Czech Republic –1.7 1.4 0.4 0.5 1.5 1.5 0.8 0.0 –4.8 –6.7 –5.3 –4.7 –4.2 –3.7 –3.2
Denmark –1.4 0.8 3.0 0.2 0.1 0.6 –1.1 1.3 –2.3 –1.5 –2.1 –1.5 –1.1 –0.2 –0.1
Estonia 0.0 0.3 1.0 0.5 –0.1 –0.9 –1.3 –1.0 –4.8 –6.6 –6.1 –5.1 –4.3 –3.6 –3.0
Finland –1.4 –0.8 –0.5 0.6 0.6 0.3 0.1 –0.1 –1.8 –2.8 –2.6 –2.4 –2.1 –1.7 –1.4
France –1.8 –0.8 –0.6 –0.5 –0.5 –0.5 –0.4 –1.6 –5.7 –4.2 –3.3 –2.9 –2.7 –2.7 –2.7
Germany 1.7 1.9 2.0 2.2 2.0 1.7 1.9 1.9 –2.4 –4.0 0.1 0.7 0.8 0.9 0.9
Greece 6.8 8.5 6.5 6.4 8.7 7.9 7.4 6.5 –2.2 –2.8 2.7 1.1 1.1 1.1 1.3
Hong Kong SAR1 –2.6 –5.5 –0.8 –3.0 –1.7 –2.7 –4.6 –4.9 –11.7 –9.2 –5.5 –5.7 –5.8 –5.7 –5.7
Iceland 1.5 1.9 4.6 3.8 15.0 3.3 1.6 –0.7 –2.4 –6.5 –4.1 –2.2 –0.7 0.4 0.4
Ireland1 –2.3 –1.2 0.2 1.1 0.9 1.0 1.2 1.3 –3.5 –3.7 –1.6 –0.3 0.0 0.4 0.5
Israel –1.2 –1.2 –0.5 0.9 0.5 0.8 –1.4 –2.2 –8.2 –5.7 –1.6 –1.5 –1.4 –1.4 –1.4
Italy 3.4 3.7 3.4 3.0 2.5 1.8 1.7 2.1 –3.0 –2.2 –1.0 –0.3 1.1 1.1 1.0
Japan –6.3 –6.3 –4.6 –3.4 –3.3 –2.6 –1.9 –1.9 –10.6 –8.0 –3.2 –2.1 –2.0 –2.0 –2.0
Korea 1.1 0.3 0.1 0.4 1.5 1.9 2.2 0.1 –2.6 –2.8 –2.4 –2.5 –2.4 –2.2 –1.8
Latvia 1.5 0.0 0.1 0.2 0.4 –0.5 –1.0 –0.6 –1.8 –5.0 –0.8 0.0 0.2 0.1 0.1
Lithuania –0.3 –0.4 1.1 1.7 2.1 1.7 1.4 0.5 –7.5 –5.6 –1.5 –0.5 –0.2 0.2 0.6
Luxembourg 1.2 1.3 1.3 0.9 1.1 0.5 2.3 2.1 –3.1 –1.3 –0.5 –0.3 –0.2 –0.3 –0.4
Malta 0.5 1.6 1.3 0.2 2.7 4.8 2.9 1.6 –5.3 –2.3 –0.5 –0.1 0.1 0.2 0.3
The Netherlands –1.4 0.2 0.8 0.4 1.9 2.3 1.7 2.5 –4.1 –3.2 –1.7 –1.0 –0.4 0.1 0.2
New Zealand –0.2 0.5 0.9 1.3 1.7 1.7 1.4 –1.1 –3.7 –3.5 –2.5 –1.4 –0.3 0.6 1.1
Norway1 –7.1 –7.5 –8.9 –10.3 –11.3 –11.3 –10.1 –10.6 –16.5 –15.0 –14.6 –14.3 –13.9 –13.6 –13.2
Portugal 1.6 2.9 0.6 2.4 3.6 1.2 2.7 2.4 –1.4 –1.2 0.8 1.2 2.7 2.2 2.0
Singapore . . . . . . . . . . . . . . . . . . . . . . . . . . . . . . . . . . . . . . . . . . . . .
Slovak Republic –1.8 0.0 –0.8 –1.7 –1.7 –0.3 –0.5 –0.7 –3.8 –4.8 –3.3 –3.2 –2.8 –2.6 –2.3
Slovenia –1.6 –10.9 –1.6 0.8 0.8 2.1 2.4 1.8 –4.5 –3.7 –2.8 –2.4 –2.0 –1.6 –1.6
Spain1 –0.5 0.9 1.4 0.2 –0.2 –0.2 –0.1 –1.1 –3.9 –4.0 –2.7 –2.7 –2.8 –2.8 –2.7
Sweden1 –0.6 –0.7 –0.8 –0.7 0.6 0.7 0.0 –0.5 –3.7 –3.7 –1.4 0.1 0.3 0.4 0.4
Switzerland1 0.7 –0.1 0.0 0.7 0.4 1.2 1.1 1.3 –1.6 –2.5 –0.1 0.2 0.2 0.2 0.1
United Kingdom1 –3.8 –2.9 –3.1 –3.0 –1.7 –0.7 –0.6 –1.0 –9.7 –7.9 –3.8 –2.4 –2.1 –2.1 –2.1
United States1,2 –2.8 –1.2 –0.7 –0.8 –1.7 –2.3 –3.1 –3.9 –9.6 –11.1 –5.2 –3.6 –3.5 –3.8 –3.3
Source: IMF staff estimates and projections. Projections are based on staff assessments of current policies (see “Fiscal Policy Assumptions” in text).Note: “Cyclically adjusted primary balance” is defined as the cyclically adjusted balance plus net interest payable/paid (interest expense minus interest revenue) following the World Economic Outlook convention. For economy-specific details, see “Data and Conventions” in text, and Table B.1 The data for these economies include adjustments beyond the output cycle.2 For cross-economy comparison, expenditure and fiscal balances of the United States are adjusted to exclude the imputed interest on unfunded pension liabilities and the imputed compensation of employees, which are counted as expenditures under the 2008 System of National Accounts (2008 SNA) adopted by the United States, but not in economies that have not yet adopted the 2008 SNA. Data for the United States in this table may thus differ from data published by the US Bureau of Economic Analysis.
©International Monetary Fund. Not for Redistribution

71International Monetary Fund | April 2021
M E T H O D O L O G I C A L A N D S T A T I S T I C A L A P P E N D I X
Table A5. Advanced Economies: General Government Revenue, 2012–26(Percent of GDP)
2012 2013 2014 2015 2016 2017 2018 2019 2020 2021 2022 2023 2024 2025 2026
Average 35.3 36.5 36.5 36.1 36.0 35.9 35.9 35.6 35.7 35.5 36.1 36.2 36.2 36.2 36.3
Euro Area 46.2 46.8 46.8 46.4 46.2 46.2 46.4 46.4 46.4 46.4 46.5 46.4 46.2 46.0 45.8
G7 34.8 36.3 36.5 36.3 36.0 35.9 35.7 35.5 35.7 35.4 36.2 36.4 36.3 36.3 36.6
G20 Advanced 34.3 35.6 35.8 35.6 35.4 35.3 35.2 35.0 35.2 34.9 35.6 35.7 35.7 35.7 35.9
Australia 33.1 33.7 33.9 34.5 34.9 35.1 35.6 34.5 35.0 33.2 32.6 33.0 33.5 33.7 33.8
Austria 49.0 49.7 49.6 50.0 48.5 48.5 48.9 49.1 48.3 48.3 48.6 48.8 48.5 48.5 48.5
Belgium 52.2 53.0 52.5 51.3 50.8 51.3 51.4 50.1 50.6 50.7 50.4 50.4 50.5 50.5 50.5
Canada 38.4 38.5 38.5 40.0 40.3 40.3 41.1 41.5 41.8 40.1 40.4 41.3 41.8 42.0 42.0
Cyprus 36.4 37.0 40.2 39.7 37.7 38.7 39.5 41.5 42.3 43.8 44.7 45.1 45.2 45.2 44.7
Czech Republic 40.3 40.9 40.0 40.8 40.5 40.5 41.5 41.4 41.9 39.5 39.9 40.0 40.2 39.9 39.9
Denmark 54.5 54.6 56.4 53.2 52.4 52.3 51.2 53.0 51.6 50.4 49.5 49.5 49.5 50.1 50.1
Estonia 38.8 38.1 38.3 39.5 38.7 38.5 38.7 39.0 39.3 39.2 39.4 40.2 40.1 39.8 39.6
Finland 53.3 54.3 54.3 54.1 53.9 53.0 52.5 52.4 51.9 52.3 52.2 52.1 52.0 51.9 51.9
France 52.1 53.1 53.3 53.2 53.0 53.5 53.4 52.5 52.5 52.5 52.1 51.5 51.5 51.3 51.3
Germany 44.9 45.0 44.9 45.1 45.5 45.6 46.3 46.7 46.9 46.1 46.8 46.9 46.8 46.8 46.8
Greece 47.0 48.3 46.6 48.2 50.3 49.4 49.3 48.0 48.3 50.3 50.2 50.0 49.1 48.3 47.2
Hong Kong SAR 21.4 21.0 20.8 18.6 22.6 22.9 20.7 20.2 19.7 20.3 21.9 21.8 21.8 21.8 21.8
Iceland 45.2 44.8 46.2 43.2 59.1 45.4 44.9 41.9 42.4 39.2 39.7 39.9 39.7 39.3 38.8
Ireland 34.4 34.6 34.3 27.3 27.6 26.1 25.7 25.1 23.4 22.4 22.8 22.8 22.8 22.9 22.5
Israel 36.1 36.4 36.6 36.8 36.5 37.8 36.2 35.3 34.6 35.4 35.4 35.4 35.4 35.4 35.4
Italy 47.6 48.1 47.9 47.8 46.7 46.3 46.2 47.1 47.8 47.9 47.6 47.5 47.5 47.4 46.7
Japan 30.4 31.2 32.8 33.6 33.6 33.6 34.3 34.1 34.1 33.6 34.0 34.2 34.3 34.4 34.4
Korea 21.2 20.5 20.2 20.3 21.1 21.8 22.9 23.0 22.8 22.7 22.9 23.0 23.2 23.2 23.2
Latvia 37.1 36.5 36.1 35.9 35.7 35.7 37.3 37.5 38.6 40.8 44.0 44.4 41.4 38.4 38.2
Lithuania 32.0 32.0 33.4 34.2 33.6 32.9 33.8 34.1 34.0 34.3 34.6 34.7 34.7 34.7 34.8
Luxembourg 44.7 44.5 43.6 43.2 42.8 43.4 45.3 44.6 43.8 43.3 42.9 42.7 42.6 42.6 42.6
Malta 38.2 38.0 38.2 37.2 36.9 38.0 38.3 37.2 36.9 36.9 37.0 36.6 36.5 36.5 36.6
The Netherlands 42.0 42.8 42.8 41.8 42.8 42.9 42.9 43.7 41.3 42.3 42.9 43.2 43.2 43.3 43.4
New Zealand 37.6 37.3 37.2 37.6 37.5 36.9 37.3 36.5 36.7 36.0 35.7 36.0 36.3 36.6 36.9
Norway 56.4 54.4 54.2 54.5 54.8 54.6 55.8 57.2 51.2 51.8 52.6 53.6 54.4 55.0 54.9
Portugal 42.7 44.8 44.4 43.8 42.9 42.4 42.9 42.6 42.0 43.5 43.9 43.7 43.7 42.9 42.3
Singapore 17.2 16.9 17.2 17.3 18.9 18.9 17.6 18.0 17.7 19.3 18.8 18.4 17.9 17.8 17.7
Slovak Republic 36.8 39.6 40.2 43.1 40.1 40.4 40.7 41.4 42.2 41.8 41.5 42.1 40.7 41.4 41.3
Slovenia 45.4 45.7 45.3 45.9 44.2 44.0 44.3 43.8 44.7 45.0 44.4 43.9 43.6 43.6 43.6
Spain 37.9 38.8 39.2 38.7 38.1 38.2 39.2 39.2 40.8 41.7 41.3 41.0 40.7 39.2 38.9
Sweden 48.8 49.1 48.1 48.4 49.8 49.7 49.6 48.8 49.1 48.4 48.7 49.1 49.2 49.2 49.3
Switzerland 31.6 31.8 31.6 32.6 32.3 33.1 32.6 32.9 33.7 33.2 33.0 33.0 33.0 33.0 33.0
United Kingdom 36.1 36.5 35.6 35.8 36.3 36.8 36.8 36.6 36.8 35.7 36.2 37.4 37.8 37.9 37.9
United States 29.2 31.4 31.4 31.6 31.2 30.7 30.0 30.0 30.3 30.0 31.2 31.3 31.1 31.1 31.6
Source: IMF staff estimates and projections. Projections are based on staff assessments of current policies (see “Fiscal Policy Assumptions” in text).Note: For economy-specific details, see “Data and Conventions” in text, and Table B.
©International Monetary Fund. Not for Redistribution

72
F I S C A L M O N I T O R : A F A I R S H O T
International Monetary Fund | April 2021
Table A6. Advanced Economies: General Government Expenditure, 2012–26(Percent of GDP)
2012 2013 2014 2015 2016 2017 2018 2019 2020 2021 2022 2023 2024 2025 2026
Average 40.8 40.2 39.6 38.7 38.6 38.3 38.4 38.6 47.4 45.8 40.6 39.5 39.2 39.2 39.1
Euro Area 49.9 49.9 49.2 48.4 47.7 47.1 46.9 47.0 54.1 53.2 49.8 48.7 48.1 47.6 47.4
G7 41.3 40.7 40.1 39.3 39.3 39.1 39.2 39.3 48.9 47.4 41.2 39.9 39.7 39.8 39.9
G20 Advanced 40.4 39.7 39.2 38.5 38.5 38.3 38.3 38.6 47.9 46.4 40.5 39.3 39.0 39.1 39.2
Australia 36.6 36.5 36.8 37.3 37.3 36.8 36.9 38.3 45.0 43.7 39.5 37.8 37.3 36.8 36.5
Austria 51.2 51.6 52.3 51.0 50.0 49.1 48.7 48.4 57.9 54.8 52.3 51.0 49.9 49.5 49.4
Belgium 56.5 56.1 55.6 53.7 53.1 52.0 52.2 52.1 60.8 58.0 55.4 55.3 55.5 55.4 55.5
Canada 40.9 40.0 38.4 40.0 40.8 40.5 40.9 41.0 52.4 47.9 44.3 42.5 42.0 41.9 41.8
Cyprus 42.0 42.2 40.4 39.5 37.5 36.7 43.0 40.1 47.4 47.0 45.5 45.6 45.2 44.6 43.9
Czech Republic 44.2 42.1 42.1 41.4 39.8 39.0 40.6 41.2 47.9 47.3 46.2 45.6 45.3 44.5 43.9
Denmark 58.0 55.8 55.2 54.5 52.5 50.5 50.5 49.2 55.1 52.2 51.3 50.7 50.3 50.1 50.1
Estonia 39.1 38.2 37.6 39.4 39.0 38.9 39.1 39.0 44.7 46.3 45.6 45.4 44.5 43.5 42.6
Finland 55.4 56.8 57.3 56.5 55.6 53.6 53.3 53.4 56.7 56.6 55.1 54.3 54.0 53.7 53.5
France 57.1 57.2 57.2 56.8 56.7 56.5 55.6 55.5 62.4 59.7 56.5 55.3 55.0 54.8 54.7
Germany 44.9 44.9 44.3 44.1 44.4 44.2 44.5 45.2 51.1 51.6 47.3 46.6 46.3 46.2 46.2
Greece 53.6 51.9 50.7 51.0 49.7 48.3 48.4 47.4 58.2 59.1 52.8 52.0 50.9 50.0 48.7
Hong Kong SAR 18.3 20.0 17.3 18.0 18.3 17.4 18.4 20.8 29.7 25.0 22.0 21.9 21.9 21.9 21.9
Iceland 47.9 46.1 45.9 43.6 46.5 44.5 44.0 43.4 49.7 49.4 48.6 46.8 43.8 42.4 42.0
Ireland 42.5 40.8 38.0 29.3 28.3 26.4 25.6 24.5 28.7 27.8 25.6 24.2 23.8 23.3 22.8
Israel 40.5 40.5 38.9 37.8 38.0 38.9 39.7 39.3 46.4 44.3 39.8 39.5 39.3 39.2 39.2
Italy 50.6 51.0 50.9 50.3 49.1 48.8 48.4 48.6 57.3 56.7 53.1 51.3 49.7 49.4 48.4
Japan 39.0 39.1 38.7 37.6 37.5 36.9 37.0 37.2 46.7 43.0 37.8 36.6 36.6 36.7 36.8
Korea 19.7 19.9 19.8 19.7 19.5 19.6 20.4 22.6 25.6 25.6 25.3 25.5 25.6 25.4 25.2
Latvia 36.9 37.0 37.8 37.4 36.1 36.5 38.1 37.9 42.5 47.5 45.8 45.3 41.9 39.0 38.7
Lithuania 35.2 34.6 34.0 34.4 33.3 32.4 33.2 33.9 42.0 40.4 36.4 35.5 35.1 34.7 34.4
Luxembourg 44.1 43.6 42.2 41.9 40.9 42.1 42.2 42.2 47.5 44.8 43.4 42.8 42.6 42.6 42.6
Malta 41.6 40.4 39.9 38.2 35.9 34.8 36.4 36.7 45.9 42.6 40.1 39.1 38.5 38.0 37.5
The Netherlands 45.9 45.7 44.9 43.8 42.8 41.7 41.5 41.3 46.9 46.6 45.4 44.9 44.1 43.6 43.5
New Zealand 39.8 38.6 37.7 37.3 36.5 35.6 36.2 38.8 42.4 41.1 39.5 38.8 38.0 37.3 37.1
Norway 42.7 43.7 45.5 48.5 50.7 49.6 48.9 51.6 58.2 52.0 51.2 50.6 50.5 50.6 50.7
Portugal 48.9 49.9 51.7 48.2 44.8 45.4 43.2 42.5 48.1 48.6 45.8 45.1 43.2 42.6 42.0
Singapore 9.8 10.9 12.6 14.4 15.2 13.6 13.9 14.1 26.6 19.5 15.6 15.2 14.8 15.3 15.1
Slovak Republic 41.1 42.5 43.3 45.8 42.7 41.4 41.7 42.7 49.6 48.8 46.4 46.4 44.6 45.0 44.6
Slovenia 49.4 60.3 50.8 48.7 46.2 44.1 43.5 43.3 53.2 51.2 48.6 47.3 46.4 45.8 45.7
Spain 48.7 45.8 45.1 43.9 42.4 41.2 41.7 42.1 52.3 50.7 47.1 45.9 45.0 43.5 43.3
Sweden 49.8 50.5 49.7 48.4 48.8 48.3 48.8 48.3 53.1 52.2 50.5 49.2 49.1 48.9 49.0
Switzerland 31.4 32.2 31.8 32.1 32.1 32.0 31.3 31.5 36.3 36.6 33.7 33.1 33.1 33.0 33.0
United Kingdom 43.7 42.0 41.2 40.3 39.6 39.3 39.0 38.9 50.3 47.5 42.5 41.4 41.2 41.2 41.2
United States1 37.2 36.0 35.5 35.1 35.5 35.4 35.4 35.7 46.2 45.0 37.3 35.9 35.8 36.1 36.4
Source: IMF staff estimates and projections. Projections are based on staff assessments of current policies (see “Fiscal Policy Assumptions” in text).Note: For economy-specific details, see “Data and Conventions” in text, and Table B.1 For cross-economy comparison, expenditure and fiscal balances of the United States are adjusted to exclude the imputed interest on unfunded pension liabilities and the imputed compensation of employees, which are counted as expenditures under the 2008 System of National Accounts (2008 SNA) adopted by the United States, but not in economies that have not yet adopted the 2008 SNA. Data for the United States in this table may thus differ from data published by the US Bureau of Economic Analysis.
©International Monetary Fund. Not for Redistribution

73International Monetary Fund | April 2021
M E T H O D O L O G I C A L A N D S T A T I S T I C A L A P P E N D I X
Table A7. Advanced Economies: General Government Gross Debt, 2012–26(Percent of GDP)
2012 2013 2014 2015 2016 2017 2018 2019 2020 2021 2022 2023 2024 2025 2026
Average 105.6 104.2 103.6 103.0 105.5 103.1 102.5 103.8 120.1 122.5 121.6 121.8 121.5 121.4 121.1
Euro Area 90.7 92.6 92.8 90.9 90.1 87.7 85.8 84.0 96.9 98.2 96.5 95.6 94.4 93.1 91.9
G7 120.9 118.6 117.5 116.2 119.3 117.2 116.8 118.0 136.7 139.5 138.1 138.2 138.1 138.1 138.0
G20 Advanced 114.1 112.2 111.4 110.7 113.7 111.4 111.2 112.7 130.8 133.7 132.8 133.1 133.0 133.1 133.0
Australia1 27.5 30.5 34.0 37.7 40.5 41.1 41.7 47.5 63.1 72.1 77.0 78.0 77.2 76.0 75.0
Austria 81.7 81.0 83.8 84.4 82.5 78.6 74.0 70.5 85.2 87.2 85.7 84.6 82.7 80.1 78.0
Belgium 104.8 105.5 107.0 105.2 105.0 102.0 99.8 98.1 115.0 115.9 116.2 117.4 118.9 120.6 122.2
Canada1 85.4 86.1 85.6 91.2 91.7 88.8 88.8 86.8 117.8 116.3 112.8 109.3 105.7 102.0 98.1
Cyprus 79.4 102.9 109.1 107.2 103.1 93.5 99.2 94.0 118.2 113.0 105.4 102.3 95.1 91.4 85.7
Czech Republic 44.2 44.4 41.9 39.7 36.6 34.2 32.1 30.2 37.6 44.0 48.0 51.4 53.9 56.1 55.0
Denmark 44.9 44.0 44.3 39.8 37.2 35.5 33.8 33.0 43.4 41.6 42.9 43.8 44.2 44.3 44.3
Estonia 9.8 10.2 10.6 10.0 9.9 9.1 8.2 8.4 18.5 25.1 30.3 34.4 37.3 39.5 40.8
Finland 53.6 56.2 59.8 63.6 63.2 61.2 59.6 59.3 67.1 68.8 69.2 69.9 70.6 70.9 71.2
France 90.6 93.4 94.9 95.6 98.0 98.3 98.0 98.1 113.5 115.2 114.3 115.2 115.9 116.3 116.9
Germany 81.1 78.7 75.6 72.3 69.3 65.1 61.8 59.6 68.9 70.3 67.3 64.8 62.2 59.6 57.1
Greece 162.0 179.0 181.5 179.0 183.4 182.4 189.9 184.9 213.1 210.1 200.5 193.1 189.1 184.8 179.6
Hong Kong SAR1 0.5 0.5 0.1 0.1 0.1 0.1 0.1 0.3 0.3 0.9 0.9 0.8 0.6 0.5 0.3
Iceland 133.9 122.0 115.2 97.2 79.9 69.4 61.1 68.3 79.9 82.5 86.1 88.7 88.5 86.9 77.5
Ireland 119.9 120.0 104.4 76.6 74.2 67.3 62.9 57.4 59.8 63.2 63.2 61.4 59.7 57.7 54.4
Israel 68.5 67.1 65.7 63.8 62.1 60.6 60.9 60.0 73.0 78.3 78.8 79.3 79.7 80.2 80.7
Italy 126.5 132.5 135.4 135.3 134.8 134.1 134.4 134.6 155.6 157.1 155.5 155.1 153.7 152.0 151.0
Japan 226.1 229.6 233.5 228.4 232.5 231.4 232.5 234.9 256.2 256.5 253.6 252.9 253.4 254.0 254.7
Korea 35.0 37.7 39.7 40.8 41.2 40.1 40.0 42.2 48.7 53.2 57.2 61.0 64.4 67.3 69.7
Latvia 41.6 39.2 40.9 36.5 39.8 40.1 36.4 37.0 45.5 47.2 45.3 43.6 42.2 40.7 39.2
Lithuania 39.7 38.7 40.5 42.7 39.9 39.3 33.7 35.9 47.0 49.5 47.7 45.6 43.2 40.7 38.1
Luxembourg 22.0 23.7 22.7 22.0 20.1 22.3 21.0 22.0 25.5 26.8 27.3 27.4 27.2 27.1 27.0
Malta 65.9 65.8 61.6 55.9 54.3 48.5 44.8 42.0 55.4 57.9 56.6 55.5 53.1 50.3 47.2
The Netherlands 66.4 67.8 68.0 64.6 61.9 56.9 52.4 47.6 54.0 56.1 56.1 55.9 55.0 53.5 51.8
New Zealand 35.7 34.6 34.2 34.2 33.4 31.1 28.1 32.1 41.3 46.4 50.5 52.8 53.7 52.5 50.4
Norway 31.1 31.6 29.9 34.5 38.1 38.6 39.7 40.9 41.4 41.6 41.3 41.0 40.7 40.4 40.2
Portugal 129.0 131.4 132.9 131.2 131.5 126.1 121.5 116.8 131.6 131.4 125.6 122.0 117.6 113.9 110.6
Singapore 106.7 98.2 97.8 102.2 106.5 107.8 109.8 129.0 128.4 129.5 130.7 131.9 133.1 134.3 135.5
Slovak Republic 51.8 54.7 53.6 51.9 52.4 51.7 49.9 48.5 60.7 64.0 64.3 63.3 63.4 64.0 64.5
Slovenia 53.6 70.0 80.3 82.6 78.5 74.1 70.3 65.6 81.5 80.5 78.2 77.7 76.7 75.5 74.2
Spain 86.3 95.8 100.7 99.3 99.2 98.6 97.4 95.5 117.1 118.4 117.3 117.3 116.8 117.7 118.4
Sweden 37.5 40.2 44.9 43.7 42.3 40.7 38.9 35.1 38.5 40.4 40.2 38.8 37.3 35.7 34.0
Switzerland 42.2 41.6 41.6 41.7 40.5 41.2 39.2 39.8 42.9 44.8 44.1 43.4 42.3 41.5 40.4
United Kingdom 83.2 84.2 86.1 86.7 86.8 86.3 85.8 85.2 103.7 107.1 109.1 110.7 111.4 112.2 113.0
United States1 103.4 104.8 104.6 104.7 106.6 105.6 106.6 108.2 127.1 132.8 132.1 132.4 133.0 133.9 134.5
Source: IMF staff estimates and projections. Projections are based on staff assessments of current policies (see “Fiscal Policy Assumptions” in text).Note: For economy-specific details, see “Data and Conventions” in text, and Table B.1 For cross-economy comparison, gross debt levels reported by national statistical agencies for economies that have adopted the 2008 System of National Accounts (Australia, Canada, Hong Kong SAR, United States) are adjusted to exclude unfunded pension liabilities of government employees’ defined-benefit pension plans.
©International Monetary Fund. Not for Redistribution

74
F I S C A L M O N I T O R : A F A I R S H O T
International Monetary Fund | April 2021
Table A8. Advanced Economies: General Government Net Debt, 2012–26(Percent of GDP)
2012 2013 2014 2015 2016 2017 2018 2019 2020 2021 2022 2023 2024 2025 2026
Average 76.3 75.1 75.3 75.2 76.9 75.0 74.8 75.2 90.8 94.2 94.4 94.7 94.8 95.4 95.8
Euro Area 73.2 75.6 75.8 74.7 74.2 72.1 70.4 69.2 80.8 82.8 81.8 81.3 80.5 79.5 78.6
G7 88.7 87.0 86.9 86.2 88.1 86.6 86.5 86.9 104.9 108.8 108.5 108.8 109.0 109.8 110.6
G20 Advanced 82.7 81.3 81.4 81.1 82.9 81.3 81.3 82.1 99.3 103.2 103.4 103.9 104.1 105.0 105.7
Australia1 13.8 16.0 19.1 22.1 23.3 23.3 24.1 26.2 38.4 48.8 54.0 55.8 55.2 54.2 53.5
Austria 60.5 60.4 59.1 58.3 56.9 55.9 50.7 47.9 61.3 64.4 64.2 63.9 62.8 60.9 59.6
Belgium2 92.0 92.5 93.4 92.0 91.2 88.3 86.3 85.2 101.4 103.0 104.0 105.6 107.5 109.5 111.5
Canada1 28.9 29.7 28.5 28.4 28.7 26.0 25.6 23.4 33.0 37.0 36.6 34.8 32.3 29.7 26.9
Cyprus 67.2 78.8 90.4 90.6 85.8 78.7 52.5 48.1 . . . . . . . . . . . . . . . . . . . . .
Czech Republic 28.1 28.8 29.2 28.1 25.0 21.5 19.6 18.3 25.8 32.3 36.3 39.8 42.7 45.3 44.5
Denmark 18.5 18.3 18.1 16.2 17.5 15.4 13.3 11.9 16.3 17.4 18.5 19.0 19.2 18.4 17.7
Estonia –4.7 –4.3 –3.8 –2.0 –1.9 –1.8 –1.8 –2.2 0.6 10.4 16.6 21.4 25.1 27.9 29.9
Finland3 9.4 12.9 17.2 18.4 21.2 21.8 24.3 24.6 29.7 32.8 34.4 35.5 36.5 37.2 37.7
France 80.0 83.0 85.5 86.3 89.2 89.4 89.3 89.3 104.3 106.1 105.1 106.1 106.7 107.2 107.7
Germany 59.6 58.7 55.1 52.5 49.6 45.8 43.0 41.4 50.0 52.5 50.4 48.4 46.4 44.3 42.2
Greece . . . . . . . . . . . . . . . . . . . . . . . . . . . . . . . . . . . . . . . . . . . . .
Hong Kong SAR1 . . . . . . . . . . . . . . . . . . . . . . . . . . . . . . . . . . . . . . . . . . . . .
Iceland4 104.8 99.2 88.1 78.0 65.2 57.9 48.6 55.4 63.8 69.8 74.4 77.5 77.8 76.8 74.9
Ireland5 86.9 90.1 85.9 65.7 65.3 58.8 54.2 49.4 54.8 58.0 58.2 56.6 55.1 53.2 50.0
Israel 63.2 62.2 61.8 60.1 58.4 56.8 57.4 57.2 70.2 75.6 76.2 76.8 77.4 78.0 78.6
Italy 114.1 119.2 121.4 122.2 121.6 121.3 121.8 122.1 142.0 144.2 143.1 143.1 141.9 140.4 139.7
Japan 144.0 142.9 145.1 144.6 149.6 148.1 151.2 150.4 169.2 172.3 171.0 170.7 171.3 171.8 172.6
Korea 2.3 5.8 7.5 9.5 9.7 9.6 9.6 11.8 18.2 22.7 26.8 30.6 34.0 36.9 39.3
Latvia 29.6 29.5 29.6 30.8 30.6 31.6 28.0 28.5 36.7 38.9 37.6 36.2 35.2 34.0 32.9
Lithuania 33.4 34.1 32.5 35.4 32.9 32.9 27.7 30.4 41.4 44.2 42.6 40.8 38.6 36.3 33.9
Luxembourg –10.8 –9.4 –11.3 –12.6 –12.0 –11.7 –11.2 –8.4 –4.6 –1.2 0.9 2.3 3.2 4.1 5.0
Malta 56.4 56.7 52.2 47.7 41.8 36.4 33.7 30.8 . . . . . . . . . . . . . . . . . . . . .
The Netherlands 52.1 53.7 54.8 52.8 51.0 46.2 42.5 41.6 43.8 45.5 45.5 45.3 44.6 43.4 42.0
New Zealand 8.5 8.6 7.9 7.3 6.6 5.5 4.7 7.0 14.7 21.7 25.7 27.9 28.0 26.5 24.5
Norway6 –49.0 –60.1 –74.6 –85.6 –84.2 –79.3 –71.4 –101.9 –121.2 –110.0 –113.3 –117.7 –122.5 –127.4 –132.1
Portugal 115.7 118.3 120.5 121.5 120.0 116.6 115.5 110.7 122.9 123.0 117.7 114.4 110.3 106.9 103.8
Singapore . . . . . . . . . . . . . . . . . . . . . . . . . . . . . . . . . . . . . . . . . . . . .
Slovak Republic . . . . . . . . . . . . . . . . . . . . . . . . . . . . . . . . . . . . . . . . . . . . .
Slovenia 36.6 45.2 46.5 50.3 52.2 51.9 45.8 42.7 50.5 52.3 50.9 50.5 49.9 49.0 48.2
Spain 71.8 80.8 85.2 84.9 86.1 85.1 83.6 82.2 102.3 104.5 104.3 104.8 104.9 106.0 107.2
Sweden 11.3 11.4 11.2 11.2 8.9 6.3 6.0 3.5 6.4 9.9 11.0 10.8 10.3 9.7 9.0
Switzerland 21.4 20.5 20.5 20.7 21.4 20.5 18.9 19.4 22.6 24.5 23.8 23.0 22.0 21.1 20.1
United Kingdom 74.7 75.9 77.9 78.2 77.8 76.8 75.9 75.3 93.8 97.2 99.2 100.8 101.5 102.3 103.1
United States1 80.8 80.7 81.2 80.7 81.7 81.4 81.7 83.0 103.2 109.0 109.5 110.1 111.0 113.2 115.3
Source: IMF staff estimates and projections. Projections are based on staff assessments of current policies (see “Fiscal Policy Assumptions” in text).Note: For economy-specific details, see “Data and Conventions” in text, and Table B.1 For cross-economy comparison, net debt levels reported by national statistical agencies for economies that have adopted the 2008 System of National Accounts (Australia, Canada, Hong Kong SAR, United States) are adjusted to exclude unfunded pension liabilities of government employees’ defined-benefit pension plans.2 Belgium’s net debt series has been revised to ensure consistency between liabilities and assets. Net debt is defined as gross debt (Maastricht definition) minus assets in the form of currency and deposits, loans, and debt securities.3 Net debt figures were revised to only include categories of assets corresponding to the categories of liabilities covered by the Maastricht definition of “gross debt.”4 “Net debt” for Iceland is defined as gross debt minus currency and deposits.5 “Net debt” for Ireland is defined as gross general debt minus debt instrument assets, namely, currency and deposits (F2), debt securities (F3), and loans (F4). Net debt was previously defined as general government debt less currency and deposits.6 Norway’s net debt series has been revised because of a change in the net debt calculation, which excludes the equity and shares from financial assets and includes accounts receivable in the financial assets, following Government Finance Statistics and the Maastricht definition.
©International Monetary Fund. Not for Redistribution

75International Monetary Fund | April 2021
M E T H O D O L O G I C A L A N D S T A T I S T I C A L A P P E N D I X
Table A9. Emerging Market and Middle-Income Economies: General Government Overall Balance, 2012–26(Percent of GDP)
2012 2013 2014 2015 2016 2017 2018 2019 2020 2021 2022 2023 2024 2025 2026Average –1.0 –1.6 –2.5 –4.3 –4.8 –4.1 –3.8 –4.7 –9.8 –7.7 –6.7 –6.1 –5.6 –5.2 –4.9
Asia –1.6 –1.8 –1.9 –3.3 –4.0 –4.0 –4.5 –5.9 –10.8 –9.2 –8.2 –7.4 –6.8 –6.2 –5.8Europe –0.8 –1.5 –1.5 –2.7 –2.8 –1.8 0.3 –0.7 –5.9 –3.5 –2.7 –2.7 –2.6 –2.5 –2.5Latin America –2.8 –3.1 –4.9 –6.6 –6.0 –5.4 –5.1 –4.0 –8.8 –5.7 –4.5 –4.2 –3.9 –3.7 –3.6MENAP 4.8 2.6 –1.9 –7.8 –9.7 –5.5 –2.7 –3.9 –9.9 –5.7 –4.6 –4.3 –4.1 –3.8 –3.5G20 Emerging –1.2 –1.8 –2.6 –4.5 –4.9 –4.3 –4.3 –5.4 –10.4 –8.3 –7.4 –6.8 –6.3 –5.8 –5.4
Algeria –4.4 –0.4 –7.3 –15.3 –13.1 –6.5 –4.4 –5.6 –7.7 –13.6 –11.8 –11.9 –12.3 –12.4 –12.9Angola 4.1 –0.3 –5.7 –2.9 –4.5 –6.3 2.2 0.7 –1.7 1.2 1.8 1.5 1.6 1.5 1.6Argentina –3.0 –3.3 –4.3 –6.0 –6.7 –6.7 –5.5 –4.5 –8.9 . . . . . . . . . . . . . . . . . .Belarus1 0.4 –1.0 0.1 –3.0 –1.7 –0.3 1.8 0.8 –3.3 –3.8 –2.8 –1.2 –1.1 –0.8 –0.8Brazil –2.5 –3.0 –6.0 –10.3 –9.0 –7.9 –7.1 –5.9 –13.4 –8.3 –7.2 –7.3 –7.0 –6.6 –6.5Bulgaria –0.4 –1.8 –3.7 –2.8 1.5 0.8 0.1 –1.0 –3.0 –3.9 –2.0 –1.8 –0.8 –0.3 0.0Chile 0.7 –0.5 –1.5 –2.1 –2.6 –2.6 –1.5 –2.7 –7.1 –2.3 –2.9 –2.1 –1.4 –0.7 –0.7China –0.3 –0.8 –0.9 –2.8 –3.7 –3.8 –4.7 –6.3 –11.4 –9.6 –8.7 –7.9 –7.2 –6.5 –6.0Colombia 0.2 –1.0 –1.7 –3.5 –2.3 –2.5 –4.7 –2.5 –6.9 –8.3 –3.6 –3.0 –1.9 –1.7 –1.6Croatia –5.3 –5.3 –5.3 –3.3 –1.0 0.8 0.2 0.4 –8.0 –3.9 –2.6 –2.5 –2.4 –2.3 –2.3Dominican Republic –6.6 –3.5 –2.8 0.0 –3.1 –3.1 –2.2 –1.9 –7.4 –3.4 –2.5 –2.3 –2.3 –2.3 –2.4Ecuador2 –0.9 –4.6 –5.2 –6.1 –8.2 –4.5 –3.2 –3.1 –6.3 –2.4 0.9 1.7 2.1 2.2 2.2Egypt3 –10.0 –12.9 –11.3 –10.9 –12.5 –10.4 –9.4 –8.0 –7.9 –7.3 –5.8 –5.6 –4.8 –4.6 –4.2Hungary –2.3 –2.6 –2.8 –2.0 –1.8 –2.4 –2.1 –2.0 –8.5 –6.5 –4.8 –3.6 –2.3 –1.4 –0.6India –7.5 –7.0 –7.1 –7.2 –7.1 –6.4 –6.3 –7.4 –12.3 –10.0 –9.1 –8.4 –8.0 –7.7 –7.4Indonesia –1.6 –2.2 –2.1 –2.6 –2.5 –2.5 –1.8 –2.2 –5.9 –6.1 –4.4 –3.0 –2.6 –2.3 –2.1Iran –0.6 –0.9 –1.1 –1.6 –1.9 –1.8 –1.9 –5.1 –8.4 –6.8 –7.7 –8.5 –9.3 –9.9 –10.6Kazakhstan 4.4 4.9 2.5 –6.3 –4.5 –4.3 2.6 –0.6 –7.3 –3.0 –1.4 –0.8 –0.8 –0.8 –0.8Kuwait 32.4 34.1 22.4 5.6 0.3 6.3 9.0 4.4 –9.4 –6.8 –4.5 –4.6 –5.0 –4.9 –4.0Lebanon –8.4 –8.8 –6.2 –7.5 –8.9 –8.6 –11.3 –10.5 –9.9 –18.8 –13.6 –8.9 –5.8 –3.6 –2.3Malaysia4 –3.1 –3.5 –2.6 –2.5 –2.6 –2.4 –2.6 –2.2 –5.1 –4.4 –3.4 –3.1 –3.0 –2.9 –2.9Mexico –3.7 –3.7 –4.5 –4.0 –2.8 –1.1 –2.2 –2.3 –4.6 –3.4 –2.6 –2.6 –2.5 –2.5 –2.5Morocco –7.2 –5.1 –4.8 –4.6 –4.5 –3.5 –3.7 –4.1 –7.6 –6.4 –5.9 –5.1 –4.5 –3.8 –3.4Oman 4.6 4.7 –1.1 –15.9 –21.0 –12.6 –8.3 –6.7 –17.3 –4.4 –1.5 –1.5 –0.2 0.1 0.3Pakistan –8.6 –8.4 –4.9 –5.3 –4.4 –5.8 –6.4 –9.0 –8.0 –7.1 –5.5 –3.9 –3.9 –3.5 –2.9Peru 2.1 0.7 –0.2 –2.1 –2.2 –2.9 –2.0 –1.4 –8.4 –4.8 –3.1 –2.5 –2.0 –1.7 –1.4Philippines –0.3 0.2 0.8 0.6 –0.4 –0.4 –1.6 –1.8 –5.5 –7.4 –5.5 –4.4 –3.7 –3.0 –2.3Poland –3.8 –4.2 –3.7 –2.6 –2.4 –1.5 –0.2 –0.7 –8.2 –4.7 –2.6 –2.9 –2.9 –2.8 –2.8Qatar 10.5 21.6 15.4 21.7 –4.8 –2.5 5.9 4.9 1.3 1.4 7.3 7.1 6.5 6.5 6.7Romania –2.5 –2.5 –1.7 –1.4 –2.4 –2.8 –2.8 –4.6 –9.7 –7.1 –6.3 –6.2 –6.1 –5.9 –5.9Russia 0.4 –1.2 –1.1 –3.4 –3.7 –1.5 2.9 1.9 –4.1 –0.8 –0.3 –0.5 –0.5 0.0 0.0Saudi Arabia 11.9 5.6 –3.5 –15.8 –17.2 –9.2 –5.9 –4.5 –11.1 –3.8 –2.5 –2.0 –1.4 –0.9 –0.2South Africa –4.4 –4.3 –4.3 –4.8 –4.1 –4.4 –4.1 –5.3 –12.2 –10.6 –8.3 –7.1 –6.7 –6.7 –6.8Sri Lanka –5.6 –5.2 –6.2 –7.0 –5.3 –5.5 –5.3 –8.2 –11.9 –10.5 –9.7 –8.6 –8.3 –7.9 –7.7Thailand –0.9 0.5 –0.8 0.1 0.6 –0.4 0.1 –0.8 –4.7 –4.9 –1.5 –1.4 –1.2 –1.2 –1.1Turkey –1.8 –1.5 –1.4 –1.3 –2.3 –2.2 –3.7 –5.6 –5.4 –5.7 –6.1 –6.1 –6.0 –6.0 –6.1Ukraine –4.3 –4.8 –4.5 –1.2 –2.2 –2.2 –2.1 –2.0 –6.2 –5.2 –3.5 –2.4 –2.4 –2.4 –2.4United Arab Emirates 9.0 8.4 1.9 –3.4 –2.8 –1.7 1.9 0.6 –7.4 –1.3 –1.1 –0.9 –0.6 –0.3 0.0Uruguay 5 –2.2 –1.7 –2.6 –1.9 –2.7 –2.5 –1.9 –2.7 –4.9 –3.5 –3.1 –2.7 –2.5 –2.4 –2.3Venezuela –10.4 –11.3 –15.6 –10.7 –10.8 –23.0 –31.0 –10.0 –5.0 . . . . . . . . . . . . . . . . . .
Source: IMF staff estimates and projections. Projections are based on staff assessments of current policies (see “Fiscal Policy Assumptions” in text).Note: For country-specific details, see “Data and Conventions” in text, and Table C. MENAP = Middle East, North Africa, and Pakistan.1 For Belarus, the underlying assumption for IMF staff projections is no compensation for the loss of oil-related discounts and transfers as a result of internal changes in Russia’s taxation system. (Negotiations between Russia and Belarus on this issue are ongoing.)2 The data for Ecuador reflect net lending/borrowing for the nonfinancial public sector. Ecuadorian authorities, in the context of the Extended Fund Facility approved in March of 2019 and with the tech-nical support from IMF staff, are revising the historical fiscal data for the net lending/borrowing of the nonfinancial public sector to correct recently identified statistical errors, mostly in the recording of revenues and expenditures of local governments. Fiscal data reported in the table for 2018 and 2019 reflect the corrected series, while data for earlier years are still being revised and will be corrected in subsequent World Economic Outlook releases as far back as 2012. The authorities are also working on reconciling historical revenue and expenditure data with financing data.3 These numbers are based on the nominal GDP series before the recent revision; therefore, data in the tables are not comparable to the authorities’ numbers.4 The general government overall balance in 2019 includes a one-off refund of tax arrears in 2019 of 2.4 percent of GDP.5 Data are for the nonfinancial public sector, which includes central government, local government, social security funds, nonfinancial public corporations, and Banco de Seguros del Estado. The coverage of fiscal data was changed from the consolidated public sector to the nonfinancial public sector with the October 2019 submission. With this narrower coverage, the central bank balances are not included in the fiscal data. Historical data were also revised accordingly. Starting in October 2018, the public pension system has been receiving transfers in the context of a new law that com-pensates persons affected by the creation of the mixed pension system. These funds are recorded as revenues, consistent with the IMF’s methodology. Therefore, data and projections for 2018–21 have been affected by these transfers, which amounted to 1.2 percent of GDP in 2018, 1.1 percent of GDP in 2019, and are projected to be 0.6 percent of GDP in 2020, 0.2 percent of GDP in 2021, and zero thereafter. See IMF country report No. 19/64 for further details. The disclaimer about the public pension system applies only to the revenues and net lending/borrowing series.
©International Monetary Fund. Not for Redistribution

76
F I S C A L M O N I T O R : A F A I R S H O T
International Monetary Fund | April 2021
Table A10. Emerging Market and Middle-Income Economies: General Government Primary Balance, 2012–26(Percent of GDP)
2012 2013 2014 2015 2016 2017 2018 2019 2020 2021 2022 2023 2024 2025 2026Average 0.6 0.0 –0.9 –2.6 –3.1 –2.3 –2.0 –2.9 –8.0 –5.8 –4.7 –4.1 –3.5 –3.1 –2.7
Asia –0.4 –0.6 –0.6 –2.1 –2.6 –2.5 –3.0 –4.4 –9.1 –7.6 –6.5 –5.7 –5.0 –4.5 –4.0Europe 0.4 –0.3 –0.4 –1.5 –1.6 –0.7 1.4 0.3 –4.8 –2.3 –1.4 –1.4 –1.3 –1.1 –1.0Latin America 0.2 –0.1 –1.6 –2.4 –2.3 –1.6 –1.4 –0.4 –5.5 –2.4 –1.0 –0.5 0.0 0.4 0.6MENAP 5.5 3.3 –1.2 –7.1 –9.0 –4.9 –1.6 –2.5 –8.5 –3.7 –2.4 –1.9 –1.5 –1.0 –0.6G20 Emerging 0.4 –0.2 –0.9 –2.7 –3.1 –2.4 –2.5 –3.5 –8.6 –6.4 –5.5 –4.8 –4.2 –3.7 –3.3
Algeria –5.3 –0.5 –7.4 –15.8 –13.1 –6.2 –4.6 –6.2 –7.5 –13.6 –11.5 –10.9 –10.4 –9.6 –9.6Angola 5.0 0.4 –4.7 –1.1 –1.7 –3.0 6.7 6.0 4.7 7.5 7.2 6.4 6.1 5.7 5.3Argentina –1.7 –2.6 –3.5 –4.4 –4.8 –4.2 –2.3 –0.4 –6.4 . . . . . . . . . . . . . . . . . .Belarus1 1.7 0.0 1.1 –1.3 0.3 1.6 3.8 2.5 –1.4 –2.0 –1.0 0.4 0.4 0.6 0.5Brazil 1.9 1.7 –0.6 –1.9 –2.5 –1.8 –1.7 –0.9 –9.2 –3.7 –2.1 –1.6 –0.8 –0.2 0.3Bulgaria –0.1 –1.3 –3.4 –2.4 1.8 1.2 0.3 –0.8 –2.9 –3.8 –1.8 –1.5 –0.6 –0.1 0.3Chile 0.8 –0.4 –1.3 –1.9 –2.4 –2.3 –1.1 –2.3 –6.6 –1.9 –2.4 –1.5 –0.7 0.0 0.1China 0.2 –0.3 –0.3 –2.3 –3.0 –3.1 –3.8 –5.5 –10.4 –8.7 –7.8 –6.9 –6.1 –5.5 –4.9Colombia 1.8 0.9 –0.2 –1.7 –0.4 –0.5 –2.5 0.0 –4.3 –5.5 –0.5 0.0 1.0 1.1 1.1Croatia –2.6 –2.6 –2.4 –0.2 1.9 3.2 2.3 2.4 –5.9 –1.6 –0.4 –0.3 –0.3 –0.3 –0.4Dominican Republic –4.2 –1.2 –0.4 2.3 –0.6 –0.5 0.4 0.8 –4.2 0.0 0.7 0.9 0.8 0.8 0.7Ecuador2 –0.2 –3.5 –4.2 –4.7 –6.7 –2.3 –0.7 –0.5 –3.4 –1.0 2.5 3.4 4.0 4.3 4.4Egypt3 –4.9 –5.9 –4.2 –4.1 –4.3 –2.5 –0.4 1.4 1.3 1.0 2.2 2.1 2.0 1.9 1.8Hungary 1.9 1.7 1.0 1.3 1.2 0.2 0.2 0.2 –6.6 –4.7 –2.9 –1.6 0.0 1.0 2.1India –3.2 –2.4 –2.6 –2.7 –2.5 –1.6 –1.6 –2.8 –6.8 –4.5 –3.6 –3.0 –2.6 –2.4 –2.1Indonesia –0.4 –1.0 –0.9 –1.2 –1.0 –0.9 0.0 –0.5 –3.8 –4.1 –2.4 –1.0 –0.8 –0.5 –0.5Iran –0.5 –0.8 –1.0 –1.5 –1.4 –1.0 –1.1 –4.5 –7.5 –4.7 –4.6 –4.4 –4.2 –4.0 –3.7Kazakhstan 3.8 4.4 2.0 –5.9 –4.3 –5.2 1.8 –0.8 –8.0 –3.4 –1.8 –1.1 –1.0 –1.1 –1.1Kuwait4 25.4 25.8 12.7 –7.5 –14.2 –9.4 –3.0 –8.8 –23.0 –17.5 –17.0 –18.0 –18.2 –17.7 –16.3Lebanon –0.2 –0.7 2.5 1.4 0.4 0.8 –1.4 –0.3 –5.7 –15.8 –11.0 –6.1 –2.8 –0.7 0.9Malaysia –2.1 –2.1 –0.9 –0.9 –0.8 –0.6 –0.8 –0.2 –3.3 –2.9 –1.4 –1.1 –0.9 –0.7 –0.6Mexico –0.9 –0.9 –1.7 –1.2 0.4 2.6 1.6 1.4 –0.6 0.2 0.7 0.5 0.6 0.6 0.7Morocco –4.7 –2.5 –2.1 –1.9 –1.8 –0.9 –1.3 –1.5 –5.1 –3.8 –3.3 –2.6 –1.8 –1.1 –0.7Oman 3.3 2.6 –2.1 –16.1 –21.8 –13.4 –6.9 –5.0 –14.4 –2.5 0.9 1.4 2.5 3.0 2.8Pakistan –4.2 –3.9 –0.3 –0.5 –0.1 –1.5 –2.1 –3.5 –1.7 –1.0 0.4 1.6 1.7 1.7 1.6Peru 3.0 1.7 0.7 –1.2 –1.3 –1.9 –0.9 –0.2 –6.9 –3.2 –1.7 –1.1 –0.7 –0.5 –0.3Philippines 2.2 2.6 3.0 2.5 1.4 1.3 0.1 –0.2 –3.5 –4.9 –2.8 –1.8 –1.0 –0.4 0.3Poland –1.1 –1.7 –1.7 –0.9 –0.7 0.1 1.2 0.6 –6.9 –3.7 –1.7 –1.9 –1.9 –1.9 –1.8Qatar 12.0 22.8 16.6 23.2 –3.3 –1.1 7.4 6.6 3.6 3.3 9.0 8.7 8.0 7.8 8.0Romania –0.7 –0.8 –0.2 –0.1 –1.1 –1.7 –1.5 –3.5 –8.4 –5.6 –4.6 –4.4 –4.2 –4.0 –3.8Russia 0.7 –0.8 –0.7 –3.1 –3.2 –1.0 3.4 2.2 –3.6 –0.4 0.1 –0.2 –0.1 0.3 0.3Saudi Arabia 11.7 5.2 –4.2 –17.9 –20.2 –11.1 –6.5 –4.5 –13.0 –3.5 –2.0 –1.5 –0.9 –0.3 0.5South Africa –1.7 –1.4 –1.3 –1.6 –0.7 –0.8 –0.4 –1.3 –7.7 –5.7 –2.9 –1.3 –0.5 0.0 0.6Sri Lanka –0.9 –0.6 –2.0 –2.2 –0.2 0.0 0.6 –2.2 –5.3 –4.0 –2.7 –1.5 –1.1 –0.7 –0.5Thailand 0.0 1.3 –0.1 0.7 1.0 0.1 0.6 –0.3 –4.2 –4.4 –0.9 –0.7 –0.5 –0.4 –0.4Turkey 0.7 0.8 0.5 0.6 –1.0 –0.9 –2.2 –3.8 –3.5 –3.3 –3.2 –3.2 –3.1 –3.0 –2.9Ukraine –2.4 –2.3 –1.2 3.0 1.9 1.6 1.1 1.0 –3.2 –1.7 0.1 1.1 0.9 0.7 0.6United Arab Emirates 9.3 8.8 2.2 –3.2 –2.7 –1.5 2.1 0.9 –6.9 –0.7 –0.4 –0.2 0.2 0.6 1.0Uruguay5 –0.1 0.4 –0.5 0.2 –0.2 –0.1 0.6 –0.5 –2.3 –0.8 –0.4 0.1 0.3 0.4 0.4Venezuela –6.9 –8.1 –11.9 –9.0 –10.6 –23.0 –31.0 –10.0 –5.0 . . . . . . . . . . . . . . . . . .
Source: IMF staff estimates and projections. Projections are based on staff assessments of current policies (see “Fiscal Policy Assumptions” in text).Note: “Primary balance” is defined as the overall balance, excluding net interest payments. For country-specific details, see “Data and Conventions” in text, and Table C. MENAP = Middle East, North Africa, and Pakistan.1 For Belarus, the underlying assumption for IMF staff projections is no compensation for the loss of oil-related discounts and transfers as a result of internal changes in Russia’s taxation system. (Negotiations between Russia and Belarus on this issue are ongoing.)2 The data for Ecuador reflect net lending/borrowing for the nonfinancial public sector. Ecuadorian authorities, in the context of the Extended Fund Facility approved in March of 2019 and with the tech-nical support from IMF Staff, are undertaking revisions of the historical fiscal data for the net lending/borrowing of the nonfinancial public sector correcting recently identified statistical errors, mostly in the recording of revenues and expenditures of local governments. Fiscal data reported in the table for 2018 and 2019 reflect the corrected series, while data for earlier years are still under revisions and will be corrected in subsequent World Economic Outlook releases as far back as 2012. The authorities are also working on reconciling historical revenue and expenditure data with financing.3 Based on nominal GDP series before the recent revision; therefore, data in the tables are not comparable to the authorities’ numbers.4 Interest revenue is proxied by IMF staff estimates of investment income. The country team does not have the breakdown of investment income between interest revenue and dividends.5 Data are for the nonfinancial public sector, which includes central government, local government, social security funds, nonfinancial public corporations, and Banco de Seguros del Estado. The coverage of fiscal data was changed from the consolidated public sector to the nonfinancial public sector with the October 2019 submission. With this narrower coverage, the central bank balances are not included in the fiscal data. Historical data were also revised accordingly. Starting in October 2018, the public pension system has been receiving transfers in the context of a new law that com-pensates persons affected by the creation of the mixed pension system. These funds are recorded as revenues, consistent with the IMF’s methodology. Therefore, data and projections for 2018–21 have been affected by these transfers, which amounted to 1.2 percent of GDP in 2018, 1.1 percent of GDP in 2019, and are projected to be 0.6 percent of GDP in 2020, 0.2 percent of GDP in 2021, and zero thereafter. See IMF country report No. 19/64 for further details. The disclaimer about the public pension system applies only to the revenues and net lending/borrowing series.
©International Monetary Fund. Not for Redistribution

77International Monetary Fund | April 2021
M E T H O D O L O G I C A L A N D S T A T I S T I C A L A P P E N D I X
Table A11. Emerging Market and Middle-Income Economies: General Government Cyclically Adjusted Balance, 2012–26(Percent of potential GDP)
2012 2013 2014 2015 2016 2017 2018 2019 2020 2021 2022 2023 2024 2025 2026Average –2.1 –2.5 –2.7 –3.8 –4.0 –3.8 –3.9 –4.7 –8.1 –7.3 –6.6 –6.2 –5.8 –5.4 –5.1
Asia –1.6 –1.8 –1.8 –3.0 –3.7 –3.8 –4.4 –5.6 –8.8 –8.5 –7.7 –7.1 –6.7 –6.2 –5.8Europe –1.1 –2.1 –1.2 –2.2 –2.3 –1.6 0.0 –1.0 –5.3 –3.0 –2.5 –2.7 –2.6 –2.5 –2.5Latin America –3.0 –3.6 –5.2 –6.4 –5.3 –4.9 –4.4 –3.7 –7.0 –5.1 –4.2 –4.1 –3.9 –3.7 –3.7MENAP –8.1 –7.8 –9.2 –10.9 –10.6 –8.4 –7.5 –7.8 –8.1 –9.6 –8.2 –7.5 –6.4 –5.6 –5.0G20 Emerging –1.9 –2.4 –2.6 –3.9 –4.2 –4.0 –4.2 –5.1 –8.6 –7.7 –7.1 –6.7 –6.3 –5.9 –5.5
Algeria –3.0 2.4 –8.7 –17.8 –14.7 –8.3 –7.4 –11.5 –15.5 –22.9 –20.6 –19.1 –17.5 –15.6 –14.4Angola –0.2 –2.1 –5.2 0.8 –1.3 –3.2 3.1 1.2 –0.5 0.5 1.2 1.1 1.4 1.6 1.7Argentina –2.9 –3.6 –3.4 –6.2 –6.0 –7.2 –5.1 –3.4 –5.8 . . . . . . . . . . . . . . . . . .Belarus1 –0.2 –1.5 –0.8 –2.3 –0.1 0.3 1.7 0.5 –2.8 –2.9 –1.8 –0.3 –0.6 –0.5 –0.6Brazil –3.7 –4.6 –7.8 –10.4 –7.7 –6.9 –6.7 –5.8 –11.9 –7.7 –7.1 –7.3 –7.0 –6.6 –6.6Bulgaria –0.4 –1.8 –3.7 –2.8 1.5 0.8 0.1 –1.0 –1.8 –2.6 –1.4 –1.6 –0.7 –0.4 0.0Chile2 –0.4 –0.5 –0.5 0.5 –1.0 –2.0 –1.5 –1.7 –2.6 –4.1 –3.9 –2.9 –1.9 –0.9 –0.9China –0.4 –0.9 –0.9 –2.5 –3.4 –3.6 –4.5 –5.9 –9.7 –9.0 –8.3 –7.6 –7.1 –6.5 –6.0Colombia 0.1 –1.5 –2.4 –3.9 –2.6 –2.3 –4.1 –2.0 –4.8 –6.8 –2.5 –2.4 –1.5 –1.6 –1.6Croatia –6.1 –6.3 –5.2 –2.9 –1.0 0.8 0.4 0.2 –6.1 –2.7 –2.1 –2.2 –2.2 –2.3 –2.3Dominican Republic –6.2 –3.1 –4.8 –4.7 –4.2 –4.2 –4.0 –3.9 –8.1 –4.4 –3.6 –3.5 –3.6 –3.5 –3.5Ecuador3 –2.3 –6.0 –6.5 –6.8 –7.6 –3.9 –3.8 –3.5 –4.4 –1.8 1.7 2.3 2.5 2.4 2.3Egypt4 –9.9 –13.2 –11.6 –11.4 –12.0 –10.7 –9.5 –7.7 –7.0 –7.9 –6.2 –5.8 –4.9 –4.7 –4.3Hungary –0.1 –0.4 –1.7 –1.4 –1.2 –2.5 –3.0 –3.3 –7.7 –6.0 –4.6 –3.4 –2.2 –1.4 –0.6India –7.3 –6.6 –6.7 –7.0 –7.4 –6.3 –6.8 –7.4 –8.2 –8.9 –8.4 –8.1 –7.8 –7.6 –7.4Indonesia –1.9 –2.5 –2.3 –2.7 –2.5 –2.4 –1.7 –2.2 –4.7 –5.1 –3.9 –2.7 –2.5 –2.3 –2.1Iran . . . . . . . . . . . . . . . . . . . . . . . . . . . . . . . . . . . . . . . . . . . . .Kazakhstan . . . . . . . . . . . . . . . . . . . . . . . . . . . . . . . . . . . . . . . . . . . . .Kuwait . . . . . . . . . . . . . . . . . . . . . . . . . . . . . . . . . . . . . . . . . . . . .Lebanon –17.4 –14.2 –14.1 –13.3 –13.0 –14.6 –12.3 –13.8 –10.2 –6.1 –17.4 –14.2 –9.4 –6.4 –4.7Malaysia –3.3 –3.2 –2.5 –2.7 –2.7 –2.6 –3.5 –1.8 –4.3 –3.9 –3.0 –2.8 –2.8 –2.7 –2.9Mexico –3.9 –3.6 –4.5 –4.2 –4.1 –2.6 –2.4 –2.1 –3.2 –2.6 –2.2 –2.4 –2.4 –2.5 –2.5Morocco –7.7 –5.9 –6.3 –4.6 –4.8 –4.2 –3.9 –4.0 –5.3 –5.5 –5.2 –4.9 –4.5 –3.8 –3.5Oman . . . . . . . . . . . . . . . . . . . . . . . . . . . . . . . . . . . . . . . . . . . . .Pakistan . . . . . . . . . . . . . . . . . . . . . . . . . . . . . . . . . . . . . . . . . . . . .Peru2 1.3 0.1 –0.1 –1.6 –1.9 –2.1 –1.6 –0.6 –6.0 –4.2 –3.1 –2.9 –2.5 –2.3 –2.0Philippines –0.3 0.2 0.7 0.6 –0.4 –0.5 –1.6 –1.8 –4.8 –7.3 –5.5 –4.5 –3.7 –3.0 –2.3Poland –3.6 –3.6 –3.2 –2.3 –2.1 –1.7 –0.6 –1.2 –7.1 –3.7 –2.2 –2.9 –2.9 –2.9 –2.8Qatar . . . . . . . . . . . . . . . . . . . . . . . . . . . . . . . . . . . . . . . . . . . . .Romania –1.3 –1.6 –1.0 –0.5 –1.9 –3.4 –3.7 –5.6 –8.8 –6.7 –6.2 –6.2 –6.1 –5.9 –5.9Russia 0.1 –1.6 –0.1 –3.1 –3.2 –1.0 2.9 2.0 –4.4 –0.4 0.0 –0.4 –0.4 0.0 0.0Saudi Arabia . . . . . . . . . . . . . . . . . . . . . . . . . . . . . . . . . . . . . . . . . . . . .South Africa –4.3 –4.3 –4.4 –4.6 –4.0 –4.5 –4.2 –4.9 –8.1 –7.8 –7.4 –6.9 –6.6 –6.7 –6.8Sri Lanka . . . . . . . . . . . . . . . . . . . . . . . . . . . . . . . . . . . . . . . . . . . . .Thailand –0.6 0.3 –0.4 0.5 0.9 –0.3 0.1 –0.7 –2.9 –2.8 –0.6 –0.9 –1.0 –1.0 –1.1Turkey –1.7 –2.0 –1.6 –1.5 –2.1 –2.9 –4.2 –5.3 –4.6 –5.7 –6.1 –6.1 –6.0 –5.9 –6.0Ukraine –4.5 –4.6 –3.3 0.9 –1.2 –1.3 –2.4 –2.4 –4.6 –4.7 –3.3 –2.4 –2.4 –2.4 –2.4United Arab Emirates . . . . . . . . . . . . . . . . . . . . . . . . . . . . . . . . . . . . . . . . . . . . .Uruguay5 –3.0 –2.7 –3.4 –1.9 –2.6 –2.5 –1.9 –2.3 –3.7 –2.8 –2.8 –2.6 –2.4 –2.4 –2.3Venezuela . . . . . . . . . . . . . . . . . . . . . . . . . . . . . . . . . . . . . . . . . . . . .
Source: IMF staff estimates and projections. Projections are based on staff assessments of current policies (see “Fiscal Policy Assumptions” in text).Note: For country-specific details, see “Data and Conventions” in text, and Table C. MENAP = Middle East, North Africa, and Pakistan.1 For Belarus, the underlying assumption for IMF staff projections is no compensation for the loss of oil-related discounts and transfers as a result of internal changes in Russia’s taxation system. (Negotiations between Russia and Belarus on this issue are ongoing.)2 Data for these countries include adjustments beyond the output cycle.3 The data for Ecuador reflect net lending/borrowing for the nonfinancial public sector. Ecuadorian authorities, in the context of the Extended Fund Facility approved in March of 2019 and with the technical support from IMF staff, are revising the historical fiscal data for the net lending/borrowing of the nonfinancial public sector to correct recently identified statistical errors, mostly in the recording of revenues and expenditures of local governments. Fiscal data reported in the table for 2018 and 2019 reflect the corrected series, while data for earlier years are still under revisions and will be corrected in subsequent World Economic Outlook releases as far back as 2012. The authorities are also working on reconciling historical revenue and expenditure data with financing data.4 These numbers are based on the nominal GDP series before the recent revision; therefore, data in the tables are not comparable to the authorities’ numbers.5 Data are for the nonfinancial public sector, which includes central government, local government, social security funds, nonfinancial public corporations, and Banco de Seguros del Estado. The coverage of fiscal data was changed from the consolidated public sector to the nonfinancial public sector with the October 2019 submission. With this narrower coverage, the central bank balances are not included in the fiscal data. Historical data were also revised accordingly. Starting in October 2018, the public pension system has been receiving transfers in the context of a new law that compensates persons affected by the creation of the mixed pension system. These funds are recorded as revenues, consistent with the IMF’s methodology. Therefore, data and projections for 2018–21 have been affected by these transfers, which amounted to 1.2 percent of GDP in 2018, 1.1 percent of GDP in 2019, and are projected to be 0.6 percent of GDP in 2020, 0.2 percent of GDP in 2021, and zero thereafter. See IMF country report No. 19/64 for further details.
©International Monetary Fund. Not for Redistribution

78
F I S C A L M O N I T O R : A F A I R S H O T
International Monetary Fund | April 2021
Table A12. Emerging Market and Middle-Income Economies: General Government Cyclically Adjusted Primary Balance, 2012–26(Percent of potential GDP)
2012 2013 2014 2015 2016 2017 2018 2019 2020 2021 2022 2023 2024 2025 2026Average –0.3 –0.7 –0.9 –1.8 –2.1 –1.8 –2.0 –2.8 –6.2 –5.4 –4.6 –4.1 –3.7 –3.2 –2.9
Asia –0.4 –0.6 –0.6 –1.8 –2.4 –2.3 –3.0 –4.2 –7.3 –6.9 –6.1 –5.4 –5.0 –4.5 –4.0Europe 0.2 –0.8 0.0 –1.0 –1.1 –0.5 1.1 0.1 –4.1 –1.8 –1.2 –1.3 –1.2 –1.0 –1.0Latin America 0.0 –0.5 –1.8 –2.0 –1.6 –1.0 –0.7 –0.1 –3.8 –1.9 –0.7 –0.4 0.0 0.4 0.6MENAP –4.9 –3.5 –4.8 –6.4 –5.3 –3.6 –2.3 –2.4 –2.6 –4.4 –3.0 –2.2 –1.4 –0.6 –0.1G20 Emerging –0.2 –0.7 –0.8 –2.0 –2.4 –2.1 –2.3 –3.2 –6.7 –5.9 –5.2 –4.7 –4.2 –3.8 –3.4
Algeria –4.4 2.3 –8.9 –18.5 –14.8 –7.8 –7.7 –12.2 –15.3 –22.8 –20.4 –17.9 –15.2 –12.3 –10.3Angola 0.8 –1.3 –4.1 2.3 1.0 –0.4 7.3 6.3 5.4 7.2 6.8 6.2 6.0 5.7 5.4Argentina –1.6 –3.0 –2.7 –4.6 –4.1 –4.7 –1.9 0.5 –3.5 –2.7 –1.0 0.4 1.0 1.7 1.8Belarus1 1.2 –0.5 0.2 –0.7 1.8 2.3 3.6 2.2 –1.0 –1.1 0.0 1.3 0.9 0.9 0.7Brazil 0.9 0.3 –2.1 –2.0 –1.4 –1.0 –1.3 –0.9 –7.9 –3.1 –1.9 –1.6 –0.8 –0.2 0.3Bulgaria –0.1 –1.3 –3.4 –2.4 1.8 1.2 0.3 –0.8 –1.6 –2.5 –1.2 –1.3 –0.5 –0.2 0.2Chile2 –0.3 –0.4 –0.4 0.7 –0.7 –1.6 –1.1 –1.3 –2.1 –3.7 –3.4 –2.3 –1.2 –0.2 –0.1China 0.1 –0.4 –0.4 –2.0 –2.7 –2.9 –3.7 –5.1 –8.8 –8.1 –7.4 –6.6 –6.0 –5.5 –4.9Colombia 1.7 0.5 –0.8 –2.1 –0.6 –0.3 –1.9 0.4 –2.4 –4.2 0.5 0.6 1.4 1.2 1.1Croatia –3.3 –3.5 –2.3 0.2 1.9 3.2 2.5 2.2 –4.2 –0.5 0.1 –0.1 –0.1 –0.3 –0.4Dominican Republic –3.9 –0.9 –2.5 –2.3 –1.7 –1.6 –1.4 –1.0 –5.1 –1.1 –0.4 –0.3 –0.4 –0.3 –0.4Ecuador3 –1.6 –5.0 –5.4 –5.4 –6.1 –1.8 –1.3 –0.8 –1.6 –0.4 3.3 4.0 4.3 4.6 4.5Egypt4 –4.9 –6.1 –4.5 –4.6 –3.9 –2.7 –0.5 1.6 2.2 0.5 1.9 1.9 1.9 1.8 1.6Hungary 3.9 3.7 2.0 1.9 1.8 0.1 –0.7 –1.0 –5.7 –4.2 –2.6 –1.2 0.2 1.2 2.4India –3.0 –2.1 –2.3 –2.5 –2.7 –1.5 –2.0 –2.7 –3.2 –3.6 –3.0 –2.7 –2.5 –2.3 –2.1Indonesia –0.7 –1.3 –1.1 –1.3 –1.0 –0.8 0.0 –0.4 –2.8 –3.2 –1.9 –0.8 –0.7 –0.5 –0.5Iran . . . . . . . . . . . . . . . . . . . . . . . . . . . . . . . . . . . . . . . . . . . . .Kazakhstan . . . . . . . . . . . . . . . . . . . . . . . . . . . . . . . . . . . . . . . . . . . . .Kuwait . . . . . . . . . . . . . . . . . . . . . . . . . . . . . . . . . . . . . . . . . . . . .Lebanon –9.0 –5.8 –5.1 –3.9 –3.2 –4.9 –2.8 –5.8 –6.9 –3.0 –14.4 –11.2 –6.5 –3.4 –1.5Malaysia –2.3 –1.9 –0.8 –1.1 –0.9 –0.8 –1.6 0.2 –2.6 –2.4 –1.1 –0.9 –0.7 –0.5 –0.7Mexico –1.1 –0.9 –1.7 –1.4 –0.9 1.1 1.4 1.6 0.5 0.9 1.0 0.7 0.6 0.6 0.7Morocco –5.2 –3.3 –3.6 –1.9 –2.2 –1.7 –1.5 –1.5 –3.0 –3.0 –2.8 –2.3 –1.8 –1.1 –0.8Oman . . . . . . . . . . . . . . . . . . . . . . . . . . . . . . . . . . . . . . . . . . . . .Pakistan . . . . . . . . . . . . . . . . . . . . . . . . . . . . . . . . . . . . . . . . . . . . .Peru2 2.3 1.1 0.8 –0.6 –1.0 –1.1 –0.5 0.5 –4.6 –2.7 –1.6 –1.5 –1.2 –1.1 –0.9Philippines 2.2 2.6 2.8 2.6 1.4 1.2 0.1 –0.2 –2.8 –4.8 –2.8 –1.8 –1.0 –0.4 0.3Poland –0.9 –1.1 –1.2 –0.6 –0.4 –0.1 0.8 0.2 –5.7 –2.7 –1.3 –2.0 –1.9 –1.9 –1.8Qatar . . . . . . . . . . . . . . . . . . . . . . . . . . . . . . . . . . . . . . . . . . . . .Romania 0.4 0.0 0.5 0.7 –0.7 –2.3 –2.3 –4.4 –7.5 –5.2 –4.6 –4.4 –4.2 –4.0 –3.8Russia 0.3 –1.2 0.3 –2.8 –2.8 –0.5 3.4 2.3 –3.9 0.0 0.3 0.0 0.0 0.3 0.3Saudi Arabia . . . . . . . . . . . . . . . . . . . . . . . . . . . . . . . . . . . . . . . . . . . . .South Africa –1.7 –1.4 –1.4 –1.4 –0.6 –0.9 –0.5 –1.0 –3.7 –3.0 –2.2 –1.2 –0.4 0.0 0.6Sri Lanka . . . . . . . . . . . . . . . . . . . . . . . . . . . . . . . . . . . . . . . . . . . . .Thailand 0.3 1.1 0.3 1.1 1.3 0.2 0.6 –0.2 –2.4 –2.4 0.0 –0.2 –0.2 –0.3 –0.4Turkey 0.8 0.3 0.4 0.3 –0.7 –1.6 –2.7 –3.5 –2.7 –3.3 –3.2 –3.2 –3.1 –2.9 –2.8Ukraine –2.6 –2.2 0.0 4.9 2.8 2.4 0.9 0.6 –1.8 –1.2 0.3 1.1 0.9 0.7 0.6United Arab Emirates . . . . . . . . . . . . . . . . . . . . . . . . . . . . . . . . . . . . . . . . . . . . .Uruguay5 –0.9 –0.4 –1.2 0.2 –0.2 –0.2 0.6 –0.1 –1.2 –0.1 –0.1 0.2 0.3 0.4 0.5Venezuela . . . . . . . . . . . . . . . . . . . . . . . . . . . . . . . . . . . . . . . . . . . . .
Source: IMF staff estimates and projections. Projections are based on staff assessments of current policies (see “Fiscal Policy Assumptions” in text).Note: Cyclically adjusted primary balance is defined as the cyclically adjusted balance plus net interest payable/paid (interest expense minus interest revenue) following the World Economic Outlook convention. For country-specific details, see “Data and Conventions” in text, and Table C. MENAP = Middle East, North Africa, and Pakistan.1 For Belarus, the underlying assumption for IMF staff projections is no compensation for the loss of oil-related discounts and transfers as a result of internal changes in Russia’s taxation system. (Negotiations between Russia and Belarus on this issue are ongoing.)2 Data for these countries include adjustments beyond the output cycle. For country-specific details, see “Data and Conventions” in text, and Table C.3 The data for Ecuador reflect net lending/borrowing for the nonfinancial public sector. Ecuadorian authorities, in the context of the Extended Fund Facility approved in March of 2019 and with the technical support from IMF staff, are revising the historical fiscal data for the net lending/borrowing of the nonfinancial public sector to correct recently identified statistical errors, mostly in the recording of revenues and expenditures of local governments. Fiscal data reported in the table for 2018 and 2019 reflect the corrected series, while data for earlier years are still under revisions and will be corrected in subsequent World Economic Outlook releases as far back as 2012. The authorities are also working on reconciling historical revenue and expenditure data with financing data.4 These numbers are based on the nominal GDP series before the recent revision; therefore, data in the tables are not comparable to the authorities’ numbers.5 Data are for the nonfinancial public sector, which includes central government, local government, social security funds, nonfinancial public corporations, and Banco de Seguros del Estado. The coverage of fiscal data was changed from the consolidated public sector to the nonfinancial public sector with the October 2019 submission. With this narrower coverage, the central bank balances are not included in the fiscal data. Historical data were also revised accordingly. Starting in October 2018, the public pension system has been receiving transfers in the context of a new law that compensates persons affected by the creation of the mixed pension system. These funds are recorded as revenues, consistent with the IMF’s methodology. Therefore, data and projections for 2018–21 have been affected by these transfers, which amounted to 1.2 percent of GDP in 2018, 1.1 percent of GDP in 2019, and are projected to be 0.6 percent of GDP in 2020, 0.2 percent of GDP in 2021, and zero thereafter. See IMF country report No. 19/64 for further details.
©International Monetary Fund. Not for Redistribution
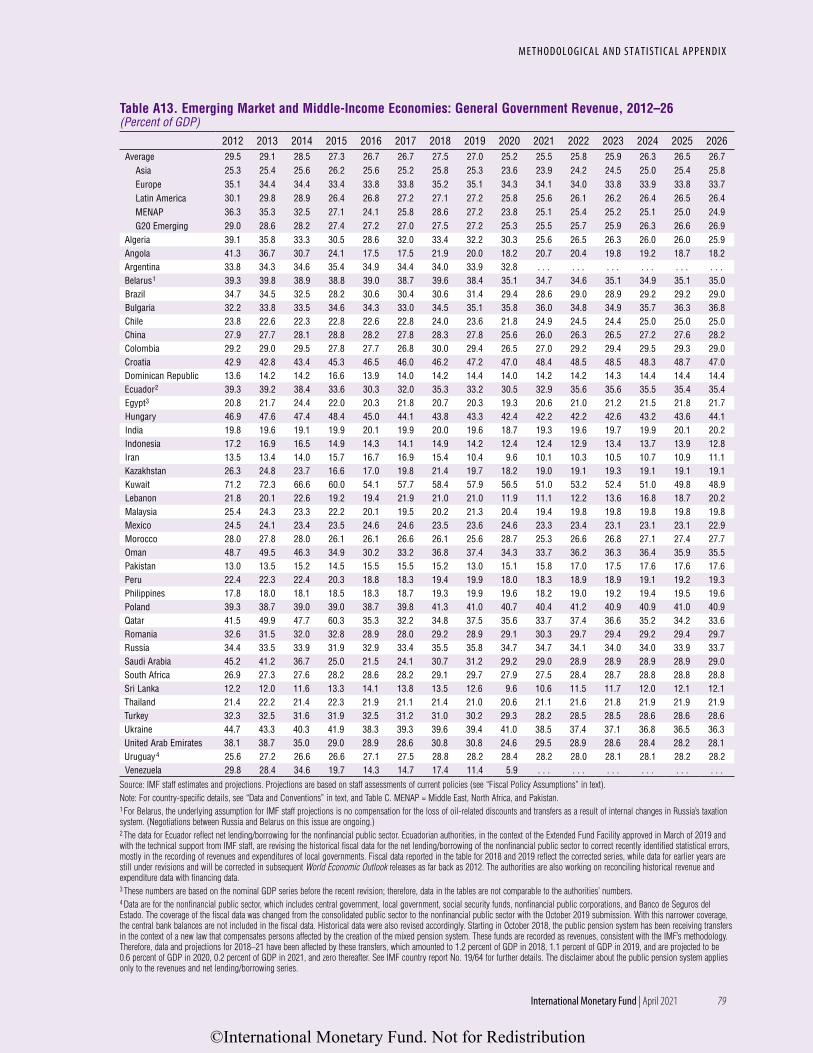
79International Monetary Fund | April 2021
M E T H O D O L O G I C A L A N D S T A T I S T I C A L A P P E N D I X
Table A13. Emerging Market and Middle-Income Economies: General Government Revenue, 2012–26(Percent of GDP)
2012 2013 2014 2015 2016 2017 2018 2019 2020 2021 2022 2023 2024 2025 2026Average 29.5 29.1 28.5 27.3 26.7 26.7 27.5 27.0 25.2 25.5 25.8 25.9 26.3 26.5 26.7
Asia 25.3 25.4 25.6 26.2 25.6 25.2 25.8 25.3 23.6 23.9 24.2 24.5 25.0 25.4 25.8Europe 35.1 34.4 34.4 33.4 33.8 33.8 35.2 35.1 34.3 34.1 34.0 33.8 33.9 33.8 33.7Latin America 30.1 29.8 28.9 26.4 26.8 27.2 27.1 27.2 25.8 25.6 26.1 26.2 26.4 26.5 26.4MENAP 36.3 35.3 32.5 27.1 24.1 25.8 28.6 27.2 23.8 25.1 25.4 25.2 25.1 25.0 24.9G20 Emerging 29.0 28.6 28.2 27.4 27.2 27.0 27.5 27.2 25.3 25.5 25.7 25.9 26.3 26.6 26.9
Algeria 39.1 35.8 33.3 30.5 28.6 32.0 33.4 32.2 30.3 25.6 26.5 26.3 26.0 26.0 25.9Angola 41.3 36.7 30.7 24.1 17.5 17.5 21.9 20.0 18.2 20.7 20.4 19.8 19.2 18.7 18.2Argentina 33.8 34.3 34.6 35.4 34.9 34.4 34.0 33.9 32.8 . . . . . . . . . . . . . . . . . .Belarus1 39.3 39.8 38.9 38.8 39.0 38.7 39.6 38.4 35.1 34.7 34.6 35.1 34.9 35.1 35.0Brazil 34.7 34.5 32.5 28.2 30.6 30.4 30.6 31.4 29.4 28.6 29.0 28.9 29.2 29.2 29.0Bulgaria 32.2 33.8 33.5 34.6 34.3 33.0 34.5 35.1 35.8 36.0 34.8 34.9 35.7 36.3 36.8Chile 23.8 22.6 22.3 22.8 22.6 22.8 24.0 23.6 21.8 24.9 24.5 24.4 25.0 25.0 25.0China 27.9 27.7 28.1 28.8 28.2 27.8 28.3 27.8 25.6 26.0 26.3 26.5 27.2 27.6 28.2Colombia 29.2 29.0 29.5 27.8 27.7 26.8 30.0 29.4 26.5 27.0 29.2 29.4 29.5 29.3 29.0Croatia 42.9 42.8 43.4 45.3 46.5 46.0 46.2 47.2 47.0 48.4 48.5 48.5 48.3 48.7 47.0Dominican Republic 13.6 14.2 14.2 16.6 13.9 14.0 14.2 14.4 14.0 14.2 14.2 14.3 14.4 14.4 14.4Ecuador2 39.3 39.2 38.4 33.6 30.3 32.0 35.3 33.2 30.5 32.9 35.6 35.6 35.5 35.4 35.4Egypt3 20.8 21.7 24.4 22.0 20.3 21.8 20.7 20.3 19.3 20.6 21.0 21.2 21.5 21.8 21.7Hungary 46.9 47.6 47.4 48.4 45.0 44.1 43.8 43.3 42.4 42.2 42.2 42.6 43.2 43.6 44.1India 19.8 19.6 19.1 19.9 20.1 19.9 20.0 19.6 18.7 19.3 19.6 19.7 19.9 20.1 20.2Indonesia 17.2 16.9 16.5 14.9 14.3 14.1 14.9 14.2 12.4 12.4 12.9 13.4 13.7 13.9 12.8Iran 13.5 13.4 14.0 15.7 16.7 16.9 15.4 10.4 9.6 10.1 10.3 10.5 10.7 10.9 11.1Kazakhstan 26.3 24.8 23.7 16.6 17.0 19.8 21.4 19.7 18.2 19.0 19.1 19.3 19.1 19.1 19.1Kuwait 71.2 72.3 66.6 60.0 54.1 57.7 58.4 57.9 56.5 51.0 53.2 52.4 51.0 49.8 48.9Lebanon 21.8 20.1 22.6 19.2 19.4 21.9 21.0 21.0 11.9 11.1 12.2 13.6 16.8 18.7 20.2Malaysia 25.4 24.3 23.3 22.2 20.1 19.5 20.2 21.3 20.4 19.4 19.8 19.8 19.8 19.8 19.8Mexico 24.5 24.1 23.4 23.5 24.6 24.6 23.5 23.6 24.6 23.3 23.4 23.1 23.1 23.1 22.9Morocco 28.0 27.8 28.0 26.1 26.1 26.6 26.1 25.6 28.7 25.3 26.6 26.8 27.1 27.4 27.7Oman 48.7 49.5 46.3 34.9 30.2 33.2 36.8 37.4 34.3 33.7 36.2 36.3 36.4 35.9 35.5Pakistan 13.0 13.5 15.2 14.5 15.5 15.5 15.2 13.0 15.1 15.8 17.0 17.5 17.6 17.6 17.6Peru 22.4 22.3 22.4 20.3 18.8 18.3 19.4 19.9 18.0 18.3 18.9 18.9 19.1 19.2 19.3Philippines 17.8 18.0 18.1 18.5 18.3 18.7 19.3 19.9 19.6 18.2 19.0 19.2 19.4 19.5 19.6Poland 39.3 38.7 39.0 39.0 38.7 39.8 41.3 41.0 40.7 40.4 41.2 40.9 40.9 41.0 40.9Qatar 41.5 49.9 47.7 60.3 35.3 32.2 34.8 37.5 35.6 33.7 37.4 36.6 35.2 34.2 33.6Romania 32.6 31.5 32.0 32.8 28.9 28.0 29.2 28.9 29.1 30.3 29.7 29.4 29.2 29.4 29.7Russia 34.4 33.5 33.9 31.9 32.9 33.4 35.5 35.8 34.7 34.7 34.1 34.0 34.0 33.9 33.7Saudi Arabia 45.2 41.2 36.7 25.0 21.5 24.1 30.7 31.2 29.2 29.0 28.9 28.9 28.9 28.9 29.0South Africa 26.9 27.3 27.6 28.2 28.6 28.2 29.1 29.7 27.9 27.5 28.4 28.7 28.8 28.8 28.8Sri Lanka 12.2 12.0 11.6 13.3 14.1 13.8 13.5 12.6 9.6 10.6 11.5 11.7 12.0 12.1 12.1Thailand 21.4 22.2 21.4 22.3 21.9 21.1 21.4 21.0 20.6 21.1 21.6 21.8 21.9 21.9 21.9Turkey 32.3 32.5 31.6 31.9 32.5 31.2 31.0 30.2 29.3 28.2 28.5 28.5 28.6 28.6 28.6Ukraine 44.7 43.3 40.3 41.9 38.3 39.3 39.6 39.4 41.0 38.5 37.4 37.1 36.8 36.5 36.3United Arab Emirates 38.1 38.7 35.0 29.0 28.9 28.6 30.8 30.8 24.6 29.5 28.9 28.6 28.4 28.2 28.1Uruguay4 25.6 27.2 26.6 26.6 27.1 27.5 28.8 28.2 28.4 28.2 28.0 28.1 28.1 28.2 28.2Venezuela 29.8 28.4 34.6 19.7 14.3 14.7 17.4 11.4 5.9 . . . . . . . . . . . . . . . . . .
Source: IMF staff estimates and projections. Projections are based on staff assessments of current policies (see “Fiscal Policy Assumptions” in text).Note: For country-specific details, see “Data and Conventions” in text, and Table C. MENAP = Middle East, North Africa, and Pakistan.1 For Belarus, the underlying assumption for IMF staff projections is no compensation for the loss of oil-related discounts and transfers as a result of internal changes in Russia’s taxation system. (Negotiations between Russia and Belarus on this issue are ongoing.)2 The data for Ecuador reflect net lending/borrowing for the nonfinancial public sector. Ecuadorian authorities, in the context of the Extended Fund Facility approved in March of 2019 and with the technical support from IMF staff, are revising the historical fiscal data for the net lending/borrowing of the nonfinancial public sector to correct recently identified statistical errors, mostly in the recording of revenues and expenditures of local governments. Fiscal data reported in the table for 2018 and 2019 reflect the corrected series, while data for earlier years are still under revisions and will be corrected in subsequent World Economic Outlook releases as far back as 2012. The authorities are also working on reconciling historical revenue and expenditure data with financing data.3 These numbers are based on the nominal GDP series before the recent revision; therefore, data in the tables are not comparable to the authorities’ numbers.4 Data are for the nonfinancial public sector, which includes central government, local government, social security funds, nonfinancial public corporations, and Banco de Seguros del Estado. The coverage of the fiscal data was changed from the consolidated public sector to the nonfinancial public sector with the October 2019 submission. With this narrower coverage, the central bank balances are not included in the fiscal data. Historical data were also revised accordingly. Starting in October 2018, the public pension system has been receiving transfers in the context of a new law that compensates persons affected by the creation of the mixed pension system. These funds are recorded as revenues, consistent with the IMF’s methodology. Therefore, data and projections for 2018–21 have been affected by these transfers, which amounted to 1.2 percent of GDP in 2018, 1.1 percent of GDP in 2019, and are projected to be 0.6 percent of GDP in 2020, 0.2 percent of GDP in 2021, and zero thereafter. See IMF country report No. 19/64 for further details. The disclaimer about the public pension system applies only to the revenues and net lending/borrowing series.
©International Monetary Fund. Not for Redistribution

80
F I S C A L M O N I T O R : A F A I R S H O T
International Monetary Fund | April 2021
Table A14. Emerging Market and Middle-Income Economies: General Government Expenditure, 2012–26(Percent of GDP)
2012 2013 2014 2015 2016 2017 2018 2019 2020 2021 2022 2023 2024 2025 2026Average 30.5 30.6 31.0 31.6 31.5 30.8 31.3 31.8 35.0 33.2 32.5 32.0 31.9 31.7 31.6
Asia 26.9 27.1 27.4 29.5 29.5 29.2 30.3 31.3 34.4 33.2 32.5 31.9 31.8 31.6 31.6Europe 35.9 36.0 35.9 36.1 36.6 35.5 34.9 35.9 40.2 37.6 36.7 36.6 36.5 36.3 36.2Latin America 32.9 32.9 33.9 32.9 32.8 32.6 32.2 31.2 34.6 31.3 30.6 30.4 30.4 30.2 30.0MENAP 31.5 32.7 34.4 34.9 33.8 31.3 31.4 31.1 33.7 30.7 29.9 29.5 29.2 28.8 28.5G20 Emerging 30.2 30.4 30.7 31.8 32.0 31.3 31.8 32.5 35.7 33.8 33.2 32.7 32.6 32.4 32.3
Algeria 43.5 36.2 40.6 45.8 41.7 38.6 37.8 37.8 38.0 39.2 38.3 38.2 38.3 38.4 38.8Angola 37.2 37.0 36.5 27.1 22.0 23.8 19.7 19.2 19.9 19.5 18.6 18.2 17.6 17.2 16.7Argentina 36.8 37.6 38.9 41.4 41.5 41.1 39.5 38.3 41.6 . . . . . . . . . . . . . . . . . .Belarus1 38.9 40.8 38.8 41.8 40.7 39.0 37.8 37.6 38.4 38.5 37.3 36.3 36.0 35.9 35.8Brazil 37.2 37.4 38.5 38.5 39.6 38.3 37.7 37.3 42.7 36.9 36.2 36.2 36.2 35.8 35.5Bulgaria 32.7 35.6 37.2 37.4 32.8 32.1 34.4 36.0 38.8 39.9 36.8 36.7 36.5 36.7 36.8Chile 23.1 23.1 23.8 24.9 25.3 25.4 25.4 26.3 29.0 27.2 27.4 26.5 26.4 25.7 25.7China 28.2 28.6 29.0 31.6 31.9 31.6 32.9 34.1 37.0 35.6 35.0 34.4 34.3 34.2 34.2Colombia 29.1 30.0 31.3 31.3 30.0 29.3 34.7 31.9 33.4 35.3 32.7 32.4 31.4 31.0 30.7Croatia 48.2 48.1 48.7 48.6 47.4 45.2 46.0 46.9 55.0 52.3 51.1 50.9 50.7 51.0 49.3Dominican Republic 20.1 17.7 17.0 16.7 17.0 17.1 16.3 16.3 21.5 17.6 16.7 16.6 16.7 16.7 16.8Ecuador2 40.3 43.7 43.6 39.7 38.6 36.5 38.5 36.4 36.9 35.3 34.7 33.9 33.4 33.2 33.2Egypt3 30.8 34.6 35.7 33.0 32.7 32.2 30.1 28.3 27.2 27.9 26.9 26.8 26.3 26.3 25.9Hungary 49.2 50.2 50.1 50.4 46.8 46.5 45.9 45.3 50.9 48.6 47.0 46.2 45.5 45.0 44.7India 27.4 26.6 26.2 27.1 27.2 26.2 26.3 27.1 31.0 29.2 28.6 28.2 28.0 27.8 27.7Indonesia 18.8 19.1 18.6 17.5 16.8 16.6 16.6 16.4 18.2 18.5 17.3 16.4 16.3 16.2 15.0Iran 14.2 14.2 15.1 17.3 18.7 18.7 17.2 15.5 18.0 17.0 18.0 19.0 19.9 20.8 21.8Kazakhstan 21.9 19.8 21.3 22.9 21.5 24.1 18.8 20.2 25.5 22.0 20.6 20.1 19.9 19.9 19.9Kuwait 38.8 38.1 44.3 54.4 53.8 51.4 49.4 53.5 65.9 57.8 57.7 57.0 56.0 54.7 52.9Lebanon 30.2 28.9 28.8 26.7 28.3 30.5 32.3 31.5 21.8 23.0 25.8 22.5 22.6 22.3 22.5Malaysia 28.5 27.8 26.0 24.7 22.7 21.9 22.8 23.5 25.4 23.0 23.2 22.9 22.8 22.7 22.7Mexico 28.2 27.8 28.0 27.5 27.4 25.7 25.7 26.0 29.1 26.7 26.0 25.7 25.6 25.6 25.4Morocco 35.2 32.9 32.9 30.7 30.5 30.1 29.9 29.7 36.3 31.8 32.5 32.0 31.6 31.2 31.1Oman 44.1 44.9 47.4 50.9 51.2 45.8 45.1 44.1 51.6 38.1 37.7 37.8 36.6 35.8 35.2Pakistan 21.7 21.8 20.1 19.8 19.9 21.3 21.6 22.0 23.1 22.9 22.5 21.4 21.5 21.1 20.5Peru 20.3 21.6 22.6 22.4 21.0 21.2 21.4 21.3 26.4 23.1 22.0 21.4 21.1 20.9 20.7Philippines 18.1 17.9 17.3 17.9 18.7 19.1 20.9 21.7 25.1 25.6 24.5 23.7 23.0 22.4 21.8Poland 43.0 42.9 42.6 41.7 41.1 41.2 41.5 41.8 48.9 45.2 43.7 43.8 43.8 43.8 43.7Qatar 31.0 28.3 32.3 38.6 40.1 34.7 28.9 32.6 34.3 32.4 30.1 29.5 28.7 27.7 26.8Romania 35.1 34.0 33.7 34.2 31.3 30.8 32.0 33.5 38.8 37.5 36.0 35.6 35.3 35.3 35.6Russia 34.0 34.7 34.9 35.3 36.6 34.8 32.6 33.9 38.8 35.5 34.5 34.5 34.5 33.9 33.7Saudi Arabia 33.2 35.5 40.2 40.8 38.7 33.3 36.6 35.6 40.3 32.7 31.4 30.9 30.3 29.8 29.2South Africa 31.4 31.6 31.9 32.9 32.7 32.6 33.2 35.0 40.1 38.1 36.6 35.8 35.5 35.5 35.6Sri Lanka 17.8 17.2 17.9 20.4 19.5 19.3 18.8 20.8 21.5 21.2 21.2 20.4 20.3 20.0 19.8Thailand 22.3 21.6 22.2 22.2 21.3 21.5 21.4 21.8 25.3 25.9 23.1 23.2 23.2 23.1 23.1Turkey 34.2 33.9 33.1 33.2 34.8 33.4 34.6 35.8 34.6 34.0 34.5 34.6 34.6 34.6 34.7Ukraine 49.0 48.1 44.8 43.0 40.6 41.5 41.7 41.4 47.1 43.7 40.9 39.5 39.2 38.9 38.7United Arab Emirates 29.1 30.3 33.1 32.4 31.7 30.2 28.9 30.2 32.0 30.8 30.0 29.5 29.0 28.5 28.1Uruguay4 27.8 28.9 29.2 28.5 29.8 30.1 30.7 30.9 33.3 31.7 31.2 30.8 30.6 30.6 30.6Venezuela 40.3 39.7 50.1 30.3 25.2 37.7 48.4 21.4 10.9 . . . . . . . . . . . . . . . . . .
Source: IMF staff estimates and projections. Projections are based on staff assessments of current policies (see “Fiscal Policy Assumptions” in text).Note: For country-specific details, see “Data and Conventions” in text, and Table C. MENAP = Middle East, North Africa, and Pakistan.1 For Belarus, the underlying assumption for IMF staff projections is no compensation for the loss of oil-related discounts and transfers as a result of internal changes in Russia’s taxation system. (Negotiations between Russia and Belarus on this issue are ongoing.)2 The data for Ecuador reflect net lending/borrowing for the nonfinancial public sector. Ecuadorian authorities, in the context of the Extended Fund Facility approved in March of 2019 and with the technical support from IMF staff, are revising the historical fiscal data for the net lending/borrowing of the nonfinancial public sector to correct recently identified statistical errors, mostly in the recording of revenues and expenditures of local governments. Fiscal data reported in the table for 2018 and 2019 reflect the corrected series, while data for earlier years are still under revisions and will be corrected in subsequent World Economic Outlook releases as far back as 2012. The authorities are also working on reconciling historical revenue and expenditure data with financing data.3 These numbers are based on the nominal GDP series before the recent revision; therefore, data in the tables are not comparable to the authorities’ numbers.4 Data are for the nonfinancial public sector, which includes central government, local government, social security funds, nonfinancial public corporations, and Banco de Seguros del Estado. The coverage of fiscal data was changed from the consolidated public sector to the nonfinancial public sector with the October 2019 submission. With this narrower coverage, the central bank balances are not included in the fiscal data. Historical data were also revised accordingly.
©International Monetary Fund. Not for Redistribution

81International Monetary Fund | April 2021
M E T H O D O L O G I C A L A N D S T A T I S T I C A L A P P E N D I X
Table A15. Emerging Market and Middle-Income Economies: General Government Gross Debt, 2012–26(Percent of GDP)
2012 2013 2014 2015 2016 2017 2018 2019 2020 2021 2022 2023 2024 2025 2026Average 37.1 38.3 40.4 43.6 48.4 50.5 52.4 54.7 64.4 65.1 67.3 69.2 70.8 72.2 73.2
Asia 39.6 41.3 43.4 44.9 50.0 52.8 54.4 57.3 67.6 69.9 73.0 75.6 77.8 79.8 81.4Europe 25.7 26.6 28.9 31.1 32.0 30.1 29.7 29.2 37.6 36.9 37.2 37.7 38.2 38.4 38.8Latin America 46.8 47.4 49.5 53.0 56.4 61.1 67.5 68.4 77.7 75.9 76.0 76.3 76.5 76.2 75.8MENAP 26.6 26.8 26.8 34.4 44.8 44.3 44.1 49.0 56.6 53.7 54.4 55.1 55.7 55.9 55.4G20 Emerging 37.4 38.6 41.0 44.0 48.8 51.5 53.3 55.8 65.6 66.7 69.4 71.8 73.9 75.7 77.2
Algeria 9.3 7.6 7.7 8.7 20.5 26.8 37.8 45.8 53.1 63.3 73.9 84.4 94.3 102.9 110.7Angola 26.7 33.1 39.8 57.1 75.7 69.3 89.0 107.1 127.1 110.7 99.6 91.4 82.4 74.2 67.2Argentina 40.4 43.5 44.7 52.6 53.1 57.0 86.4 90.2 103.0 . . . . . . . . . . . . . . . . . .Belarus1 36.9 36.9 38.8 53.0 53.5 53.2 47.5 41.0 48.0 45.7 46.8 44.6 44.4 42.9 42.6Brazil2 62.2 60.2 62.3 72.6 78.3 83.6 85.6 87.7 98.9 98.4 98.8 100.1 101.0 101.4 101.7Bulgaria 16.6 17.2 26.3 25.4 27.1 23.0 20.1 18.4 23.8 25.5 26.6 27.3 26.6 25.5 24.2Chile 11.9 12.7 15.0 17.3 21.0 23.6 25.6 28.2 32.5 33.6 36.8 39.6 41.3 41.8 41.4China 34.4 37.0 40.0 41.5 48.2 51.7 53.8 57.1 66.8 69.6 73.7 77.3 80.4 83.3 86.0Colombia 34.0 37.6 43.3 50.4 49.8 49.4 53.6 52.3 62.8 64.2 64.3 63.5 61.4 59.3 57.2Croatia 70.0 81.0 84.7 84.3 80.8 77.5 74.2 72.8 87.2 86.3 83.3 80.2 77.7 74.4 72.8Dominican Republic 42.3 46.7 44.9 44.9 46.6 48.8 50.4 53.5 69.4 66.6 65.4 64.1 62.9 61.7 60.6Ecuador3 17.5 20.0 27.1 33.8 43.2 44.6 46.1 51.5 64.6 65.1 64.1 61.2 59.5 56.0 51.9Egypt4 73.8 84.0 85.1 88.3 96.8 103.0 92.5 84.2 90.2 92.9 88.9 86.9 82.9 78.8 73.4Hungary 78.4 77.4 76.7 75.8 74.9 72.2 69.1 65.3 81.2 80.0 78.3 76.9 74.7 72.1 68.9India 67.7 67.4 66.8 68.8 68.7 69.5 70.2 73.9 89.6 86.6 86.3 85.7 84.8 83.8 82.6Indonesia 23.0 24.8 24.7 27.0 28.0 29.4 30.4 30.6 36.6 41.4 42.8 42.9 42.7 42.2 39.0Iran 11.7 10.3 11.0 14.0 44.6 36.9 38.5 47.9 42.8 36.6 36.2 37.2 38.6 40.4 42.5Kazakhstan 12.1 12.6 14.5 21.9 19.7 19.9 20.3 19.9 27.4 27.0 28.5 29.5 30.9 32.1 33.3Kuwait 3.6 3.1 3.4 4.7 10.0 20.5 14.8 11.8 11.5 13.7 27.3 44.1 58.3 71.1 82.1Lebanon 131.0 135.3 138.3 140.8 146.2 149.7 154.9 174.3 154.4 93.1 89.4 91.7 91.2 88.8 85.2Malaysia 53.8 55.7 55.4 57.0 55.8 54.4 55.7 57.2 67.5 67.0 67.4 67.1 66.9 66.8 66.6Mexico 42.7 45.9 48.9 52.8 56.7 54.0 53.6 53.3 60.6 60.5 60.5 60.7 60.7 60.7 60.8Morocco 56.5 61.7 63.3 63.7 64.9 65.1 65.2 65.2 76.1 77.1 77.4 77.3 77.2 76.7 76.1Oman 5.6 5.5 5.4 15.5 30.3 44.8 51.4 60.0 81.1 71.3 66.8 65.6 63.5 61.2 58.5Pakistan 63.4 64.5 63.5 63.3 67.6 67.1 72.1 85.6 87.2 87.7 83.3 77.7 73.6 69.5 65.5Peru 21.2 20.0 20.6 24.1 24.4 25.4 26.2 27.1 35.4 35.4 36.2 36.7 37.2 37.5 37.4Philippines 45.7 43.8 40.2 39.6 37.3 38.1 37.1 37.0 47.1 51.9 54.4 55.4 55.3 54.5 52.8Poland 54.3 56.4 51.1 51.3 54.2 50.6 48.8 45.7 57.7 57.4 56.1 55.4 55.3 55.4 55.4Qatar 32.1 30.9 24.9 35.5 46.7 51.6 52.2 62.3 71.8 59.8 53.9 49.2 46.7 43.9 40.7Romania 38.0 39.1 40.4 39.4 39.0 36.8 36.5 36.8 50.1 52.6 55.0 57.6 60.1 62.3 64.5Russia 11.2 12.3 15.1 15.3 14.8 14.3 13.6 13.8 19.3 18.1 17.7 17.6 17.7 17.3 17.4Saudi Arabia 3.0 2.1 1.6 5.8 13.1 17.2 19.0 22.8 32.4 31.0 31.7 31.1 32.2 32.4 31.2South Africa 41.0 44.1 47.0 49.3 51.5 53.0 56.7 62.2 77.1 80.8 84.4 87.2 89.9 92.5 94.9Sri Lanka 69.6 71.8 72.2 78.5 79.0 77.9 84.2 86.8 100.1 105.4 107.7 107.8 107.4 106.7 106.1Thailand 41.9 42.2 43.3 42.6 41.7 41.8 42.0 41.0 49.6 55.9 54.7 54.2 53.8 52.7 51.4Turkey 32.4 31.2 28.5 27.4 28.0 28.0 30.2 32.6 36.8 37.1 38.8 40.3 41.8 42.6 43.5Ukraine 37.5 40.5 70.3 79.5 81.2 71.6 60.3 48.8 60.7 58.1 54.4 51.6 48.6 46.5 45.3United Arab Emirates 21.2 16.0 14.2 16.7 19.4 21.6 20.9 26.8 38.3 37.1 39.2 40.0 40.2 39.9 39.2Uruguay5 50.0 50.3 51.4 58.2 56.8 56.5 58.6 60.2 66.3 68.0 67.9 68.1 68.4 68.2 68.1Venezuela 30.1 33.2 25.1 11.0 5.1 26.0 180.8 232.8 304.1 . . . . . . . . . . . . . . . . . .
Source: IMF staff estimates and projections. Projections are based on staff assessments of current policies (see “Fiscal Policy Assumptions” in text).Note: For country-specific details, see “Data and Conventions” in text, and Table C. MENAP = Middle East, North Africa, and Pakistan.1 For Belarus, the underlying assumption for IMF staff projections is no compensation for the loss of oil-related discounts and transfers as a result of internal changes in Russia’s taxation system. (Negotiations between Russia and Belarus on this issue are ongoing.)2 “Gross debt” refers to the nonfinancial public sector, excluding Eletrobras and Petrobras and including sovereign debt held on the balance sheet of the central bank. 3 In late 2016, the authorities changed the definition of “debt” to a consolidated basis, which in 2016 was 11.5 percent of GDP lower than the previous aggregate definition. Both the historic and projection numbers are now presented on a consolidated basis. 4 These numbers are based on the nominal GDP series before the recent revision; therefore, data in the tables are not comparable to the authorities’ numbers.5 Data are for the nonfinancial public sector, which includes central government, local government, social security funds, nonfinancial public corporations, and Banco de Seguros del Estado. The coverage of fiscal data was changed from the consolidated public sector to the nonfinancial public sector with the October 2019 submission. With this narrower coverage, the central bank balances are not included in the fiscal data. Historical data were also revised accordingly.
©International Monetary Fund. Not for Redistribution

82
F I S C A L M O N I T O R : A F A I R S H O T
International Monetary Fund | April 2021
Table A16. Emerging Market and Middle-Income Economies: General Government Net Debt, 2012–26(Percent of GDP)
2012 2013 2014 2015 2016 2017 2018 2019 2020 2021 2022 2023 2024 2025 2026Average 23.2 23.4 24.9 28.3 35.0 36.1 37.0 38.7 46.0 47.7 49.1 50.3 51.2 51.6 51.3
Asia . . . . . . . . . . . . . . . . . . . . . . . . . . . . . . . . . . . . . . . . . . . . .Europe 31.8 31.7 30.3 29.5 31.5 30.3 30.5 29.3 38.9 39.9 40.7 41.4 42.2 42.7 43.0Latin America 29.1 29.1 31.7 34.9 40.3 42.5 42.9 44.1 51.5 53.7 55.3 57.1 58.5 59.3 60.0MENAP 1.2 0.7 3.8 14.9 32.2 32.3 34.6 40.5 46.7 46.4 47.5 49.0 49.4 49.4 48.3G20 Emerging 21.9 21.7 23.2 26.1 32.1 35.1 36.2 37.7 44.7 47.5 49.6 51.2 52.6 53.3 53.4
Algeria –29.0 –29.5 –21.8 –7.6 13.3 21.3 25.2 30.2 50.4 60.5 71.0 81.4 91.1 99.6 107.2Angola . . . . . . . . . . . . . . . . . . . . . . . . . . . . . . . . . . . . . . . . . . . . .Argentina . . . . . . . . . . . . . . . . . . . . . . . . . . . . . . . . . . . . . . . . . . . . .Belarus . . . . . . . . . . . . . . . . . . . . . . . . . . . . . . . . . . . . . . . . . . . . .Brazil 32.2 30.5 32.6 35.6 46.1 51.4 52.8 54.6 62.7 68.3 71.0 74.3 77.0 78.7 80.5Bulgaria 4.5 6.5 13.2 15.5 11.3 10.4 9.0 8.0 13.3 15.5 17.2 18.3 18.0 17.2 16.2Chile –6.8 –5.6 –4.4 –3.4 0.9 4.4 5.7 8.2 8.7 10.8 13.5 15.5 16.4 16.9 17.3China . . . . . . . . . . . . . . . . . . . . . . . . . . . . . . . . . . . . . . . . . . . . .Colombia 24.8 26.9 32.9 42.1 38.6 38.6 43.1 43.0 55.8 59.0 59.1 58.9 57.7 56.4 55.2Croatia 58.3 65.6 69.7 71.0 68.7 65.6 62.4 . . . . . . . . . . . . . . . . . . . . . . . .Dominican Republic 36.3 39.1 37.5 37.4 38.5 40.3 41.4 43.4 55.2 52.7 51.5 50.2 49.0 47.8 46.7Ecuador . . . . . . . . . . . . . . . . . . . . . . . . . . . . . . . . . . . . . . . . . . . . .Egypt1 63.5 73.7 77.1 78.8 88.2 93.9 81.3 74.2 79.5 83.2 81.0 82.6 79.1 75.3 66.7Hungary 70.7 71.1 70.4 70.6 68.0 65.2 62.2 58.4 74.2 73.1 71.3 69.9 67.7 65.2 61.9India . . . . . . . . . . . . . . . . . . . . . . . . . . . . . . . . . . . . . . . . . . . . .Indonesia 18.6 20.6 20.4 22.0 23.5 25.3 26.7 27.0 33.0 38.0 39.7 40.0 40.0 39.8 36.7Iran 1.0 –5.9 –6.1 –2.4 32.0 23.7 25.6 38.2 35.7 31.7 32.4 34.2 36.3 38.5 41.0Kazakhstan –15.9 –17.6 –19.1 –30.8 –23.8 –15.8 –15.8 –13.9 –8.9 –4.7 –3.6 –3.1 –2.6 –2.2 –1.8Kuwait . . . . . . . . . . . . . . . . . . . . . . . . . . . . . . . . . . . . . . . . . . . . .Lebanon 123.7 126.0 129.9 134.4 140.5 144.1 150.6 169.1 150.0 93.1 89.4 91.7 91.2 88.8 85.2Malaysia . . . . . . . . . . . . . . . . . . . . . . . . . . . . . . . . . . . . . . . . . . . . .Mexico 37.2 40.0 42.6 46.5 48.7 45.7 44.9 44.5 52.3 52.2 52.1 52.3 52.4 52.4 52.5Morocco 56.0 61.2 62.8 63.1 64.4 64.8 64.9 64.9 75.4 76.5 76.7 76.6 76.5 76.1 75.4Oman –14.9 –28.3 –27.2 –22.8 –3.4 11.8 30.3 36.3 56.1 50.7 48.1 48.1 46.9 45.6 44.0Pakistan 59.4 60.7 58.1 58.2 61.3 61.5 66.5 77.2 79.6 80.7 77.3 72.4 68.8 65.2 61.6Peru 2.8 1.5 2.7 5.3 6.9 8.7 10.2 11.2 20.5 22.7 24.3 25.3 26.1 26.6 26.7Philippines . . . . . . . . . . . . . . . . . . . . . . . . . . . . . . . . . . . . . . . . . . . . .Poland 48.4 51.5 45.2 46.5 48.0 44.7 42.3 39.2 51.2 50.9 49.6 48.9 48.8 48.9 48.9Qatar . . . . . . . . . . . . . . . . . . . . . . . . . . . . . . . . . . . . . . . . . . . . .Romania 29.1 29.6 29.7 29.7 27.8 28.2 28.0 28.5 40.4 43.3 45.9 48.6 51.3 53.7 56.0Russia . . . . . . . . . . . . . . . . . . . . . . . . . . . . . . . . . . . . . . . . . . . . .Saudi Arabia –47.1 –50.9 –47.1 –35.9 –17.1 –7.7 –0.1 5.0 15.8 17.6 19.6 20.9 21.5 21.7 20.9South Africa 34.8 37.9 41.4 44.8 45.9 47.8 51.3 56.1 70.2 76.9 81.4 84.7 87.8 90.8 93.5Sri Lanka . . . . . . . . . . . . . . . . . . . . . . . . . . . . . . . . . . . . . . . . . . . . .Thailand . . . . . . . . . . . . . . . . . . . . . . . . . . . . . . . . . . . . . . . . . . . . .Turkey 27.3 25.8 23.7 22.8 23.3 22.1 23.9 25.7 32.3 33.5 35.7 37.7 39.5 40.8 42.0Ukraine . . . . . . . . . . . . . . . . . . . . . . . . . . . . . . . . . . . . . . . . . . . . .United Arab Emirates . . . . . . . . . . . . . . . . . . . . . . . . . . . . . . . . . . . . . . . . . . . . .Uruguay2 38.1 39.7 41.6 45.6 45.6 45.7 47.9 51.0 57.1 59.0 59.0 59.3 59.6 59.6 59.6Venezuela . . . . . . . . . . . . . . . . . . . . . . . . . . . . . . . . . . . . . . . . . . . . .
Source: IMF staff estimates and projections. Projections are based on staff assessments of current policies (see “Fiscal Policy Assumptions” in text).Note: For country-specific details, see “Data and Conventions” in text, and Table C. MENAP = Middle East, North Africa, and Pakistan.1 These numbers are based on the nominal GDP series before the recent revision; therefore, data in the tables are not comparable to the authorities’ numbers.2 Data are for the nonfinancial public sector, which includes central government, local government, social security funds, nonfinancial public corporations, and Banco de Seguros del Estado. The coverage of fiscal data was changed from the consolidated public sector to the nonfinancial public sector with the October 2019 submission. With this narrower coverage, the central bank balances are not included in the fiscal data. Historical data were also revised accordingly.
©International Monetary Fund. Not for Redistribution

83International Monetary Fund | April 2021
M E T H O D O L O G I C A L A N D S T A T I S T I C A L A P P E N D I X
Table A17. Low-Income Developing Countries: General Government Overall Balance, 2012–26(Percent of GDP)
2012 2013 2014 2015 2016 2017 2018 2019 2020 2021 2022 2023 2024 2025 2026Average –2.2 –3.4 –3.3 –4.0 –3.8 –3.5 –3.4 –3.9 –5.5 –4.9 –4.4 –4.0 –3.8 –3.7 –3.7
Oil Producers –0.4 –3.0 –2.9 –4.6 –5.3 –5.4 –4.1 –4.5 –5.7 –4.2 –4.5 –4.4 –4.7 –5.0 –5.4Asia –3.9 –4.2 –3.7 –4.1 –3.3 –2.7 –2.9 –4.1 –5.4 –5.6 –5.1 –4.7 –4.5 –4.2 –4.0Latin America –2.4 –3.9 –2.7 –1.2 –0.6 –0.6 –1.0 –0.5 –3.6 –3.2 –2.1 –2.1 –2.2 –2.2 –2.2Sub-Saharan Africa –1.6 –3.2 –3.4 –4.2 –4.6 –4.4 –3.9 –4.1 –5.8 –4.7 –4.2 –3.7 –3.6 –3.7 –3.7Others –1.1 –2.3 –1.8 –3.2 –2.6 –2.4 –2.2 –3.1 –4.5 –3.8 –3.0 –2.9 –2.8 –2.4 –2.2
Afghanistan 0.2 –0.6 –1.7 –1.4 0.1 –0.7 1.6 –1.1 –2.5 –2.5 –1.5 –0.7 –0.7 –0.9 –1.0Bangladesh –3.0 –3.4 –3.1 –4.0 –3.4 –3.3 –4.6 –5.4 –5.5 –6.0 –5.5 –5.0 –5.0 –5.0 –5.0Benin –0.2 –1.4 –1.7 –5.6 –4.3 –4.2 –3.0 –0.5 –4.9 –4.5 –3.0 –2.5 –2.0 –2.0 –1.5Burkina Faso –2.8 –3.5 –1.7 –2.1 –3.1 –6.9 –4.4 –3.5 –5.2 –5.6 –4.8 –4.0 –3.0 –3.0 –3.0Cambodia –4.5 –2.6 –1.6 –0.6 –0.3 –0.8 0.7 3.0 –1.7 –3.4 –4.2 –4.9 –5.6 –5.5 –5.3Cameroon –1.4 –3.7 –4.3 –4.4 –6.1 –4.9 –2.5 –3.3 –4.1 –2.6 –1.9 –1.2 –1.2 –1.0 –1.1Chad 0.5 –2.1 –4.2 –4.4 –1.9 –0.2 1.9 –0.2 1.6 –0.8 0.7 –0.1 0.4 2.2 1.9Congo, Democratic Republic of the 1.8 1.9 0.0 –0.4 –0.5 1.4 0.0 –1.9 –1.6 –0.9 –0.4 –0.5 –1.0 –0.9 –0.8Congo, Republic of 7.2 –2.8 –10.7 –17.8 –15.6 –5.9 5.8 4.8 1.5 2.4 1.3 3.6 3.8 3.4 3.6Côte d’Ivoire –2.3 –1.6 –1.6 –2.0 –3.0 –3.3 –2.9 –2.3 –5.9 –4.6 –3.6 –3.1 –3.1 –3.1 –3.1Ethiopia –1.2 –1.9 –2.6 –1.9 –2.3 –3.2 –3.0 –2.5 –2.8 –3.3 –2.2 –1.9 –1.9 –1.7 –2.1Ghana –8.4 –9.2 –8.0 –4.1 –6.9 –4.1 –7.0 –7.3 –16.0 –12.6 –10.4 –9.3 –9.1 –8.9 –6.8Guinea –2.5 –3.9 –3.2 –6.9 –0.1 –2.1 –1.1 –0.5 –3.6 –2.3 –2.3 –2.3 –2.1 –2.3 –2.4Haiti –2.7 –4.1 –3.7 –1.5 0.0 0.0 –1.0 –1.4 –2.3 –2.9 –2.7 –2.2 –2.2 –2.1 –2.2Honduras –3.5 –5.7 –2.9 –0.8 –0.4 –0.4 0.2 0.1 –4.5 –3.4 –2.1 –2.5 –2.3 –2.1 –2.0Kenya –5.0 –5.7 –7.4 –8.1 –8.5 –7.8 –7.4 –7.7 –8.4 –8.1 –6.6 –5.1 –4.0 –3.2 –2.5Kyrgyz Republic –5.9 –3.7 –3.1 –2.5 –5.8 –3.7 –0.6 –0.1 –6.8 –4.8 –4.0 –3.0 –3.0 –3.0 –3.0Lao P.D.R. –2.3 –4.0 –3.1 –5.6 –5.1 –5.5 –4.7 –5.0 –6.5 –5.6 –5.3 –4.9 –4.5 –4.1 –3.8Madagascar –2.2 –3.4 –2.0 –2.9 –1.1 –2.1 –1.3 –1.4 –4.2 –5.8 –4.8 –4.3 –3.7 –3.2 –2.9Malawi –2.0 –5.2 –4.3 –5.9 –6.9 –7.4 –6.2 –6.5 –13.2 –12.5 –9.5 –8.0 –7.2 –5.9 –4.4Mali –1.0 –2.4 –2.9 –1.8 –3.9 –2.9 –4.7 –1.7 –5.5 –5.5 –4.5 –3.5 –3.0 –3.0 –3.0Moldova –1.9 –1.6 –1.6 –1.9 –1.5 –0.6 –0.8 –1.4 –5.3 –5.5 –3.8 –3.2 –2.9 –2.9 –2.9Mozambique –3.6 –2.6 –10.3 –6.7 –5.5 –2.9 –6.8 –0.1 –5.4 –4.1 –1.9 –1.1 –0.7 –0.4 –0.2Myanmar –2.6 –1.7 –1.3 –2.8 –3.9 –2.9 –3.4 –3.9 –5.6 –6.8 –6.3 –5.6 –5.4 –4.8 –4.3Nepal –1.2 1.6 1.3 0.6 1.2 –2.7 –5.8 –5.0 –5.1 –9.0 –6.9 –5.7 –4.0 –3.0 –3.0Nicaragua –0.1 –0.7 –1.2 –1.4 –1.7 –1.6 –3.0 –0.5 –3.5 –3.6 –1.2 –0.8 –2.1 –2.7 –2.6Niger –0.8 –1.9 –6.1 –6.7 –4.5 –4.1 –3.0 –3.6 –5.8 –4.4 –3.4 –2.4 –2.5 –2.5 –2.5Nigeria –0.1 –2.7 –2.4 –3.8 –4.6 –5.4 –4.3 –4.8 –5.8 –4.2 –4.6 –4.4 –4.7 –5.1 –5.6Papua New Guinea –1.2 –6.9 –6.3 –4.5 –4.7 –2.5 –2.6 –4.4 –6.2 –5.3 –2.8 –2.0 –1.4 –1.0 –0.6Rwanda –2.4 –1.3 –3.9 –2.7 –2.3 –2.5 –2.6 –5.2 –5.4 –4.0 –4.3 –2.6 –1.5 –1.0 –1.1Senegal –4.2 –4.3 –3.9 –3.7 –3.3 –3.0 –3.7 –3.9 –6.4 –4.9 –3.9 –3.0 –3.0 –3.0 –3.0Sudan –7.4 –5.8 –4.7 –3.9 –3.9 –6.2 –7.9 –10.8 –5.9 –3.1 –2.5 –2.4 –2.5 –2.6 –2.5Tajikistan 0.6 –0.9 –0.1 –2.0 –9.0 –6.0 –2.8 –2.1 –4.4 –4.5 –2.5 –2.5 –2.5 –2.5 –2.5Tanzania –4.1 –3.8 –2.9 –3.2 –2.1 –1.2 –1.9 –1.7 –1.0 –1.3 –1.7 –2.0 –2.1 –2.0 –2.1Uganda –2.4 –3.2 –2.7 –2.5 –3.5 –2.7 –3.0 –4.8 –7.6 –5.5 –4.3 –4.0 –3.4 –2.8 –1.9Uzbekistan 6.2 2.3 2.1 –0.3 0.8 1.3 1.7 –0.3 –3.3 –3.5 –2.8 –2.2 –1.8 –1.2 –1.3Vietnam –5.5 –6.0 –5.0 –5.0 –3.2 –2.0 –1.0 –3.3 –5.4 –4.7 –4.4 –4.0 –3.7 –3.3 –3.0Yemen –6.3 –6.9 –4.1 –8.7 –8.5 –4.9 –7.8 –5.3 –9.6 –6.1 –6.2 –8.0 –8.7 –7.0 –5.6Zambia –2.8 –6.2 –5.8 –9.5 –6.1 –7.6 –8.4 –9.8 –13.9 –9.3 –6.9 –4.0 –1.3 1.6 4.1Zimbabwe 0.0 –1.3 –1.1 –1.8 –6.5 –8.3 –4.7 –1.4 1.1 –0.8 –0.8 –0.8 –0.5 –0.5 –0.4
Source: IMF staff estimates and projections. Projections are based on staff assessments of current policies (see “Fiscal Policy Assumptions” in text).Note: For country-specific details, see “Data and Conventions” in text, and Table D.
©International Monetary Fund. Not for Redistribution

84
F I S C A L M O N I T O R : A F A I R S H O T
International Monetary Fund | April 2021
Table A18. Low-Income Developing Countries: General Government Primary Balance, 2012–26(Percent of GDP)
2012 2013 2014 2015 2016 2017 2018 2019 2020 2021 2022 2023 2024 2025 2026Average –1.1 –2.2 –2.0 –2.6 –2.4 –2.1 –1.7 –2.3 –3.7 –3.2 –2.6 –2.1 –1.9 –1.7 –1.6
Oil Producers 0.9 –1.7 –1.6 –3.0 –3.7 –4.1 –2.5 –2.9 –3.7 –2.7 –3.0 –2.8 –2.8 –2.8 –2.9Asia –2.7 –2.8 –2.2 –2.5 –1.7 –1.2 –1.3 –2.6 –3.7 –3.9 –3.4 –2.9 –2.6 –2.3 –2.0Latin America –2.2 –3.7 –2.5 –0.7 –0.1 0.0 –0.4 0.3 –2.8 –2.7 –1.5 –1.3 –1.5 –1.5 –1.3Sub-Saharan Africa –0.6 –2.1 –2.2 –2.9 –3.0 –2.7 –2.0 –2.1 –3.6 –2.6 –2.0 –1.6 –1.4 –1.4 –1.3Others 0.2 –1.1 –0.5 –1.9 –1.7 –2.2 –2.1 –2.8 –4.2 –3.5 –2.8 –2.4 –2.1 –1.5 –1.3
Afghanistan 0.3 –0.5 –1.7 –1.3 0.2 –0.6 1.7 –1.0 –2.4 –2.5 –1.5 –0.7 –0.6 –0.8 –0.8Bangladesh –1.1 –1.4 –1.0 –1.9 –1.5 –1.6 –2.8 –3.5 –3.4 –3.8 –3.2 –2.5 –2.6 –2.5 –2.4Benin 0.2 –1.0 –1.4 –5.0 –3.4 –2.8 –1.4 1.1 –2.8 –2.1 –0.8 –0.4 0.0 –0.1 0.5Burkina Faso –2.1 –3.0 –1.1 –1.5 –2.2 –6.0 –3.3 –2.2 –4.0 –3.9 –3.2 –2.2 –1.1 –1.1 –1.1Cambodia –4.2 –2.3 –1.3 –0.3 0.1 –0.5 1.0 3.3 –1.3 –3.0 –3.8 –4.5 –5.1 –5.0 –4.8Cameroon –1.1 –3.3 –3.9 –4.0 –5.3 –4.0 –1.6 –2.3 –3.2 –1.5 –0.9 –0.3 –0.5 –0.3 –0.5Chad 0.9 –1.5 –3.6 –2.7 0.1 1.3 3.0 0.8 2.5 0.0 1.5 0.6 1.1 2.8 2.4Congo, Democratic Republic of the 2.3 2.4 0.3 –0.1 –0.2 1.6 0.4 –1.7 –1.3 –0.7 –0.1 –0.3 –0.6 –0.6 –0.5Congo, Republic of 7.2 –2.7 –10.6 –17.2 –13.7 –4.3 7.7 8.0 2.9 4.5 3.3 5.4 5.4 5.0 5.2Côte d’Ivoire –1.0 –0.6 –0.7 –0.9 –1.7 –2.1 –1.6 –0.8 –3.9 –2.6 –1.9 –1.3 –1.3 –1.3 –1.4Ethiopia –0.9 –1.6 –2.2 –1.5 –1.8 –2.8 –2.5 –2.0 –2.4 –2.7 –1.4 –0.9 –0.8 –0.2 –0.2Ghana –5.8 –5.6 –3.4 1.0 –1.5 1.2 –1.4 –1.7 –9.2 –5.4 –1.6 –0.9 –0.4 –0.3 1.4Guinea –1.2 –3.0 –2.2 –6.1 0.9 –1.1 –0.3 0.0 –2.7 –1.4 –1.3 –1.4 –1.2 –1.3 –1.4Haiti –2.5 –3.9 –3.5 –1.4 0.2 0.2 –0.9 –1.1 –2.0 –2.6 –2.5 –2.0 –2.0 –2.0 –2.0Honduras –3.6 –5.6 –2.6 0.0 0.2 0.2 0.8 0.8 –3.7 –2.7 –1.2 –1.5 –1.3 –1.2 –1.0Kenya –2.9 –3.3 –4.8 –5.3 –5.3 –4.5 –3.7 –3.9 –4.5 –4.0 –2.3 –0.7 0.1 0.7 1.1Kyrgyz Republic –4.9 –2.9 –2.3 –1.7 –4.9 –2.9 0.4 0.8 –5.8 –3.4 –2.5 –1.5 –1.5 –1.4 –1.4Lao P.D.R. –1.7 –3.2 –2.4 –4.8 –4.2 –4.6 –3.5 –3.7 –4.1 –3.6 –3.1 –2.6 –2.0 –1.7 –1.4Madagascar –1.6 –2.8 –1.5 –2.2 –0.4 –1.4 –0.6 –0.7 –3.5 –4.9 –4.2 –3.6 –3.1 –2.6 –2.3Malawi –0.6 –1.7 0.0 –2.6 –2.6 –3.4 –2.3 –2.2 –7.3 –7.4 –5.4 –4.1 –3.2 –2.0 –1.6Mali –0.4 –1.9 –2.3 –1.2 –3.3 –2.0 –3.9 –0.7 –4.3 –4.2 –3.0 –1.9 –1.4 –1.4 –1.4Moldova –1.3 –1.1 –1.1 –1.2 –0.4 0.5 0.0 –0.7 –4.5 –4.5 –2.8 –2.3 –1.9 –1.8 –1.9Mozambique –2.7 –1.8 –9.2 –5.5 –3.0 0.0 –2.4 3.1 –2.3 –1.2 1.0 1.4 1.6 1.6 1.6Myanmar –1.3 –0.4 –0.1 –1.6 –2.6 –1.5 –1.6 –2.4 –4.0 –5.0 –3.9 –3.1 –2.8 –2.4 –1.8Nepal –0.4 2.2 1.8 0.9 1.5 –2.4 –5.4 –4.5 –4.5 –8.3 –5.9 –4.7 –2.9 –1.9 –1.8Nicaragua 0.5 –0.5 –0.9 –0.9 –1.0 –0.7 –1.9 0.8 –2.2 –2.8 –0.3 0.6 –0.7 –1.1 –1.0Niger –0.6 –1.7 –5.8 –6.3 –3.8 –3.4 –2.1 –2.6 –4.7 –3.3 –2.2 –1.2 –1.3 –1.4 –1.4Nigeria 0.8 –1.7 –1.5 –2.7 –3.4 –4.0 –2.6 –3.1 –3.7 –2.8 –3.0 –2.8 –2.8 –3.0 –3.1Papua New Guinea –0.2 –5.8 –4.6 –2.8 –2.8 –0.4 –0.2 –1.9 –3.7 –2.8 –0.6 0.4 1.1 1.6 2.0Rwanda –2.0 –0.4 –3.1 –1.8 –1.3 –1.5 –1.4 –3.9 –3.7 –2.2 –2.5 –1.1 –0.1 0.6 0.3Senegal –3.0 –3.1 –2.6 –2.1 –1.6 –1.1 –1.7 –1.9 –4.2 –2.7 –1.8 –0.9 –1.0 –0.9 –0.9Sudan –6.2 –5.3 –3.9 –3.2 –3.5 –5.7 –7.6 –10.6 –5.9 –3.0 –2.4 –2.3 –2.3 –2.2 –2.1Tajikistan 1.1 0.1 0.4 –1.5 –8.3 –5.5 –1.7 –1.2 –3.5 –3.5 –1.6 –1.6 –1.6 –1.7 –1.7Tanzania –3.1 –2.6 –1.6 –1.7 –0.6 0.4 –0.2 0.0 0.9 0.7 0.1 –0.1 –0.2 –0.1 –0.1Uganda –1.4 –2.1 –1.5 –1.1 –1.5 –0.7 –1.2 –2.7 –5.3 –2.7 –1.3 –0.9 –0.3 0.1 1.0Uzbekistan 6.2 2.2 1.9 –0.4 0.7 1.1 1.3 –0.3 –3.3 –3.5 –3.0 –2.1 –1.6 –1.0 –1.1Vietnam –4.5 –4.8 –3.7 –3.4 –1.6 –0.4 0.5 –1.9 –4.0 –3.4 –3.2 –2.9 –2.5 –2.0 –1.6Yemen –0.9 –1.5 1.5 –2.6 –3.2 –4.7 –7.8 –4.9 –9.0 –5.5 –5.8 –6.2 –5.9 –3.6 –1.5Zambia –1.5 –4.7 –3.6 –6.7 –2.6 –3.6 –3.7 –2.9 –8.3 –6.2 –4.2 –1.9 0.5 3.2 5.6Zimbabwe 0.3 –0.7 –0.4 –0.9 –5.9 –7.5 –3.8 –1.0 1.5 –0.6 –0.6 –0.6 –0.3 –0.3 –0.3
Source: IMF staff estimates and projections. Projections are based on staff assessments of current policies (see “Fiscal Policy Assumptions” in text).Note: “Primary balance” is defined as the overall balance, excluding net interest payments. For country-specific details, see “Data and Conventions” in text, and Table D.
©International Monetary Fund. Not for Redistribution

85International Monetary Fund | April 2021
M E T H O D O L O G I C A L A N D S T A T I S T I C A L A P P E N D I X
Table A19. Low-Income Developing Countries: General Government Revenue, 2012–26(Percent of GDP)
2012 2013 2014 2015 2016 2017 2018 2019 2020 2021 2022 2023 2024 2025 2026Average 17.3 16.3 16.1 14.6 14.2 14.7 15.1 15.0 13.7 13.8 13.9 14.1 14.1 14.1 14.2
Oil Producers 16.9 13.6 12.8 8.2 6.1 7.2 9.2 8.7 7.2 8.2 7.9 7.6 7.5 7.4 7.4Asia 16.2 17.0 16.7 16.5 16.0 16.1 16.1 16.0 14.1 13.7 14.1 14.3 14.5 14.7 14.8Latin America 20.2 19.9 20.1 20.6 21.9 21.8 21.1 21.4 19.7 18.9 20.1 20.4 20.6 20.9 21.1Sub-Saharan Africa 16.2 14.7 14.5 12.5 11.9 12.8 13.3 13.2 12.3 12.8 12.7 12.8 12.7 12.6 12.6Others 24.7 22.4 21.8 18.5 17.7 17.7 20.7 21.0 19.8 19.8 20.3 20.7 21.0 21.4 22.0
Afghanistan 25.2 24.3 23.7 24.6 28.2 27.1 30.6 26.9 27.0 26.0 26.9 28.3 27.9 26.0 25.9Bangladesh 11.2 11.2 10.9 9.8 10.1 10.2 9.7 10.0 9.6 9.2 9.6 9.6 9.7 9.7 9.7Benin 14.0 13.5 12.6 12.6 11.1 13.6 13.6 14.1 14.8 14.2 14.5 15.2 15.4 15.4 15.6Burkina Faso 19.9 21.7 19.2 18.3 18.6 19.2 19.4 20.4 21.7 20.7 21.2 21.4 21.7 22.0 22.3Cambodia 17.2 18.7 20.1 19.6 20.8 21.6 23.9 27.1 22.5 23.1 22.7 22.2 22.1 22.0 22.0Cameroon 16.3 16.3 16.6 16.5 14.8 15.0 16.1 15.7 13.2 14.5 14.7 14.7 14.8 14.8 14.7Chad 24.4 20.7 17.8 14.0 12.4 14.6 15.3 14.2 21.3 16.8 17.9 17.2 17.3 18.5 17.9Congo, Democratic Republic of the 15.5 14.6 18.5 16.8 14.0 11.7 11.1 10.7 9.1 10.9 11.2 11.5 11.7 11.7 11.8Congo, Republic of 37.9 39.5 37.8 23.5 26.1 22.4 25.4 27.3 24.6 27.2 25.3 26.2 26.5 26.4 26.0Côte d’Ivoire 13.9 14.2 13.6 14.5 14.7 15.1 14.8 15.0 14.4 15.3 15.3 15.3 15.2 15.1 15.2Ethiopia 15.5 15.8 14.9 15.4 15.6 14.7 13.1 12.8 11.7 11.5 12.6 14.0 15.1 15.4 15.6Ghana 13.7 12.5 13.4 14.9 13.4 13.9 14.5 13.7 12.3 13.1 14.0 14.6 14.8 15.0 15.3Guinea 17.5 14.8 17.0 14.8 16.0 15.3 14.5 14.1 14.6 14.3 15.0 15.5 16.0 16.3 15.8Haiti 13.7 12.2 11.2 11.3 10.9 10.5 10.4 8.3 7.7 8.0 8.6 9.2 9.8 10.2 10.2Honduras 22.9 23.8 24.7 25.2 27.0 26.5 26.4 25.8 23.4 24.6 26.2 26.2 26.4 26.7 26.9Kenya 19.1 19.7 19.8 19.1 19.2 18.2 18.2 17.7 17.3 16.9 17.3 18.2 18.5 18.9 19.2Kyrgyz Republic 34.7 34.4 35.4 35.6 33.1 33.3 32.5 34.0 33.0 32.8 32.6 32.4 32.1 31.8 31.5Lao P.D.R. 22.4 20.2 21.9 20.2 16.0 16.1 16.2 15.4 12.1 13.3 14.2 14.9 15.3 15.5 15.8Madagascar 9.3 9.3 10.6 10.2 12.4 12.8 12.8 13.5 10.9 12.5 13.2 13.5 13.7 13.9 14.2Malawi 24.4 23.9 21.4 21.6 20.9 22.7 21.5 21.3 19.5 21.7 22.1 23.6 24.8 25.2 25.3Mali 14.6 17.4 17.1 19.1 18.3 20.1 15.6 21.4 20.0 21.8 21.3 21.6 21.3 21.3 21.3Moldova 31.7 30.9 31.8 30.0 28.6 29.8 30.5 30.0 31.5 30.7 31.3 31.6 31.8 31.8 31.8Mozambique 25.2 29.6 30.4 26.0 23.9 27.1 25.8 29.9 25.4 26.9 28.0 27.1 25.2 23.5 23.5Myanmar 15.3 20.6 22.5 21.4 19.6 17.9 17.6 16.3 16.0 15.0 15.6 16.4 16.7 17.0 17.3Nepal 15.6 17.1 17.9 18.2 20.1 20.9 22.2 22.4 21.9 21.2 23.6 24.5 25.4 25.7 25.9Nicaragua 23.9 23.5 23.3 23.9 25.1 25.5 24.5 27.6 26.8 26.8 27.6 27.6 27.4 27.2 27.3Niger 15.8 18.5 17.5 17.5 14.9 15.4 18.1 18.0 17.6 18.4 18.1 18.3 18.5 18.8 18.9Nigeria 14.7 11.5 10.9 7.3 5.1 6.6 8.5 7.9 6.3 7.5 7.3 7.0 6.9 6.7 6.7Papua New Guinea 21.2 20.7 20.8 18.3 16.1 15.9 17.7 16.3 13.9 14.4 15.2 15.7 15.9 16.1 16.4Rwanda 22.1 24.8 23.5 23.8 22.8 22.6 23.8 23.6 23.1 23.4 23.2 23.8 23.9 23.3 22.9Senegal 18.8 17.8 19.2 19.3 20.7 19.5 18.9 20.4 21.1 20.5 20.9 21.6 21.8 22.5 22.6Sudan 9.1 9.6 8.8 8.5 6.1 6.9 8.9 7.8 4.8 11.1 9.9 9.8 9.5 9.5 9.4Tajikistan 25.1 26.9 28.4 29.9 29.9 29.7 29.1 27.4 25.2 26.3 27.6 27.9 28.0 28.0 28.1Tanzania 15.4 15.0 14.4 14.0 14.8 15.4 14.7 14.7 14.9 14.5 14.5 14.7 14.8 14.8 14.8Uganda 10.7 10.1 10.8 12.7 12.4 12.7 13.2 13.6 13.6 14.1 14.5 14.7 15.1 16.1 17.4Uzbekistan 31.6 29.1 28.3 25.6 25.4 24.7 27.8 28.1 26.6 25.8 26.2 26.6 27.0 27.4 27.9Vietnam 18.0 18.5 17.7 19.2 19.1 19.6 19.5 19.5 16.2 15.9 16.2 16.5 16.8 17.1 17.4Yemen 29.9 23.9 23.6 10.7 7.5 3.5 6.4 8.5 5.7 4.9 5.2 5.6 7.1 8.9 10.9Zambia 18.7 17.6 18.9 18.8 18.2 17.5 19.4 20.4 20.0 19.1 19.2 19.4 19.3 19.3 19.3Zimbabwe 20.4 19.6 19.3 18.7 16.8 14.1 12.8 14.2 16.7 16.8 16.8 16.8 16.8 16.8 16.8
Source: IMF staff estimates and projections. Projections are based on staff assessments of current policies (see “Fiscal Policy Assumptions” in text).Note: For country-specific details, see “Data and Conventions” in text, and Table D.
©International Monetary Fund. Not for Redistribution

86
F I S C A L M O N I T O R : A F A I R S H O T
International Monetary Fund | April 2021
Table A20. Low-Income Developing Countries: General Government Expenditure, 2012–26(Percent of GDP)
2012 2013 2014 2015 2016 2017 2018 2019 2020 2021 2022 2023 2024 2025 2026Average 19.5 19.7 19.4 18.6 18.0 18.2 18.5 19.0 19.2 18.7 18.3 18.0 18.0 17.9 17.9
Oil Producers 17.3 16.5 15.7 12.7 11.4 12.6 13.3 13.2 12.9 12.4 12.4 12.1 12.2 12.4 12.8Asia 20.1 21.2 20.4 20.5 19.3 18.8 19.0 20.1 19.5 19.3 19.2 19.0 19.0 18.8 18.8Latin America 22.6 23.9 22.8 21.8 22.6 22.4 22.1 21.8 23.3 22.2 22.3 22.4 22.9 23.1 23.3Sub-Saharan Africa 17.8 17.9 17.9 16.7 16.5 17.2 17.2 17.2 18.1 17.4 16.9 16.5 16.4 16.3 16.3Others 25.8 25.0 23.9 22.0 20.5 20.4 23.4 24.5 24.4 23.9 23.6 23.8 24.1 24.0 24.4
Afghanistan 25.0 25.0 25.4 25.9 28.0 27.7 28.9 28.0 29.5 28.5 28.4 29.1 28.6 26.9 26.8Bangladesh 14.2 14.6 14.0 13.8 13.4 13.6 14.3 15.4 15.0 15.3 15.1 14.6 14.7 14.7 14.7Benin 14.2 14.9 14.2 18.2 15.4 17.8 16.6 14.6 19.7 18.7 17.5 17.7 17.4 17.4 17.1Burkina Faso 22.7 25.3 20.9 20.4 21.6 26.1 23.8 23.9 26.9 26.3 26.0 25.4 24.7 25.0 25.3Cambodia 21.7 21.4 21.7 20.3 21.1 22.4 23.2 24.1 24.2 26.5 26.9 27.1 27.6 27.5 27.3Cameroon 17.8 20.0 20.9 20.9 20.9 19.8 18.5 19.1 17.3 17.2 16.7 15.8 16.0 15.8 15.8Chad 23.9 22.8 22.0 18.3 14.4 14.9 13.3 14.4 19.8 17.7 17.2 17.3 16.9 16.3 15.9Congo, Democratic Republic of the 13.7 12.7 18.5 17.2 14.5 10.4 11.1 12.6 10.7 11.8 11.6 12.1 12.7 12.6 12.7Congo, Republic of 30.7 42.4 48.6 41.3 41.7 28.3 19.6 22.5 23.1 24.8 23.9 22.6 22.7 23.0 22.3Côte d’Ivoire 16.1 15.9 15.2 16.5 17.7 18.4 17.7 17.3 20.3 20.0 18.9 18.4 18.3 18.2 18.3Ethiopia 16.6 17.8 17.5 17.3 17.9 18.0 16.1 15.4 14.5 14.8 14.8 15.9 17.1 17.1 17.7Ghana 22.1 21.7 21.4 18.9 20.3 18.0 21.5 21.1 28.3 25.7 24.4 23.9 23.9 23.9 22.1Guinea 20.0 18.6 20.2 21.7 16.1 17.3 15.6 14.6 18.2 16.5 17.2 17.8 18.1 18.6 18.3Haiti 16.4 16.3 15.0 12.7 10.9 10.5 11.5 9.6 10.0 10.8 11.2 11.5 12.0 12.4 12.4Honduras 26.4 29.6 27.6 26.0 27.4 26.9 26.2 25.7 27.8 28.0 28.4 28.7 28.7 28.8 28.9Kenya 24.2 25.4 27.2 27.2 27.7 26.1 25.6 25.4 25.7 25.0 24.0 23.2 22.6 22.1 21.7Kyrgyz Republic 40.6 38.1 38.5 38.1 38.9 37.0 33.1 34.2 39.8 37.6 36.6 35.4 35.1 34.8 34.6Lao P.D.R. 24.7 24.2 25.0 25.8 21.1 21.6 20.9 20.4 18.6 19.0 19.5 19.8 19.8 19.7 19.6Madagascar 11.5 12.7 12.6 13.0 13.5 14.9 14.1 14.9 15.1 18.3 18.1 17.8 17.4 17.1 17.0Malawi 26.4 29.2 25.7 27.5 27.8 30.1 27.7 27.8 32.8 34.2 31.6 31.6 32.0 31.2 29.6Mali 15.5 19.8 20.0 20.9 22.3 22.9 20.3 23.1 25.5 27.3 25.8 25.1 24.3 24.3 24.3Moldova 33.7 32.4 33.4 31.9 30.1 30.5 31.4 31.4 36.8 36.2 35.1 34.8 34.7 34.7 34.7Mozambique 28.8 32.2 40.7 32.7 29.4 30.0 32.6 30.0 30.8 31.0 29.9 28.2 25.9 23.8 23.6Myanmar 17.9 22.3 23.8 24.2 23.4 20.8 21.0 20.3 21.6 21.8 21.9 22.0 22.1 21.8 21.6Nepal 16.8 15.5 16.6 17.7 19.0 23.6 28.0 27.3 27.0 30.2 30.5 30.2 29.4 28.8 28.9Nicaragua 24.1 24.2 24.6 25.3 26.8 27.0 27.5 28.0 30.3 30.4 28.8 28.5 29.5 29.9 29.9Niger 16.6 20.4 23.6 24.2 19.4 19.5 21.1 21.6 23.4 22.8 21.5 20.8 21.0 21.3 21.4Nigeria 14.8 14.1 13.4 11.1 9.8 12.0 12.8 12.6 12.1 11.8 11.8 11.4 11.6 11.8 12.3Papua New Guinea 22.4 27.6 27.1 22.8 20.9 18.4 20.3 20.7 20.1 19.7 18.0 17.8 17.3 17.1 17.1Rwanda 24.5 26.1 27.4 26.5 25.0 25.1 26.4 28.8 28.6 27.4 27.5 26.4 25.4 24.3 24.0Senegal 23.0 22.1 23.1 22.9 24.0 22.5 22.6 24.3 27.5 25.4 24.8 24.6 24.8 25.5 25.6Sudan 16.5 15.3 13.5 12.4 10.0 13.1 16.7 18.7 10.8 14.2 12.4 12.2 12.0 12.0 11.9Tajikistan 24.5 27.8 28.5 31.9 38.9 35.6 31.9 29.5 29.7 30.8 30.1 30.4 30.5 30.6 30.7Tanzania 19.5 18.8 17.3 17.2 16.9 16.6 16.6 16.4 15.9 15.7 16.2 16.7 16.8 16.8 16.9Uganda 13.1 13.3 13.6 15.2 16.0 15.5 16.2 18.4 21.2 19.7 18.8 18.7 18.5 18.9 19.3Uzbekistan 25.4 26.8 26.2 25.9 24.5 23.4 26.0 28.3 29.9 29.3 29.0 28.8 28.8 28.7 29.2Vietnam 23.5 24.5 22.8 24.2 22.2 21.5 20.5 22.8 21.6 20.6 20.5 20.5 20.5 20.4 20.4Yemen 36.2 30.8 27.8 19.4 16.1 8.4 14.3 13.8 15.3 11.0 11.5 13.6 15.7 15.9 16.5Zambia 21.5 23.8 24.7 28.3 24.3 25.1 27.9 30.2 34.0 28.4 26.1 23.4 20.6 17.7 15.1Zimbabwe 20.4 20.9 20.4 20.5 23.4 22.4 17.4 15.6 15.6 17.6 17.6 17.6 17.3 17.3 17.2
Source: IMF staff estimates and projections. Projections are based on staff assessments of current policies (see “Fiscal Policy Assumptions” in text).Note: For country-specific details, see “Data and Conventions” in text, and Table D.
©International Monetary Fund. Not for Redistribution

87International Monetary Fund | April 2021
M E T H O D O L O G I C A L A N D S T A T I S T I C A L A P P E N D I X
Table A21. Low-Income Developing Countries: General Government Gross Debt, 2012–26(Percent of GDP)
2012 2013 2014 2015 2016 2017 2018 2019 2020 2021 2022 2023 2024 2025 2026Average 30.5 31.7 32.1 36.5 39.8 42.2 42.8 44.3 49.5 48.6 48.2 47.5 46.9 46.3 45.7
Oil Producers 20.2 21.1 20.8 24.7 28.8 30.9 31.9 32.9 38.6 35.2 35.0 34.9 35.4 36.3 37.7Asia 36.4 37.9 38.5 39.1 39.9 39.3 39.2 39.6 42.9 45.2 45.5 45.4 45.2 44.8 44.4Latin America 27.2 32.3 30.1 30.9 32.4 33.6 35.0 38.6 41.4 42.4 43.1 42.6 43.9 44.1 44.2Sub-Saharan Africa 24.9 26.6 27.8 33.5 37.4 40.1 41.9 44.2 49.1 47.2 47.2 46.5 45.9 45.4 44.8Others 46.0 43.1 39.2 44.7 51.8 66.6 68.5 69.5 88.3 78.2 71.9 67.6 65.1 62.9 61.0
Afghanistan 6.8 6.9 8.7 9.2 8.4 8.0 7.4 6.1 7.8 8.8 9.6 10.3 11.0 11.6 12.3Bangladesh 36.2 35.8 35.3 33.7 33.3 33.4 34.6 35.7 38.9 40.2 40.2 39.6 39.4 39.3 39.3Benin 19.5 18.5 22.3 30.9 35.9 39.6 41.1 41.2 45.4 47.7 46.3 44.8 42.9 41.1 38.7Burkina Faso 25.2 25.9 26.6 31.4 33.3 33.5 37.7 42.7 44.3 46.8 48.1 48.5 47.9 47.4 46.8Cambodia 31.5 31.7 31.9 31.2 29.1 30.0 28.6 29.0 31.6 33.4 35.4 38.0 41.0 43.9 46.7Cameroon 15.4 18.2 21.5 32.0 33.3 37.7 39.5 41.7 43.2 42.5 42.0 40.5 38.9 37.2 35.8Chad 28.8 30.6 39.5 43.9 51.3 50.3 49.1 44.3 43.0 41.7 41.2 41.8 41.3 38.3 35.4Congo, Democratic Republic of the 21.8 19.1 16.8 17.0 19.5 19.1 15.3 15.5 15.2 12.4 10.6 8.7 7.1 5.8 4.7Congo, Republic of 30.2 33.9 42.3 74.2 91.0 94.2 78.6 83.3 101.7 90.5 84.5 74.9 69.6 63.8 57.9Côte d’Ivoire 32.6 31.4 32.4 34.2 35.6 36.9 40.1 41.2 45.7 46.3 46.6 46.3 46.1 45.9 46.0Ethiopia 42.2 47.5 47.6 54.5 54.9 57.7 61.1 57.7 55.3 56.0 56.3 52.5 48.6 44.0 40.8Ghana 35.6 43.2 51.2 54.8 57.1 58.3 63.2 63.9 78.0 81.5 83.2 84.8 86.0 86.6 85.5Guinea 27.2 34.0 35.1 41.9 42.5 40.5 38.3 36.8 41.4 42.3 43.3 42.4 41.3 40.3 39.2Haiti 24.0 25.8 21.8 23.8 24.8 24.6 25.6 30.3 25.1 26.0 24.9 24.1 23.8 23.7 24.1Honduras 29.2 39.4 37.1 37.1 38.2 38.9 40.0 41.9 48.9 53.9 55.8 54.8 57.0 57.1 56.7Kenya 43.9 44.0 42.9 48.6 50.5 56.9 60.2 62.1 68.7 71.5 72.9 72.3 71.8 70.0 68.1Kyrgyz Republic 50.5 47.1 53.6 67.1 59.1 58.8 54.8 54.1 74.3 73.4 71.7 70.3 68.8 67.6 66.7Lao P.D.R. 46.1 49.5 53.5 53.1 54.5 57.2 59.7 61.6 68.0 68.3 68.8 69.1 68.8 67.7 66.1Madagascar 30.4 36.2 37.8 44.1 40.3 40.1 39.8 37.8 43.6 46.9 47.8 48.6 49.1 49.4 49.6Malawi 40.3 50.6 47.8 54.4 55.1 57.1 59.7 59.5 67.3 76.8 79.9 81.7 82.6 82.1 81.5Mali 25.4 26.4 27.2 30.7 35.9 35.5 36.1 40.5 44.1 46.1 46.8 46.9 46.5 46.0 45.3Moldova 31.2 29.8 35.0 42.4 39.2 34.3 31.6 28.3 35.3 39.5 40.1 41.6 41.6 41.1 39.5Mozambique 37.4 50.1 64.3 87.4 119.9 100.1 105.3 103.4 122.2 125.3 126.4 119.8 108.6 95.8 78.5Myanmar 36.5 36.1 35.2 36.4 38.3 38.5 40.4 38.8 39.3 49.1 53.6 56.0 58.1 59.7 61.0Nepal 34.5 31.9 27.6 25.7 25.0 25.0 30.1 33.1 41.3 49.6 54.1 56.4 57.1 56.9 56.5Nicaragua 27.9 28.8 28.7 28.9 30.9 34.1 37.6 41.7 46.0 47.6 47.8 49.1 50.7 51.4 51.2Niger 18.1 19.6 22.1 29.9 32.8 36.5 36.9 39.8 44.2 44.5 42.0 39.9 39.2 38.8 38.7Nigeria1 17.6 18.3 17.5 20.3 23.4 25.3 27.7 29.2 35.1 31.9 32.5 33.0 33.9 35.3 37.0Papua New Guinea 19.1 24.9 26.9 29.9 33.7 32.5 36.7 40.0 49.2 49.6 49.7 48.3 47.7 45.4 43.9Rwanda 19.0 26.0 28.2 32.2 36.4 41.3 45.0 51.0 61.0 66.0 67.9 68.4 67.1 65.6 64.2Senegal2 34.5 36.9 42.4 44.5 47.5 61.1 63.5 64.8 65.8 66.8 66.6 62.5 59.9 58.6 56.3Sudan 117.7 105.8 84.4 93.2 109.9 152.9 185.6 200.3 262.5 211.7 185.9 174.8 171.3 168.2 165.2Tajikistan 32.3 29.1 27.7 34.7 42.1 50.3 47.8 43.1 48.1 49.8 49.2 49.0 48.8 48.5 48.0Tanzania 29.2 31.4 34.6 37.1 37.0 37.7 38.7 38.2 38.2 37.9 37.4 37.1 36.8 36.3 36.0Uganda 19.5 22.1 24.8 28.7 31.0 33.7 34.9 37.3 45.7 48.8 50.3 51.0 50.1 47.9 45.0Uzbekistan 7.2 6.6 6.4 7.1 8.6 20.2 20.4 29.4 37.9 42.3 44.3 44.0 43.0 41.8 40.3Vietnam 38.3 41.4 43.6 46.1 47.6 46.3 43.6 43.4 46.6 48.0 47.3 46.8 45.8 44.9 43.7Yemen 47.3 48.2 48.7 57.0 72.3 77.4 74.5 76.5 83.2 73.0 67.9 59.4 54.2 51.3 50.7Zambia 25.4 27.1 36.1 65.6 60.6 63.0 77.3 94.5 117.8 118.7 129.5 132.2 140.9 145.0 134.7Zimbabwe 38.3 36.9 42.2 47.5 48.5 43.7 33.6 112.1 88.9 51.4 55.0 58.0 56.9 55.9 55.1
Source: IMF staff estimates and projections. Projections are based on staff assessments of current policies (see “Fiscal Policy Assumptions” in text).Note: For country-specific details, see “Data and Conventions” in text, and Table D.1 Debt includes overdrafts from the Central Bank of Nigeria and liabilities of the Asset Management Corporation of Nigeria.2 From 2017 onward, Senegal data include the whole of the public sector, whereas before 2017, only central government debt stock was taken into account.
©International Monetary Fund. Not for Redistribution

88
F I S C A L M O N I T O R : A F A I R S H O T
International Monetary Fund | April 2021
Table A22. Low-Income Developing Countries: General Government Net Debt, 2012–26(Percent of GDP)
2012 2013 2014 2015 2016 2017 2018 2019 2020 2021 2022 2023 2024 2025 2026Average . . . . . . . . . . . . . . . . . . . . . . . . . . . . . . . . . . . . . . . . . . . . .
Oil Producers . . . . . . . . . . . . . . . . . . . . . . . . . . . . . . . . . . . . . . . . . . . . .Asia . . . . . . . . . . . . . . . . . . . . . . . . . . . . . . . . . . . . . . . . . . . . .Latin America . . . . . . . . . . . . . . . . . . . . . . . . . . . . . . . . . . . . . . . . . . . . .Sub-Saharan Africa . . . . . . . . . . . . . . . . . . . . . . . . . . . . . . . . . . . . . . . . . . . . .Others . . . . . . . . . . . . . . . . . . . . . . . . . . . . . . . . . . . . . . . . . . . . .
Afghanistan . . . . . . . . . . . . . . . . . . . . . . . . . . . . . . . . . . . . . . . . . . . . .Bangladesh . . . . . . . . . . . . . . . . . . . . . . . . . . . . . . . . . . . . . . . . . . . . .Benin . . . . . . . . . . . . . . . . . . . . . . . . . . . . . . . . . . . . . . . . . . . . .Burkina Faso . . . . . . . . . . . . . . . . . . . . . . . . . . . . . . . . . . . . . . . . . . . . .Cambodia . . . . . . . . . . . . . . . . . . . . . . . . . . . . . . . . . . . . . . . . . . . . .Cameroon 13.1 15.9 19.9 27.8 31.6 34.3 37.0 39.5 41.3 41.2 40.9 40.1 38.7 37.1 35.8Chad . . . . . . . . . . . . . . . . . . . . . . . . . . . . . . . . . . . . . . . . . . . . .Congo, Democratic Republic of the . . . . . . . . . . . . . . . . . . . . . . . . . . . . . . . . . . . . . . . . . . . . .Congo, Republic of . . . . . . . . . . . . . . . . . . . . . . . . . . . . . . . . . . . . . . . . . . . . .Côte d’Ivoire . . . . . . . . . . . . . . . . . . . . . . . . . . . . . . . . . . . . . . . . . . . . .Ethiopia 37.0 41.9 43.0 49.6 50.9 53.8 57.5 53.9 51.8 53.3 54.0 50.4 46.6 35.5 34.1Ghana 34.0 40.2 46.3 50.6 52.0 53.1 61.9 59.1 72.8 76.9 79.2 81.2 82.8 83.7 82.9Guinea . . . . . . . . . . . . . . . . . . . . . . . . . . . . . . . . . . . . . . . . . . . . .Haiti . . . . . . . . . . . . . . . . . . . . . . . . . . . . . . . . . . . . . . . . . . . . .Honduras . . . . . . . . . . . . . . . . . . . . . . . . . . . . . . . . . . . . . . . . . . . . .Kenya 40.1 40.1 38.7 43.5 45.1 51.1 54.5 57.3 64.3 68.5 70.1 69.5 67.7 66.7 64.9Kyrgyz Republic . . . . . . . . . . . . . . . . . . . . . . . . . . . . . . . . . . . . . . . . . . . . .Lao P.D.R. . . . . . . . . . . . . . . . . . . . . . . . . . . . . . . . . . . . . . . . . . . . . .Madagascar . . . . . . . . . . . . . . . . . . . . . . . . . . . . . . . . . . . . . . . . . . . . .Malawi . . . . . . . . . . . . . . . . . . . . . . . . . . . . . . . . . . . . . . . . . . . . .Mali 21.3 20.2 20.0 23.2 29.9 30.6 32.7 34.3 29.2 25.6 24.8 25.1 25.8 26.9 27.7Moldova . . . . . . . . . . . . . . . . . . . . . . . . . . . . . . . . . . . . . . . . . . . . .Mozambique . . . . . . . . . . . . . . . . . . . . . . . . . . . . . . . . . . . . . . . . . . . . .Myanmar . . . . . . . . . . . . . . . . . . . . . . . . . . . . . . . . . . . . . . . . . . . . .Nepal . . . . . . . . . . . . . . . . . . . . . . . . . . . . . . . . . . . . . . . . . . . . .Nicaragua . . . . . . . . . . . . . . . . . . . . . . . . . . . . . . . . . . . . . . . . . . . . .Niger 14.4 15.3 17.2 25.9 29.5 32.3 34.0 35.9 40.5 41.1 38.9 37.1 36.5 36.2 36.1Nigeria1 10.7 11.4 13.8 15.9 19.0 20.9 23.5 25.4 34.6 31.6 32.2 32.7 33.7 35.1 36.8Papua New Guinea . . . . . . . . . . . . . . . . . . . . . . . . . . . . . . . . . . . . . . . . . . . . .Rwanda . . . . . . . . . . . . . . . . . . . . . . . . . . . . . . . . . . . . . . . . . . . . .Senegal . . . . . . . . . . . . . . . . . . . . . . . . . . . . . . . . . . . . . . . . . . . . .Sudan . . . . . . . . . . . . . . . . . . . . . . . . . . . . . . . . . . . . . . . . . . . . .Tajikistan . . . . . . . . . . . . . . . . . . . . . . . . . . . . . . . . . . . . . . . . . . . . .Tanzania . . . . . . . . . . . . . . . . . . . . . . . . . . . . . . . . . . . . . . . . . . . . .Uganda . . . . . . . . . . . . . . . . . . . . . . . . . . . . . . . . . . . . . . . . . . . . .Uzbekistan . . . . . . . . . . . . . . . . . . . . . . . . . . . . . . . . . . . . . . . . . . . . .Vietnam . . . . . . . . . . . . . . . . . . . . . . . . . . . . . . . . . . . . . . . . . . . . .Yemen 45.3 46.7 47.8 56.1 71.3 76.6 73.8 75.8 82.6 72.5 67.6 59.1 54.0 51.0 50.5Zambia . . . . . . . . . . . . . . . . . . . . . . . . . . . . . . . . . . . . . . . . . . . . .Zimbabwe . . . . . . . . . . . . . . . . . . . . . . . . . . . . . . . . . . . . . . . . . . . . .
Source: IMF staff estimates and projections. Projections are based on staff assessments of current policies (see “Fiscal Policy Assumptions” in text).Note: For country-specific details, see “Data and Conventions” in text, and Table D.1 The overdrafts and government deposits at the Central Bank of Nigeria almost cancel each other out, and the Asset Management Corporation of Nigeria debt is roughly halved. See footnote 1 in Table A21 for additional details.
©International Monetary Fund. Not for Redistribution

89International M
onetary Fund | April 2021
METHODOLOGICAL AND STATISTICAL APPENDIX
Table A23. Advanced Economies: Structural Fiscal Indicators(Percent of GDP, except when indicated otherwise)
Pension Spending Change,
2020–301
Net Present Value of Pension
Spending Change, 2020–502
Health Care Spending Change,
2020–303
Net Present Value of Health Care
Spending Change, 2020–502
Gross Financing
Need, 20214
Average Term to Maturity,
2021 (years)5
Debt to Average Maturity,
2021
Projected Interest Rate–Growth Differential,
2021–26 (percent)
Pre-Pandemic Overall
Balance, 2012–19
Projected Overall
Balance, 2020–26
Nonresident Holding of General Government Debt,
2020 (percent of total)6
Average 0.8 25.0 2.6 91.4 34.7 7.1 17.9 –2.6 –3.2 –5.6 31.6G7 0.8 23.2 3.0 103.2 40.5 6.9 20.6 –2.6 –3.9 –6.3 29.0G20 Advanced 0.8 24.6 2.9 99.9 38.2 7.0 19.6 –2.6 –3.7 –6.1 28.7
Australia 0.7 20.5 1.0 38.2 14.7 7.5 8.4 –2.6 –2.7 –5.9 37.0Austria 0.5 16.2 0.9 38.4 15.2 10.4 8.2 –2.9 –1.2 –3.6 75.3Belgium 0.5 20.3 1.2 50.1 16.8 10.0 11.5 –2.7 –2.3 –6.0 68.6Canada 0.7 12.5 1.1 41.6 22.8 5.4 21.7 –2.3 –0.5 –3.4 22.3Cyprus 0.7 23.1 . . . . . . 8.1 7.1 16.6 –2.7 –1.3 –1.2 83.4Czech Republic 0.1 20.8 0.7 25.4 14.1 6.1 6.2 –2.8 –0.6 –5.6 39.2Denmark –0.7 –23.1 1.0 34.1 7.9 8.0 5.4 –2.6 0.2 –1.3 36.9Estonia –0.6 –14.3 0.5 22.2 . . . 0.4 42.2 –5.6 –0.1 –5.0 86.5Finland 1.0 8.4 1.0 31.3 14.0 6.3 10.6 –2.6 –1.8 –2.8 69.0France 0.5 0.4 1.1 41.4 19.2 7.8 14.6 –2.9 –3.6 –5.1 60.5Germany 1.1 32.1 0.7 35.3 13.1 5.9 11.6 –3.1 0.9 –1.1 57.2Hong Kong SAR 1.4 46.3 . . . . . . . . . . . . . . . –2.9 2.5 –2.2 . . .Iceland 1.6 52.2 1.5 58.6 17.0 4.5 6.2 0.3 1.1 –6.2 14.3Ireland 0.7 29.9 0.5 22.2 6.4 10.8 5.5 –3.7 –2.5 –2.4 74.8Israel 0.3 12.3 0.3 12.1 . . . 6.4 11.5 –1.3 –2.7 –5.8 17.9Italy7 1.6 49.1 0.7 29.7 26.0 6.8 22.9 –1.0 –2.5 –4.8 33.9Japan –1.2 –2.8 1.7 56.5 61.1 8.2 31.4 –1.4 –4.9 –5.0 0.0Korea 1.6 62.3 1.9 73.8 5.4 7.9 6.1 –2.0 1.2 –2.5 14.2Latvia –0.6 –14.0 0.6 23.9 . . . 9.7 4.7 –3.7 –0.7 –2.1 80.4Lithuania 0.1 –1.3 0.8 30.1 10.3 7.2 6.5 –3.3 –0.6 –2.4 82.6Luxembourg 1.2 47.5 0.9 38.6 . . . 5.0 5.1 –4.6 1.6 –0.8 51.8Malta –0.8 –8.3 . . . . . . 13.9 8.2 6.7 –3.7 –0.2 –3.5 15.3The Netherlands 0.5 22.1 1.7 60.9 12.7 7.5 7.2 –2.8 –0.7 –2.2 49.5New Zealand 1.5 44.8 1.5 54.8 10.7 7.6 5.5 –0.9 –0.3 –2.9 28.0Norway 0.7 18.3 2.0 71.5 . . . 4.7 8.7 –2.9 7.6 1.4 52.7Portugal 0.7 17.5 0.9 34.2 15.6 6.4 20.7 –2.2 –3.5 –1.9 57.2Singapore8 0.9 32.5 . . . . . . 16.6 4.0 32.1 . . . 4.7 0.8 0.0Slovak Republic –0.6 –8.3 0.5 19.3 10.1 8.6 7.0 –3.9 –2.4 –4.9 62.3Slovenia 1.1 54.5 0.7 30.4 13.1 8.8 9.2 –3.6 –3.5 –4.2 68.2Spain 0.3 24.3 1.1 45.0 22.9 7.5 15.6 –2.6 –5.2 –6.3 53.7Sweden –0.5 –16.0 0.5 19.0 8.0 4.9 7.8 –2.7 0.0 –1.3 27.7Switzerland 0.3 12.6 2.1 79.4 5.8 11.1 3.9 –1.6 0.5 –1.0 8.0United Kingdom 0.3 14.1 1.4 53.5 17.9 14.8 7.0 –2.5 –4.2 –6.5 34.1United States 1.2 30.3 4.4 152.3 49.6 5.8 22.0 –2.9 –5.0 –8.0 25.9
Sources: Bloomberg Finance L.P.; Joint External Debt Hub, Quarterly External Debt Statistics; national authorities; and IMF staff estimates and projections.Note: All economy averages are weighted by nominal GDP converted to US dollars at average market exchange rates in the years indicated and based on data availability.1 Pension projections rely on authorities’ estimates when these are available. For European Union (EU) countries, pension projections are based on The 2018 Ageing Report of the European Commission. When authorities’ estimates are not available, IMF staff projections use the methodology described in Clements, Eich, and Gupta’s Equitable and Sustainable Pensions: Challenges and Experience (IMF 2014). These pension spending projections can be different from the previous edition of the Fiscal Monitor because of new baseline pension numbers, as well as new labor force participation rate numbers from the International Labour Organization.2 For net present value calculations, a discount rate of 1 percent a year in excess of GDP growth is used for each economy. 3 IMF staff projections for health care spending are driven by demographics and other factors. The difference between the growth of health care spending and real GDP growth that is not explained by demographics (“excess cost growth”) is assumed to start at the economy-specific historical average and converge to the advanced economy historical average by 2050 (0.8 percent). 4 “Gross financing need” is defined as the projected overall deficit and maturing government debt in 2021. For most economies, data on maturing debt refer to central government securities. Data are from Bloomberg Finance L.P. and IMF staff projections. 5 For most economies, the average-term-to-maturity data refer to central government securities; the source is Bloomberg Finance L.P.6 Nonresident holding of general government debt data are for the third quarter of 2020 or latest available from the Joint External Debt Hub, Quarterly External Debt Statistics, which include marketable and nonmarketable debt. For some economies, tradable instruments in the Joint External Debt Hub are reported at market value. External debt in US dollars is converted to local currency, then taken as a percentage of the 2020 gross general government debt.7 Italy’s pension projections do not reflect the new demographic assumptions. Taking into account the employment rate, productivity growth, and demographics, IMF staff calculations show that the change in pension spending over 2015–30 would be about 3 percent of GDP; see Italy 2017 Article IV Staff Report, Box 4.8 Singapore’s general government debt is covered by financial assets and is issued to deepen the domestic market, meet the Central Provident Fund’s investment needs, and provide individuals with a long-term savings option.
©International Monetary Fund. Not for Redistribution

90 FISCAL MONITOR : A FAIR SHOT
International Monetary Fund | April 2021
Table A24. Emerging Market and Middle-Income Economies: Structural Fiscal Indicators(Percent of GDP, except when indicated otherwise)
Pension Spending Change,
2020–301
Net Present Value of Pension
Spending Change, 2020–502
Health Care Spending Change,
2020–303
Net Present Value of Health Care
Spending Change, 2020–502
Gross Financing
Need, 20214
Average Term to Maturity,
2021 (years)5
Debt to Average Maturity,
2021
Projected Interest Rate–Growth Differential,
2021–26 (percent)
Pre-Pandemic Overall
Balance, 2012–19
Projected Overall
Balance, 2020–26
Nonresident Holding of General Government Debt,
2020 (percent of total)6
Average 1.8 74.3 0.5 20.1 13.1 7.0 9.9 –4.6 –3.3 –6.5 14.9G20 Emerging 2.0 82.2 0.5 20.4 12.5 7.0 9.5 –4.7 –3.6 –7.1 10.9
Algeria 2.9 117.6 0.6 27.0 . . . . . . . . . –6.0 –7.1 –11.8 11.5Angola 0.1 2.2 0.1 3.6 . . . 10.3 12.4 –6.9 –1.6 1.1 . . .Argentina 0.7 39.1 0.3 11.6 11.1 10.6 9.7 –19.0 –5.0 –4.0 42.1Belarus 4.5 120.4 0.5 17.9 . . . 5.2 9.2 –2.8 –0.4 –2.0 60.8Brazil7 3.8 153.0 . . . . . . 24.2 6.3 15.7 0.7 –6.4 –8.1 . . .Bulgaria 0.0 13.0 0.6 22.1 . . . 6.0 4.0 –3.5 –0.9 –1.7 53.9Chile –0.5 –6.6 0.8 32.9 4.3 10.2 3.2 –2.5 –1.6 –2.5 37.6China 2.3 99.9 0.6 24.0 . . . 6.3 10.5 –6.1 –2.9 –8.2 3.3Colombia 0.1 –6.7 1.0 41.8 9.8 8.2 7.6 –1.6 –2.3 –3.9 33.7Croatia –0.4 –32.3 0.8 30.4 10.2 4.7 18.7 –3.4 –2.4 –3.4 32.2Dominican Republic 0.1 3.6 0.3 14.4 6.6 8.6 8.0 –3.6 –2.9 –3.2 47.3Ecuador 0.7 29.6 0.6 26.1 7.1 5.9 11.0 –0.3 –4.5 0.0 62.0Egypt 0.9 39.9 0.2 6.7 36.9 3.4 26.9 –2.8 –10.7 –5.7 21.3Hungary –0.6 4.9 0.9 32.5 17.7 3.6 22.4 –3.4 –2.3 –4.0 32.6India 0.7 30.3 0.2 8.3 14.1 9.6 9.4 –4.5 –7.0 –9.0 4.1Indonesia 0.2 10.2 0.2 7.3 8.2 8.6 4.3 –3.1 –2.2 –3.8 50.9Iran 1.5 92.4 . . . . . . . . . . . . . . . –11.0 –1.9 –8.8 . . .Kazakhstan 1.9 53.4 0.2 9.0 . . . 7.4 3.7 –4.3 –0.1 –2.1 27.5Kuwait 6.8 358.1 0.4 16.9 10.5 2.2 5.2 –3.6 14.3 –5.6 . . .Lebanon 2.0 80.0 0.7 28.3 . . . 5.9 26.4 –12.9 –8.8 –9.0 . . .Malaysia 1.7 70.1 0.3 13.0 10.2 7.7 8.8 –2.8 –2.7 –3.5 22.7Mexico 0.5 16.0 0.4 17.5 11.7 8.0 7.5 0.8 –3.0 –3.0 28.2Morocco 1.7 60.2 0.3 12.1 12.7 6.2 12.3 –1.5 –4.7 –5.3 23.2Oman 0.5 25.1 0.4 18.9 . . . 8.6 9.4 1.6 –7.0 –3.5 . . .Pakistan 0.2 11.0 0.1 2.7 35.9 2.5 35.6 –3.8 –6.6 –5.0 32.8Peru 0.3 13.9 0.5 19.3 6.7 11.7 3.0 –2.7 –1.0 –3.4 51.9Philippines 0.2 9.2 0.2 6.1 13.0 7.7 6.1 –4.1 –0.3 –4.5 28.1Poland –0.1 –1.8 0.6 24.2 9.5 4.8 12.0 –4.2 –2.4 –3.8 33.5Qatar 1.0 50.2 0.5 20.8 . . . 9.4 7.7 –2.1 9.1 5.3 . . .Romania –0.6 3.8 0.6 21.9 11.4 6.5 7.7 –3.6 –2.6 –6.8 41.2Russia 2.9 76.7 0.5 17.4 2.1 6.5 3.0 –1.0 –0.7 –0.9 22.9Saudi Arabia 1.9 86.2 0.5 22.0 11.6 9.0 3.6 –1.5 –4.8 –3.1 34.6South Africa 0.3 13.7 0.5 19.8 22.3 12.7 6.1 1.5 –4.4 –8.3 27.8Sri Lanka 0.7 26.0 0.2 9.3 29.9 5.5 18.3 –1.9 –6.0 –9.2 39.0Thailand 3.5 123.7 0.5 17.8 11.6 7.1 7.0 –2.1 –0.2 –2.3 12.3Turkey8 0.4 36.2 0.6 26.2 11.3 5.1 6.8 –4.8 –2.5 –5.9 37.9Ukraine 0.6 34.8 0.4 17.3 20.4 8.3 7.3 –2.9 –2.9 –3.5 48.8United Arab Emirates 0.8 41.3 0.4 17.4 . . . . . . . . . –2.4 1.7 –1.7 . . .Uruguay9 –0.2 4.9 0.8 31.4 7.0 12.4 5.3 –2.7 –2.3 –3.1 52.5Venezuela . . . . . . . . . . . . . . . . . . . . . . . . –15.3 –4.7 . . .
Sources: Joint External Debt Hub, Quarterly External Debt Statistics; national authorities; and IMF staff estimates and projections.Note: All country averages are weighted by nominal GDP converted to US dollars at average market exchange rates in the years indicated and based on data availability.1 Pension projections rely on authorities’ estimates when these are available. For European Union (EU) countries, pension projections are based on The 2018 Ageing Report of the European Commission. When authorities’ estimates are not available, IMF staff projections use the methodology described in Clements, Eich, and Gupta’s Equitable and Sustainable Pensions: Challenges and Experience (IMF 2014). These pension spending projections can be different from the previous edition of the Fiscal Monitor because of new baseline pension numbers, as well as new labor force participation rate numbers from the International Labour Organization.2 For net present value calculations, a discount rate of 1 percent a year in excess of GDP growth is used for each economy. 3 IMF staff projections for health care spending are driven by demographics and other factors. The difference between the growth of health care spending and real GDP growth that is not explained by demographics (“excess cost growth”) is assumed to start at the economy-specific historical average and converge to the advanced economy historical average by 2050 (0.8 percent). 4 “Gross financing need” is defined as the projected overall balance and maturing government debt in 2021. Data are from IMF staff projections.5 Average-term-to-maturity data refer to government securities; the source is Bloomberg Finance L.P.6 Nonresident holding of general government debt data are the third quarter of 2020 or latest available from the Joint External Debt Hub, Quarterly External Debt Statistics, which include marketable and nonmarketable debt. For some countries, tradable instruments in the Joint External Debt Hub are reported at market value. External debt in US dollars is converted to local currency, then taken as a percentage of 2020 gross general government debt.7 Note that the pension spending projections reported in the first and second column do not include savings from the pension reform approved in October 2019.8 The average-term-to-maturity data for Turkey is in accordance with the published data for central government debt securities as of July 2020.9 Data are for the nonfinancial public sector, which includes central government, local government, social security funds, nonfinancial public corporations, and Banco de Seguros del Estado. The coverage of fiscal data was changed from the consolidated public sector to the nonfinancial public sector with the October 2019 submission. With this narrower coverage, the central bank balances are not included in the fiscal data. Historical data were also revised accordingly.
©International Monetary Fund. Not for Redistribution
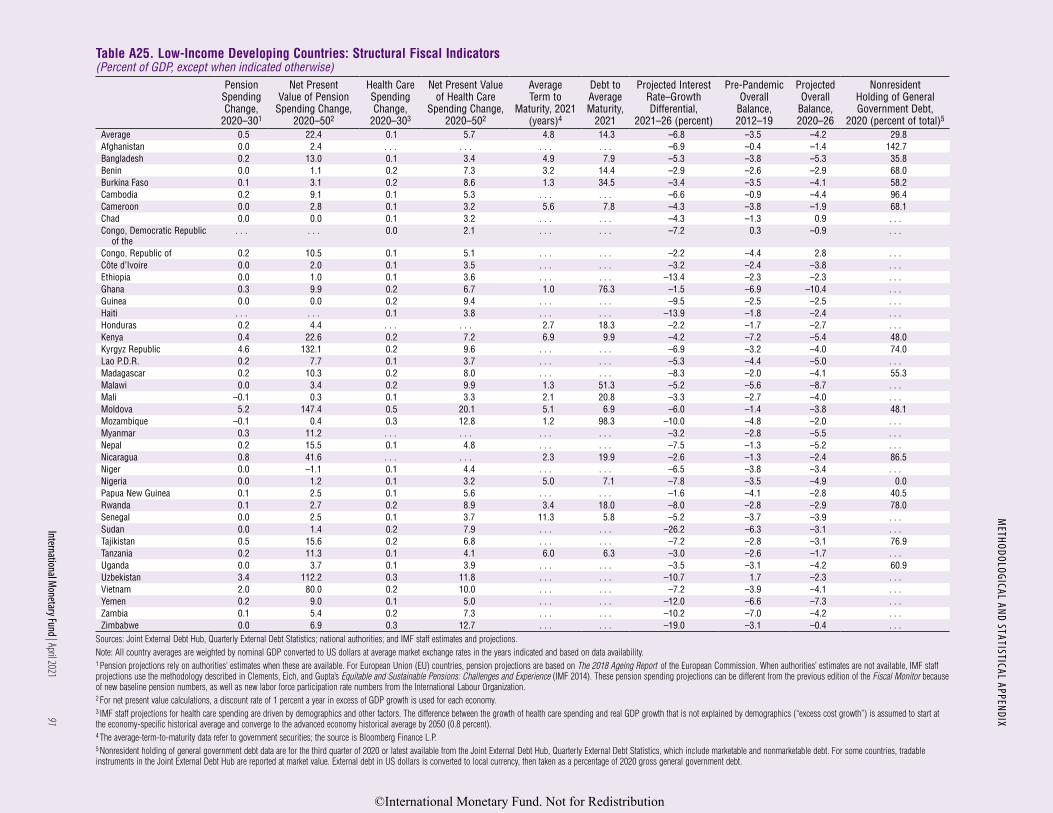
91International M
onetary Fund | April 2021
METHODOLOGICAL AND STATISTICAL APPENDIX
Table A25. Low-Income Developing Countries: Structural Fiscal Indicators(Percent of GDP, except when indicated otherwise)
Pension Spending Change,
2020–301
Net Present Value of Pension
Spending Change, 2020–502
Health Care Spending Change,
2020–303
Net Present Value of Health Care
Spending Change, 2020–502
Average Term to
Maturity, 2021 (years)4
Debt to Average Maturity,
2021
Projected Interest Rate–Growth Differential,
2021–26 (percent)
Pre-Pandemic Overall
Balance, 2012–19
Projected Overall
Balance, 2020–26
Nonresident Holding of General Government Debt,
2020 (percent of total)5
Average 0.5 22.4 0.1 5.7 4.8 14.3 –6.8 –3.5 –4.2 29.8Afghanistan 0.0 2.4 . . . . . . . . . . . . –6.9 –0.4 –1.4 142.7Bangladesh 0.2 13.0 0.1 3.4 4.9 7.9 –5.3 –3.8 –5.3 35.8Benin 0.0 1.1 0.2 7.3 3.2 14.4 –2.9 –2.6 –2.9 68.0Burkina Faso 0.1 3.1 0.2 8.6 1.3 34.5 –3.4 –3.5 –4.1 58.2Cambodia 0.2 9.1 0.1 5.3 . . . . . . –6.6 –0.9 –4.4 96.4Cameroon 0.0 2.8 0.1 3.2 5.6 7.8 –4.3 –3.8 –1.9 68.1Chad 0.0 0.0 0.1 3.2 . . . . . . –4.3 –1.3 0.9 . . .Congo, Democratic Republic
of the. . . . . . 0.0 2.1 . . . . . . –7.2 0.3 –0.9 . . .
Congo, Republic of 0.2 10.5 0.1 5.1 . . . . . . –2.2 –4.4 2.8 . . .Côte d’Ivoire 0.0 2.0 0.1 3.5 . . . . . . –3.2 –2.4 –3.8 . . .Ethiopia 0.0 1.0 0.1 3.6 . . . . . . –13.4 –2.3 –2.3 . . .Ghana 0.3 9.9 0.2 6.7 1.0 76.3 –1.5 –6.9 –10.4 . . .Guinea 0.0 0.0 0.2 9.4 . . . . . . –9.5 –2.5 –2.5 . . .Haiti . . . . . . 0.1 3.8 . . . . . . –13.9 –1.8 –2.4 . . .Honduras 0.2 4.4 . . . . . . 2.7 18.3 –2.2 –1.7 –2.7 . . .Kenya 0.4 22.6 0.2 7.2 6.9 9.9 –4.2 –7.2 –5.4 48.0Kyrgyz Republic 4.6 132.1 0.2 9.6 . . . . . . –6.9 –3.2 –4.0 74.0Lao P.D.R. 0.2 7.7 0.1 3.7 . . . . . . –5.3 –4.4 –5.0 . . .Madagascar 0.2 10.3 0.2 8.0 . . . . . . –8.3 –2.0 –4.1 55.3Malawi 0.0 3.4 0.2 9.9 1.3 51.3 –5.2 –5.6 –8.7 . . .Mali –0.1 0.3 0.1 3.3 2.1 20.8 –3.3 –2.7 –4.0 . . .Moldova 5.2 147.4 0.5 20.1 5.1 6.9 –6.0 –1.4 –3.8 48.1Mozambique –0.1 0.4 0.3 12.8 1.2 98.3 –10.0 –4.8 –2.0 . . .Myanmar 0.3 11.2 . . . . . . . . . . . . –3.2 –2.8 –5.5 . . .Nepal 0.2 15.5 0.1 4.8 . . . . . . –7.5 –1.3 –5.2 . . .Nicaragua 0.8 41.6 . . . . . . 2.3 19.9 –2.6 –1.3 –2.4 86.5Niger 0.0 –1.1 0.1 4.4 . . . . . . –6.5 –3.8 –3.4 . . .Nigeria 0.0 1.2 0.1 3.2 5.0 7.1 –7.8 –3.5 –4.9 0.0Papua New Guinea 0.1 2.5 0.1 5.6 . . . . . . –1.6 –4.1 –2.8 40.5Rwanda 0.1 2.7 0.2 8.9 3.4 18.0 –8.0 –2.8 –2.9 78.0Senegal 0.0 2.5 0.1 3.7 11.3 5.8 –5.2 –3.7 –3.9 . . .Sudan 0.0 1.4 0.2 7.9 . . . . . . –26.2 –6.3 –3.1 . . .Tajikistan 0.5 15.6 0.2 6.8 . . . . . . –7.2 –2.8 –3.1 76.9Tanzania 0.2 11.3 0.1 4.1 6.0 6.3 –3.0 –2.6 –1.7 . . .Uganda 0.0 3.7 0.1 3.9 . . . . . . –3.5 –3.1 –4.2 60.9Uzbekistan 3.4 112.2 0.3 11.8 . . . . . . –10.7 1.7 –2.3 . . .Vietnam 2.0 80.0 0.2 10.0 . . . . . . –7.2 –3.9 –4.1 . . .Yemen 0.2 9.0 0.1 5.0 . . . . . . –12.0 –6.6 –7.3 . . .Zambia 0.1 5.4 0.2 7.3 . . . . . . –10.2 –7.0 –4.2 . . .Zimbabwe 0.0 6.9 0.3 12.7 . . . . . . –19.0 –3.1 –0.4 . . .
Sources: Joint External Debt Hub, Quarterly External Debt Statistics; national authorities; and IMF staff estimates and projections.Note: All country averages are weighted by nominal GDP converted to US dollars at average market exchange rates in the years indicated and based on data availability. 1 Pension projections rely on authorities’ estimates when these are available. For European Union (EU) countries, pension projections are based on The 2018 Ageing Report of the European Commission. When authorities’ estimates are not available, IMF staff projections use the methodology described in Clements, Eich, and Gupta’s Equitable and Sustainable Pensions: Challenges and Experience (IMF 2014). These pension spending projections can be different from the previous edition of the Fiscal Monitor because of new baseline pension numbers, as well as new labor force participation rate numbers from the International Labour Organization.2 For net present value calculations, a discount rate of 1 percent a year in excess of GDP growth is used for each economy. 3 IMF staff projections for health care spending are driven by demographics and other factors. The difference between the growth of health care spending and real GDP growth that is not explained by demographics (“excess cost growth”) is assumed to start at the economy-specific historical average and converge to the advanced economy historical average by 2050 (0.8 percent). 4 The average-term-to-maturity data refer to government securities; the source is Bloomberg Finance L.P.5 Nonresident holding of general government debt data are for the third quarter of 2020 or latest available from the Joint External Debt Hub, Quarterly External Debt Statistics, which include marketable and nonmarketable debt. For some countries, tradable instruments in the Joint External Debt Hub are reported at market value. External debt in US dollars is converted to local currency, then taken as a percentage of 2020 gross general government debt.
©International Monetary Fund. Not for Redistribution

This page intentionally left blank
©International Monetary Fund. Not for Redistribution
International Monetary Fund | April 2021 93
Fiscal Monitor ArchivesA Fair Shot April 2021
Policies for the Recovery October 2020
Policies to Support People During the COVID-19 Pandemic April 2020
How to Mitigate Climate Change October 2019
Curbing Corruption April 2019
Managing Public Wealth October 2018
Capitalizing on Good Times April 2018
Tackling Inequality October 2017
Achieving More with Less April 2017
Debt: Use It Wisely October 2016
Acting Now, Acting Together April 2016
The Commodities Roller Coaster: A Fiscal Framework for Uncertain Times October 2015
Now Is the Time: Fiscal Policies for Sustainable Growth April 2015
Back to Work: How Fiscal Policy Can Help October 2014
Public Expenditure Reform: Making Difficult Choices April 2014
Taxing Times October 2013
Fiscal Adjustment in an Uncertain World April 2013
Taking Stock: A Progress Report on Fiscal Adjustment October 2012
Balancing Fiscal Policy Risks April 2012
Addressing Fiscal Challenges to Reduce Economic Risks September 2011
Shifting Gears April 2011
Fiscal Exit: From Strategy to Implementation November 2010
Navigating the Fiscal Challenges Ahead May 2010
I. AdjustmentCapitalizing on Good Times April 2018
Defining and Measuring Fiscal Space April 2017, Annex 1.1
China: What Do We Know about the General Government’s Balance Sheet? October 2016, Box 1.1
Brazil: Private Debt and the Strength of the Public Sector Balance Sheet October 2016, Box 1.3
Fiscal Consolidations with Progressive Measures April 2014, Box 2.4
Constructing an Index of the Difficulty of Fiscal Adjustment October 2013, Box 1
Medium-Term Fiscal Adjustment in an Uncertain World April 2013, Chapter 2
The Appropriate Pace of Short-Term Fiscal Adjustment April 2013, Box 2
Fiscal Adjustment in the United States: Making Sense of the Numbers April 2013, Box 5
Taking Stock: A Progress Report on Fiscal Adjustment October 2012, Chapter 2
Distributional Consequences of Alternative Fiscal Consolidation Measures: Reading from the Data October 2012, Appendix 1
Easy Does It: The Appropriate Pace of Fiscal Consolidation April 2012, Chapter 3
Experience with Large Fiscal Adjustment Plans in Ireland and Portugal April 2012, Box A2.1
Fiscal Multipliers in Expansions and Contractions April 2012, Appendix 1
Early Lessons from Experiences with Large Fiscal Adjustment Plans April 2012, Appendix 2
Fiscal Adjustment Plans and Medium-Term Fiscal Outlook November 2010, Chapter 3
To Tighten or Not to Tighten: This Is the Question November 2010, Box 1.2
SELECTED TOPICS
©International Monetary Fund. Not for Redistribution
F I S C A L M O N I TO R: A FA I R S H OT
94 International Monetary Fund | April 2021
Fiscal Adjustment and Income Distribution in Advanced and Emerging Economies November 2010, Appendix 3
The Fiscal Policy Outlook: Adjustment Needs and Plans May 2010, Chapter 3
Adjustment Measures and Institutions May 2010, Chapter 4
Fiscal Adjustment Requirements: Gross and Net Debt Targets May 2010, Appendix 2
II. Commodities and EnergyGovernance in the Extractive Industries April 2019, Box 2.1
Bolivia: Inequality Decline during a Commodity Boom October 2017, Box 1.3
The Fiscal Impact of Lower Oil Prices April 2015, Chapter 1
Reforming Energy Subsidies April 2015, Box 1.2
Reforming Energy Subsidies April 2013, Appendix 1
Fiscal Developments in Oil-Producing Economies September 2011, Box 3
Fuel and Food Price Shocks and Fiscal Performance in Low-Income Countries September 2011, Box 8
Pass-Through and Fiscal Impact of Rising Fuel Prices April 2011, Box 1.2
Reforming Petroleum Subsidies May 2010, Appendix 5
III. Country CasesPersistent Consequences of Wealth Inequality for the Next Generation’s Income: The Case of Norway April 2021, Box 2.1
A Wave of Protests: Economic Reforms and Social Unrest April 2020, Box 1.2
Fiscal Measures in Selected Economies in Response to the COVID-19 Pandemic April 2020, Special Feature Online Annex 1.1
The Macroeconomic Effects of Public Investment: A Model-Based Analysis April 2020, Online Annex 2.1
China: State-Owned Enterprises Remain Key Players April 2020, Online Annex 3.1
Brazil: A Complex and, at Times, Turbulent Relationship between SOEs and the Government April 2020, Online Annex 3.2
Ghana: Risks in SOEs Can Spill Over to Other Sectors and the Budget April 2020, Online Annex 3.5
How to Get the Most Out of SOEs: The Nordic Example April 2020, Online Annex 3.7
China: How Can Fiscal Policy Support Economic Activity and Rebalancing? April 2019, Box 1.2
The Distributional Effects of Income Tax Cuts in the United States April 2018, Box 1.2
International Tax Policy Implications from US Corporate Tax Reform April 2018, Box 1.3
General Government Debt and Fiscal Risks in China April 2018, Box 1.4
Digital Government April 2018, Chapter 2
Digitalization Advances in Revenue Administration in South Africa and Estonia April 2018, Box 2.1
The Digitalization of Public Finances: Country Case Studies April 2018, Annex 2.1
Bolivia: Inequality Decline during a Commodity Boom October 2017, Box 1.3
Adopting a Universal Basic Income to Support Subsidy Reform in India October 2017, Box 1.6
Model Simulations October 2017, Annex 1.3
Making Growth More Inclusive in China April 2017, Box 1.3
Colombia: Labor Tax Reform and the Shift from Informal to Formal Employment April 2017, Box 2.2
Mozambique: Differential Tax Treatment across Firms April 2017, Box 2.3
Innovation in Brazil, Russia, India, China, and South Africa (BRICS) October 2016, Box 2.4
Lowflation and Debt in the Euro Area October 2014, Box 1.1
Fiscal Challenges in the Pacific Island Countries April 2014, Box 1.3
Fiscal Reforms to Unlock Economic Potential in the Arab Countries in Transition October 2013, Box 2
Fiscal Adjustment in the United States: Making Sense of the Numbers April 2013, Box 5
Lessons from Sweden October 2012, Box 2
The “Two-Pack”: Further Reforms to Fiscal Governance in the Euro Area October 2012, Box 6
Ireland: The Impact of Crisis and Fiscal Policies on Inequality October 2012, Box 8
The “Fiscal Compact”: Reforming EU Fiscal Governance April 2012, Box 5
©International Monetary Fund. Not for Redistribution

International Monetary Fund | April 2021 95
S E L E C T E D TO P I C S
Experience with Large Fiscal Adjustment Plans in Ireland and Portugal April 2012, Box A2.1
Subnational Government Response to the Financial Crisis in the United States and Canada April 2012, Box A3.1
The Dog That Didn’t Bark (So Far): Low Interest Rates in the United States and Japan September 2011, Chapter 3
United States: Government-Sponsored Enterprises and Contingent Liabilities September 2011, Box 1
Fiscal Aspects of EU Economic Governance Reforms April 2011, Box 4.1
The U.S. National Commission Report April 2011, Box A5.1
The European Union: Reforming Fiscal Governance November 2010, Box 3.2
Increasing Social Expenditures and Household Consumption in China May 2010, Box 4
Health Care Reforms in the United States May 2010, Box 5
IV. Crises, ShocksFinancing Constraints and the Strategy for Investment October 2020, Online Annex 2.1
Assessing the Impact of the COVID-19 Crisis on Monthly Investment Budgets October 2020, Online Annex 2.2
Database of Country Fiscal Measures in Response to the COVID-19 Pandemic October 2020, Online Only
An Unprecedented Fiscal Response: A Closer Look October 2020, Box 1.2
Policies to Support People During the COVID-19 Pandemic April 2020, Chapter 1
Fiscal Measures in Selected Economies in Response to the COVID-19 Pandemic April 2020, Online Annex 1.1
Fiscal Implications of Potential Stress in Global Financial Markets April 2019, Box 1.1
Learning from the Crisis? Taxation and Financial Stability October 2013, Box 3
Ireland: The Impact of Crisis and Fiscal Policies on Inequality October 2012, Box 8
The Impact of the Global Financial Crisis on Subnational Government Finances April 2012, Appendix 3
The Evolution of Seigniorage during the Crisis April 2012, Box 4
Subnational Government Response to the Financial Crisis in the United States and Canada April 2012, Box A3.1
The Legacy of the Crisis: How Long Will It Take to Lower Public Debt? September 2011, Chapter 5
The G-20 Economies: Crisis-Related Discretionary Fiscal Stimulus November 2010, Box 1.1
Update on Crisis-Related Discretionary Fiscal Stimulus in G-20 Economies May 2010, Appendix 1
The Impact of the Crisis on Subnational Governments May 2010, Appendix 4
V. Emerging MarketsGeneral Government Debt and Fiscal Risks in China April 2018, Box 1.4
Digitalization Advances in Revenue Administration in South Africa and Estonia April 2018, Box 2.1
The Digitalization of Public Finances: Country Case Studies April 2018, Annex 2.1
Innovation in Brazil, Russia, India, China, and South Africa (BRICS) October 2016, Box 2.4
Nonresident Holdings of Emerging Market Economy Debt April 2014, Box 1.2
Potential Sources of Contingent Liabilities in Emerging Market Economies April 2013, Box 4
Fiscal Fundamentals and Global Spillovers in Emerging Economies April 2012, Box 2
Too Good to Be True? Fiscal Developments in Emerging Economies September 2011, Chapter 4
Determinants of Domestic Bond Yields in Emerging Economies September 2011, Box 4
VI. EmploymentThe Direct Labor Impact of Public Investment October 2020, Online Annex 2.4
Colombia: Labor Tax Reform and the Shift from Informal to Formal Employment April 2017, Box 2.2
Can Fiscal Policies Do More for Jobs? October 2014, Chapter 2
Methodology for Estimating the Impact of Fiscal Consolidation on Employment October 2014, Appendix 1
Do Old Workers Crowd Out the Youth? October 2014, Box 2.2
Fiscal Policies to Address Weak Employment October 2012, Appendix 2
©International Monetary Fund. Not for Redistribution

F I S C A L M O N I TO R: A FA I R S H OT
96 International Monetary Fund | April 2021
VII. Financial SectorState-Owned Banks April 2020, Box 3.2
The Fiscal Implications of International Bond Issuance by Low-Income Developing Countries October 2014, Box 1.2
Nonresident Holdings of Emerging Market Economy Debt April 2014, Box 1.2
A One-Off Capital Levy? October 2013, Box 6
Bond Yields and Stability of the Investor Base April 2013, Box 3
Long-Run and Short-Run Determinants of Sovereign Bond Yields in Advanced Economies October 2012, Box 3
Financial Sector Support October 2012, Box 4
Reassuring Markets about Fiscal Sustainability in the Euro Area September 2011, Chapter 2
Determinants of Domestic Bond Yields in Emerging Economies September 2011, Box 4
Financial Sector Support and Recovery to Date September 2011, Box 7
Financial Sector Support and Recovery to Date April 2011, Box 1.1
Sovereign Financing and Government Debt Markets November 2010, Chapter 2
Market Concerns about Economies and Default Risks November 2010, Box 2.1
Advanced Economies: Financial Market Spillovers among Sovereigns November 2010, Box 2.2
Are Sovereign Spreads Linked to Fundamentals? November 2010, Appendix 2
Measures to Finance the Cost of Financial Sector Support May 2010, Box 3
VIII. Fiscal OutlookPolicies to Support People During the COVID-19 Pandemic April 2020, Chapter 1
Fiscal Policy for a Changing Global Economy April 2019, Chapter 1
Saving for a Rainy Day April 2018, Chapter 1
Recent Fiscal Developments and Outlook April 2017, Chapter 1
Navigating a Risky World October 2016, Chapter 1
Recent Fiscal Developments and Outlook April 2015, Chapter 1
Recent Fiscal Developments and Outlook October 2014, Chapter 1
Recent Fiscal Developments and Outlook April 2014, Chapter 1
Recent Fiscal Developments and the Short-Term Outlook October 2013, Chapter 1
Recent Fiscal Developments and the Short-Term Outlook April 2013, Chapter 1
The Fiscal Outlook October 2012, Chapter 1
Moving Forward October 2012, Chapter 3
Continued Fiscal Tightening Is in Store for 2012, Particularly among Advanced Economies April 2012, Chapter 1
Conclusion and Risk Assessment April 2012, Chapter 7
Addressing Fiscal Challenges to Reduce Economic Risks: Introduction September 2011, Chapter 1
Too Good to Be True? Fiscal Developments in Emerging Economies September 2011, Chapter 4
Addressing Fiscal Challenges to Reduce Economic Risks: Conclusion September 2011, Chapter 7
Risk to the Baseline September 2011, Box 2
Fiscal Developments in Oil-Producing Economies September 2011, Box 3
The Fiscal Indicators Index September 2011, Box 5
Shocks to the Baseline Fiscal Outlook April 2011, Chapter 3
Fiscal Developments and Near-Term Outlook November 2010, Chapter 1
Fiscal Adjustment Plans and Medium-Term Fiscal Outlook November 2010, Chapter 3
Assessing Fiscal Risks November 2010, Chapter 4
The Near- and Medium-Term Fiscal Outlook May 2010, Chapter 1
IX. Government DebtCapitalizing on Good Times April 2018
Private Debt and Its Discontents April 2018, Box 1.1
©International Monetary Fund. Not for Redistribution

International Monetary Fund | April 2021 97
S E L E C T E D TO P I C S
General Government Debt and Fiscal Risks in China April 2018, Box 1.4
Can Countries Sustain Higher Levels of Public Debt? April 2017, Box 1.4
Do Fiscal Rules Lower Sovereign Borrowing Costs in Countries with Weak Track Records of Fiscal Performance? April 2017, Box 1.5
Debt: Use It Wisely October 2016, Chapter 1
Debt Data Set October 2016, Annex 1.1
Private and Public Debt and the Pace of the Recovery October 2016, Annex 1.2
Interlinkages between Public and Private Debt: Selected Summary of the Literature October 2016, Annex 1.3
Policies during Deleveraging Episodes October 2016, Annex 1.5
How Much Do Financial Markets Value Government Balance Sheets? October 2016, Box 1.5
Skeletons in the Closet? Shedding Light on Contingent Liabilities April 2016, Box 1.3
Lowflation and Debt in the Euro Area October 2014, Box 1.1
Moment of Truth: Unfunded Pension Liabilities and Public Debt Statistics April 2014, Box 1.1
Public Debt Dynamics and Fiscal Adjustment in Low-Income Countries in Sub-Saharan Africa April 2013, Box 6
Debt Ratios Are Still on the Rise, but Peaks Are within Sight April 2012, Chapter 2
High Gross Debt Levels May Overstate Challenges in the Short Run . . . April 2012, Chapter 4
. . . But Long-Run Debt-Related Challenges Remain Large April 2012, Chapter 5
The Legacy of the Crisis: How Long Will It Take to Lower Public Debt? September 2011, Chapter 5
Factors Underlying the Debt Increase Precrisis versus End-2015 September 2011, Box 6
The Importance of Monitoring Both Gross and Net Debt September 2011, Appendix 3
Stock-Flow Adjustments and Their Determinants September 2011, Appendix 4
Fiscal Deficits and Debts: Development and Outlook April 2011, Chapter 1
Sovereign Financing and Government Debt Markets April 2011, Chapter 2
Debt Dynamics and the Interest Rate–Growth Differential April 2011, Box 3.1
Sovereign Financing and Government Debt Markets November 2010, Chapter 2
Are Sovereign Spreads Linked to Fundamentals? November 2010, Appendix 2
Risks to Medium-Term Public Debt Trajectories; Methodological and Statistical Appendix November 2010, Appendix 4
Implications of Fiscal Developments for Government Debt Markets May 2010, Chapter 2
Debt Dynamics in G-20 Economies: An Update May 2010, Box 1
Gross versus Net Debt May 2010, Box 2
Fiscal Adjustment Requirements: Gross and Net Debt Targets May 2010, Appendix 2
Government Debt and Growth May 2010, Appendix 3
X. Private DebtPrivate Debt and Public Sector Risk October 2020, Box 1.1
Private Debt and Its Discontents April 2018, Box 1.1
Debt: Use It Wisely October 2016, Chapter 1
Debt Data Set October 2016, Annex 1.1
Private and Public Debt and the Pace of Recovery October 2016, Annex 1.2
Interlinkages between Public and Private Debt: Selected Summary of the Literature October 2016, Annex 1.3
Private Deleveraging and the Role of Fiscal Policy October 2016, Annex 1.4
Policies during Deleveraging Episodes October 2016, Annex 1.5
Benefits of Targeted Fiscal Intervention during Times of Private Deleveraging October 2016, Box 1.4
XI. GrowthIDEAS to Respond to Weaker Growth April 2020, Chapter 2
Factors Underlying Low Growth and Low Interest Rates April 2020, Box 2.1
Fiscal Policy for a Changing Global Economy April 2019, Chapter 1
China: How Can Fiscal Policy Support Economic Activity and Rebalancing? April 2019, Box 1.2
Tackling Inequality October 2017, Chapter 1
©International Monetary Fund. Not for Redistribution
F I S C A L M O N I TO R: A FA I R S H OT
98 International Monetary Fund | April 2021
A Greater Role for Fiscal Policy April 2017, Chapter 1
Upgrading the Tax System to Boost Productivity April 2017, Chapter 2
Making Growth More Inclusive in China April 2017, Box 1.3
Taxation and Growth: Details Matter October 2013, Box 4
Debt Dynamics and the Interest Rate–Growth Differential April 2011, Box 3.1
Interest Rate–Growth Differential November 2010, Appendix 1
Government Debt and Growth May 2010, Appendix 3
XII. Innovation, Entrepreneurship, Research, Development, and InvestmentPublic Investment for the Recovery October 2020, Chapter 2
Maintaining Quality When Scaling Up Public Investment October 2020, Online Annex 2.3
How Green Is the Fiscal Response to the COVID-19 Crisis? October 2020, Box 1.2
Estimating Public Investment Needs for Climate Change Adaptation October 2020, Box 2.1
The Macroeconomic Effects of Public Investment: A Model-Based Analysis April 2020, Online Annex 2.1
Digital Government April 2018, Chapter 2
The Role of Patents for Innovation October 2016, Box 2.1
Fiscal Policy and Green Innovation October 2016, Box 2.2
Does Preferential Tax Treatment of Income from Intellectual Property Promote Innovation? October 2016, Box 2.3
Innovation in Brazil, Russia, India, China, and South Africa (BRICS) October 2016, Box 2.4
Programs for Young Innovators and Start-Ups October 2016, Box 2.5
Fiscal Policy, Research and Development, and Total Factor Productivity Growth October 2016, Annex 2.1
Corrective Fiscal Incentives for Research and Development October 2016, Annex 2.2
Taxation and Entrepreneurship October 2016, Annex 2.4
Fiscal Policies for Innovation and Growth April 2016, Chapter 2
XIII. Interest RatesThe Dog That Didn’t Bark (So Far): Low Interest Rates in the United States and Japan September 2011, Chapter 3
Debt Dynamics and the Interest Rate–Growth Differential April 2011, Box 3.1
Interest Rate–Growth Differential November 2010, Appendix 1
XIV. Low-Income CountriesDigital Government April 2018, Chapter 2
Digitalization and Property Taxation in Developing Economies April 2018, Box 2.2
Digitalizing Government Payments in Developing Economies April 2018, Box 2.3
The Digitalization of Public Finances: Country Case Studies April 2018, Annex 2.1
The Fiscal Implications of Slowing Global Trade for Emerging Market and Developing Economies April 2016, Box 1.1
The Fiscal Implications of International Bond Issuance by Low-Income Developing Countries October 2014, Box 1.2
Confronting Trade-Offs: Accommodating Spending Pressures in Low-Income Countries September 2011, Chapter 6
Global Fuel and Food Price Shocks and Fiscal Performance in Low-Income Countries September 2011, Box 8
XV. Policy and ReformFiscal Policies to Address the COVID-19 Pandemic October 2020, Chapter 1
IDEAS to Respond to Weaker Growth April 2020, Chapter 2
Capitalizing on Good Times April 2018
Tackling Inequality October 2017, Chapter 1
Upgrading the Tax System to Boost Productivity April 2017, Chapter 2
What Are the Budgetary Costs and Gains of Structural Reforms? April 2017, Box 1.2
Do Fiscal Rules Lower Sovereign Borrowing Costs in Countries with Weak Track Records of Fiscal Performance? April 2017, Box 1.5
Debt: Use It Wisely October 2016, Chapter 1
©International Monetary Fund. Not for Redistribution

International Monetary Fund | April 2021 99
S E L E C T E D TO P I C S
Policies during Deleveraging Episodes October 2016, Annex 1.5
Benefits of Targeted Fiscal Interventions at Times of Private Deleveraging October 2016, Box 1.4
An Active, Supportive Role for Fiscal Policy April 2015, Chapter 1
Can Fiscal Policy Stabilize Output? April 2015, Chapter 2
Public Expenditure Reform: Making Difficult Choices April 2014, Chapter 2
Expenditure Rules: Effective Tools for Sound Fiscal Policy April 2014, Appendix 1
The Future of the State: Testing the Wagner and Baumol Hypotheses April 2014, Box 2.1
Fiscal Reforms to Unlock Economic Potential in the Arab Countries in Transition October 2013, Box 2
Tricks of the Trade October 2013, Box 5
How Can Fiscal Councils Strengthen Fiscal Performance? April 2013, Box 1
Commonly Used Definitions of the Fiscal Balance October 2012, Box 1
The “Two-Pack”: Further Reforms to Fiscal Governance in the Euro Area October 2012, Box 6
Anchoring Medium-Term Fiscal Credibility: The Second Generation of Fiscal Rules April 2012, Chapter 6
Measuring Fiscal Space: A Critical Review of Existing Methodologies April 2012, Box 1
The “Fiscal Compact”: Reforming EU Fiscal Governance April 2012, Box 5
Assessing the Cyclicality of Subnational Government Policies April 2012, Box A3.2
“Fiscal Devaluation”: What Is It—and Does It Work? September 2011, Appendix 1
Fiscal Aspects of EU Economic Governance Reforms April 2011, Box 4.1
Fiscal Transparency under Pressure April 2011, Appendix 2
The European Union: Reforming Fiscal Governance November 2010, Box 3.2
Fiscal Rules—Recent Developments May 2010, Box 7
XVI. Privatization, Public EnterprisesExperience with Privatization April 2020, Box 3.1
General Government Nonfinancial Assets: What Do We Know? October 2012, Box 7
Government Shares in Publicly Listed Companies April 2012, Box 3
United States: Government-Sponsored Enterprises and Contingent Liabilities September 2011, Box 1
Adjusting Public Capital Stock for Investment Inefficiency September 2011, Box 9
Insights for Privatization Plans from Previous Large Episodes September 2011, Appendix 2
XVII. RevenueDigital Government April 2018, Chapter 2
Digitalization Advances in Revenue Administration in South Africa and Estonia April 2018, Box 2.1
Digitalization and Property Taxation in Developing Economies April 2018, Box 2.2
Small Business Taxation and the P2P Economy April 2018, Box 2.5
The Digitalization of Public Finances: Country Case Studies April 2018, Annex 2.1
Estimating the Impact of Digitalization on Tax Evasion from Cross-Border Fraud April 2018, Annex 2.2
Estimating the Distribution of Tax Revenue Collection from Offshore Income and Wealth Following Improved Cross-Country Information Exchange April 2018, Annex 2.3
Upgrading the Tax System to Boost Productivity April 2017, Chapter 2
Past, Present, and Future Patterns in Revenues April 2015, Box 1.1
Assessing Potential Revenue: Two Approaches October 2013, Appendix 2
Increasing Revenue from Real Property Taxes October 2013, Appendix 3
Past Episodes of Sustained Fiscal Revenue Increases May 2010, Box 6
XVIII. Social ExpendituresSmart Strategies to Contain the COVID-19 Pandemic October 2020, Online Annex 1.2
From Lockdown to Recovery: Spending Measures to Support Livelihoods during the COVID-19 Crisis October 2020, Online Annex 1.3
Understanding the Implications of Different Types of Fiscal Measures for Public Finances April 2020, Box 1.1
©International Monetary Fund. Not for Redistribution

F I S C A L M O N I TO R: A FA I R S H OT
100 International Monetary Fund | April 2021
IDEAS to Respond to Weaker Growth April 2020, Chapter 2
State-Owned Enterprises: The Other Government April 2020, Chapter 3
Digital Government April 2018, Chapter 2
Tackling Inequality October 2017, Chapter 1
The Fiscal Response to the Refugee Influx in Europe April 2016, Box 1.2
The Pressure of Age-Related Spending on Public Debt in Advanced Economies April 2015, Box 1.3
Targeted Employer Social Security Contribution Cuts: Lessons from Experiences in Advanced Economies October 2014, Box 2.1
Public Expenditure Reform: Making Difficult Choices April 2014, Chapter 2
Moment of Truth: Unfunded Pension Liabilities and Public Debt Statistics April 2014, Box 1.1
Structural Measures and Social Dialogue April 2014, Box 2.2
Health System Inefficiencies April 2014, Box 2.3
Recent Developments in Public Health Spending and Outlook for the Future October 2013, Appendix 1
Confronting Trade-Offs: Accommodating Spending Pressures in Low-Income Countries September 2011, Chapter 6
Potential Reform Strategies to Contain the Growth of Public Health Spending April 2011, Box A1.1
The U.S. National Commission Report April 2011, Box A5.1
Tackling the Challenge of Health Care Reform in Advanced Economies April 2011, Appendix 1
Selected Spending and Tax Issues November 2010, Chapter 5
Advanced Economies: The Outlook for Public Health Spending November 2010, Box 3.1
Increasing Social Expenditures and Household Consumption in China May 2010, Box 4
Health Care Reforms in the United States May 2010, Box 5
XIX. Stabilization Policy Options to Support the Economic Recovery October 2020, Online Annex 1.5
IDEAS to Respond to Weaker Growth April 2020, Chapter 2
Can Fiscal Policy Stabilize Output? April 2015, Chapter 2
Fiscal Stabilization under Alternative Estimates of the Output Gap April 2015, Box 2.1
Boosting the Effectiveness of Automatic Stabilizers April 2015, Box 2.2
XX. StimulusPublic Investment Fiscal Multiplier and Macroeconomic Uncertainty October 2020, Online Annex 2.5
Determining the Size of Fiscal Stimulus for Sustained Recovery October 2020, Online Annex 1.4
The G-20 Economies: Crisis-Related Discretionary Fiscal Stimulus November 2010, Box 1.1
Update on Crisis-Related Discretionary Fiscal Stimulus in G-20 Economies May 2010, Appendix 1
XXI. SubsidiesDigital Government April 2018, Chapter 2
The Digitalization of Public Finances: Country Case Studies April 2018, Annex 2.1
Adopting a Universal Basic Income to Support Subsidy Reform in India October 2017, Box 1.6
Reforming Energy Subsidies April 2015, Box 1.2
Reforming Petroleum Subsidies April 2010, Appendix 5
XXII. Sustainability and Risk ManagementInvesting in Resilience October 2020, Online Annex 2.6
Estimating the Adaptation Costs of Investing in the Resilience of Physical Assets October 2020, Online Annex 2.7
State-Owned Enterprises: The Other Government April 2020, Chapter 3
Can Countries Sustain Higher Levels of Public Debt? April 2017, Box 1.4
Developing a Fiscal Risk Management Framework April 2016, Box 1.4
©International Monetary Fund. Not for Redistribution
International Monetary Fund | April 2021 101
S E L E C T E D TO P I C S
Reassuring Markets about Fiscal Sustainability in the Euro Area September 2011, Chapter 2
Assessing and Mitigating Fiscal Sustainability Risks April 2011, Chapter 4
Assessing Fiscal Sustainability Risks: Deriving a Fiscal Sustainability Risk Map April 2011, Appendix 3
XXIII. TaxationPersistent Consequences of Wealth Inequality for the Next Generation’s Income: The Case of Norway April 2021, Box 2.1Public Preferences for Progressive Taxation in the Post–COVID-19 World April 2021, Box 2.2Tax Policy and Automatic Stabilizers April 2020, Box 2.2Curbing Corruption April 2019, Chapter 2Avoiding International Tax Wars April 2019, Box 1.3 Digital Government April 2018, Chapter 2The Distributional Effects of Income Tax Cuts in the United States April 2018, Box 1.2International Tax Policy Implications from US Corporate Tax Reform April 2018, Box 1.3Digitalization Advances in Revenue Administration in South Africa and Estonia April 2018, Box 2.1Digitalization and Property Taxation in Developing Economies April 2018, Box 2.2Small Business Taxation and the P2P Economy April 2018, Box 2.5The Digitalization of Public Finances: Country Case Studies April 2018, Annex 2.1Estimating the Impact of Digitalization on Tax Evasion from Cross-Border Fraud April 2018, Annex 2.2Estimating the Distribution of Tax Revenue Collection from Offshore Income and Wealth Following
Improved Cross-Country Information Exchange April 2018, Annex 2.3Tackling Inequality October 2017, Chapter 1Measuring Tax Progressivity October 2017, Box 1.4Taxing Wealth and Wealth Transfers October 2017, Box 1.5Upgrading the Tax System to Boost Productivity April 2017, Chapter 2The Destination-Based Cash Flow Tax: A Primer April 2017, Box 1.1What Is the Effective Marginal Tax Rate? April 2017, Box 2.1Colombia: Labor Tax Reform and the Shift from Informal to Formal Employment April 2017, Box 2.2Mozambique: Differential Tax Treatment across Firms April 2017, Box 2.3Taxation and Foreign Direct Investment October 2016, Annex 2.3Taxation and Entrepreneurship October 2016, Annex 2.4 Taxing Our Way out of—or into?—Trouble October 2013, Chapter 2Learning from the Crisis? Taxation and Financial Stability October 2013, Box 3Taxation and Growth: Details Matter October 2013, Box 4A One-Off Capital Levy? October 2013, Box 6Increasing Revenue from Real Property Taxes October 2013, Appendix 3Do Pensioners Get Special Treatment on Taxes? October 2012, Box 5Containing Tax Expenditures April 2011, Appendix 5Selected Spending and Tax Issues November 2010, Chapter 5
XXIV. Poverty and InequalityPersistent Consequences of Wealth Inequality for the Next Generation’s Income: The Case of Norway April 2021, Box 2.1
Public Preferences for Progressive Taxation in the Post–COVID-19 World April 2021, Box 2.2
How Will the COVID-19 Pandemic Affect Poverty and Inequality? October 2020, Online Annex 1.1
Tackling Inequality October 2017, Chapter 1
Global Inequality Today and in 2035 October 2017, Box 1.1
Equally Distributed Equivalent Level of Income as a Measure of Social Welfare October 2017, Box 1.2
Bolivia: Inequality Decline during a Commodity Boom October 2017, Box 1.3
Inequality Dimensions: Wealth, Opportunities, and Gender October 2017, Annex 1.2
©International Monetary Fund. Not for Redistribution

This page intentionally left blank
©International Monetary Fund. Not for Redistribution
International Monetary Fund | April 2021 103
IMF EXECUTIVE BOARD DISCUSSION OF THE OUTLOOK, APRIL 2021
Executive Directors broadly agreed with the assessment of the global economic outlook, risks, and policy priorities. They welcomed the better-than-anticipated performance in
the second half of 2020, which helped to dampen the sharp drop in global growth. Directors acknowledged that the synchronized, extraordinary policy support deployed across economies has played a critical role in helping mitigate the crisis and foster the conditions for recovery. However, they agreed that the shock may have persistent effects. Medium-term output losses in emerging market and developing economies in general are likely to be larger than those in advanced econo-mies compared to pre-pandemic projections, although emerging market economies as a whole will continue to grow faster than advanced economies. Directors noted that the crisis has also likely worsened inequali-ties within countries, with young people, women, and those with lower levels of education being hit harder.
Directors noted that uncertainties around the baseline projections remain large. The economic recovery depends heavily on the path of the health crisis, including the effective deployment of vaccines and treatments and the potential evolution of the virus. Other factors include the effectiveness of policy actions in forestalling economic scarring, developments in financial conditions and commodity prices, and the ability of economies to adjust to the shock. The impact of additional fiscal support and whether pent up sav-ings built up during the pandemic translate into sharp increases in demand pose an upside risk.
Directors emphasized that accelerating vaccina-tions and distributing vaccines at affordable cost to all countries remains the key priority. The macroeconomic policy responses will need to be tailored by country, depending on the stage of the epidemic locally, the strength of their recovery, available policy space, and the structural characteristics of their economies. Priori-tizing health spending, providing well-targeted fiscal
support, and maintaining accommodative monetary policy as warranted, while monitoring financial stability risks, remain key while the pandemic continues. As the recovery progresses, policymakers would need to emphasize measures that limit scarring from the crisis, shrink inequality, and boost productive capacity (such as public investment). The transition from support measures would need to be managed carefully to avoid sudden cliffs that could derail the recovery. Particular attention to reallocation in labor markets will be impor-tant. The IMF’s tailored policy advice will be crucial.
Directors stressed that until the pandemic is brought under control globally, fiscal policy must remain flexible and supportive of health systems, the worst-affected households and viable firms, and the economic recovery. The need and scope for fiscal support varies across econ-omies, depending on the effect of the pandemic and the ability of countries to access low-cost borrowing. The targeting of measures must be enhanced and tailored to countries’ administrative capacity, and fiscal transpar-ency and governance practices should be improved.
Directors stressed the need to balance the risks from large and growing public and private debt with those from premature withdrawal of fiscal support, which could slow the recovery. Credible medium-term fiscal frameworks can help set a path for rebuilding fiscal buffers at a pace contingent on the strength of the recovery. Enhancing debt transparency and manage-ment will also be important, and some countries may require debt relief or other treatment. Directors agreed that fiscal policies should enable a green, digital, and inclusive transformation of the economy, while long-standing weaknesses in public finances should be tackled once the recovery is firmly in place. Policies should reduce gaps in access to quality public services, such as social protection, more and better health care, and education. Strengthening tax capacity, gradually expanding the base for corporate and personal income taxes and ensuring a more progressive tax system, along
The following remarks were made by the Chair at the conclusion of the Executive Board’s discussion of the Fiscal Monitor, Global Financial Stability Report, and World Economic Outlook on March 25, 2021.
©International Monetary Fund. Not for Redistribution

F I S C A L M O N I TO R: A FA I R S H OT
104 International Monetary Fund | April 2021
with improvements in spending efficiency, can help mobilize additional resources for basic services and for the Sustainable Development Goals.
Directors agreed that decisive policy action eased financial conditions and helped contain financial stability risks. They noted, however, that the support measures may also have unintended consequences. An extended period of extremely easy financial conditions could result in stretched valuations that may worsen financial vulnerabilities and put growth at risk. A multispeed recovery between advanced and emerging market economies poses a risk that financial condi-tions in emerging market and developing economies may tighten markedly, especially if advanced econo-mies move toward policy normalization and rates rise rapidly. In this context, clear guidance from advanced economy central banks, together with sound policies in emerging markets, will be important in prevent-ing financial disruption in those economies. Some Directors also noted that emerging market economies may need to resort to policy tools considered in the Integrated Policy Framework. Directors noted that in many economies the corporate sector is overindebted and weakened, especially smaller firms.
Directors agreed that ongoing support remains necessary to complete the recovery. Most Directors
noted the need to prevent financial vulnerabilities from turning into legacy issues by tightening selected mac-roprudential policy tools to tackle pockets of elevated vulnerabilities, while avoiding a broad tightening of financial conditions. Some Directors also emphasized the need to further develop tools targeting nonbank financial institutions.
Directors highlighted that emerging market and developing economies with market access should take advantage of easy financing conditions while they can. They agreed that corporate balance sheet repair is a priority, and they noted staff’s analysis that firms fac-ing temporary liquidity risks may need policy support while nonviable firms would need resolution. Direc-tors observed that the ability of banks to lend will be crucial for the success of the recovery.
Directors emphasized the importance of continued international cooperation to overcome the pandemic and strengthen the recovery. In addition to ramping up production and ensuring access to vaccines world-wide, ensuring that financially constrained countries have adequate access to international liquidity will be important. Collective solutions are also essential in the areas of climate change, international tax policy, and international trade. The IMF will continue to play a critical role.
©International Monetary Fund. Not for Redistribution

MAY
JULY
OCT
DEC
JAN
APR
2020
2021
NOV
MORE FROM THE IMF ON
INEQUALITYSINCE THE COVID-19 PANDEMIC
The IMF analyzes inequality trends and supports countries in designing policies to tackle inequality. The following include selected cross-country publications on inequality since the start of the COVID-19 pandemic.
RESEARCH DEPARTMENT
Enhancing Access to OpportunitiesG20 Note
MONETARY AND CAPITAL MARKETS DEPARTMENT
The Promise of Fintech: Financial Inclusion in the Post COVID-19 Era
Departmental Paper
EUROPEAN DEPARTMENT
Affordable Rental Housing:Making It Part of Europe’s Recovery
Departmental Paper
ASIA AND PACIFIC DEPARTMENT
COVID-19 and Inequality in Asia: Risks of Social Unrest?October 2020 Regional Economic Outlook:Asia and Pacific
FISCAL AFFAIRS DEPARTMENT
Tax Policy for Inclusive Growth After the Pandemic
Special Series Notes on COVID-19
INSTITUTE FOR CAPACITY DEVELOPMENT
How to Achieve Inclusive GrowthBook
MIDDLE EAST AND CENTRAL ASIA DEPARTMENT
Economic Governance Reforms to Support Inclusive Growth in the Middle East, North Africa, and Central AsiaDepartmental Paper
To learn more, visit IMF.org/Inequality
©International Monetary Fund. Not for Redistribution
