pavement management systems
TRANSCRIPT

By:
E-mail:
Quality Assurance/Quality Control
and
Quality Acceptance
Pavement Management Systems
John Ashley Horne

• Various Data Collected for PMS
• Automatic Road Analyzer (ARAN)
• Data Collected by the ARAN
• Data Collection Vendor’s Quality Assurance/Quality Control
• Pavement Management System’s Quality Acceptance
Pavement Management Systems – QA/QC

Overhead Clearances (Collected in 2007)
Clearance Clearance
Data Collected for PMS – cont’d
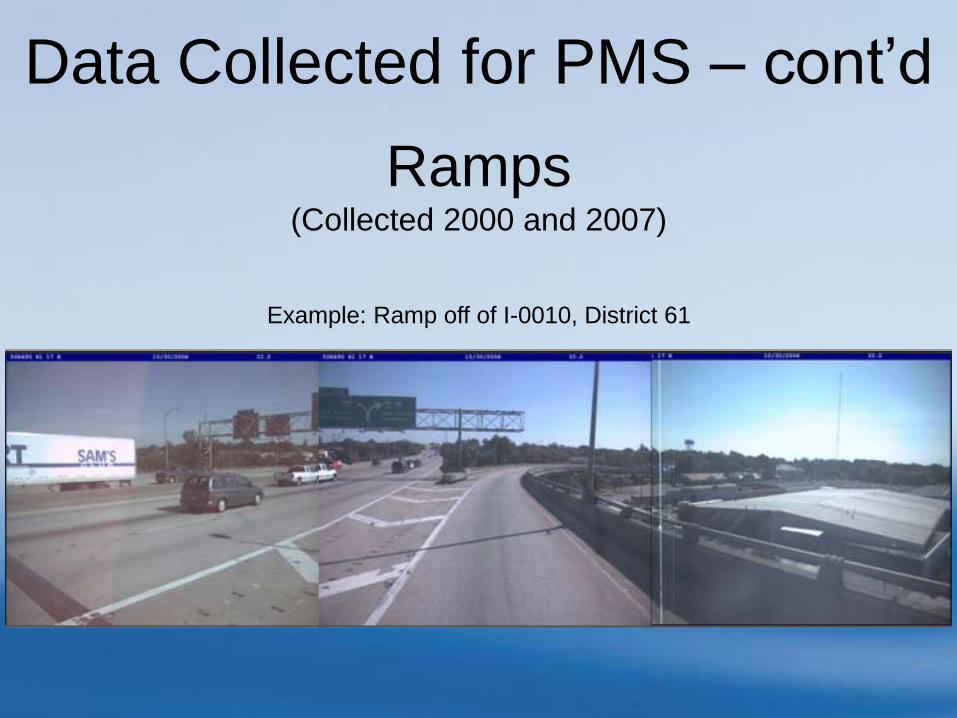
Ramps (Collected 2000 and 2007)
Example: Ramp off of I-0010, District 61
Data Collected for PMS – cont’d

Geometric Information
Data Collected for PMS – cont’d
Roadway Geometric Data
• Cross slope
• Road shoulder drop-off
• Horizontal Curves
• Vertical Curves

(1995 Statewide)
(2009 District 05,remaining Districts over next 4 years)
Data Collected for PMS – cont’d
Ground Penetrating Radar
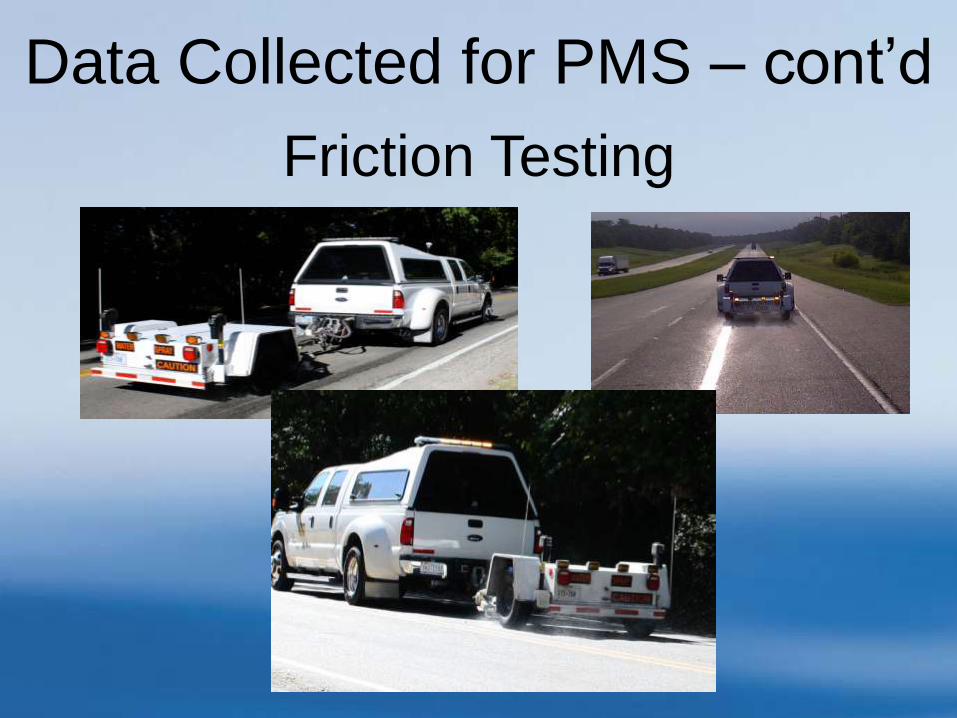
Friction Testing
Data Collected for PMS – cont’d

Rolling Wheel Deflectometer (RWD) (collected 2009)
Data Collected for PMS – cont’d

Data Collected for PMS – cont’d
Falling Weight Deflectometer (FWD)

Automatic Road Analyzer
(ARAN)

Data Collected by ARAN
• Right of Way Images
• Center view
• Right view
• Pavement Images
• Electronic Data
• Rutting
• Faulting
• International Roughness Index (IRI)
• Global Positioning System (GPS) Coordinates
• Macrotexture
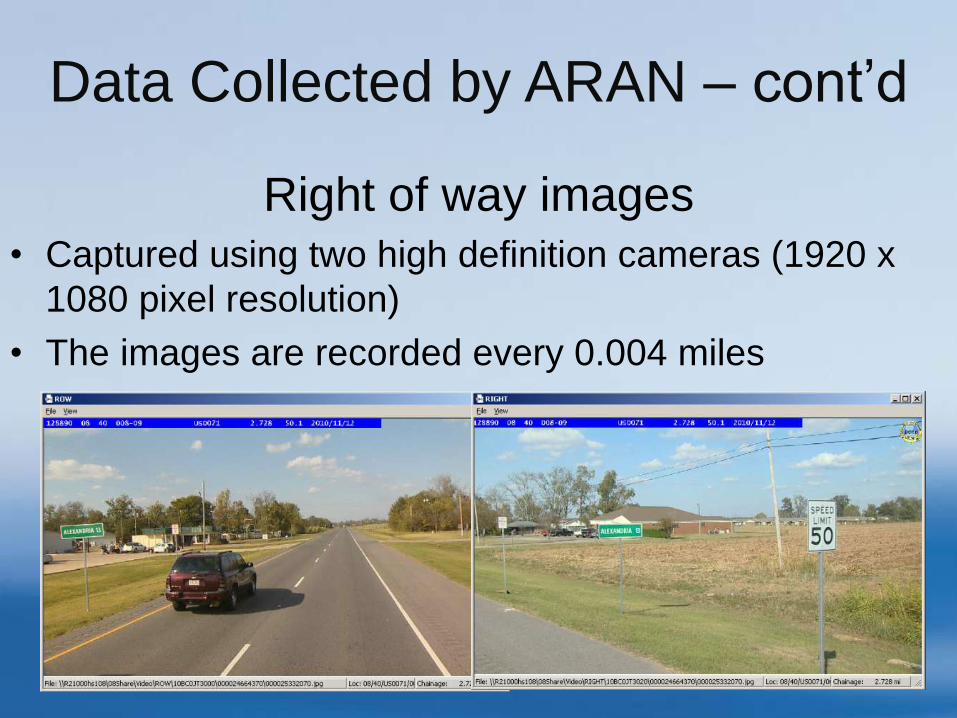
Data Collected by ARAN – cont’d
Right of way images • Captured using two high definition cameras (1920 x
1080 pixel resolution)
• The images are recorded every 0.004 miles

Data Collected by ARAN – cont’d
Pavement Images • Captured using two cameras
• 100% of the driven lane is captured
• Images stored for post processing
• Strobe lights minimize shadows
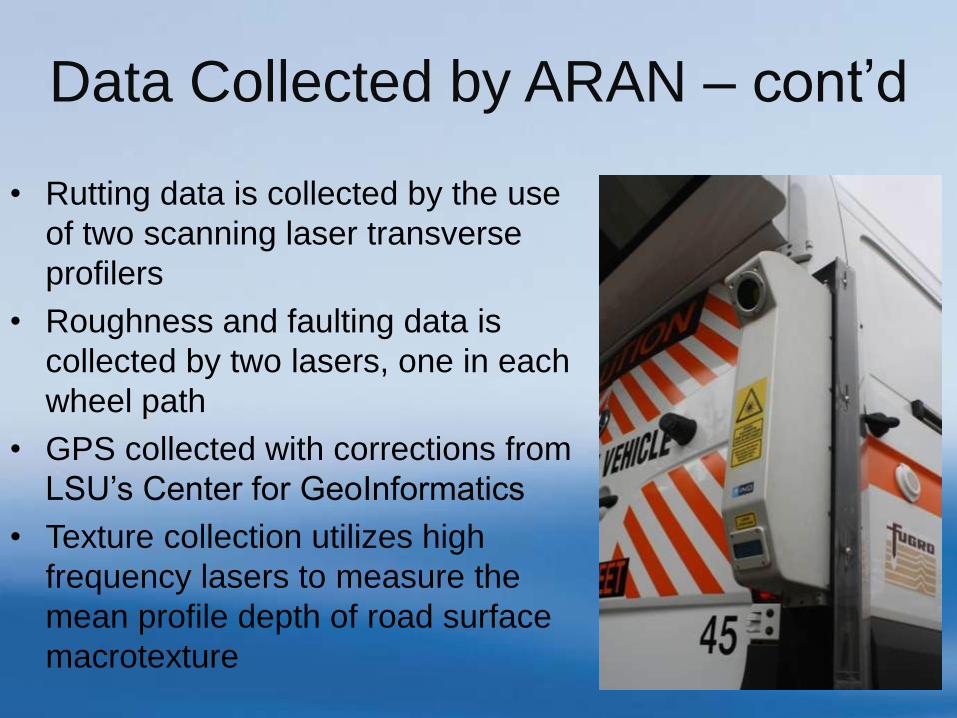
• Rutting data is collected by the use
of two scanning laser transverse
profilers
• Roughness and faulting data is
collected by two lasers, one in each
wheel path
• GPS collected with corrections from
LSU’s Center for GeoInformatics
• Texture collection utilizes high
frequency lasers to measure the
mean profile depth of road surface
macrotexture
Data Collected by ARAN – cont’d

QA/QC - Calibration Site Test
• Tested three to five times
• Electronic sensor data, full
Right-Of-Way (ROW) and
pavement images
• The collected and evaluated data are compared
with the original approved benchmark
measurements
Data Collection Vendor’s QA/QC

QA/QC - Calibration Site Test
Data Collection Vendor’s QA/QC – cont’d
Tolerance for Acceptance
• Roughness should not deviate more than 10%
• Rutting and Faulting should not deviate more than 3
mm (0.1 inches)
• Pavement distresses are critiqued on a project level
basis

• Weekly verification site
used ensure the sensors
employed by the ARAN
stay within tolerance
• Monitor systems in real time during collection
• Compare current data to previous year’s data
• Regular verification of DMI calibration
• Inter-rater consistency is maintained
Data Collection Vendor’s QA/QC
QA/QC – Maintaining Calibration

• WiseCrax
• Longitudinal cracking
• Transverse cracking
• Fatigue cracking
• DRate
• Patching
• Distresses on concrete pavements
QA/QC – Pavement Distress Ratings
Data Collection Vendor’s QA/QC – cont’d

QA/QC – Pavement Distress Ratings
Data Collection Vendor’s QA/QC – cont’d
WiseCrax
• Used on asphalt surfaces
• Distresses rated by computer
• Longitudinal cracking
• Transverse cracking
• Fatigue cracking
• Results are visually inspected and
compared to previous year’s results
• Valid lane widths
• Duplicate records
• Correct rating scheme
• Distresses not detected

QA/QC – Pavement Distress Ratings
Data Collection Vendor’s QA/QC – cont’d
WiseCrax

QA/QC – Pavement Distress Ratings
Data Collection Vendor’s QA/QC – cont’d
DRate
• Used mainly on concrete surfaces
• Distresses rated manually
• Longitudinal cracking
• Transverse cracking
• Patching (all pavement surfaces)
• Sections randomly sampled
• Results are compared to previous year’s collection

QA/QC – Pavement Distress Ratings
Data Collection Vendor’s QA/QC – cont’d
DRate

QA/QC – Pavement Distress Ratings
Data Collection Vendor’s QA/QC – cont’d
Visualization in Visidata

QA/QC – Right of Way and Pavement Images
Data Collection Vendor’s QA/QC – cont’d
• Image quality
• Brightness
• Clarity
• Missing images
• Monitored in real time
• ROW and pavement images should be synchronized
• Able to see cracking in ROW/pavement views
• Control section verification (right of way images)
• Proper image stitching (pavement images)
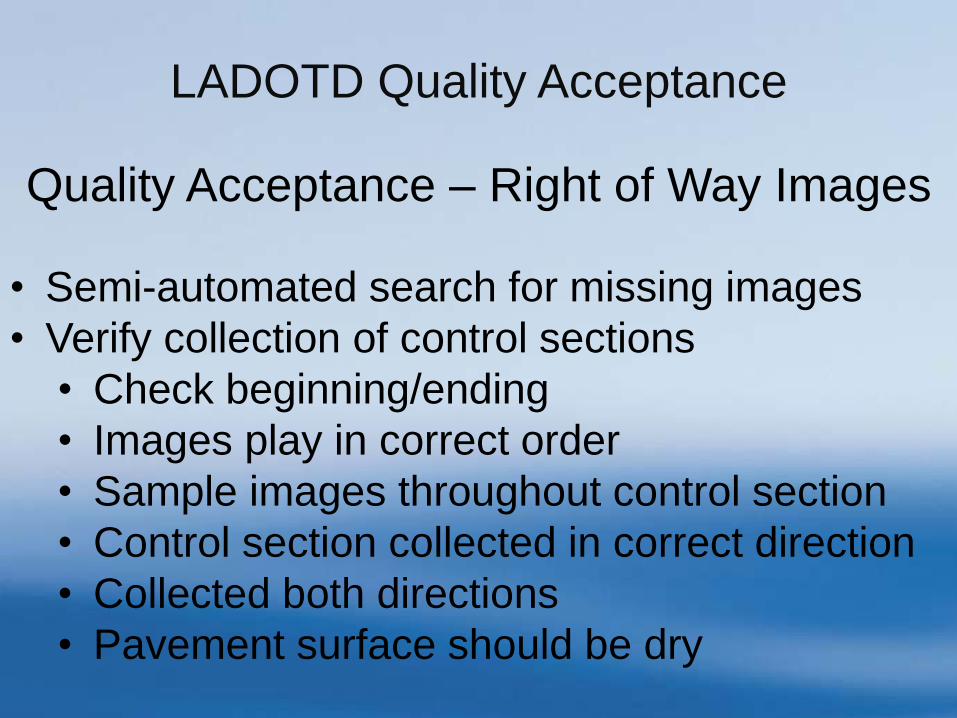
LADOTD Quality Acceptance
• Semi-automated search for missing images
• Verify collection of control sections
• Check beginning/ending
• Images play in correct order
• Sample images throughout control section
• Control section collected in correct direction
• Collected both directions
• Pavement surface should be dry
Quality Acceptance – Right of Way Images

LADOTD Quality Acceptance – cont’d
Quality Acceptance – Pavement Images
• Images quality
• Clarity
• Brightness
• Missing images
• Pavement should synchronize with ROW
• All distresses should be visible
• Look for missed distresses

LADOTD Quality Acceptance – cont’d
Quality Acceptance – Pavement Distress Data
• Distresses correctly identified/quantified
• Type
• Severity
• Extent
• Protocols were followed
• Thoroughly investigate issues
• Check database prior to import into Pavement
Management’s software
LADOTD Quality Acceptance – cont’d
Quality Acceptance – Findings Reported to Vendor
• Deficiencies are summarized and
reported to data collection vendor
for corrective action
• Issues are resolved at no additional
cost
• Some issues may require recollection
• Missing images
• Erroneous electronic data
• All corrections are resubmitted for review
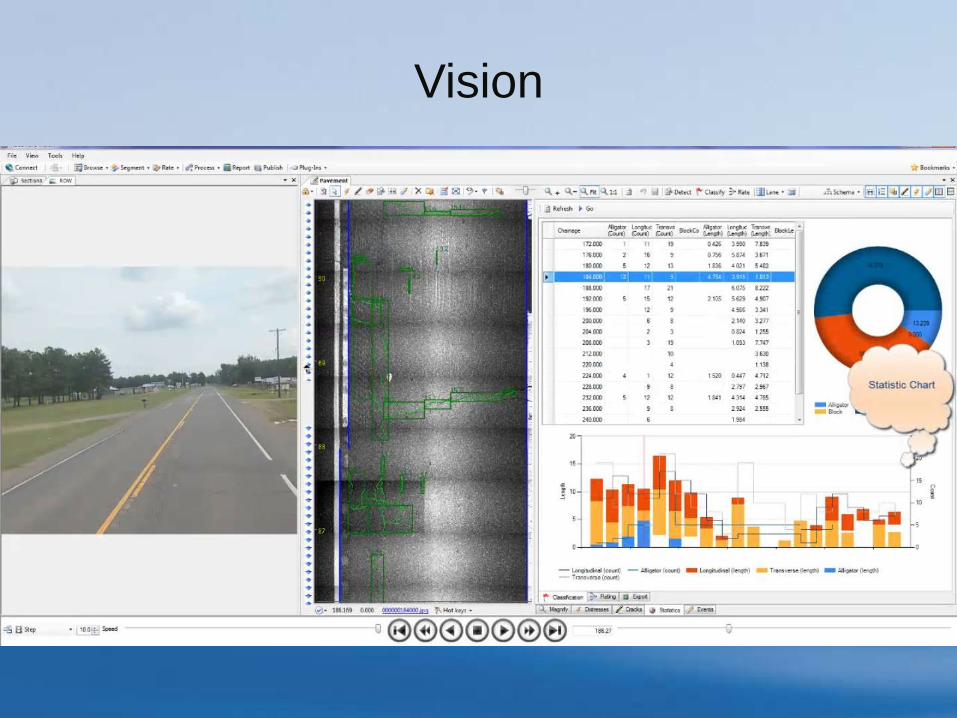
Vision

iVision

By:
E-mail:
Quality Assurance/Quality Control
and
Quality Acceptance
Pavement Management Systems
John Ashley Horne

PM Web Page and DTIMS Dash Board
Chris Fillastre : Pavement Management Engineer
E-mail : [email protected]
Phone Number : 3-4577 or (225) 242-4577

Deighton Water Model •The level of water in each can represents the % of roads in that condition
•The taps represent the process of roads deteriorating
•The pumps represent the act of fixing a road
•Electricity represents the cost of fixing a road; the more height to pump the water the more electricity
Problem:
For a fixed amount of electricity (budget) how should you distribute the electricity to the pumps so that you maximize the level of water in the top cans?
Pump
Pump
Pump
Excellent
Good
Fair
Poor
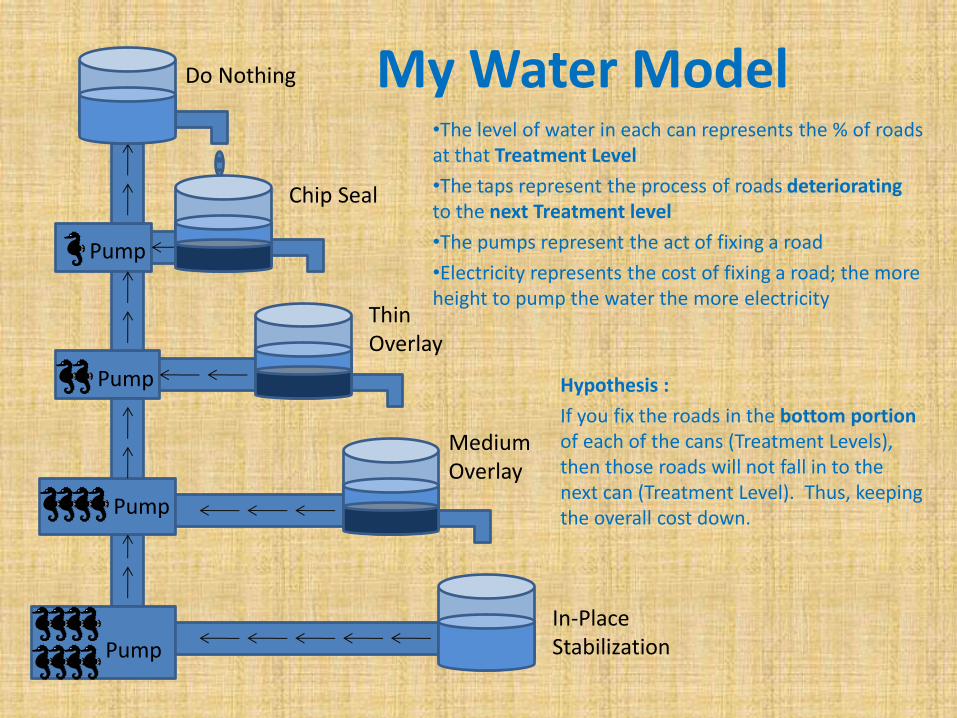
My Water Model •The level of water in each can represents the % of roads at that Treatment Level
•The taps represent the process of roads deteriorating to the next Treatment level
•The pumps represent the act of fixing a road
•Electricity represents the cost of fixing a road; the more height to pump the water the more electricity
Hypothesis :
If you fix the roads in the bottom portion of each of the cans (Treatment Levels), then those roads will not fall in to the next can (Treatment Level). Thus, keeping the overall cost down.
Pump
Pump
Pump
Do Nothing
Chip Seal
Thin Overlay
Medium Overlay
Pump
In-Place Stabilization
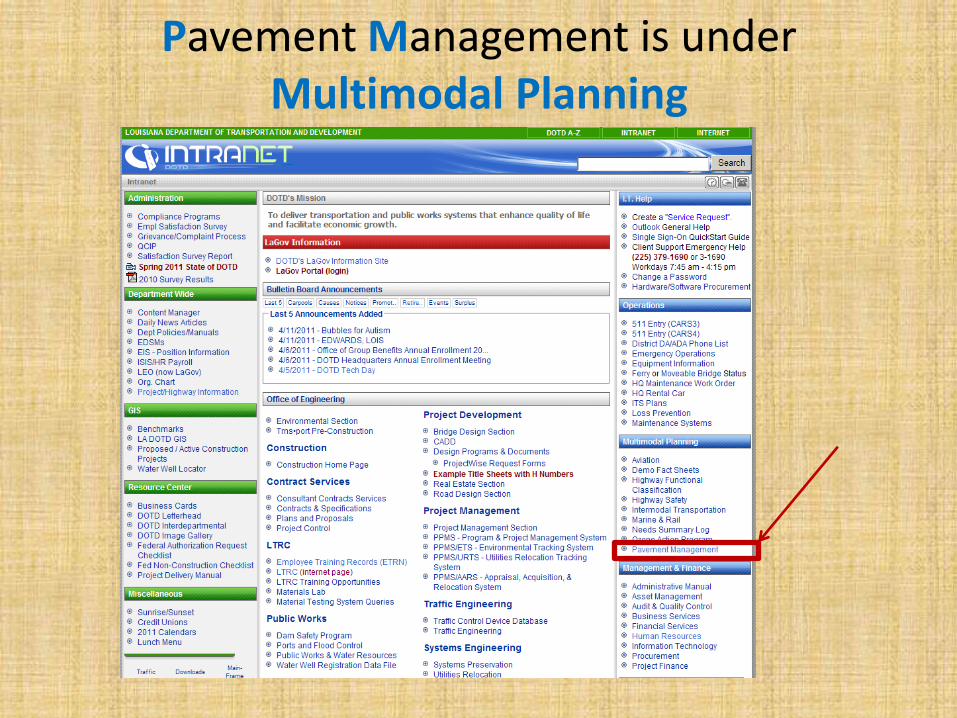
Pavement Management is under Multimodal Planning

Pavement Management is not suppose to be used for or against us in court.

Visiweb Quick Reference Screen, used to describe menus by hovering with mouse.

Visiweb Full Help, used to describe Visiweb in more detail by clicking On underlined blue words.
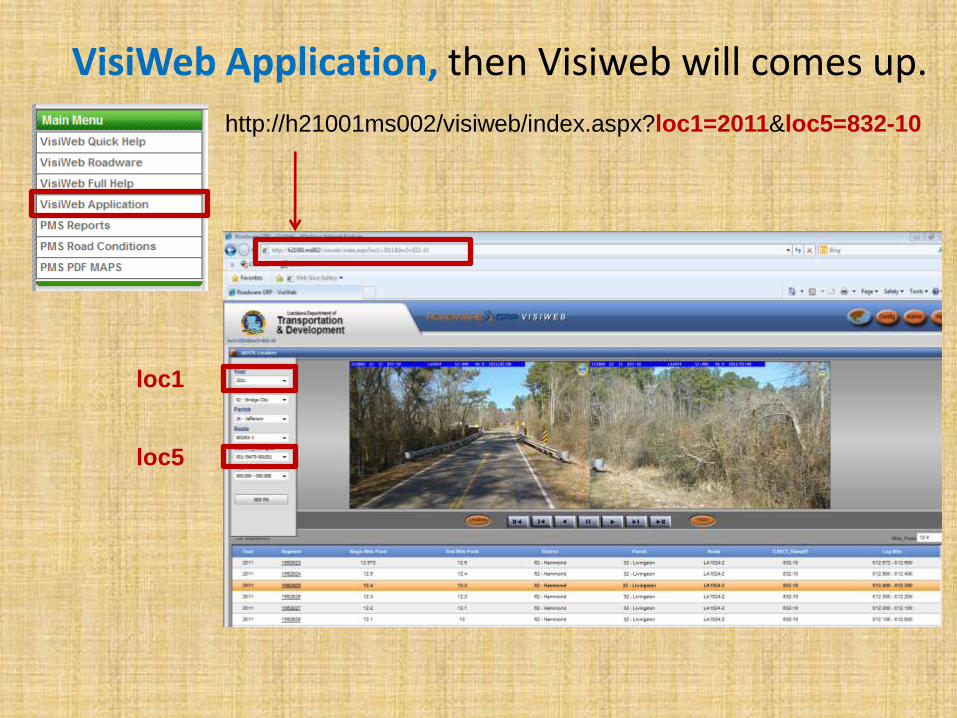
VisiWeb Application, then Visiweb will comes up.
http://h21001ms002/visiweb/index.aspx?loc1=2011&loc5=832-10
loc1
loc5

PMS Road Conditions, can call Visiweb if Active Layer Tools is set to Visiweb.
Zoom in to until you see Control Sections Numbers
Left Click on bolt then left click on Control Section Line

PMS Road Conditions, show condition based on Roughness (Tenth of a Mile Sectioning).

PMS Road Conditions, show condition based on Rutting ( Tenth of Mile Sectioning).

PMS Road Conditions, show condition based on Perfindex ( Tenth of Mile Sectioning).
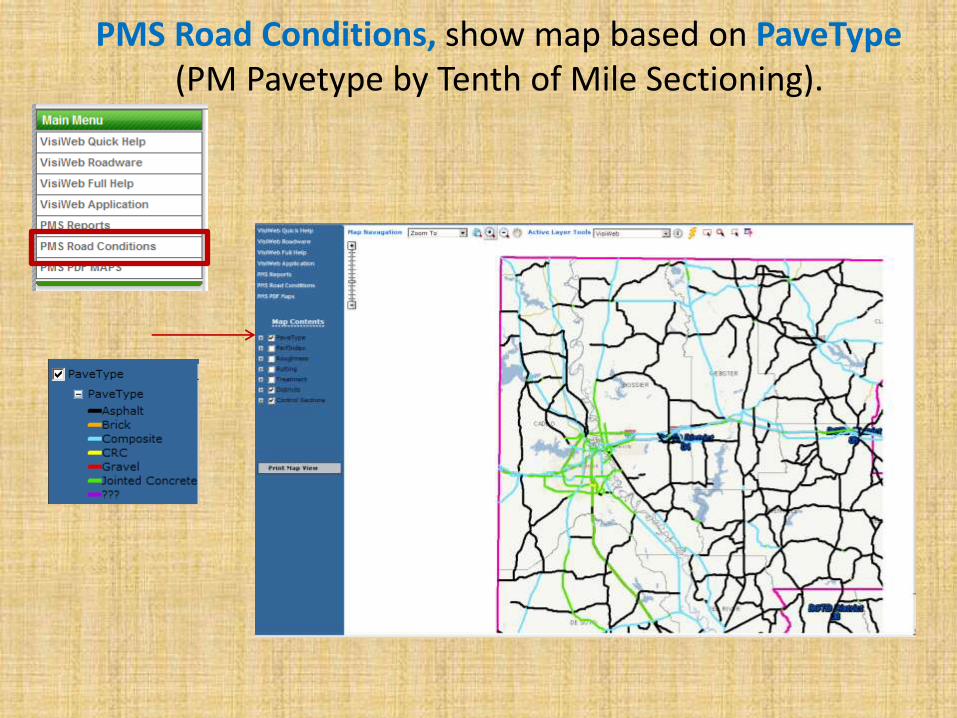
PMS Road Conditions, show map based on PaveType (PM Pavetype by Tenth of Mile Sectioning).
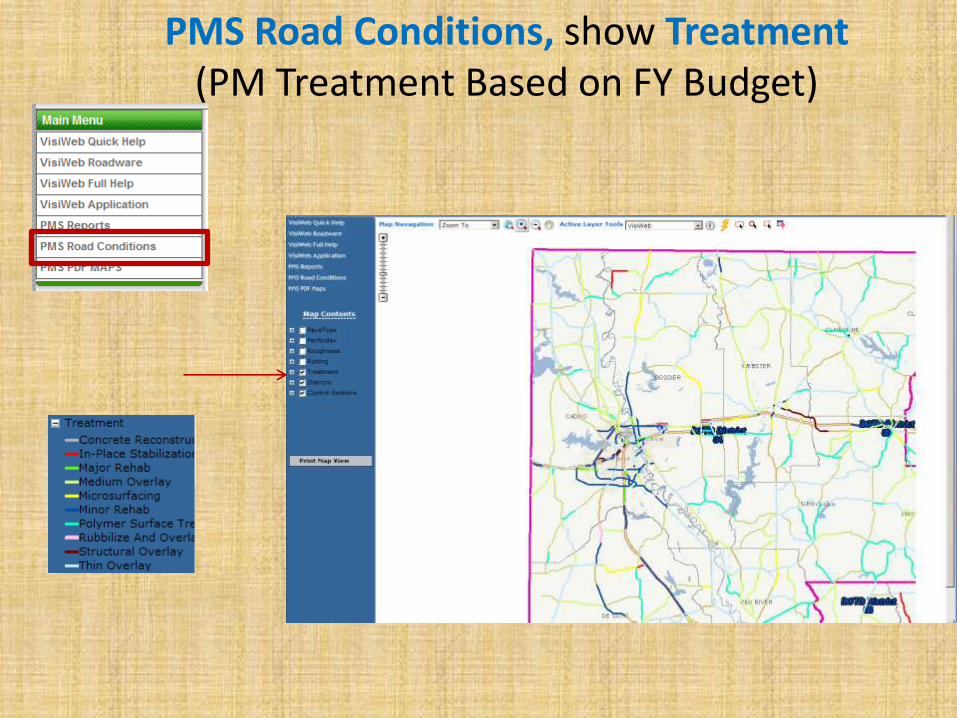
PMS Road Conditions, show Treatment (PM Treatment Based on FY Budget)

PMS PDF MAPS, used to bring up premade maps for District or Parish using Active Layer Tool.
Left Click on bolt then left click on District or Parish

PMS PDF MAPS, example District 61 Pavement Roughness FA (Federal Aid)

PMS PDF MAPS, example District 61 Pavement Roughness NFA (Non-Federal Aid)

PMS Reports button will direct to website call Dash Board

Summary of Dashboard Functions
1. Map Reports: Virtual Core (GPR and Coring)
Needs Data (Highway Needs)
2. Summary Report
3. Detailed Report
4. Index Plot
5. LADOTD Specific Help
6. LADOTD Glossary
7. Current Condition Report

Under Map Reports
Select Map Reports

View Highway Needs Data

This is how Needs Summary Log look like when it printed out including the map.
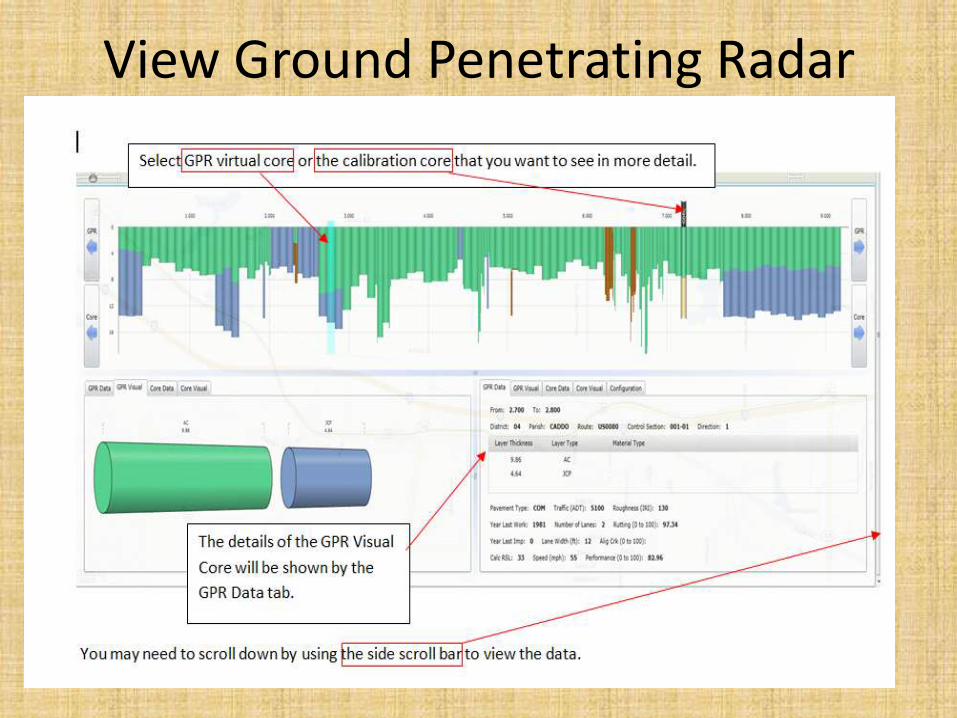
View Ground Penetrating Radar
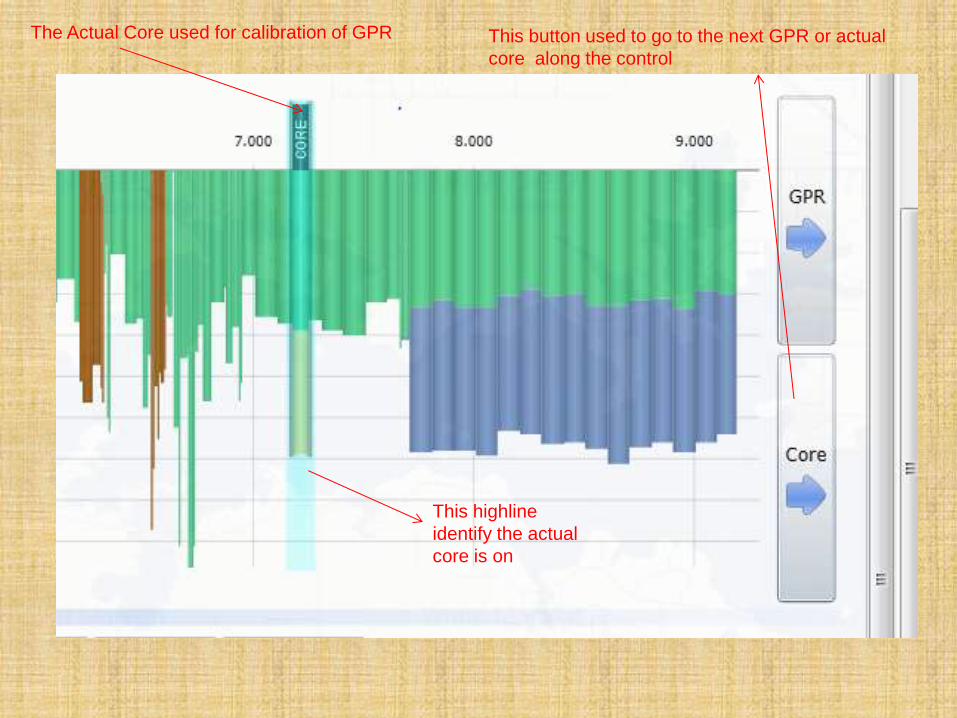
The Actual Core used for calibration of GPR This button used to go to the next GPR or actual
core along the control
This highline
identify the actual
core is on

When the actual core is on, this is
the detail information we will get
Remember to active
this tab if you want
to see detail
information of Core
Visual
Remember to active
this tab if you want
to see detail
information of Core
Data
Press this button
for copy of Core
PDF report
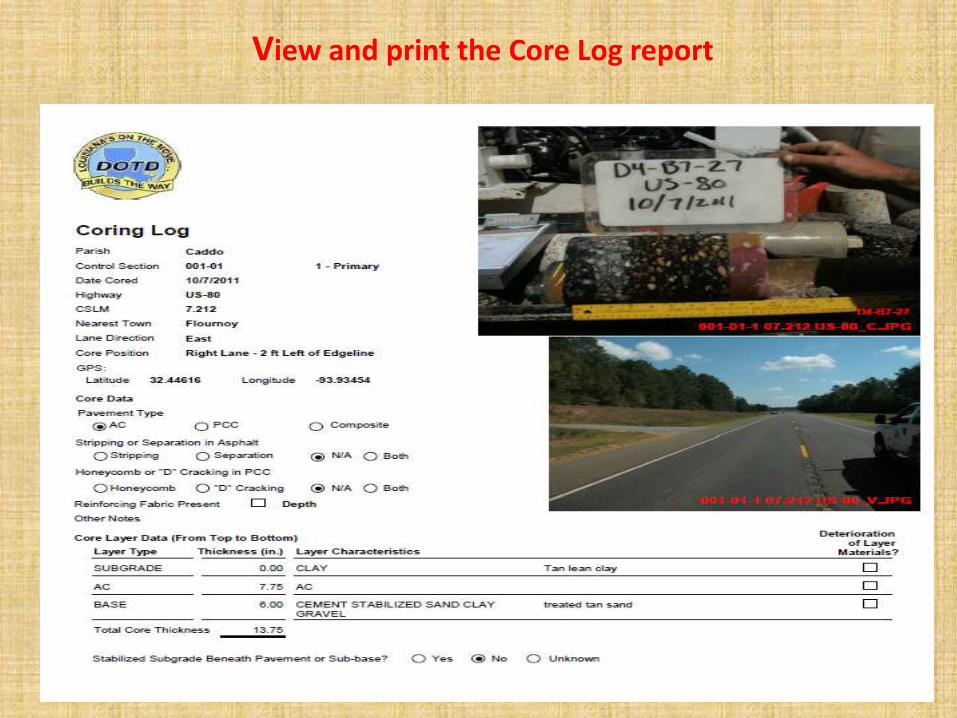
View and print the Core Log report

Generate Summary Report

After pressing the Summary Report button, the screen below will show
Two options to select, example: Needs

The List of Years to select

The List of Index

Example: Run Needs Summary Report 2011 Statewide, primary direction for all road class, asphalt pavement type, all federal aid system, index roughness.
After filling all the information, press Submit Summary Form

Summary Report detail and it can be exported to Excel or Access.

Generate Detail Report

After pressing Detail Report, the screen below will show.
The Lists of Districts, Parishes, Routes,
Control Sections, Years will show when you
click on them.
The two newest features added to search are
Control Section and Route.

Filter by Ranges
Uncheck Full Range check
box, Min Value and Max
Value check boxes will be
show therefore entering the
values needed. Apply the
same procedure for the rest
of the listed attributes.
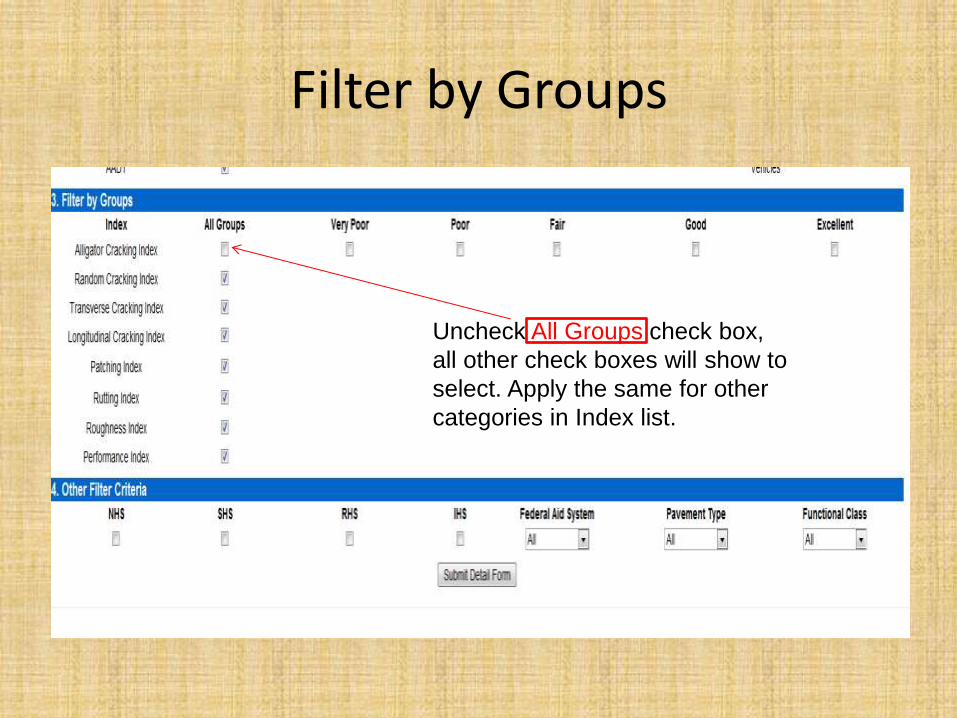
Filter by Groups
Uncheck All Groups check box,
all other check boxes will show to
select. Apply the same for other
categories in Index list.

This is an example of Detailed Report.
Used to export table to
Access and Excel
Press this button will give
all the columns for more
detail information.

How to get to Index Plot
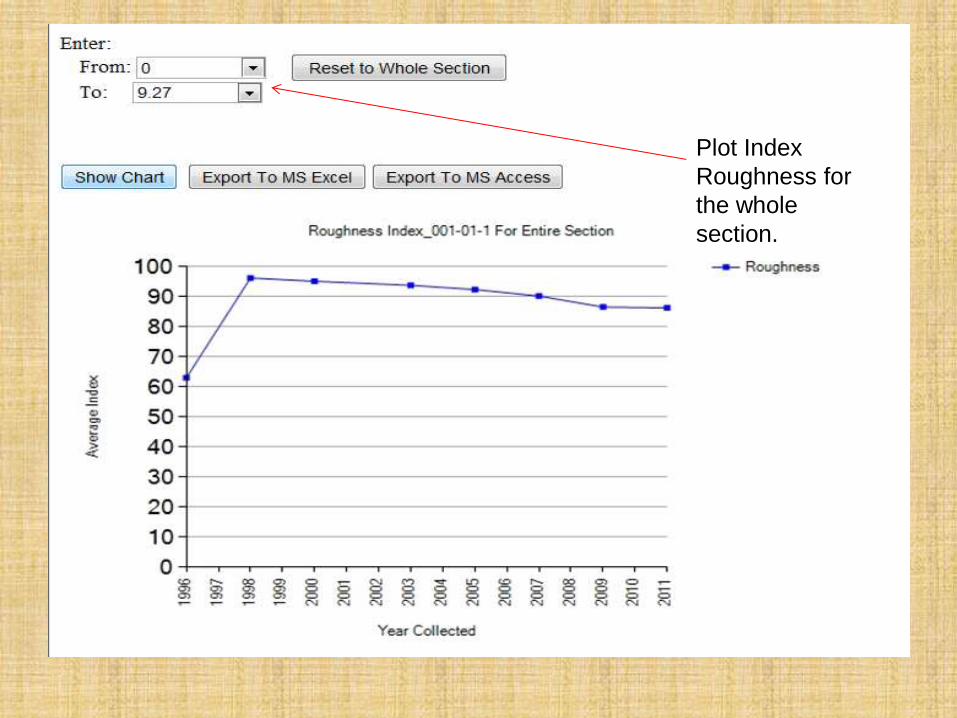
Plot Index
Roughness for
the whole
section.

This is Index Plot for Tenth Mile of Control Section 001-01-1

Ladotd Glossary

Ladotd Glossary
Scrolling down if needed

Current Condition Report

Example: Selecting STATE_WIDE for Analysis Set, District 02 for Budget Scenario, Year 2011, the Current Condition Report will look like below: including 33 pages and continuing loading.
This Icon allows export the tables
to Excel or PDF or Word

Performance Curve Regression Utility
By: Christophe Fillastre
E-mail: [email protected] Phone Number: (225)242-4577

Performance Curve Regression Utility Introduction
• Function: – Developing performance curves for LADOTD pavements families and
individual pavement without the need for external resources.
• Advantage: – More accurate curves – PMS Team would have full control over the input data – The reduction of outlying points – The type of curves being regressed
• Results: – A set of family and site specific performance curves for each condition
index that can be used for analysis. – External functions are called by dTIMS CT expression during the
generation of strategies.

Regression Utility: Opening Screen
Exit Regression Analysis:
Allows the user to exit the
Regression Utility.
View Family Results: Allows the
user to view the results of the
Family Regression and select the
curve type to use or to override
the generated curve with a user
defined curve.
View Site Specific Results:
Allows the user to view the
results of the Site Specific
Regression and use one of
the generated curves,
default the pavement
section to the family curve
or supply a user defined
curve.

Type of Curve Equations Available
• Linear
• Log
• Polynomial
• Sigmoid
• Power
• User defined Sigmoid
• Default Curve (previous Curve used by PMS)

Linear

Log
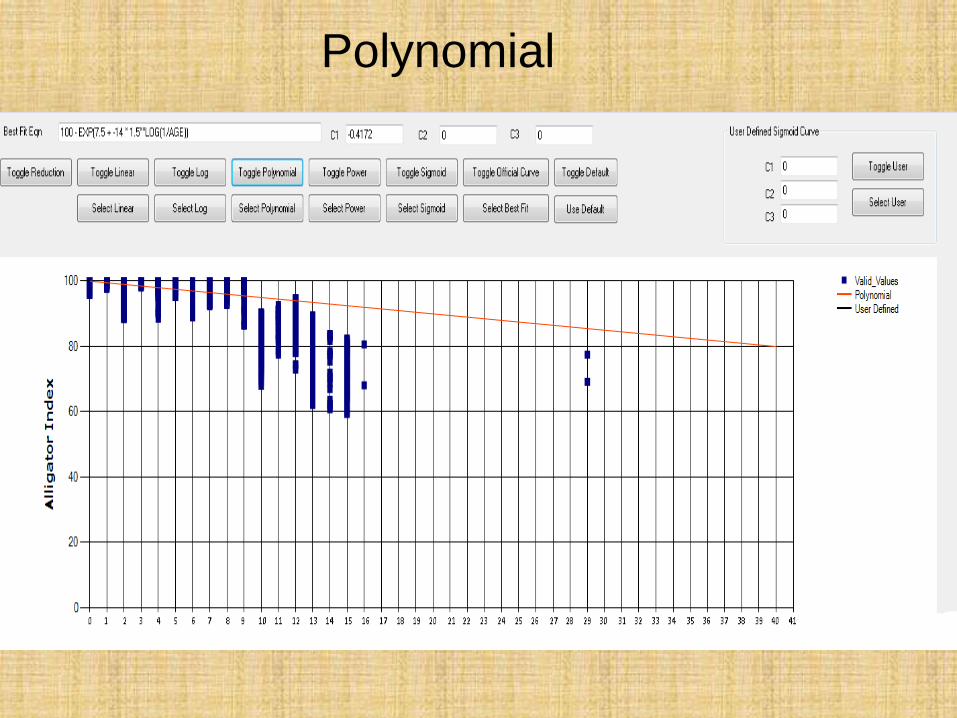
Polynomial
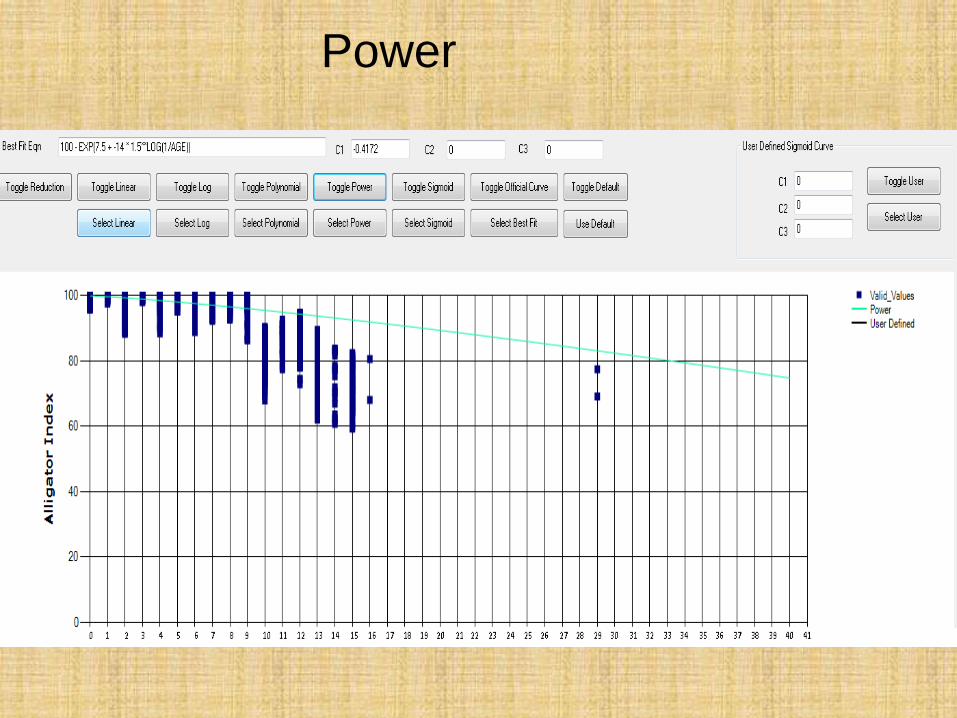
Power

Sigmoid

Default
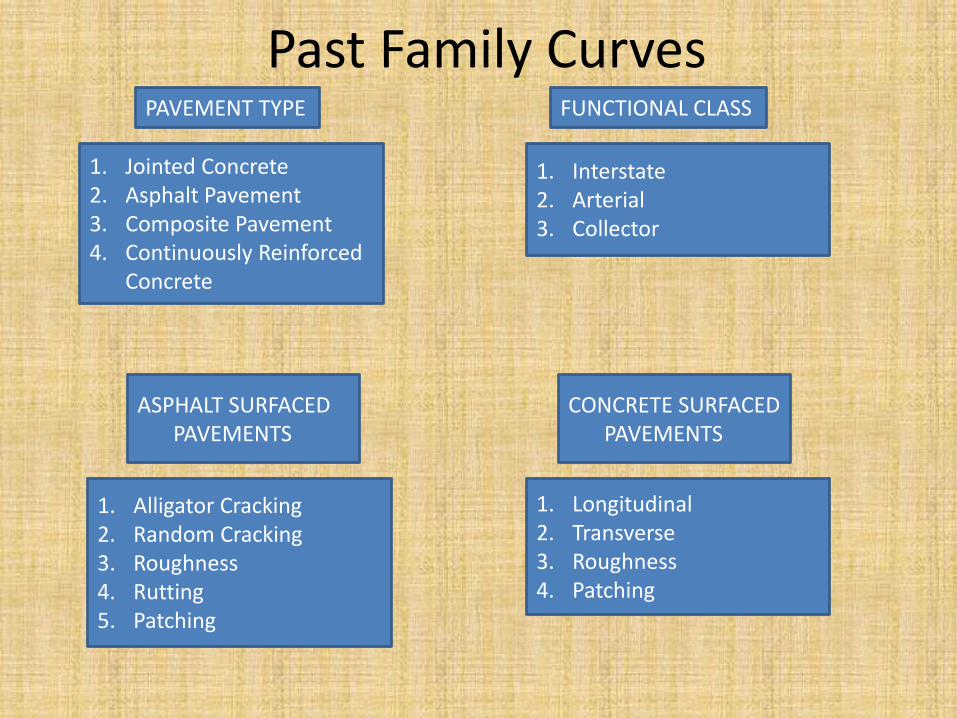
Past Family Curves
1. Jointed Concrete 2. Asphalt Pavement 3. Composite Pavement 4. Continuously Reinforced
Concrete
PAVEMENT TYPE FUNCTIONAL CLASS
1. Interstate 2. Arterial 3. Collector
ASPHALT SURFACED PAVEMENTS
1. Alligator Cracking 2. Random Cracking 3. Roughness 4. Rutting 5. Patching
CONCRETE SURFACED PAVEMENTS
1. Longitudinal 2. Transverse 3. Roughness 4. Patching

Past Family Curves
2 Asphalt Surfaced Pavements X 3 Functional Class X 5 Pavement Distress = 30 Asphalt Surfaced Family Curves
2 Concrete Surfaced Pavements X 3 Functional Class X 4 Pavement Distress = 24 Concrete Surfaced Family Curves
ASPHALT SURFACED PAVEMENTS
CONCRETE SURFACED PAVEMENTS
Total of 54 Family Curves

Future Family Curves
1. Jointed Concrete 2. Asphalt Pavement 3. Composite Pavement 4. Continuously Reinforced
Concrete
PAVEMENT TYPE FUNCTIONAL CLASS
1. Interstate 2. Principal Arterial 3. Minor Arterial 4. Major Collector 5. Minor Collector 6. Locals 7. Other
ASPHALT SURFACED PAVEMENTS
1. Alligator Cracking 2. Random Cracking 3. Roughness 4. Rutting 5. Patching
CONCRETE SURFACED PAVEMENTS
1. Longitudinal 2. Transverse 3. Roughness 4. Patching

Future Family Curves
2 Asphalt Surfaced Pavements X 7 Functional Class X 5 Pavement Distress = 70 Asphalt Surfaced Family Curves
2 Concrete Surfaced Pavements X 7 Functional Class X 4 Pavement Distress = 56 Concrete Surfaced Family Curves
ASPHALT SURFACED PAVEMENTS
CONCRETE SURFACED PAVEMENTS
Total of 126 Family Curves

We ran the software four times
• Regular Running
• No Age Greater Than 20 Years
• Removed Age 20 Years and Index Greater or equal to 80
• Without Sigmoid Curves

The Parameters Setting
Regular Run • Best fit of All curve types.
• Under Reduce Data: – Rule 1 Age<=5 and Index Value<= 50
– Rule 2 Age<=7 and Index Value<=30
– Rule 3 None Used
– Rule 4 Age>=10 and Index Value>=95
– Rule5 Age>=15 and Index Value>=90
– Standard Deviation 1 – Remove data less than 2 standard deviations from mean
– Standard Deviation 2 – Remove data greater than 1 standard deviation from mean

The Parameters Setting For Runs
• No Age Greater Than 20 Yrs: – Same as Regular Running with Rule6 Age>=20 and Index
Values>=0
• Removed Age 20 Years and Index Greater or equal to 80: – Same as Regular Running with Rule6 Age>=20 and Index
Values>=80
• Without Sigmoid: – Same as Removed Age 20 Years and Index Greater or equal to 80.
Best fit of all curve types except sigmoid.

Asphalt Surfaced Pavements • Two types:
o Asphalt o Composite
• Five types of distresses: o Alligator Cracking o Random Cracking o Roughness o Rutting o Patching
• Seven functional classes: o Interstate o Principal Arterial o Minor Arterial o Major Collector o Minor Collector o Locals o Other

Asphalt Local Alligator
0
10
20
30
40
50
60
70
80
90
100
0 10 20 30 40 50 60
ASP_LOC_Alligator
POINT_VALUE Regular Running
No Age Greater Than 20 yrs Remove Age 20 yrs & Index Greater or Equal to 80
Without Sigmoid Curves

Asphalt Local Roughness
0
20
40
60
80
100
120
0 10 20 30 40 50 60
ASP_LOC_Roughness
POINT_VALUE Regular Running
No Age Greater Than 20 Yrs Remove Age 20 Yrs & Index Greater Or Equal to 80
With out Sigmoid Curves

Asphalt Local Without Sigmoid

Asphalt Principal Arterial Alligator

Asphalt Principal Arterial Roughness

Asphalt Principal Arterial Without Sigmoid

Site Specific Curve Analysis

Future Site Specific Curves
4,447 Specific Sites
X 5 Distresses = 22,235 Curves
Asphalt Continuously Reinforced Concrete
Total of 34,896 Site Specific Curves
Composite Jointed Concrete
2,032 Specific Sites X 4 Distresses = 8,128 Curves
1,110 Specific Sites X 4 Distresses = 4,440 Curves
31 Specific Sites X 3 Distresses = 93 Curves
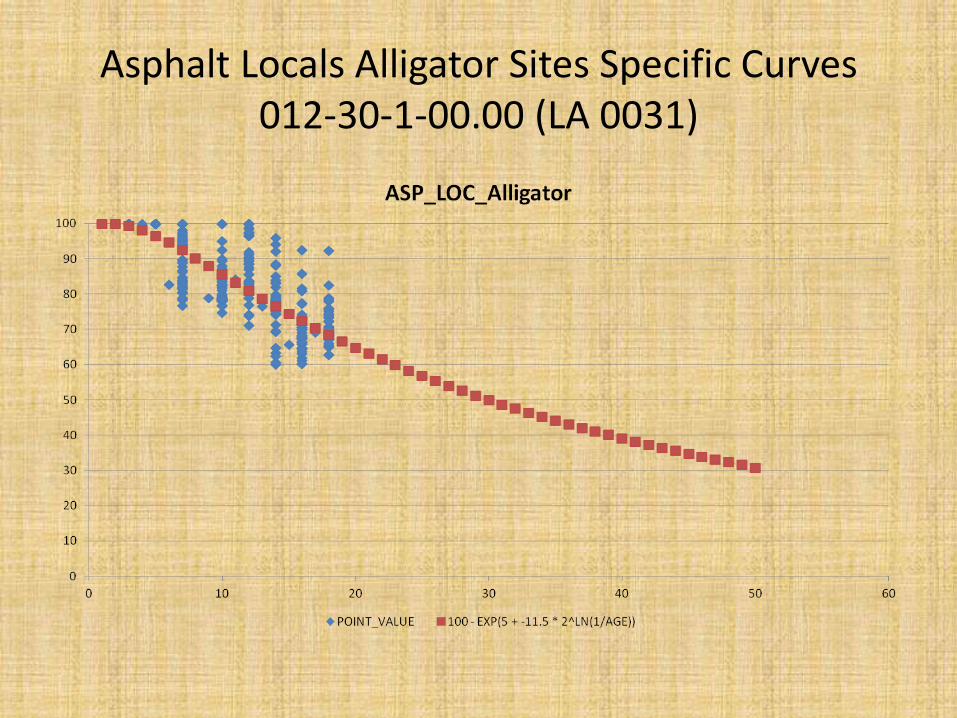
Asphalt Locals Alligator Sites Specific Curves 012-30-1-00.00 (LA 0031)

Asphalt Locals Roughness Sites Specific Curves 012-30-1-00.00 (LA 0031)
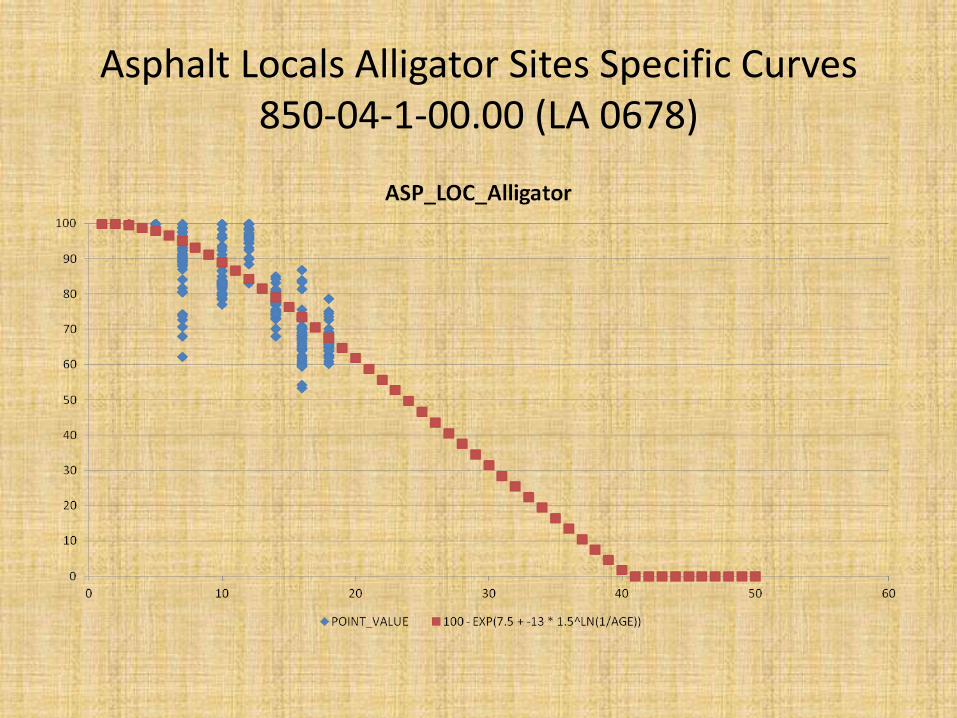
Asphalt Locals Alligator Sites Specific Curves 850-04-1-00.00 (LA 0678)

Asphalt Locals Roughness Sites Specific Curves 850-04-1-00.00 (LA 0678)
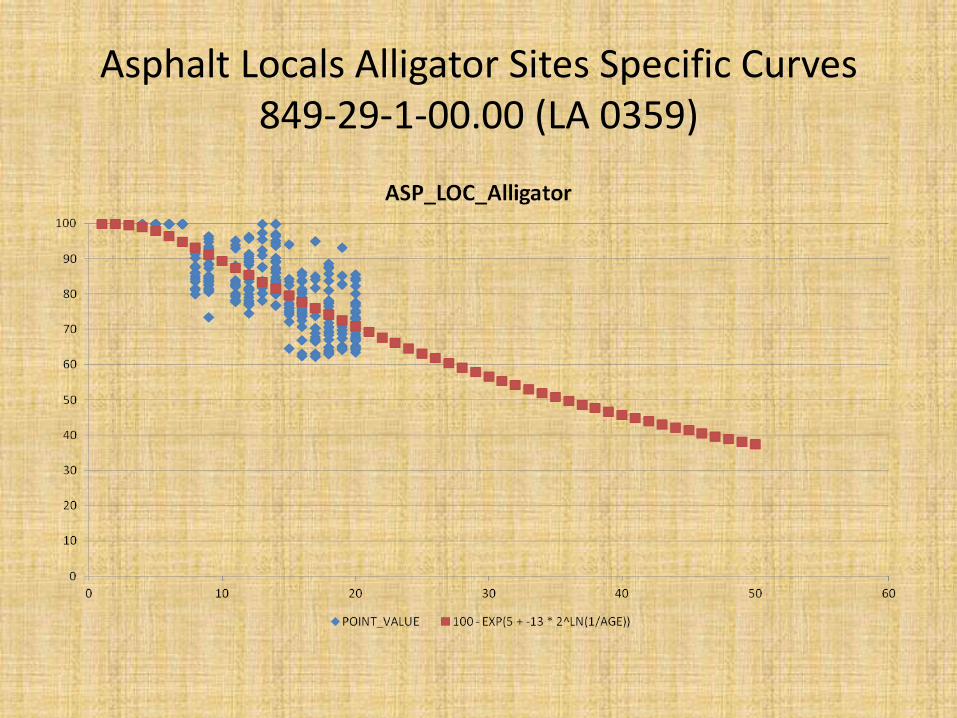
Asphalt Locals Alligator Sites Specific Curves 849-29-1-00.00 (LA 0359)

Asphalt Locals Roughness Sites Specific Curves 849-29-1-00.00 (LA 0359)

Asphalt Locals Alligator Sites Specific Curves 391-01-1-01.00 (LA 0098)

Asphalt Locals Roughness Sites Specific Curves 391-01-1-01.00 (LA 0098)

Asphalt Locals Alligator Sites Specific Curves 270-03-1-00.00 (LA 0441)

Asphalt Locals Roughness Sites Specific Curves 270-03-1-00.00 (LA 0441)
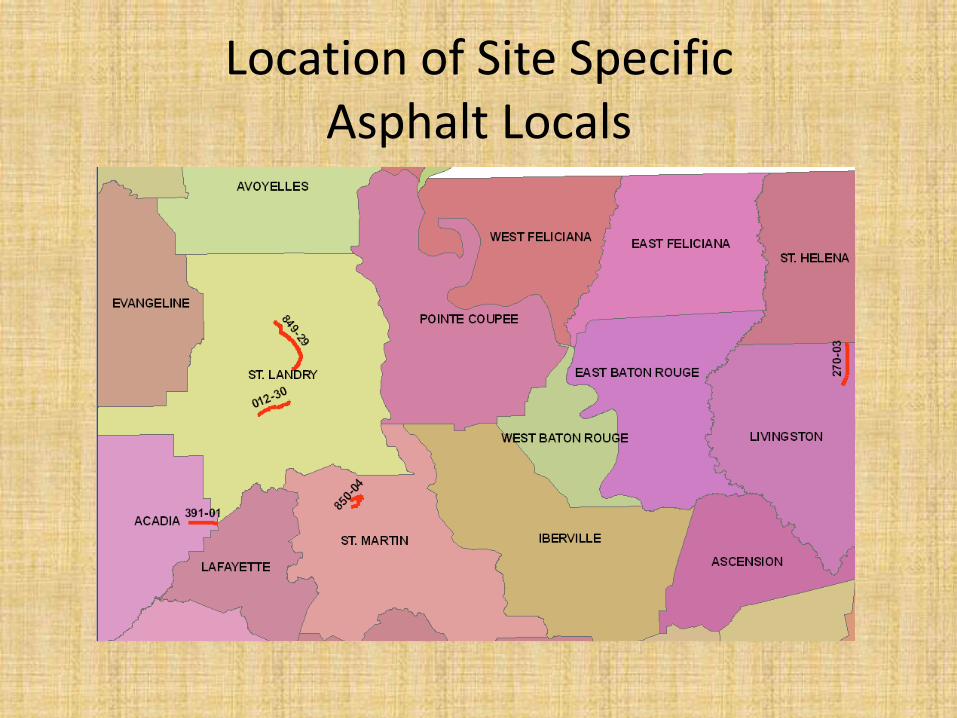
Location of Site Specific Asphalt Locals
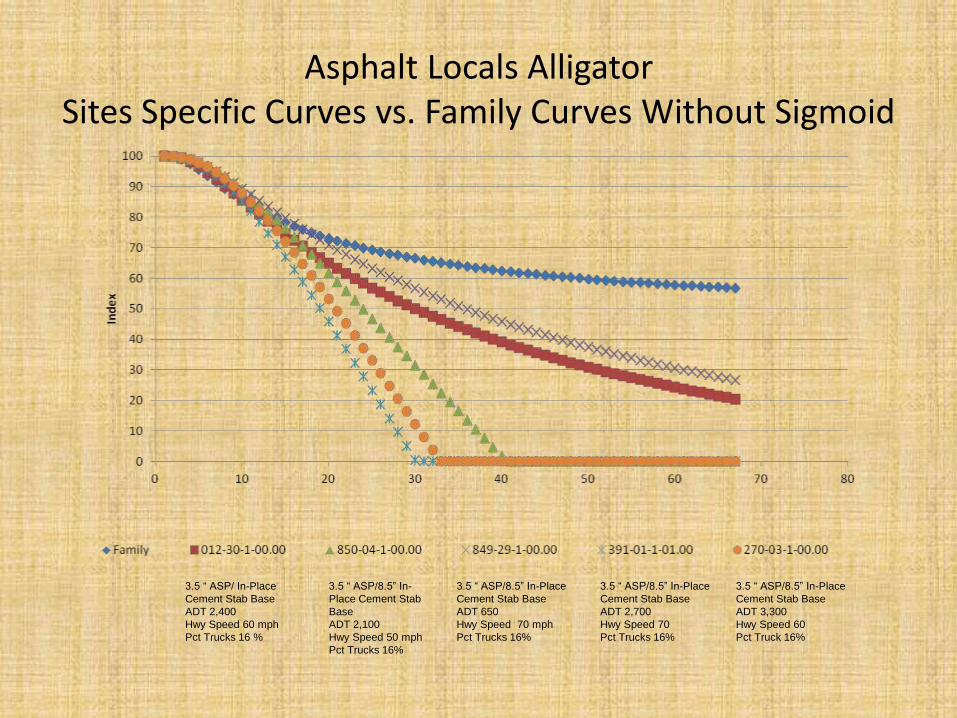
Asphalt Locals Alligator Sites Specific Curves vs. Family Curves Without Sigmoid
3.5 “ ASP/ In-Place
Cement Stab Base
ADT 2,400
Hwy Speed 60 mph
Pct Trucks 16 %
3.5 “ ASP/8.5” In-
Place Cement Stab
Base
ADT 2,100
Hwy Speed 50 mph
Pct Trucks 16%
3.5 “ ASP/8.5” In-Place
Cement Stab Base
ADT 650
Hwy Speed 70 mph
Pct Trucks 16%
3.5 “ ASP/8.5” In-Place
Cement Stab Base
ADT 2,700
Hwy Speed 70
Pct Trucks 16%
3.5 “ ASP/8.5” In-Place
Cement Stab Base
ADT 3,300
Hwy Speed 60
Pct Truck 16%
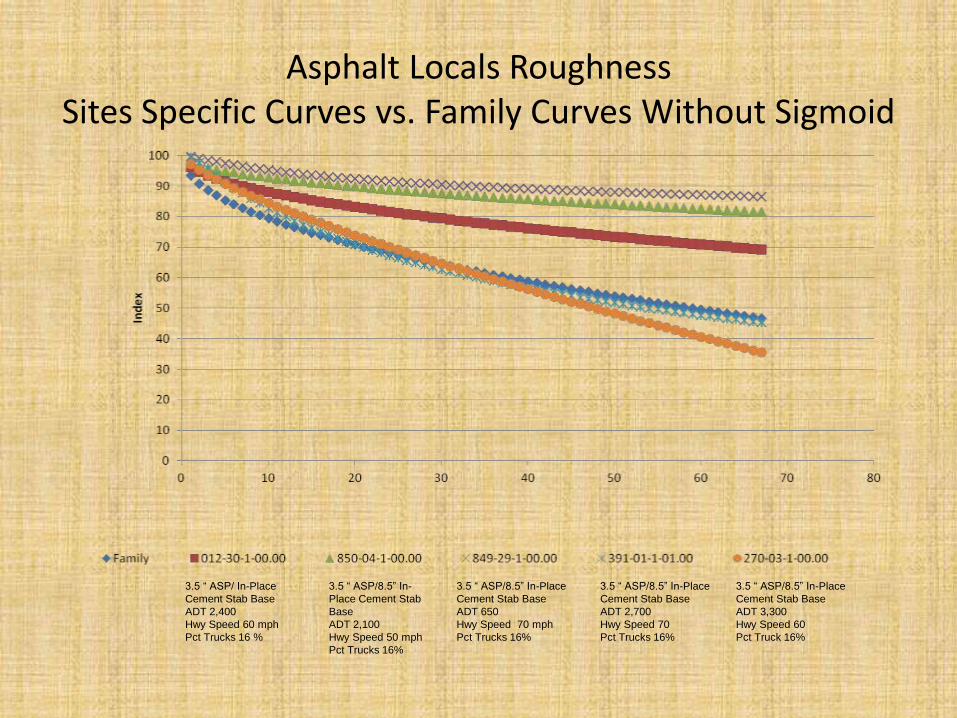
Asphalt Locals Roughness Sites Specific Curves vs. Family Curves Without Sigmoid
3.5 “ ASP/ In-Place
Cement Stab Base
ADT 2,400
Hwy Speed 60 mph
Pct Trucks 16 %
3.5 “ ASP/8.5” In-
Place Cement Stab
Base
ADT 2,100
Hwy Speed 50 mph
Pct Trucks 16%
3.5 “ ASP/8.5” In-Place
Cement Stab Base
ADT 650
Hwy Speed 70 mph
Pct Trucks 16%
3.5 “ ASP/8.5” In-Place
Cement Stab Base
ADT 2,700
Hwy Speed 70
Pct Trucks 16%
3.5 “ ASP/8.5” In-Place
Cement Stab Base
ADT 3,300
Hwy Speed 60
Pct Truck 16%

Location of Site Specific Asphalt Principal Arterials
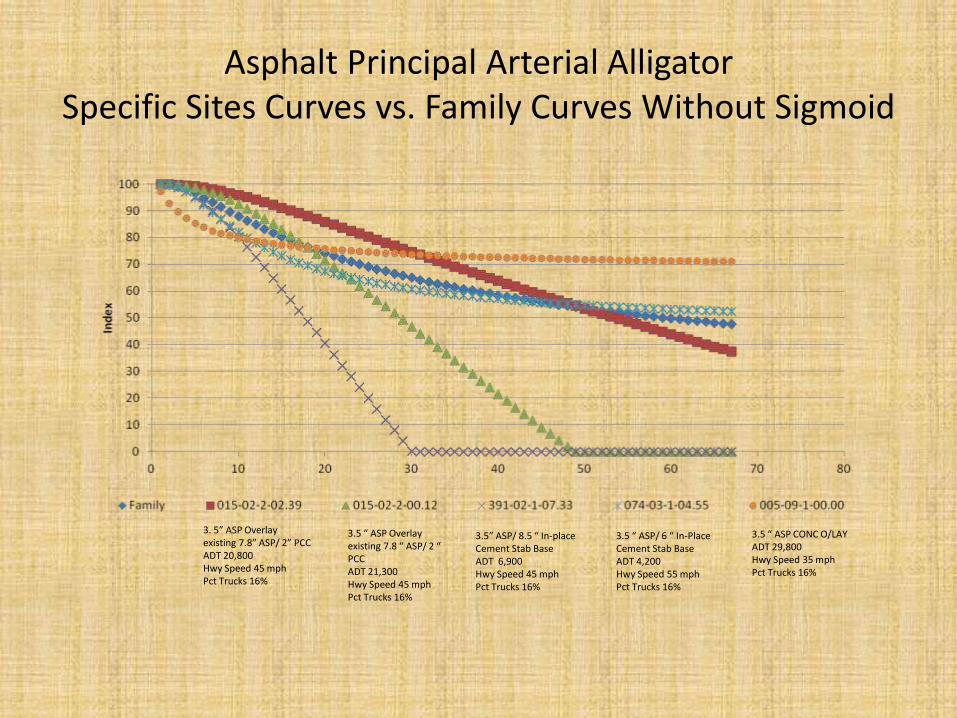
Asphalt Principal Arterial Alligator Specific Sites Curves vs. Family Curves Without Sigmoid
3. 5” ASP Overlay existing 7.8” ASP/ 2” PCC ADT 20,800 Hwy Speed 45 mph Pct Trucks 16%
3.5 “ ASP Overlay existing 7.8 “ ASP/ 2 “ PCC ADT 21,300 Hwy Speed 45 mph Pct Trucks 16%
3.5” ASP/ 8.5 “ In-place Cement Stab Base ADT 6,900 Hwy Speed 45 mph Pct Trucks 16%
3.5 “ ASP/ 6 “ In-Place Cement Stab Base ADT 4,200 Hwy Speed 55 mph Pct Trucks 16%
3.5 “ ASP CONC O/LAY ADT 29,800 Hwy Speed 35 mph Pct Trucks 16%
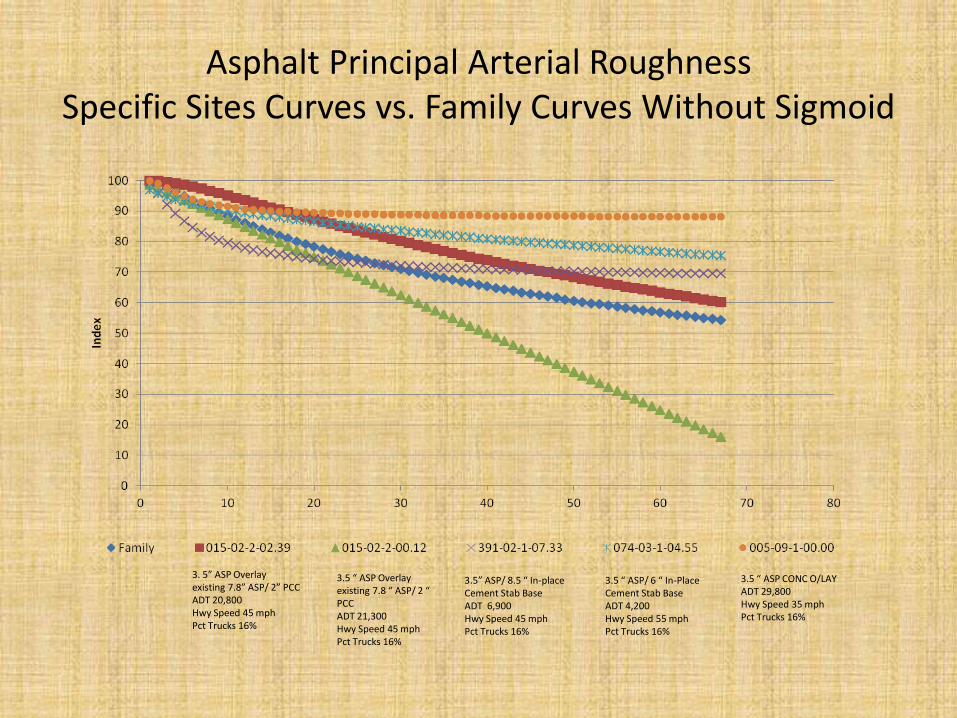
Asphalt Principal Arterial Roughness Specific Sites Curves vs. Family Curves Without Sigmoid
3. 5” ASP Overlay existing 7.8” ASP/ 2” PCC ADT 20,800 Hwy Speed 45 mph Pct Trucks 16%
3.5 “ ASP Overlay existing 7.8 “ ASP/ 2 “ PCC ADT 21,300 Hwy Speed 45 mph Pct Trucks 16%
3.5” ASP/ 8.5 “ In-place Cement Stab Base ADT 6,900 Hwy Speed 45 mph Pct Trucks 16%
3.5 “ ASP/ 6 “ In-Place Cement Stab Base ADT 4,200 Hwy Speed 55 mph Pct Trucks 16%
3.5 “ ASP CONC O/LAY ADT 29,800 Hwy Speed 35 mph Pct Trucks 16%
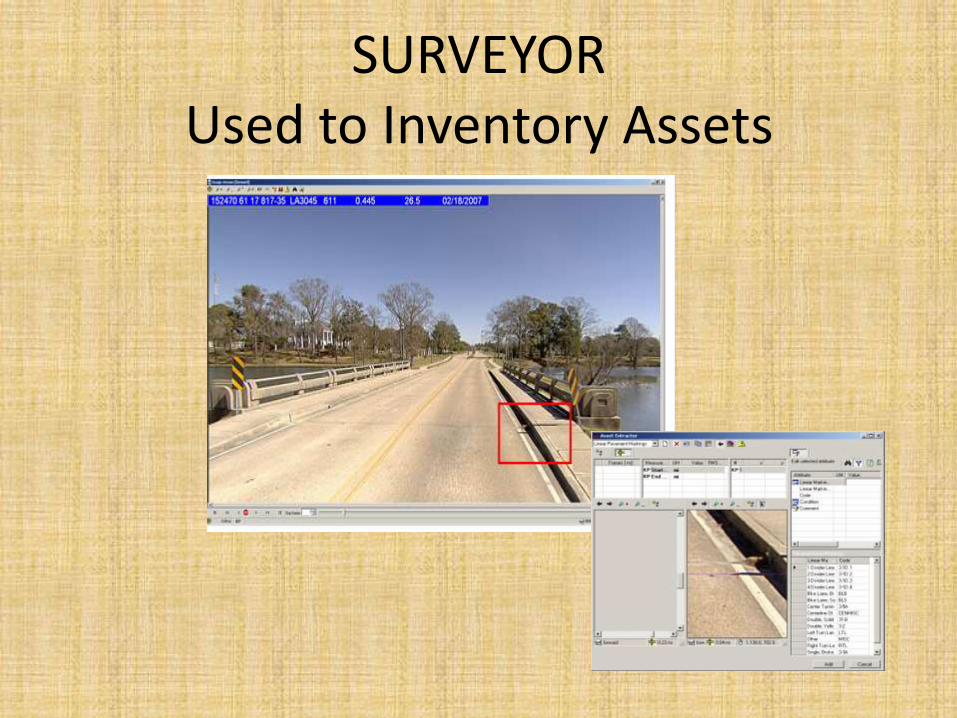
SURVEYOR Used to Inventory Assets
Capabilities of Surveyor
• Measuring Point features – Examples of point features:
• Signs
• Intersections
• Manhole cover…
• Measuring Liner features – Examples of liner features:
• Lane Width
• Bridges
• Barriers

List of assets inventoried using Surveyor in District 04, 05, 07, 08, and 61
• Bridge • Curbs • Grade • Horizontal Curve • Intersections • Ladotd_point_assets • Lane_widths • Lanes_number • Medians • On_route_parking • Pavement_type
• Rail_road_crossing • Shoulders • Sidewalks_and_ramps • Sight_distance • Speed_limit_signs • Terrain_type • Tolls_crl_issues • Turn_lanes • Vertical_curve

Surveyor-Train the Trainer
• March or April
• Train DOTD person in a section to train the others
• Train Trainer to inventory the assets that are important to their business or engineering decisions.
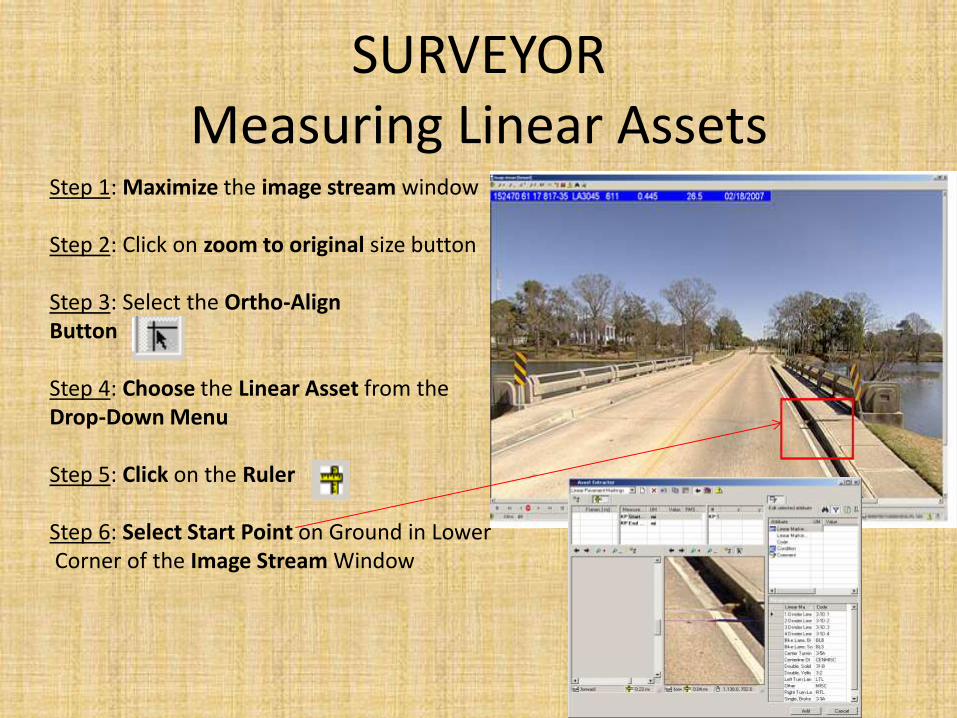
SURVEYOR Measuring Linear Assets
Step 1: Maximize the image stream window Step 2: Click on zoom to original size button Step 3: Select the Ortho-Align Button Step 4: Choose the Linear Asset from the Drop-Down Menu Step 5: Click on the Ruler Step 6: Select Start Point on Ground in Lower Corner of the Image Stream Window