pavement management and decision making - virginia · decision support tools • management...
TRANSCRIPT

Pavement Management & Decision Making
Omar Smadi

Decision Making (what?)
• Importance of Data:
– Inventory
– Assessment of condition
• Proper DST
• Needs
Garbage IN Garbage OUT

Assets we Maintain

Data Collection Process
• Objective
• Repeatable
• Added features (one pass)
• Safety considerations (automated data collection)

Good or Bad?

Good or Bad?

Good or Bad?

Good or Bad?

Good or Bad?

Data Collection

Decision Support Tools
• Management systems:
– Pavement Management
– Bridge Management
– Maintenance Management
– Sign Management
– Pavement Marking Management
– SAFETY
Physical Assets
Operational Assets

Decision Support Tools
• Components:
– Models:
• Prioritization
• Economic analysis
• Optimization
– Data:
• Existing conditions
• Forecasted condition
• Financial (budget, interest and inflation rates)
MYP vs. KBES_DP
79
80
81
82
83
84
Year
PCI MYP
KBES_DP
MYP 83.17 82.36 81.03 81.63 80.8
KBES_DP 81.78 81.67 80.5 82.02 83.18
2002 2003 2004 2005 2006

Decision Support Tools
• Functions:
– Project Selection
– Resource Allocation
– Develop Funding Needs
– Package Funding Requests
Project Level
Network Level
Internal Communication
Internal and ExternalCommunication

Reactive vs. Proactive
• Fix the worst first
• Mix of fixes
• Asset Management
$$$$$
$$$$$
$$
Overlay
Age
Pa
vem
ent
Con
dit
ion
In
dex
Pavement performance curve
40% Time
70% Time
90% Time
$ 0.85
$ 4.25
$ 7.50
$16.75
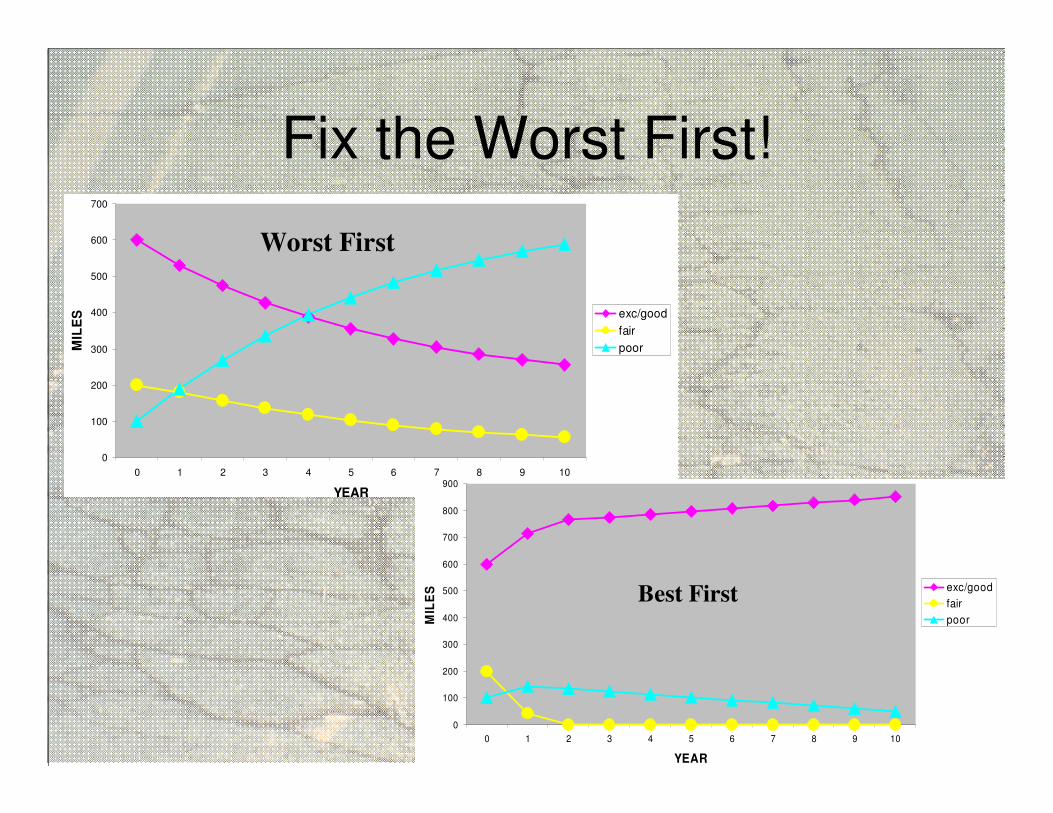
Fix the Worst First!
0
100
200
300
400
500
600
700
0 1 2 3 4 5 6 7 8 9 10
YEAR
MIL
ES exc/good
fair
poor
Worst First
0
100
200
300
400
500
600
700
800
900
0 1 2 3 4 5 6 7 8 9 10
YEAR
MIL
ES exc/good
fair
poor
Best First
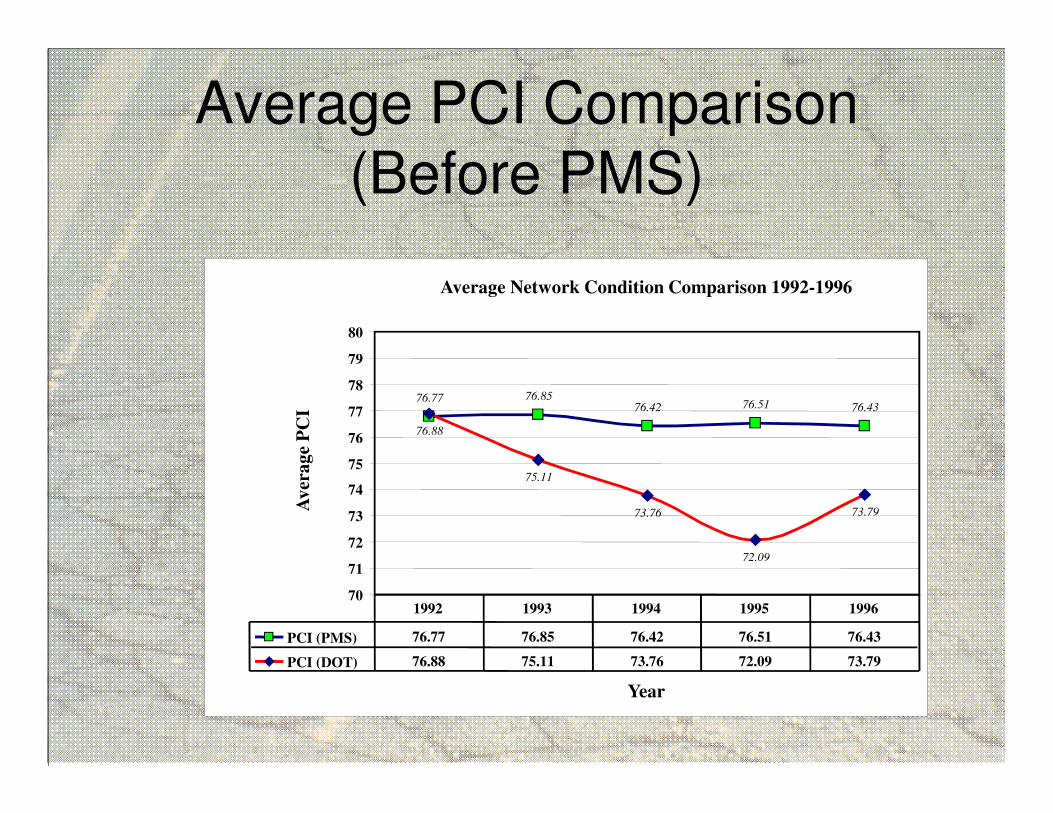
Average PCI Comparison(Before PMS)
Average Network Condition Comparison 1992-1996
76.77 76.85
76.42 76.51 76.43
76.88
75.11
73.76
72.09
73.79
70
71
72
73
74
75
76
77
78
79
80
Year
Av
era
ge
PC
I
PCI (PMS) 76.77 76.85 76.42 76.51 76.43
PCI (DOT) 76.88 75.11 73.76 72.09 73.79
1992 1993 1994 1995 1996

Results (Before PMS)
• DOT Average PCI = 73.79
• PMS Average PCI = 76.43
• Total Budget = $175 Millions over 5 years2.64

Results (Before PMS)
• The Level of Investment For the PMS to Achieve an Average PCI of 73.79:
• $162.5 Millions
• $12.5 Millions difference over 5 years
• $5 million for each PCI point

Average PCI Comparison(After PMS)
Average Network Condition Comparison 1999-2003
74.55
76.69
74.72
73.89
73.08
73.56
72.66
71.39
71.9571.63
70
71
72
73
74
75
76
77
78
79
80
Year
Av
era
ge
PC
I
PCI (PMS) 74.55 76.69 74.72 73.89 73.08
PCI (DOT) 73.56 72.66 71.39 71.95 71.63
1999 2000 2001 2002 2003

Results (After PMS)
• DOT Average PCI = 71.63
• PMS Average PCI = 73.08
• $7.5 millions difference based on the previous analysis
1.45

Results
� After PMS:
� 1.45 PCI points difference
� Equates to $7.5 millions difference in investment
_
Benefits = $5 millions over 5 yrs
� Before PMS:
� 2.64 PCI point difference
� Equates to $12.5 millions difference in investment