comparison of pavement management systems in the …
TRANSCRIPT

COMPARISON OF PAVEMENT MANAGEMENTSYSTEMS IN THE REPUBLIC OF SOUTH AFRICA ANDTHE UNITED STATES
T.F.P. Henning, J.P. Mahoney*, E.S. Sadzik**, N.C. Jackson***Department of Public Transport,Roads and WorksGauteng Provincial GovernmentPretoria, South Africa
University of Washington*Seattle, Washington USA
Department of Public Transport, **Roads and WorksGauteng Provincial GovernmentPretoria, South Africa
Olympia, Washington USA ***
Abstract
This paper compares two implemented Pavement Management Systems(PMS), namely: from South Africa the PMS of Gauteng ProvincialGovernment (GAUTRANS) and from the United States of America thePMS of the State of Washington (WSDOT).
The overall goal of the paper is to illustrate that the pavementmanagement systems are critical components in the managing of the tworoad networks. Performance of the two road networks is compared interms of the condition score, roughness and rutting in the context ofpavement age, traffic and climatic conditions. From the investigation it isclear that the results obtained from the PMS’s can be used to comparepavement and resurfacing performance and even to some extentpavement practice.
1. INTRODUCTION
This paper compares two implemented Pavement Management Systems(PMS), namely : from South Africa the PMS of Gauteng ProvincialGovernment (GAUTRANS) and from the United States of America thePMS of the State of Washington (WSDOT).
The overall goal of the paper is to illustrate that the pavementmanagement systems are critical components in the managing of the tworoad networks. Performance of the two road networks is compared in
4th International Conference on Managing Pavements (1998)
TRB Committee AFD10 on Pavement Management Systems is providing the information contained herein for use by individual practitioners in state and local transportation agencies, researchers in academic institutions, and other members of the transportation research community. The information in this paper was taken directly from the submission of the author(s).

terms of the condition score, roughness and rutting in the context ofpavement age, traffic and climatic conditions.
The Gautrans and WSDOT PMSs were fully implemented in 1985 and1982, respectively. The following sections briefly describe historicaldevelopment, performance measures used and the decision makingprocess of each system. Basic statistics are presented on theperformance of the two road networks.
1.1 Characteristics of Gautrans and WSDOT Road Networks.
Gautrans as a provincial road authority is responsible for all provincialrural roads except for the national roads. WSDOT is responsible for allthe roads within the state except the municipal and county roads. TheWSDOT road network consists of freeways and dual carriageways andGautrans network consists mainly of single carriageways. Table 1 showsthe total lane - kilometres owned and maintained by each agency.
From this table it is clear that the WSDOT is responsible for about fivetimes more lane-kilometres of roads than Gautrans. However, the area ofWashington State is about nine times larger than the area of the GautengProvince.
Table 1. Size of the Road Networks
AgencyRoad Type Gautrans
(Lane - kilometres)WSDOT(Lane - kilometres)
FreewayDual CarriagewaySingle CarriagewayGravel
4016662,8711,487
6,10922,87100
Totals 5,426 28,980
Table 2 shows the percentage of the various pavement types within eachagency. Gautrans categorises pavements by the base type, namely:crushed stone, cemented and natural gravel base. This tends to reflectthe agency’s selection of base type as being a critical designconsideration. WSDOT primarily categorises pavement types by asurface course. Most of the WSDOT pavements have unstabilizedgranular bases.
A major difference between WSDOT and Gautrans pavement structures isthe primary load supporting layer. Gautrans mainly uses a crushed stonebase (G1) typically overlying a stabilised sub-base as the primary loadsupporting layer. The wearing course is therefore relatively thinconsisting of a chip and spray or asphalt concrete less than 40mm thick.WSDOT typically uses thick asphalt concrete layers as the primary load
4th International Conference on Managing Pavements (1998)
TRB Committee AFD10 on Pavement Management Systems is providing the information contained herein for use by individual practitioners in state and local transportation agencies, researchers in academic institutions, and other members of the transportation research community. The information in this paper was taken directly from the submission of the author(s).

supporting layer for heavily trafficked pavements and thin asphaltconcrete wearing courses for lightly trafficked pavements.
Table 2. Pavement Types
Agency Pavement Type PercentageGautrans G1 Base (crushed stone) 53%
Cemented Base (max. 3%cement)
34%
Natural Gravel Base 13%WSDOT AC Surface 60%
BST Surface 27%PCCP 13%
Note: AC- Asphalt Concrete, BST- Bituminous Surface TreatmentPCCP-Portland Cement Concrete Pavement
Figure 1 illustrates the types of pavement used by Gautrans and WSDOT.It is evident that the roads of Gautrans have a deep well balancedpavement structure, whereas WSDOT relies much more on strength builtinto the thick asphalt or Portland cement concrete layers and have ashallower pavement structure.
BST = 15mm or AC = 20 - 40mm
BASE =150mm
SUBBASES= 150-300mm
SELECTED LAYERS =150-300mm Natural gravel
SUBGRADEImported/ insitu
BST = 12-25 mm or AC = 50-300 mm or PCC = 213mm
BASE =150-200mm Crushed stone
SUBGRADEImported/insitu
GAUTRANS WSDOT
Gautrans base and subbase combinations:
-Crushed stone base on cemented subbase-Cemented base on natural gravel subbase-Natural gravel base on natural gravel subbase
Figure 1 : Pavement types used by GAUTRANS and WSDOT
4th International Conference on Managing Pavements (1998)
TRB Committee AFD10 on Pavement Management Systems is providing the information contained herein for use by individual practitioners in state and local transportation agencies, researchers in academic institutions, and other members of the transportation research community. The information in this paper was taken directly from the submission of the author(s).

Traffic information is a critical component of any pavement managementsystem. For both the Gautrans and WSDOT PMS traffic counts are takenon a regular basis and the number of light and heavy vehicles isdetermined. Information concerning load characteristics of heavyvehicles is obtained from weigh stations as well as from weigh-in-motionstatistics.
Both authorities use an equivalent standard single axle load equal to80kN to describe the cumulative axle loads on their road network.
The annual equivalent single axle load statistics are reported in Table 3.It can be observed that:
♦ The interstate roads of WSDOT carry about eight times moretraffic (E80’s) than Gautrans roads. There is however a functionaldifference in the sense that the interstate roads perform the samefunction as South African national roads, which are not included inthis study.
♦ The entire Washington State route system carries, on average,twice as much traffic as the road network of Gautrans.
♦ The Gautrans road network, resurfaced with Bituminous SurfacedTreatment, carries about five times more traffic than the WSDOTBST road network.
2. OVERVIEW OF PAVEMENT MANAGEMENT SYSTEMS
2.1 Historical Development
2.1.1 Gautrans PMSThe development of the Gautrans PMS has had started in the early 80’s.Initially the pavement condition evaluation was based only on visualsurveys of a limited number of roads. Simultaneously a database for aroad inventory their pavement structure, surfacing and traffic wascreated. Once it had been proved that pavement management is avaluable source of managerial information, the condition survey wasextended to cover the whole road network by means of both visualevaluation and roughness measurements (riding quality). The visualevaluation results were combined into a condition score called VisualCondition Index (VCI).
At present, the visual survey of the whole road network is performed onan annual basis and is supplemented by an mechanical survey consistingof roughness and rutting measurements.
2.1.2 WSDOT PMS.
4th International Conference on Managing Pavements (1998)
TRB Committee AFD10 on Pavement Management Systems is providing the information contained herein for use by individual practitioners in state and local transportation agencies, researchers in academic institutions, and other members of the transportation research community. The information in this paper was taken directly from the submission of the author(s).

The WSDOT has had in operation, through most of the 1980’s, apavement management program referred to as the Washington StatePavement Management System (WSPMS). The WSPMS grew out of anearlier priority programming requirement mandated by the WashingtonState Legislature.
4th International Conference on Managing Pavements (1998)
TRB Committee AFD10 on Pavement Management Systems is providing the information contained herein for use by individual practitioners in state and local transportation agencies, researchers in academic institutions, and other members of the transportation research community. The information in this paper was taken directly from the submission of the author(s).
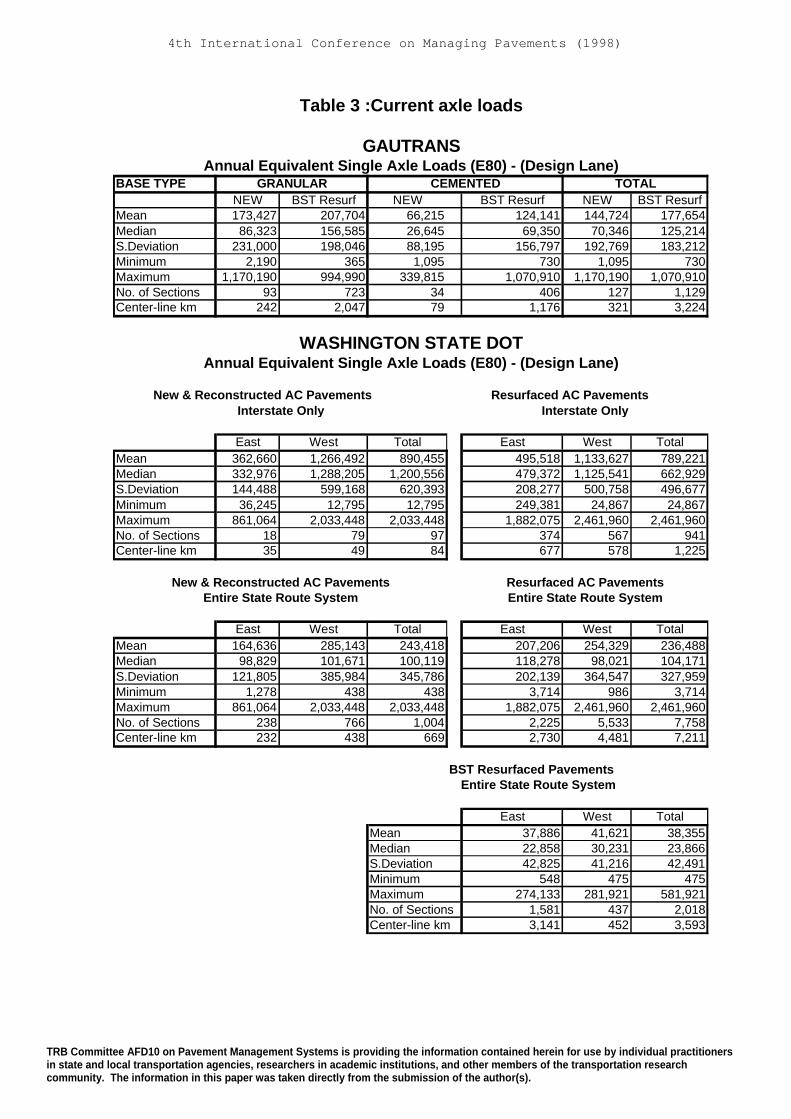
Table 3 :Current axle loads
GAUTRANSAnnual Equivalent Single Axle Loads (E80) - (Design Lane)
BASE TYPE GRANULAR CEMENTED TOTALNEW BST Resurf NEW BST Resurf NEW BST Resurf
Mean 173,427 207,704 66,215 124,141 144,724 177,654Median 86,323 156,585 26,645 69,350 70,346 125,214S.Deviation 231,000 198,046 88,195 156,797 192,769 183,212Minimum 2,190 365 1,095 730 1,095 730Maximum 1,170,190 994,990 339,815 1,070,910 1,170,190 1,070,910No. of Sections 93 723 34 406 127 1,129Center-line km 242 2,047 79 1,176 321 3,224
WASHINGTON STATE DOTAnnual Equivalent Single Axle Loads (E80) - (Design Lane)
New & Reconstructed AC Pavements Resurfaced AC PavementsInterstate Only Interstate Only
East West Total East West TotalMean 362,660 1,266,492 890,455 495,518 1,133,627 789,221Median 332,976 1,288,205 1,200,556 479,372 1,125,541 662,929S.Deviation 144,488 599,168 620,393 208,277 500,758 496,677Minimum 36,245 12,795 12,795 249,381 24,867 24,867Maximum 861,064 2,033,448 2,033,448 1,882,075 2,461,960 2,461,960No. of Sections 18 79 97 374 567 941Center-line km 35 49 84 677 578 1,225
New & Reconstructed AC Pavements Resurfaced AC PavementsEntire State Route System Entire State Route System
East West Total East West TotalMean 164,636 285,143 243,418 207,206 254,329 236,488Median 98,829 101,671 100,119 118,278 98,021 104,171S.Deviation 121,805 385,984 345,786 202,139 364,547 327,959Minimum 1,278 438 438 3,714 986 3,714Maximum 861,064 2,033,448 2,033,448 1,882,075 2,461,960 2,461,960No. of Sections 238 766 1,004 2,225 5,533 7,758Center-line km 232 438 669 2,730 4,481 7,211
BST Resurfaced PavementsEntire State Route System
East West TotalMean 37,886 41,621 38,355Median 22,858 30,231 23,866S.Deviation 42,825 41,216 42,491Minimum 548 475 475Maximum 274,133 281,921 581,921No. of Sections 1,581 437 2,018Center-line km 3,141 452 3,593
4th International Conference on Managing Pavements (1998)
TRB Committee AFD10 on Pavement Management Systems is providing the information contained herein for use by individual practitioners in state and local transportation agencies, researchers in academic institutions, and other members of the transportation research community. The information in this paper was taken directly from the submission of the author(s).

A priority programming process was developed in the mid 1960’s thatincluded a network wide pavement condition survey, which is representedvia Pavement Structural Condition (PSC). A pavement condition surveywas conducted on 100 percent of the state highway system every twoyears since 1969 but is currently done annually. In the late 1970’s theWSPMS was fully developed and subsequently implemented during 1982.
The information captured in the database includes roadway locationinformation, roadway configurations, pavement construction history,traffic data, and the current six-year construction (rehabilitation/majormaintenance/new construction) schedule. Other PMS-specific data suchas friction, riding quality and surface distress defects are gathered andmaintained by the pavement management staff.
2.2 Measures of Performance
2.2.1 Gautrans PMSThe primary pavement performance measures used in Gautrans PMS are:
♦ Visual Condition Index (VCI)♦ Roughness (IRI)♦ Rutting
The VCI approach considers nineteen distress types (CSRA, 1992):
♦ Block/stabilisation cracking ♦ Edge breaking♦ Longitudinal cracking ♦ Surfacing failure♦ Transverse cracking ♦ Surfacing cracks♦ Crocodile cracking ♦ Aggregate loss♦ Pumping ♦ Binder condition♦ Rutting ♦ Bleeding/flushing♦ Undulation/settlement ♦ Riding quality♦ Patching ♦ Skid resistance♦ Failures/potholing ♦ Drainage
♦ Shoulder condition
2.2.2 WSDOT PMSThe primary pavement performance measures used in the WSPMS are:
♦ Pavement Structural Condition (PSC)♦ Roughness (IRI)♦ Rutting♦ Friction
4th International Conference on Managing Pavements (1998)
TRB Committee AFD10 on Pavement Management Systems is providing the information contained herein for use by individual practitioners in state and local transportation agencies, researchers in academic institutions, and other members of the transportation research community. The information in this paper was taken directly from the submission of the author(s).

The primary distress type used in calculating flexible pavement PSC iscracking and more specifically fatigue cracking.
In Washington State, flexible pavements are placed in the rehabilitationprogram largely due to fatigue cracking. On the state highway system,few if any roads are so rough or rutted that they take priority over thecracked pavements. For fatigue cracked flexible pavements inWashington state’s climate, it is clearly more efficient to rehabilitatepavements early in the first stages of fatigue cracking rather than later.
2.3 How PMS Results Are Used
PMS results from both systems are used at the “project” and “network”levels. Each will be discussed below.
2.3.1 Project Level - GautransInitially pavement management focused on network level aspects. Later itwas extended to project level analyses which included a detailedexamination of projects to select the optimum maintenance measures.Besides the annual visual survey, a panel inspection consisting of thePMS and maintenance officials was introduced to validate themaintenance category, type of resurfacing and priority of projectsselected by network level analysis.
Recently Gautrans has implemented an optimisation routine on theproject and network level. The optimisation routine considers variousmaintenance strategies for each road section and is based on anincremental Benefit Cost ratio analysis. However the final maintenanceprogram is formulated in close co-operation with the maintenance officialsand verified during the panel inspection.
2.3.2 Project Level - WSDOTAt present, the project level analysis is accomplished by considerableinteraction between the regional program development offices (a total ofsix), the regional materials staff and the Headquarters PMS office.
Early in the development of the WSPMS. WSDOT decided to utilise aproject specific PMS with unique project performance predictivecapabilities. In developing this predictive capability. WSDOT found thatthey had to abandon the existing priority array based pavement conditionindex, which was a combined distress rating, which included a widevariety of pavement distress. To develop the best predictive capabilitiesWSDOT developed specific pavement response indexes. The first indexthat was developed was a structural response index (PSC) which forflexible pavements considered fatigue distress and consisted primarily oflongitudinal cracking, alligator cracking and patching. More recentlyrutting and ride indexes were developed to predict those individualpavement responses. To date the vast majority of projects that are
4th International Conference on Managing Pavements (1998)
TRB Committee AFD10 on Pavement Management Systems is providing the information contained herein for use by individual practitioners in state and local transportation agencies, researchers in academic institutions, and other members of the transportation research community. The information in this paper was taken directly from the submission of the author(s).

included in the biannual pavement rehabilitation program for WSDOT,were identified based on their structural condition index with only a fewidentified based on their rutting index.
An additional aspect of the project level performance data is the potentialfor statistical analysis of performance trends. Topics of particularinterest might include correlation of pavement performance to specificmeasures of construction quality, geographic location, pavement type,rehabilitation type, or even a specific version of constructionspecifications. As previously stated, another feature of the WSPMS is toproduce a performance curve that best represents a specific pavement’santicipated performance.
2.3.3 Network Level - GautransIn Gauteng, network level analysis is based on a heuristic optimisationprocess which makes use of the Deighton software. The HDM III modelscalibrated for Gauteng conditions are implemented in this process.
The optimisation is used at network level for the following :
♦ fund motivation by showing the predicted network conditions fordifferent funding levels;
♦ optimal fund allocation to the different maintenance actions, namely:rehabilitation, reseals, fog sprays and routine maintenance for givenfunding level and
♦ to check efficiency of the various maintenance measures.
2.3.4 Network Level - WSDOTNetwork level analysis has always been performed as a natural extensionof the project level analysis programs in the WSPMS. When the WSPMSwas first developed, the network level analysis programs consisted simplyof iterating runs of the project level analysis data, given differentpavement condition cut-offs of funding level constraints. Operationally, ithas been found that these network programs were used only a few timesfor actual program studies. In both cases the exercises confirmed thelevel of funding already determined by funding policies.
Over the last few years WSDOT has been working towards networkanalysis processes that help optimise project selection within each regionto deliver the best overall pavement condition over time for fixed fundinglevels. Currently, a lowest life cycle cost analysis is performed on anetwork level. This information is then used to select the rehabilitationtiming for specific projects in each region.
4th International Conference on Managing Pavements (1998)
TRB Committee AFD10 on Pavement Management Systems is providing the information contained herein for use by individual practitioners in state and local transportation agencies, researchers in academic institutions, and other members of the transportation research community. The information in this paper was taken directly from the submission of the author(s).
3. STATISTICAL COMPARISON OF THE TWO ROUTE SYSTEMS.
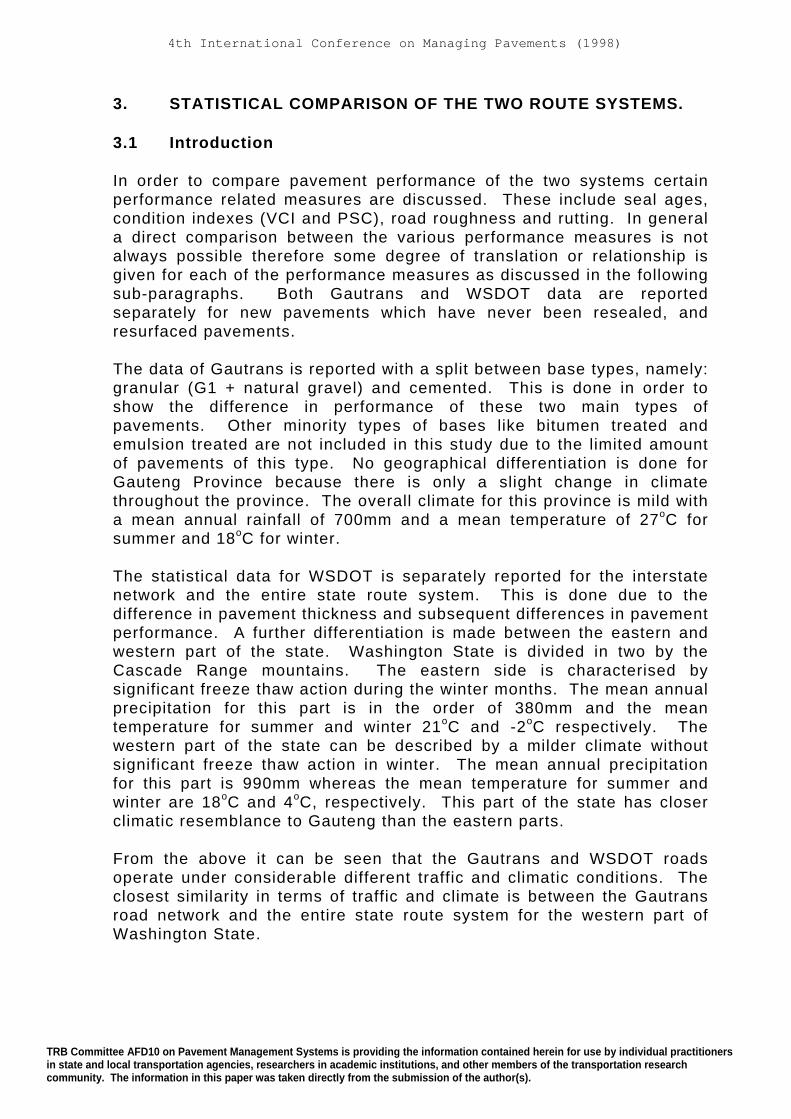
3.1 Introduction
In order to compare pavement performance of the two systems certainperformance related measures are discussed. These include seal ages,condition indexes (VCI and PSC), road roughness and rutting. In generala direct comparison between the various performance measures is notalways possible therefore some degree of translation or relationship isgiven for each of the performance measures as discussed in the followingsub-paragraphs. Both Gautrans and WSDOT data are reportedseparately for new pavements which have never been resealed, andresurfaced pavements.
The data of Gautrans is reported with a split between base types, namely:granular (G1 + natural gravel) and cemented. This is done in order toshow the difference in performance of these two main types ofpavements. Other minority types of bases like bitumen treated andemulsion treated are not included in this study due to the limited amountof pavements of this type. No geographical differentiation is done forGauteng Province because there is only a slight change in climatethroughout the province. The overall climate for this province is mild witha mean annual rainfall of 700mm and a mean temperature of 27oC forsummer and 18oC for winter.
The statistical data for WSDOT is separately reported for the interstatenetwork and the entire state route system. This is done due to thedifference in pavement thickness and subsequent differences in pavementperformance. A further differentiation is made between the eastern andwestern part of the state. Washington State is divided in two by theCascade Range mountains. The eastern side is characterised bysignificant freeze thaw action during the winter months. The mean annualprecipitation for this part is in the order of 380mm and the meantemperature for summer and winter 21oC and -2oC respectively. Thewestern part of the state can be described by a milder climate withoutsignificant freeze thaw action in winter. The mean annual precipitationfor this part is 990mm whereas the mean temperature for summer andwinter are 18oC and 4oC, respectively. This part of the state has closerclimatic resemblance to Gauteng than the eastern parts.
From the above it can be seen that the Gautrans and WSDOT roadsoperate under considerable different traffic and climatic conditions. Theclosest similarity in terms of traffic and climate is between the Gautransroad network and the entire state route system for the western part ofWashington State.
4th International Conference on Managing Pavements (1998)
TRB Committee AFD10 on Pavement Management Systems is providing the information contained herein for use by individual practitioners in state and local transportation agencies, researchers in academic institutions, and other members of the transportation research community. The information in this paper was taken directly from the submission of the author(s).

3.2 An Examination of Pavement Condition Rating Schemes
The condition rating schemes used by the two agencies are both basedon a 0 (worst) to 100 (best) scale. Unfortunately that is where the directsimilarity stops. The Gautrans condition score (VCI) is based on thesurvey procedure described in TMH9 (1992) and calculations of VCIshown in GPG (1995). The WSDOT (PSC) is based on the rating andcalculation process described by Kay et al(1993).
The VCI approach considers nineteen types of distresses mentioned inparagraph 2.2.1 Each distress is rated for extent and severity based on a1 (least) to 5 (maximum) scale. The number of considered distresses isvery high but it is required for determination of the type and time ofmaintenance. Gautrans pavements composed of gravel layers with a thinbituminous surfacing are water sensitive and therefore the integrity of thesurface is critical. Each manifestation of the loss of surface integrity isvery important for timely maintenance.
The flexible pavements rating scheme used by WSDOT considers fourprimary distress types (Kay et al, 1993):
♦ Transverse cracking♦ Alligator cracking♦ Longitudinal cracking♦ Patching
These distress types are converted to a PSC via various formulas whichare not presented here for the sake of brevity.
Of interest in this paper is an examination of how the two conditionscores, VCI and PSC, can be approximately related to each other. Tomake this examination the VCI and PSC were calculated for fatiguecracking only (crocodile/alligator). This was done due to the fact that thefatigue cracking is by far the most important distress type for WSDOT anddominates PSC values for flexible pavements. First, the VCI and PSCseverity and extent values were matched. Next, the VCI and PSC valueswere calculated to various extent and severity levels for fatigue crackingonly. As shown in Table 4, the PSC is more influenced by fatiguecracking than the VCI.
4th International Conference on Managing Pavements (1998)
TRB Committee AFD10 on Pavement Management Systems is providing the information contained herein for use by individual practitioners in state and local transportation agencies, researchers in academic institutions, and other members of the transportation research community. The information in this paper was taken directly from the submission of the author(s).

Table 4: Comparison of influence of the fatigue cracking on VCI and PSC
SEVERITY EXTENT VCI VCI PSC(Fatigue Cracking (Fatigue Cracking (Fatigue Cracking
VCI PSC VCI PSC only) plus Normal Values only)
(%wheelpath)
for Other Main
Assessments)
1 HAIRLINE 1 1% 100 78 94
3 5% 97 76 83
5 25% 94 73 50
3 SPALLING 1 1% 97 76 90
3 5% 89 69 73
5 25% 82 63 33
5 SPALLING 1 1% 94 73 84
plus 3 5% 82 63 65
PUMPING 5 25% 70 64 21
Finally it was found, via a search of the Gautrans PMS, that network of“typical” or “nominal” severity and extent values for fatigue cracking are“1” and “1”. This is approximately equivalent to “hairline cracks” and “1percent of the wheelpath” for PSC used by WSDOT. As will be shown inParagraph 3.3, the overall WSDOT PSC for the complete network is about79 and 72 for BST surfaced pavements only. By use of Table 4 thissuggests a fatigue cracking severity of “3” (or “5 percent of thewheelpath”). Since the Gautrans PMS revealed nominal values of “1” and“1”, this strongly suggests that more fatigue cracking exists on theWSDOT route system than on the Gautrans route system, however, theextent of fatigue cracking for both route systems is relatively low.A conclusion drawn from this examination of rating schemes is that thereis no direct relationship between the two condition scores.
3.3 Statistical Data
3.3.1 Current Wearing Course AgeAll wearing courses, except for Portland cement concrete, are included inthe Gautrans and WSDOT data. The current pavement wearing courseage for both agencies is reported in Table 5.
Observations based on this table are as follows:
♦ There is not much difference in wearing course ages for newpavements between the two road networks. The mean wearingcourse age is about fourteen years.
4th International Conference on Managing Pavements (1998)
TRB Committee AFD10 on Pavement Management Systems is providing the information contained herein for use by individual practitioners in state and local transportation agencies, researchers in academic institutions, and other members of the transportation research community. The information in this paper was taken directly from the submission of the author(s).

♦ On the resurfaced pavements it seems that the AC wearingcourses of WSDOT are slightly older than the BST wearingcourses of Gautrans. It confirms that AC is more durable than thinbituminous wearing courses.
♦ Pavements resurfaced with BST are older in Gauteng than theyare in the eastern Washington State but similar to the western partof Washington State. This similarity can be attributed tocomparable climatic conditions and/or maintenance strategies.
3.3.2 Pavement condition indexThe comparison of the conditions between the two systems is reported inTable 6. Observations from this table as well as from paragraph 3.2 areas follows:
♦ More fatigue cracking exists on WSDOT route systems than on theGautrans route system.
♦ Defects like binder condition, aggregate loss, potholing and edgebreak do occur more frequently on Gautrans pavements than onWSDOT pavements. These defects are common to thin surfacing.
♦ In Gauteng the pavement conditions of new and resurfacedpavements with granular and cemented bases are similar. On theWSDOT interstate road network the PSC is slightly higher forresurfaced pavements than for new and reconstructed pavements.
♦ The resurfaced AC interstate route system is in a slightly bettercondition than the entire state route system and much better thanthe entire resurfaced BST state route system.
♦ There is no difference in condition between the eastern andwestern parts of Washington State despite the major climaticdifferences. However, the difference in pavement age between theeastern and western parts of Washington State does indicate thatthe performance is influenced by the climatic differences.
3.3.3 RoughnessGautrans performs the roughness measurements by means of a lineardisplacement integrator. This device measures roughness by recordingthe relative linear displacement between the middle of a fixed rear axleand the chassis. According to the definition of IRI, these measurementsmust be recorded as a half-car index which will always be less than thequarter-car index. To record this as IRI, a factor of 1.3 is applied to thehalf-car indexes. (Sayer, et al., 1986.). WSDOT performs its roughnessmeasurement with a South Dakota Profilometre in IRI units.
The roughness statistics are reported in Table 7 and observations fromthis table are as follows:
♦ For new and resurfaced pavements, the WSDOT interstate andentire state route system has a lower roughness than all the
4th International Conference on Managing Pavements (1998)
TRB Committee AFD10 on Pavement Management Systems is providing the information contained herein for use by individual practitioners in state and local transportation agencies, researchers in academic institutions, and other members of the transportation research community. The information in this paper was taken directly from the submission of the author(s).

pavements in Gauteng. It confirms that AC wearing courses givesmoother finish than BST wearing courses.
♦ Roughness of Gautrans pavements with BST wearing courses aresimilar to WSDOT BST wearing courses.
♦ There are no differences in the roughness between pavementswith cemented and granular bases in Gauteng.
3.3.4 RuttingBoth systems make use of a rut-logger to determine the rut depth in thewheelpaths. The major difference between the measurements of the twosystems is that the Gautrans logger is equipped with 14 while WSDOTlogger has only 5 ultra sonic sensors to measure the full width of thelane. This has an influence on the accuracy of measurements done bythe two devices. Since it is difficult to quantify this influence it is nottaken into consideration in the subsequent comparison.
The statistical data of rutting measurements is shown in Table 8.Observations based on this table are as follows:
♦ All WSDOT pavements show less rutting than the Gautranspavements.
♦ The rutting on new and reconstructed pavements is higher than onthe resurfaced pavements of WSDOT interstate route system.
♦ The statistics do not show any influence of the climatic conditionson the rut depth of WSDOT pavements.(East compared with west)
♦ There is no substantial difference in rutting between pavementswith granular and cemented bases in Gauteng.
♦ The Gautrans data shows that the rutting in the outside wheeltrackis 38% higher than the average rutting of both wheeltracks.Therefore, the average rut depth will indicate better pavementcondition than the rutting in individual wheeltracks. In Gautengthe rut depth in the outer wheeltrack can be twice as deep as thatof the inner wheeltrack.
4. CONCLUSIONS
In this paper a comparison is made between two Pavement ManagementSystems (PMS), namely from South Africa the PMS of the GautengProvincial Government (Gautrans) and from the United States of Americathe PMS of the State of Washington (WSDOT).
The statistical comparison between the two systems showed that:
♦ All the AC wearing course pavements of WSDOT show less rutting andlower roughness than the pavements of Gautrans. It confirms superiorperformance of AC pavements to BST wearing courses.
4th International Conference on Managing Pavements (1998)
TRB Committee AFD10 on Pavement Management Systems is providing the information contained herein for use by individual practitioners in state and local transportation agencies, researchers in academic institutions, and other members of the transportation research community. The information in this paper was taken directly from the submission of the author(s).

♦ The Gautrans and WSDOT pavements resurfaced with BST havesimilar roughness although the Gautrans network is older and carriesmuch more traffic. However the WSDOT BST network shows lessrutting than the BST pavements of Gautrans.
♦ New and resurfaced pavements of Gautrans show similar conditions.WSDOT’s new AC pavements are in a worse condition than ACresurfaced pavements. It can be attributed to the fact that they aremuch older than AC resurfaced pavements.
♦ No difference was detected between the performance of cemented andgranular bases in Gauteng. However, taking into consideration muchhigher traffic carried by the granular bases, it can be concluded thatthey perform better than cemented bases.
From the investigation it is clear that the systems are critical componentsin the managing of pavements. As it was demonstrated, the PMS’s canbe used to analyse the following:
♦ effectiveness of maintenance applied;♦ comparison of different maintenance measures;♦ comparison of structural pavement designs;♦ comparison of maintenance effectiveness of various road
authorities;♦ influence of climate on pavement performance;♦ influence of traffic on pavement performance.
4th International Conference on Managing Pavements (1998)
TRB Committee AFD10 on Pavement Management Systems is providing the information contained herein for use by individual practitioners in state and local transportation agencies, researchers in academic institutions, and other members of the transportation research community. The information in this paper was taken directly from the submission of the author(s).

REFERENCES
CASRA, 1992. Pavement Management Systems: Standard VisualAssessment Manual for Flexible Pavements, Technical Methodsfor Highways (TMH9) , Committee of State Road Authorities,Pretoria, South Africa.
Kay, K., Mahoney, J., and Jackson , N., 1993.The WSDOT Pavement Management System - A 1993 Update,Research Report WA-RD 2741.1, Washington State Department ofTransportation, Olympic, Washington, September 1993.
Gauteng Provincial Government, 1995. Procedures to IdentifyProblems on Gauteng Roads, Report No. PPS/T/2, VKEConsulting Engineers, Pretoria, February 1995.
Sayers, M.W., Gillespie, T.D and Paterson, W.D.O., 1986.Guidelines for the conduct and calibration of Road RoughnessMeasurements World Bank Technical Paper No 46, The WorldBank, Washington D.C.
4th International Conference on Managing Pavements (1998)
TRB Committee AFD10 on Pavement Management Systems is providing the information contained herein for use by individual practitioners in state and local transportation agencies, researchers in academic institutions, and other members of the transportation research community. The information in this paper was taken directly from the submission of the author(s).

Table 5 : Current Pavement Wearing Course Age (years)
GAUTRANS
BASE TYPE GRANULAR CEMENTED TOTALNEW BST Resurf NEW BST Resurf NEW BST Resurf
Mean 14.46 6.51 13.62 7.26 14.24 6.78Median 14.00 7.00 12.50 7.00 13.60 7.00S.Deviation 6.20 3.84 6.74 4.26 6.34 3.99Minimum 2.00 1.00 2.00 1.00 2.00 1.00Maximum 27.00 23.00 28.00 23.00 28.00 23.00No. of Sections 93.00 723.00 34.00 406.00 127.00 1129.00Center-line km 242.00 2,047.28 79.00 1,176.43 321.00 3,223.71
WASHINGTON STATE DOTNew or Reconstructed AC Pavements AC Resurfaced Pavements
Interstate Only Interstate Only
East West Total East West TotalMean 10.50 16.40 14.00 6.00 9.20 7.40Median 9.50 19.00 15.00 4.00 6.00 6.00S.Deviation 7.80 8.10 8.40 4.70 6.80 6.20Minimum 2.00 1.00 1.00 1.00 1.00 1.00Maximum 37.00 32.00 37.00 21.00 40.00 40.00No. of Sections 18.00 79.00 97.00 374.00 571.00 945.00Center-line km 35.10 49.30 84.40 677.40 580.00 1,257.40
New or Reconstructed AC Pavements AC Resurfaced PavementsEntire State Route System Entire State Route System
East West Total East West TotalMean 10.20 14.90 13.30 6.50 9.70 8.50Median 9.00 13.00 12.00 5.00 8.00 7.00S.Deviation 7.10 10.00 9.60 4.60 7.20 6.70Minimum 1.00 0.00 0.00 0.00 0.00 0.00Maximum 43.00 59.00 59.00 38.00 52.00 52.000No. of Sections 238.00 767.00 1,005.00 2,226.00 5,538.00 7,764.00Center-line km 231.80 434.2 665.90 2,705.60 4,450.20 7,155.80
BST Resurfaced PavementsEntire State Route System
East West TotalMean 4.40 7.10 4.70
Median 4.00 7.00 4.00S.Deviation 3.50 8.20 5.10Minimum 1.00 1.00 1.00Maximum 50.00 56.00 56.000
No. of Sections 1,583.00 437.00 2,020.00Center-line km 3,142.00 451.50 3,593.50
4th International Conference on Managing Pavements (1998)
TRB Committee AFD10 on Pavement Management Systems is providing the information contained herein for use by individual practitioners in state and local transportation agencies, researchers in academic institutions, and other members of the transportation research community. The information in this paper was taken directly from the submission of the author(s).

Table 6 : Current Pavement Condition
GAUTRANSVCI - VISUAL CONDITION INDEX (0 (worst) - 100 (best))
BASE TYPE GRANULAR CEMENTED TOTALNEW BST Resurf NEW BST Resurf NEW BST Resurf
Mean 67.18 65.12 62.82 64.69 66.02 64.96Median 69.00 67.00 65.00 68.00 67.93 67.36S.Deviation 17.29 16.21 18.13 16.68 17.52 16.38Minimum 27.00 21.00 14.00 17.00 14.00 17.00Maximum 99.00 94.00 89.00 96.00 99.00 96.00No. of Sections 93.00 723.00 34.00 406.00 127.00 1129.00Center-line km 242.00 2047.28 79.00 1176.43 321.00 3223.71
WASHINGTON STATE DOTPSC - Pavement Structural Condition (0 (worst) - 100 (best))
New & Reconstructed AC Pavements Resurfaced AC PavementsInterstate Only Interstate Only
East West Total East West TotalMean 83.60 78.80 80.80 86.90 89.10 87.90Median 84.00 88.00 87.00 86.00 100.00 92.00S.Deviation 14.10 18.70 17.90 13.00 15.80 14.80Minimum 32.00 36.00 32.00 32.00 33.00 32.00Maximum 98.00 100.00 100.00 100.00 100.00 100.00No. of Sections 18.00 79.00 97.00 374.00 571.00 945.00Center-line km 35.10 49.30 84.40 677.40 580.00 1,257.40
New & Reconstructed AC Pavements Resurfaced AC PavementsEntire State Route System Entire State Route System
East West Total East West TotalMean 79.00 79.70 79.50 81.60 81.10 81.30Median 82.00 88.00 86.00 82.00 88.00 86.00S.Deviation 19.30 18.60 18.80 17.10 18.10 17.00Minimum 19.00 11.00 11.00 1.00 10.00 1.00Maximum 100.00 100.00 100.00 100.00 100.00 100.000No. of Sections 238.00 767.00 1,005.000 2,224.00 5,538.00 7,762.00Center-line km 76.70 263.5 340.20 2,703.00 4,450.20 7,153.20
BST Resurfaced PavementsEntire State Route System
East West TotalMean 71.80 74.60 72.10
Median 76.00 78.00 76.00S.Deviation 17.90 20.80 18.60Minimum 10.00 29.00 10.00Maximum 100.00 100.00 100.000
No. of Sections 1,583.00 437.00 2,020.00Center-line km 3,141.80 451.50 3,593.30
4th International Conference on Managing Pavements (1998)
TRB Committee AFD10 on Pavement Management Systems is providing the information contained herein for use by individual practitioners in state and local transportation agencies, researchers in academic institutions, and other members of the transportation research community. The information in this paper was taken directly from the submission of the author(s).

Table 7 : IRI International Roughness Index (m/km)
GAUTRANS
BASE TYPE GRANULAR CEMENTED TOTALNEW BST Resurf NEW BST Resurf NEW BST Resurf
Mean 2.57 2.76 2.69 2.86 2.61 2.79Median 2.52 2.55 2.70 2.81 2.57 2.64S.Deviation 0.59 0.94 0.52 0.75 0.57 0.87Minimum 1.18 1.18 1.74 1.18 0.91 0.91Maximum 4.73 8.32 3.74 5.73 3.64 6.41No. of Sections 93.00 723.00 34.00 406.00 127.00 1129.00Center-line km 242.06 2047.28 79.00 1176.43 321.06 3223.71
WASHINGTON STATE DOT
New & Reconstructed AC Pavements Resurfaced AC PavementsInterstate Only Interstate Only
East West Total East West TotalMean 2.05 1.66 1.82 1.57 1.65 1.61Median 2.03 1.82 1.86 1.72 1.83 1.80S.Deviation 0.55 0.77 0.74 0.49 0.55 0.53Minimum 1.35 0.81 0.81 0.65 0.66 0.65Maximum 3.38 4.48 4.48 3.48 4.77 4.77No. of Sections 18.00 79.00 97.00 373.00 565.00 938.00Center-line km 35.10 49.30 84.40 677.40 577.60 1,225.00
New & Reconstructed AC Pavements Resurfaced AC PavementsEntire State Route System Entire State Route System
East West Total East West TotalMean 2.11 1.88 1.98 1.73 1.86 1.78Median 2.15 2.18 2.16 1.84 2.00 1.92S.Deviation 0.81 0.77 0.79 0.85 0.74 0.80Minimum 1.18 0.81 0.81 0.65 0.66 0.65Maximum 6.33 5.18 6.33 6.90 7.16 7.16No. of Sections 130.00 221.00 351.00 1,675.00 1,681.00 3,356.00Center-line km 100.00 120.90 220.90 2,219.80 1,528.80 3,748.60
BST Resurfaced PavementsEntire State Route System
East West TotalMean 2.66 3.20 2.71Median 2.61 3.25 2.71S.Deviation 0.67 0.82 0.75Minimum 1.15 1.28 1.15Maximum 5.91 7.40 7.40No. of Sections 1,194.00 238.00 1,432.00Center-line km 2,418.90 259.60 2,679.00
4th International Conference on Managing Pavements (1998)
TRB Committee AFD10 on Pavement Management Systems is providing the information contained herein for use by individual practitioners in state and local transportation agencies, researchers in academic institutions, and other members of the transportation research community. The information in this paper was taken directly from the submission of the author(s).

Table 8 : Rutting (mm)
GAUTRANSRUTTING (mm) mean (left + right)
BASE TYPE GRANULAR CEMENTED TOTALNEW BST Resurf NEW BST Resurf NEW BST Resurf
Mean 7.20 6.78 5.93 6.85 6.86 6.81Median 6.34 5.85 5.60 6.33 6.14 6.02S.Deviation 3.34 3.91 1.83 2.57 2.94 3.43Minimum 3.22 1.40 3.87 2.27 3.20 1.40Maximum 25.40 44.25 9.54 16.95 25.40 44.20No. of Sections 93.00 723.00 34.00 406.00 127.00 1129.00Center-line km 242.06 2047.28 79.00 1176.43 321.06 3223.71
RUTTING (mm) OUTER WHEELTRACK ONLYBASE TYPE GRANULAR CEMENTED TOTAL
NEW BST Resurf NEW BST Resurf NEW BST ResurfMean 9.80 9.35 8.03 9.69 9.33 9.47Median 7.78 7.67 6.85 8.35 7.53 7.91S.Deviation 6.44 7.05 3.64 4.78 5.69 6.23Minimum 2.67 1.30 3.65 2.60 2.70 2.70Maximum 44.61 71.45 15.46 30.30 44.60 71.40No. of Sections 93.00 723.00 34.00 406.00 127.00 1129.00Center-line km 242.06 2047.28 79.00 1176.43 321.06 3223.71
WASHINGTON STATE DOTRUTTING (mm) mean (left + right)
New & Reconstructed AC Pavements Resurfaced AC PavementsInterstate Only Interstate Only
East West Total East West TotalMean 7.40 5.70 6.40 4.30 5.20 4.70Median 3.00 5.00 5.00 3.00 4.00 4.00S.Deviation 3.70 3.70 3.70 3.20 3.40 3.40Minimum 0.00 0.00 0.00 0.00 0.00 0.00Maximum 12.00 15.10 15.10 16.00 16.00 16.00No. of Sections 18.00 79.00 97.00 373.00 565.00 938.00Center-line km 35.10 49.30 84.40 677.40 577.60 1,255.00
New & Reconstructed AC Pavements Resurfaced AC PavementsEntire State Route System Entire State Route System
East West Total East West TotalMean 4.70 3.60 4.1 4.00 4.10 4.00Median 3.00 3.00 3 3.00 3.00 3.00S.Deviation 2.60 2.90 2.8 2.70 2.90 2.80Minimum 0.00 0.00 0.00 0.00 0.00 0.00Maximum 12.00 15.10 15.10 16.90 16.00 16.90No. of Sections 130.00 221.00 351.00 1,673.00 1,680.00 3,353.00Center-line km 100.00 120.90 220.90 2,218.40 1,528.20 3,746.60
4th International Conference on Managing Pavements (1998)
TRB Committee AFD10 on Pavement Management Systems is providing the information contained herein for use by individual practitioners in state and local transportation agencies, researchers in academic institutions, and other members of the transportation research community. The information in this paper was taken directly from the submission of the author(s).

Table 8 (cont) : Rutting (mm)
WASHINGTON STATE DOTRUTTING (mm) mean (left + right)
BST Resurfaced PavementsEntire State Route System
East West TotalMean 4.80 4.40 4.80Median 4.00 4.00 4.00S.Deviation 2.50 2.60 2.50Minimum 0.00 0.00 0.00Maximum 13.00 13.00 13.00No. of Sections 1,194.00 238.00 1,432.00Center-line km 2,418.90 259.60 2,678.50
4th International Conference on Managing Pavements (1998)
TRB Committee AFD10 on Pavement Management Systems is providing the information contained herein for use by individual practitioners in state and local transportation agencies, researchers in academic institutions, and other members of the transportation research community. The information in this paper was taken directly from the submission of the author(s).