paradox of the drinking-straw model of the butterfly...
TRANSCRIPT

© 2014. Published by The Company of Biologists Ltd | The Journal of Experimental Biology (2014) 217, 2430 doi:10.1242/jeb.109447
CORRECTION
Paradox of the drinking-straw model of the butterfly proboscisChen-Chih Tsai, Daria Monaenkova, Charles Beard, Peter Adler and Konstantin Kornev
There was an error published in J. Exp. Biol. 217, 2130-2138. Eqns A12 and A13 in the Appendix were cropped. The online pdf and full-text versions (but not the print version) of the article have been corrected. The correct versions of the equations also appear below.
We apologise to the authors and readers for this error.
=
+⎛⎝⎜
⎞⎠⎟
+ ρ ρ+
⎡
⎣⎢
⎤
⎦⎥
g gP
aba b
rL L
r PL L
rL L
L LabL
a b1
––
– –( – ) – . (A12)p
4
p
4c
p
4
pp
p
=η
ρ
+ +gL
tr P L
L Lr a b
ab
dd 8
( – )
–( )
. (A13)2
c
p
4
2430

The
Jour
nal o
f Exp
erim
enta
l Bio
logy
2130
© 2014. Published by The Company of Biologists Ltd | The Journal of Experimental Biology (2014) 217, 2130-2138 doi:10.1242/jeb.097998
ABSTRACTFluid-feeding Lepidoptera use an elongated proboscis, conventionallymodeled as a drinking straw, to feed from pools and films of liquid.Using the monarch butterfly, Danaus plexippus (Linnaeus), we showthat the inherent structural features of the lepidopteran probosciscontradict the basic assumptions of the drinking-straw model. Byexperimentally characterizing permeability and flow in the proboscis,we show that tapering of the food canal in the drinking regionincreases resistance, significantly hindering the flow of fluid. Thecalculated pressure differential required for a suction pump to supportflow along the entire proboscis is greater than 1 atm (~101 kPa) whenthe butterfly feeds from a pool of liquid. We suggest that behavioralstrategies employed by butterflies and moths can resolve thisparadoxical pressure anomaly. Butterflies can alter the taper, theinterlegular spacing and the terminal opening of the food canal,thereby controlling fluid entry and flow, by splaying the galeal tipsapart, sliding the galeae along one another, pulsing hemolymph intoeach galeal lumen, and pressing the proboscis against a substrate.Thus, although physical construction of the proboscis limits itsmechanical capabilities, its functionality can be modified andenhanced by behavioral strategies.
KEY WORDS: Butterfly feeding, Hagen–Poiseuille flow,Lepidoptera, Suction pressure, Wicking phenomena
INTRODUCTIONButterflies and moths (Lepidoptera) use their slender proboscises tosip nectar, plant sap, animal tears, blood and other fluids, which aregenerally complex in composition (Krenn, 2010). The proboscissimultaneously is a multifunctional material and a fluidic devicecomposed of two flexible strands, the maxillary galeae, with C-shaped medial faces joined by cuticular projections, the legulae(Monaenkova et al., 2012) (Fig. 1). The materials organization of theproboscis is unique, enabling it to perform multiple tasks, such asfluid acquisition, environmental sensing, coiling and uncoiling, andself-cleaning (Eastham and Eassa, 1955; Kingsolver and Daniel,1995; Krenn, 2010).
The size of the dorsal legulae and their spacing significantlyincrease in the distal 5–20% of the proboscis (Krenn, 2010;Monaenkova et al., 2012). The distal region of the proboscis,which is called the ‘drinking region’, is hydrophilic, while theremaining portion has hydrophobic properties (Lehnert et al.,2013). The drinking region plays a critical role in fluid acquisition,especially for Lepidoptera that feed from porous materials such asrotten fruit. Submicrometer pores (interlegular spaces) in the
RESEARCH ARTICLE
1Department of Materials Science and Engineering, Clemson University, Clemson,SC 29634, USA. 2School of Physics, Georgia Institute of Technology, Atlanta, GA 30332, USA. 3School of Agricultural, Forest and Environmental Sciences,Clemson University, Clemson, SC 29634, USA.
*Author for correspondence ([email protected])
Received 5 October 2013; Accepted 4 March 2014
proboscis, which is initially air filled, provide strong capillaryaction favoring the uptake of fluid droplets and films, andfacilitating fluid withdrawal from substrate pores (Tsai et al., 2011;Monaenkova et al., 2012). The proboscises of Lepidoptera thatfeed on porous materials, such as rotten fruit, typically have abrush-like lateral series of chemosensilla that aid fluid uptake(Knopp and Krenn, 2003; Monaenkova et al., 2012; Lehnert et al.,2013). Extant members of ancient lepidopteran lineages also havebrushy proboscises (Krenn and Kristensen, 2000), suggesting thatcapillarity had an early selective advantage, perhaps in exploitinglimited moisture and sugary exudates (Kristensen, 1984; Grimaldiand Engel, 2005). To acquire fluid from porous materials andliquid films, butterflies rely on capillary instability in the foodcanal to partition the fluid into bubble trains and reduce theeffective viscosity, relative to a continuous liquid column; thebubble train then facilitates the ability of the cibarial pump to drawfluid into the gut (Monaenkova et al., 2012). Lepidoptera, thus, usethe dual action of capillarity and cibarial pumping to acquire fluidsfrom porous materials and films. Evolutionary diversification ofsiphonate Lepidoptera, including those with comparatively smoothproboscises capable of reaching pools of nectar in floral tubes, wasassociated with the radiation of flowering plants (Barth, 1991;Grimaldi and Engel, 2005).
The mechanism by which Lepidoptera acquire fluid from a poolhas been debated (Kingsolver and Daniel, 1995; Borrell, 2006;Borrell and Krenn, 2006). The drinking-straw model, based on theHagen–Poiseuille equation (Vogel, 2003), was proposed to explaina relationship between the observed flow rate and the pressuredifferential required from the cibarial suction pump. This modelassumes that the food canal is a straight tube, circular in cross-section (Kingsolver and Daniel, 1979; Kingsolver, 1985;Kingsolver and Daniel, 1995). The drinking-straw model is usefulfor crude estimates of the effects of food canal diameter and fluidviscosity on the feeding efficiency and energetic requirements(Kingsolver, 1985; Kingsolver and Daniel, 1995). The model facesproblems, however, when attempting to interpret experimentalobservations of the uptake of thick fluids (Lehane, 2005). Asrevealed by X-ray tomography (Monaenkova et al., 2012), thefood canal tapers apically to a microscopic slit-like opening. Thecomplex geometry of the food canal draws into question whetherthe Hagen–Poiseuille model (Kingsolver and Daniel, 1995) of flowthrough a cylindrical tube can be applied directly to the butterflyproboscis. The distal taper of the food canal (Krenn andMuhlberger, 2002; Monaenkova et al., 2012) presents a structuralproblem for the drinking-straw model.
To test the hypothesis that the proboscis can function as a Hagen–Poiseuille straw, we examined permeability and flow in the drinkingregion of the monarch butterfly, Danaus plexippus (Linnaeus).
Proboscis permeabilityThe ability of a conduit or porous material to transport fluid at thefixed pressure gradient is characterized by the materials parametercalled ‘permeability’ (Scheidegger, 1974; Dullien, 1991), denoted
Paradox of the drinking-straw model of the butterfly proboscisChen-Chih Tsai1, Daria Monaenkova1,2, Charles E. Beard3, Peter H. Adler3 and Konstantin G. Kornev1,*

The
Jour
nal o
f Exp
erim
enta
l Bio
logy
2131
RESEARCH ARTICLE The Journal of Experimental Biology (2014) doi:10.1242/jeb.097998
here as k. Permeability enters the problem via Darcy’s law(Scheidegger, 1974; Dullien, 1991), which states that the flowdischarge Q through the food canal of cross-sectional area A andlength L is written as:
Q = (kA / η) (ΔP / L) , (1)
where η is the liquid viscosity and ΔP is the pressure differential. Inparticular, if the proboscis is modeled as a cylindrical tube of radiusr, the permeability k is derived from the Hagen–Poiseuille law ask=r2/8 (Vogel, 2003). For a more complex geometry, the materialparameter k can be obtained by directly measuring the total flow rateQ and pressure gradient and by knowing the cross-sectional area ofthe food canal and viscosity of the liquid.
Permeability is a convenient metric for characterizing transportproperties of the butterfly proboscis and interlegular pore structure(Monaenkova et al., 2012). Permeability of the interlegular pores in
the non-drinking region can be determined by placing a droplet ofwater on the dorsal legulae and evaluating its uptake kinetics(Monaenkova et al., 2012). The distances between adjacent legulaeof a monarch butterfly were estimated as 96±27 and 162±18 nm at5 and 10 mm distal to the head, respectively (Monaenkova et al.,2012). This droplet method, however, is not reliable for determiningthe permeability of the drinking region; the spreading and intakerates of a droplet in the drinking region are comparable.
We therefore developed a new method to evaluate proboscispermeability in the drinking region. A proboscis was inserted into aglass capillary tube and immersed in deionized water (Fig. 2). Thefood canal of the proboscis was initially filled with air. As a resultof capillary forces, water spontaneously invaded the proboscis pores(interlegular spaces) and food canal, moving farther into thecapillary tube. When the proboscis was filled with water and ameniscus appeared in the capillary tube, the flow rate was measureddirectly with a Cahn DCA-322 Dynamic Contact Angle Analyzer.By monitoring incremental changes in the weight of a hangingcapillary tube, we were able to evaluate flow rates. The flow ratesthrough the capillary tube and the proboscis were the same, allowingus to specify the flow through the proboscis.
According to Darcy’s law, Eqn 1, the pressure differential at pointy=Lp (Fig. 2A), where the proboscis meets the bore, needs to bedetermined to obtain the permeability of the proboscis. Thispressure, Pp, could not be measured. However, we could estimatethe pressure at the meniscus moving in the capillary tube, knowingthe contact angle θ determined from Jurin’s experiments (Jurin,1917–1919), as previously discussed for this geometry (Tsai andKornev, 2013), surface tension σ of the liquid and radius r of thecapillary tube. The driving capillary pressure:
Pc = 2σcosθ/r , (2)
thus was obtained independently (Tsai and Kornev, 2013). Once thedriving capillary pressure was known, the problem of determiningproboscis permeability was reduced to the problem of liquid flowthrough a composite conduit consisting of two tubes connected in asequence (Tsai and Kornev, 2013).
When a conduit has a fixed length and the pressure differential isapplied to the ends of this conduit, the flow description is reducedto the Cohn–Rashevsky method of design of some parts of thecardiovascular system (Cohn, 1954; Cohn, 1955; Rashevsky, 1960).In the case of a moving meniscus, the length of the liquid columnchanges with time and the Cohn–Rashevsky model needs to bechanged. A more realistic model of a tapered food canal was usedand compared with the straight cylinder model. In each tube of thecomplex conduit, the flow was assumed to follow theHagen–Poiseuille law, and the conservation of mass and the pressurecontinuity were used as the boundary conditions at the point wherethe proboscis met the capillary tube. With this model, thepermeability of the capillary tube could be separated from thepermeability of the proboscis.
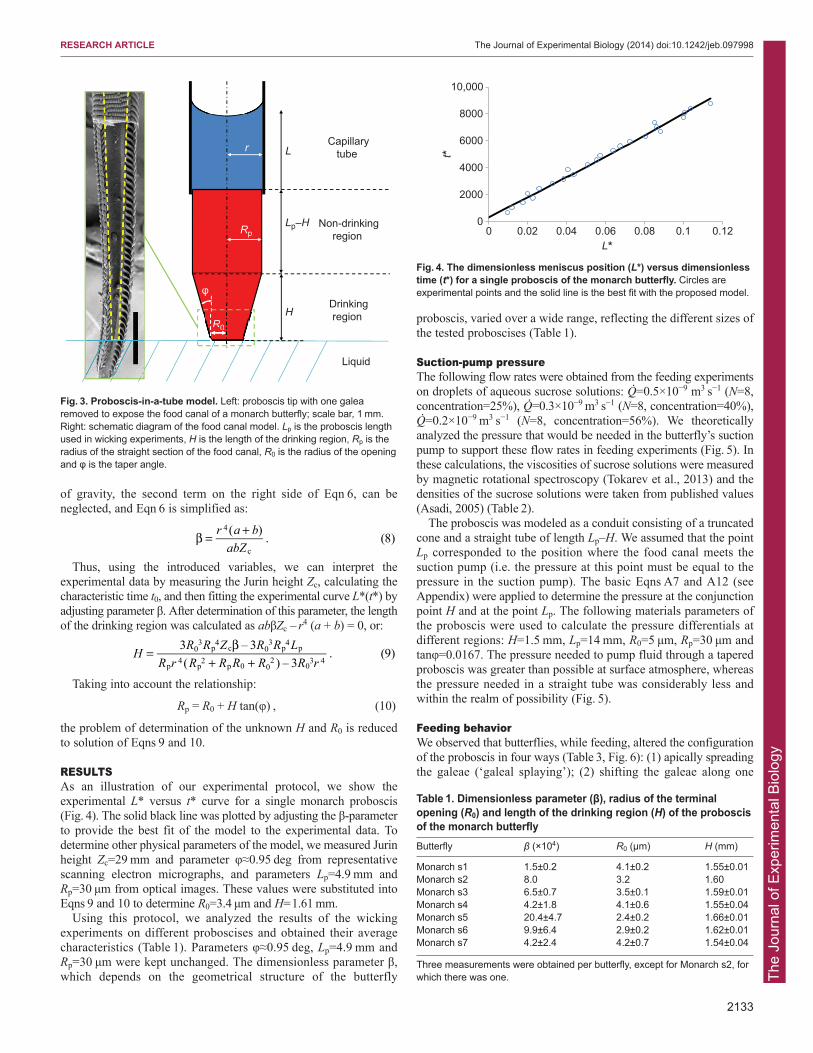
Interpretation of wicking experimentsThe proboscis-in-a-tube system was modeled as a complex conduitconsisting of three distinct parts (Fig. 3): (i) the drinking region oflength H where the food canal tapered at angle φ and the legularstructure changed significantly (Lehnert et al., 2013); (ii) the non-drinking region, an almost straight section of the food canal,modeled as a straight, circular cylinder of inner radius Rp and lengthLp–H; and (iii) the capillary tube of inner radius r. The galeae at theproboscis tip sometimes opened during feeding; hence, we modeledthe drinking region as a cylindrical truncated cone with an unknown
List of symbols and abbreviationsa 3tanφR0
3Rp3/(Rp
3–R03)
b Rp4/(Lp–H)
c [Pp–PH+ρg(Lp–H)]/(Lp–H)d Pp+ρgLp–Lp[Pp–PH+ρg(Lp–H)]/(Lp–H)A cross-sectional area of food canalDCA dynamic contact angleF wetting forceg gravitational accelerationH length of drinking regionhd droplet height k permeabilitykH permeability of the drinking region of the probosciskp permeability of the proboscisL meniscus positionL* dimensionless meniscus positionLp length of proboscis used in experimentsp perimeterP pressurePc capillary pressurePH pressure differential at the boundary of the drinking regionPp pressure differential in the cibarial pump in a tapered food canalPt pressure differential in the cibarial pump in a drinking-straw
modelQ flow rate (liquid discharge per unit time)Qc flow rate through the capillary tubeQH flow rate through the drinking region of the food canalQp flow rate through the non-drinking region of the food canalr radius of the capillary tubeR radius of the food canalR0 radius of the food canal openingrd droplet radiusRH relative humidityRp radius of the straight section of the food canalt timet* dimensionless timet0 characteristic timeV volumeVd droplet volume x coordinatey coordinateZc Jurin heightZDOI zero depth of immersion β dimensionless parameterη liquid viscosityθ contact angleρ liquid densityσ surface tensionφ taper angleΦ flow potential

The
Jour
nal o
f Exp
erim
enta
l Bio
logy
2132
RESEARCH ARTICLE The Journal of Experimental Biology (2014) doi:10.1242/jeb.097998
radius at the opening, R0. This radius was determined by fitting theexperimental data with a developed model. With the proboscis-in-a-tube model as a series of three conduits – a Cohn–Rashevsky-typemodel of liquid flow through a conduit chain – we applied the basicconservation laws of fluid mechanics to derive the followingequation describing the change of length of the liquid column, L(t)(see Appendix):
where a=3tanφR03Rp
3/(Rp3–R0
3) and b=Rp4/(Lp–H).
Engineering parameters of the butterfly proboscisThe derived equation depends on structural parameters of theproboscis and physico-chemical parameters of the liquid. Thedynamics of meniscus propagation, however, depend only on asingle dimensionless complex. It is convenient to introduce the Jurinheight, Zc=2σcosθ/(ρgr), where ρ is the liquid density and g isacceleration due to gravity (Jurin, 1917–1919; Lehnert et al., 2013;Tsai and Kornev, 2013); this is the maximum height that the
=η
ρ
+ +gL
tr P L
L Lr a b
ab
dd 8
( – )
–( )
, (3)2
c
p
4
meniscus can reach in a given capillary tube. Measuring the time inunits as:
which is the time required for a liquid meniscus to reach the Jurinlength, we can rewrite Eqn 3 in dimensionless variables L*=L/Zc,t*=t/t0 as:
where:
Eqn 5 is the Lucas–Washburn equation describing capillary risein tubes (Lucas, 1918; Washburn, 1921), which has the solution:
–L* – (1 + β) ln(1 – L*) = t* . (7)
In our experiments, the proboscis length was ~5 mm, which issmaller than the Jurin height, ~29 mm (Lp<<Zc). Hence, the effect
= η = ησ θg g
tZ
p r p r8 16 cos
, (4)c0 2 2 2 3
=+β
Lt
LL
d *d *
1– ** ’
, (5)
β = +r a babZ
LZ
( )– . (6)
4
c
p
c
A B
C
Fig. 1. Scanning electron micrographs of the monarchbutterfly proboscis. (A) Single galea of the monarchproboscis, with the open food canal facing upward; the taperof the food canal is noticeable only in the drinking region.(B) Dorsal legulae with slit-like pores (interlegular spaces)enabling liquid to enter the food canal. (C) Proboscis tipshowing a slit between opposing galeae; the spacing of thegap can change during feeding.
a b c
L L 1/5 L
Stirrup
Capillary tube
Liquid
Butterfly proboscis
Closed vessel
Motor oil
r
L(t)
Lp
φ
θ
rr
θθθ
y
x
R0
A
B C D
Counter-weight
Fig. 2. Analysis of proboscis permeability. (A) Schematicdiagram of the experiment showing operation of the CahnDCA-322. A capillary tube with an inserted proboscis isconnected to the balance arm by a hook. An oil droplet closesthe rectangular vessel, preventing water evaporation andallowing the tube to move freely through the hole. Watermoves from the reservoir to the tube by capillary action. Theweight of the wicking water column is measured by thebalance arm as the meniscus moves up the bore of thecapillary tube. L, meniscus position; r, radius of the capillarytube; θ, contact angle; L(t), change in the length of the liquidcolumn; Lp, length of the proboscis; R0, radius of opening; φ,taper angle; xy, the plane of proboscis placement; a–c, loops(see Materials and methods). (B) Closed vessel after 1 h ofsaturation with water vapor. The proboscis is suspendedabove the water. (C) The same vessel at the moment when theproboscis touches the water. (D) Example of measurement ofJurin height (Zc); arrow indicates the meniscus.
The
Jour
nal o
f Exp
erim
enta
l Bio
logy
2133
RESEARCH ARTICLE The Journal of Experimental Biology (2014) doi:10.1242/jeb.097998
of gravity, the second term on the right side of Eqn 6, can beneglected, and Eqn 6 is simplified as:
Thus, using the introduced variables, we can interpret theexperimental data by measuring the Jurin height Zc, calculating thecharacteristic time t0, and then fitting the experimental curve L*(t*) byadjusting parameter β. After determination of this parameter, the lengthof the drinking region was calculated as abβZc – r4 (a + b) = 0, or:
Taking into account the relationship:
Rp = R0 + H tan(φ) , (10)
the problem of determination of the unknown H and R0 is reducedto solution of Eqns 9 and 10.
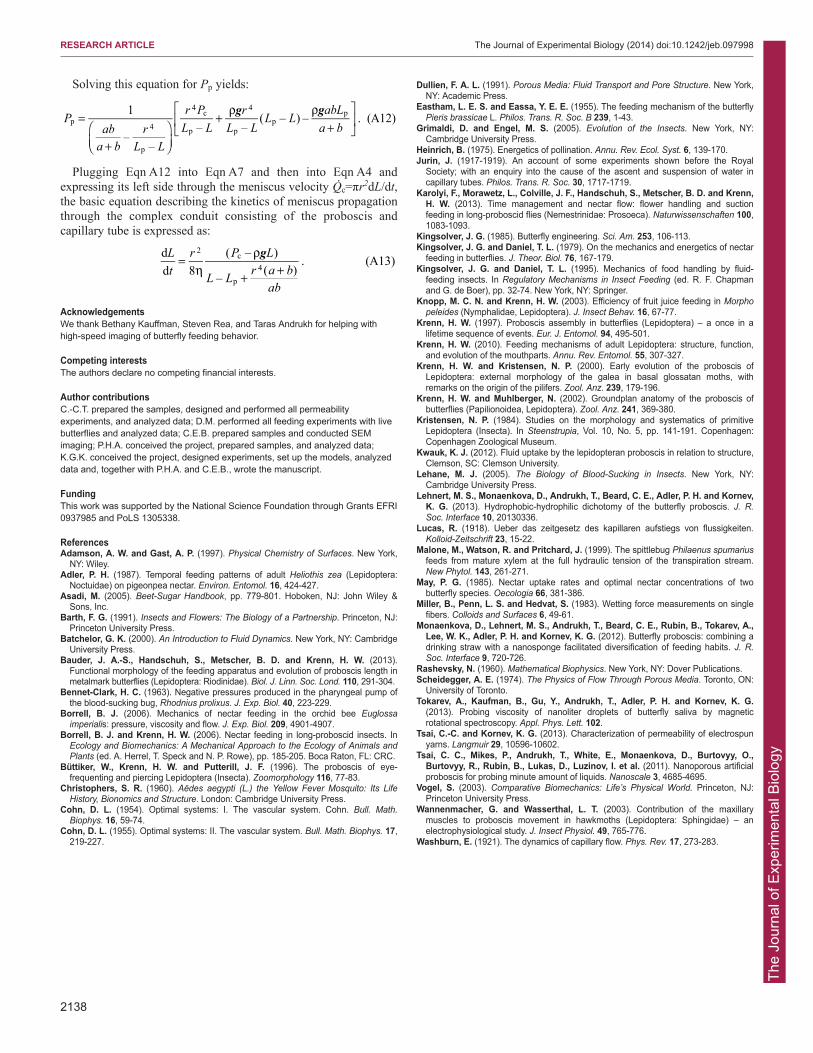
RESULTSAs an illustration of our experimental protocol, we show theexperimental L* versus t* curve for a single monarch proboscis(Fig. 4). The solid black line was plotted by adjusting the β-parameterto provide the best fit of the model to the experimental data. Todetermine other physical parameters of the model, we measured Jurinheight Zc=29 mm and parameter φ≈0.95 deg from representativescanning electron micrographs, and parameters Lp=4.9 mm andRp=30 μm from optical images. These values were substituted intoEqns 9 and 10 to determine R0=3.4 μm and H=1.61 mm.
Using this protocol, we analyzed the results of the wickingexperiments on different proboscises and obtained their averagecharacteristics (Table 1). Parameters φ≈0.95 deg, Lp=4.9 mm andRp=30 μm were kept unchanged. The dimensionless parameter β,which depends on the geometrical structure of the butterfly
β = +r a babZ( )
. (8)4
c
=β
+ +H
R R Z R R LR r R R R R R r
3 – 3( ) – 3
. (9)0 3
p 4
c 0 3
p 4
p
p4
p 2
p 0 0 2
0 3 4
proboscis, varied over a wide range, reflecting the different sizes ofthe tested proboscises (Table 1).
Suction-pump pressureThe following flow rates were obtained from the feeding experimentson droplets of aqueous sucrose solutions: Q=0.5×10⁻⁹ m3 s−1 (N=8,concentration=25%), Q=0.3×10⁻⁹ m3 s−1 (N=8, concentration=40%),Q=0.2×10⁻⁹ m3 s−1 (N=8, concentration=56%). We theoreticallyanalyzed the pressure that would be needed in the butterfly’s suctionpump to support these flow rates in feeding experiments (Fig. 5). Inthese calculations, the viscosities of sucrose solutions were measuredby magnetic rotational spectroscopy (Tokarev et al., 2013) and thedensities of the sucrose solutions were taken from published values(Asadi, 2005) (Table 2).
The proboscis was modeled as a conduit consisting of a truncatedcone and a straight tube of length Lp–H. We assumed that the pointLp corresponded to the position where the food canal meets thesuction pump (i.e. the pressure at this point must be equal to thepressure in the suction pump). The basic Eqns A7 and A12 (seeAppendix) were applied to determine the pressure at the conjunctionpoint H and at the point Lp. The following materials parameters ofthe proboscis were used to calculate the pressure differentials atdifferent regions: H=1.5 mm, Lp=14 mm, R0=5 μm, Rp=30 μm andtanφ=0.0167. The pressure needed to pump fluid through a taperedproboscis was greater than possible at surface atmosphere, whereasthe pressure needed in a straight tube was considerably less andwithin the realm of possibility (Fig. 5).
Feeding behaviorWe observed that butterflies, while feeding, altered the configurationof the proboscis in four ways (Table 3, Fig. 6): (1) apically spreadingthe galeae (‘galeal splaying’); (2) shifting the galeae along one
φ
R0
Rp
H
Lp–H
Lr Capillarytube
Non-drinkingregion
Drinkingregion
Liquid
R00
Fig. 3. Proboscis-in-a-tube model. Left: proboscis tip with one galearemoved to expose the food canal of a monarch butterfly; scale bar, 1 mm.Right: schematic diagram of the food canal model. Lp is the proboscis lengthused in wicking experiments, H is the length of the drinking region, Rp is theradius of the straight section of the food canal, R0 is the radius of the openingand φ is the taper angle.
2000
4000
6000
8000
10,000
0 0.02 0.04 0.06 0.08 0.1 0.12
t *
L*
0
Fig. 4. The dimensionless meniscus position (L*) versus dimensionlesstime (t*) for a single proboscis of the monarch butterfly. Circles areexperimental points and the solid line is the best fit with the proposed model.
Table 1. Dimensionless parameter (β), radius of the terminalopening (R0) and length of the drinking region (H) of the proboscisof the monarch butterflyButterfly β (×104) R0 (μm) H (mm)
Monarch s1 1.5±0.2 4.1±0.2 1.55±0.01Monarch s2 8.0 3.2 1.60Monarch s3 6.5±0.7 3.5±0.1 1.59±0.01Monarch s4 4.2±1.8 4.1±0.6 1.55±0.04Monarch s5 20.4±4.7 2.4±0.2 1.66±0.01Monarch s6 9.9±6.4 2.9±0.2 1.62±0.01Monarch s7 4.2±2.4 4.2±0.7 1.54±0.04
Three measurements were obtained per butterfly, except for Monarch s2, forwhich there was one.

The
Jour
nal o
f Exp
erim
enta
l Bio
logy
2134
RESEARCH ARTICLE The Journal of Experimental Biology (2014) doi:10.1242/jeb.097998
another in antiparallel movements (‘galeal sliding’); (3) radiallyexpanding and contracting each galea (‘galeal pulsing’); and (4)forcing the proboscis against a surface (‘galeal pressing’). Eachbutterfly performed at least one of these behaviors while feeding ontwo to four droplets of 15% sucrose solution.
During galeal splaying, the two galeae separated slightly at theirapices over a variable portion of the drinking region, whereas duringgaleal sliding, the galeae remained paired but moved along oneanother in antiparallel fashion for a distance of up to three proboscisdiameters. During galeal sliding, one galea shifted toward the head,opening the end of the proboscis; the inner face of the food canal ofthe steady galea remained open for 0.1–90.0 s. Galeal pulsinginvolved rapid (0.05–0.30 s) expansion and contraction of eachgalea. Galeal sliding and pulsing were performed by individualbutterflies independently or sequentially in the same feeding trial.Butterflies feeding on large drops pressed their proboscises to thesubstrate, alternately increasing and decreasing the proboscisdiameter by as much as 5–8%.
DISCUSSIONIn experiments on monarchs feeding from large droplets intended tosimulate pools of liquid, the flow rates vary from 0.2×10⁻⁹ to0.5×10−9 m3 s−1. Similar flow rates have been obtained for otherspecies of butterflies (May, 1985). The sucrose solutions that wetested (25–56%) include sugar concentrations in flowers visited byLepidoptera (Heinrich, 1975; Adler, 1987). These experiments setthe metrics for the flow rates of interest. Using theoretical modelsof proboscises with tapered and smooth channels, we estimated thepressure required by a suction pump to support these, and greater,flow rates. Based on the model that a tapered tube more accuratelyapproximates actual proboscis structure, we found that the pressuredifferential in the suction pump at the observed flow rates should begreater than 1 atm. Estimates for blood- and sap-feeding bugssupport the need for high pressure differentials (Bennet-Clark, 1963;
Malone et al., 1999). Even for dilute sucrose solutions (e.g. 10%),the pressure differential is expected to be greater than 1 atm.However, no vacuum pump can produce a pressure differentialgreater than 1 atm in surface atmosphere (i.e. in an open system).Kingsolver and Daniel also point out that pressure differentials ofmore than 1 atm would be a mechanical limitation to butterflyfeeding (Kingsolver and Daniel, 1979). In the drinking region wherethe food canal tapers, the pressure drops significantly, and theproximal portion of the proboscis makes a minor contribution to thepressure differential, as indicated (Fig. 5) by the close approximationof paired lines for pressure at the drinking region (PH) and in thecibarial pump (Pp). Thus, more than 1 atm of pressure differentialwould need to be generated by the pump or another mechanism(s)to overcome the restriction of the tapered food canal in the drinkingregion; less force would be needed in the absence of a taper.
A tapered proboscis and food canal are characteristic ofLepidoptera (Krenn and Muhlberger, 2002); thus, the role of thetaper in influencing the pressure differential is likely to bewidespread among butterflies and moths. Moreover, a tapered foodcanal might be characteristic of most, if not all, fluid-feeding insectswith an elongated proboscis, regardless of fluid source or type.Thus, insects such as blood-sucking true bugs and mosquitoes, sap-feeding planthoppers and nectar-feeding flies all have a tapered foodcanal (Christophers, 1960; Bennet-Clark, 1963; Malone et al., 1999;Karolyi et al., 2013). Butterflies, however, have a distinct feature;the proboscis has pores along its length that provide opportunitiesfor air to enter or cavitation to occur. When butterflies use thecibarial pump to move liquid up the food canal, menisci in theinterlegular slits deform to follow the pressure gradient. A similareffect can be observed by stretching a sponge completely filled withwater; the water moves from the sides of the sponge, reflecting thechange of pressure in the liquid column. When suction pressure ishigh, an air bubble can enter the food canal through the interlegularslits, supporting the partitioning of the liquid column. Also, to obtainfeeding rates, we submersed the butterfly proboscis in fluid to avoidair in the food canal. However, under natural feeding conditions, airwould enter the porous proboscis. Thus, the butterfly proboscis isnot a closed system.
We recently showed that structural features of the drinking region,including tapering of the food canal, facilitate fluid acquisition byenhancing capillary action, allowing butterflies to drink from poroussurfaces, such as damp soil (Monaenkova et al., 2012; Lehnert et al.,2013). Additional benefits of a tapered proboscis, with aconcomitantly tapered food canal, include reduced costs associated
Table 2. Properties of model nectarsSucrose concentration η (mPa s) ρ (kg m–3)
10% 1.3±0.2 104020% 1.7±0.2 108330% 3.8±0.4 112940% 6.9±0.7 1179
Data are from table A1 in Asadi (Asadi, 2005).η, liquid viscosity; ρ, liquid density.
Q (m3 s–1)0
∆P (P
a)
0
2e+5
4e+5
6e+5
8e+5
1e+6
10%, PH 10%, Pp
10%, Pt
20%, PH
20%, Pp
20%, Pt
30%, PH
30%, Pp
30%, Pt
40%, PH
40%, Pp
40%, Pt
Tape
red
Non
-tape
red
2.0e–10 4.0e–10 6.0e–10 8.0e–10 1.0e–9 1.2e–9
Fig. 5. Pressure required to provide flow in tapered andnon-tapered theoretical models of butterflyproboscises. PH is the pressure differential required in atapered food canal at the drinking region (position H inFig. 3); Pp is the pressure differential in the cibarial pump ina tapered food canal (position Lp in Fig. 3); Pt is the pressuredifferential in the cibarial pump in the drinking-straw (non-tapered) model when the radius (Rp) of the food canal doesnot change along the proboscis. Percentages indicateaqueous sucrose concentrations. The red horizontal dashedline at 1 atm indicates the maximum limit of pressuredifferential that could be produced by the cibarial pump. Thedashed line below the x-axis indicates the measured flowrates for monarch butterflies.

The
Jour
nal o
f Exp
erim
enta
l Bio
logy
2135
RESEARCH ARTICLE The Journal of Experimental Biology (2014) doi:10.1242/jeb.097998
with cuticular thickening (Bauder et al., 2013) and the ability to reachfluid sequestered in small recesses. The benefits of a tapered foodcanal, however, are countered by increased viscous friction (Batchelor,2000) that hinders flow. However, the required pressure can besignificantly reduced when the taper is ignored, as in previous models(e.g. Kingsolver and Daniel, 1979); in most cases the requiredpressure drops below atmospheric pressure for the same flow rate.
Optimizing uptake from liquid films and menisci, versus pools,therefore, is contradictory; a small lumen enhances capillarity(Monaenkova et al., 2012), whereas a large lumen enhances flow(Kingsolver and Daniel, 1995; Vogel, 2003). In other words, fluiduptake by the butterfly proboscis presents a paradox: a simpledrinking-straw model that ignores structural features of theproboscis avoids the catastrophic pressure differential, whereasincorporating actual proboscis structure – the taper – into the modelcauses the required pressure to skyrocket.
We suggest that the mechanism of fluid uptake is more complexthan a strict drinking-straw analogy and that the paradox can beresolved by a suite of behavioral strategies (Table 3). Galeal slidingcould adjust the fluid–pressure differential by changing the size of theinterlegular pores and terminal opening and by reducing the active,tapered length of the food canal. The ability to slide the galeae inantiparallel movements (Krenn, 1997) is well documented for mothsthat pierce animal and plant tissues (Büttiker et al., 1996); it alsooccurs in nectar-feeding Lepidoptera (Kwauk, 2012) and could serveto adjust the pressure differential. Galeal sliding might facilitatemeniscus formation and transport if the amount of fluid is minute anda droplet is trapped in the food canal. Galeal sliding also couldfacilitate debris removal from the legular linkage. Galeal splayingopens the distal tip of the proboscis and should function to reduce thepressure differential by increasing the diameter in the tapered region.Although we observed this behavior in the monarchs in only twoinstances, we have observed it regularly in Gulf fritillaries, Agraulisvanillae. Galeal pulsing might be controlled by processes similar tothose that drive coiling and uncoiling of the proboscis. Uncoiling, forexample, is achieved by increased hemolymph pressure in each galea,
brought about by contractions of the maxillary stipital muscles,whereas coiling is achieved by contractions of intrinsic galeal muscles(Wannenmacher and Wasserthal, 2003). When hemolymph is forcedfrom the head into the galeal lumen, it would be expected to travel ina rapid wave, supporting peristaltic pumping of fluid and increasinginterlegular spacing and the diameter of the food canal. Galealpressing would alter the food canal diameter, the legular spacing andperhaps also the surface contact area for capillarity.
We previously showed that the full cibarial pump cycle takes0.45–0.70 s at 25°C (Monaenkova et al., 2012). Galeal sliding canbe slower, lasting 0.1–90 s, and can, therefore, be independent of thepump; the proboscis would be able to remain open for multiplepump cycles. Galeal pulsing occurs faster than the rate ofcontraction and expansion of the suction pump and, therefore, mightfacilitate flow within the first half of the cycle when the pump isopen. More experiments are required to test this hypothesis.
MATERIALS AND METHODSPreparation of proboscisesProboscises of unfed monarch butterflies (Shady Oak Butterfly Farm,Brooker, FL, USA) for scanning electron microscopy (Fig. 1) werestraightened with crisscrossed pins on foam, dehydrated through an ethanolseries (80–100%), dried in hexamethyldisilazane, mounted with double-sided conductive adhesive tape on aluminium stubs, and sputter coated withplatinum for 3 min. Imaging was done with a Hitachi TM3000 (Hitachi HighTechnologies America Inc., Alpharetta, GA, USA) at 15 kV, compositeimage mode and full vacuum.
Coiled proboscises of seven monarch butterflies were soaked in deionizedwater for 12 h to soften and uncoil them; deionized water was used to maintainconsistency across measurements and instruments. They were straightenedseveral millimeters every 2 h and fixed in position with pins. Straightenedproboscises were examined with an optical microscope to confirm that thegaleae did not separate apically and to measure the diameter of the proboscis.
Observations of feeding behaviorTo understand fluid uptake from pools of liquid, feeding behavior wasobserved under a stereomicroscope at 22±3°C. Monarch butterflies (N=5)
Table 3. Behavioral actions that might reduce the pressure differential in lepidopteran proboscises and enhance fluid uptake Activity Evidence Postulated effect Cycle time Other consequences
Galeal splaying Tips separate Opens food canal <0.1 s Cleans debris from tip of proboscis
Galeal sliding Tips displace Widens lumen beyond the taper 0.1–90.0 s Allows air to enter and form bridges and meniscuses
Galeal pulsing Galeal width changes by 5–8% of proboscis diameter
Increases lumen size and opens pores between legulae
0.05–0.30 s Cleans legulae
Galeal pressing Proboscis diameter increases and decreases
Spreads legulae and increases interlegular spacing
0.2–0.3 s Increases contact area of proboscis and substrate
Cibarial pump (for time comparison)
X-ray imaging (Monaenkova et al., 2012)
Generates suction pressure for fluid uptake
0.45–0.70 s Facilitates swallowing
BA
100 μm100 μm Fig. 6. Image sequences extracted from a videorecording of the proboscis tip of a monarch butterflyduring feeding. The proboscis must be flexible to contractand expand quickly when the butterfly feeds. (A) Galealsliding. (B) Galeal pulsing; the arrowheads are plotted toshow the incremental change of the proboscis size. In theleft image the arrowheads point to the proboscis boundary,while in the right image the proboscis boundary expands,making the arrowheads indented into the proboscis. Thedegree of expansion varies along the proboscis.

The
Jour
nal o
f Exp
erim
enta
l Bio
logy
2136
RESEARCH ARTICLE The Journal of Experimental Biology (2014) doi:10.1242/jeb.097998
were held by their wings, and their proboscises were threaded into glasscapillary tubes (internal diameter=0.4 mm). A 15% sucrose solution wasintroduced into the opposite end of the capillary tube via flexible tubing.Butterflies were allowed to feed for 2–3 min and the behavior was videorecorded (Dalsa Falcon 1.4M100 XDR). The drinking region of theproboscis was submersed in fluid throughout observations to maintain fluidin the food canal.
We also used an inverted microscope to observe feeding behavior ofbutterflies (N=5) from droplets (1–2 ml each) of 15% sucrose solutionplaced on the microscope stage. Each butterfly was exposed to the dropletsfor 5–10 min. The drinking region of the proboscis remained submersedduring feeding. Within a period of 5–10 min, each time a droplet was takenup by the butterfly, an additional droplet was added; each butterfly took upa total of two to four droplets.
To estimate uptake rate, butterflies were fed from large droplets (radiusrd=3–4 mm, hd=2–3 mm) of sucrose solution (Fig. 7A). The droplets weremodeled as hemispherical caps with volume Vd=(πhd/6)(3rd
2+hd2). We
therefore could minimize the effect of confinement and associated counter-pressure caused by viscous drag typically present (Cohn, 1954; Cohn, 1955;Rashevsky, 1960) when a butterfly is fed from a tube. Once the butterfliesbegan drinking, they were not restrained at the stage. The feeding processwas filmed with a high-speed camera (Motion ProX3, Redlake). The imageswere analyzed with ImageJ software (NIH), and the change in dropletvolume was plotted as a function of time; the results were fitted with astraight line, with the slope indicating the uptake rate (Fig. 7B).
Experiment designThe Cahn DCA-322 allowed incremental changes in the sample mass to bedetected with 1 μg accuracy. Each straightened proboscis was cut with arazor blade (single edge, Stanley) 5 mm proximal to its tip, and the cut endwas inserted into a capillary tube. The inserted portion was ~3 mm long; theremaining (distal) 2 mm, which included the drinking region, protruded fromthe capillary tube. The tube with the proboscis was placed in a rectangularvessel (polystyrene, 12.5×12.5×45 mm, Plastibrand) and capped (Cuvettecap square, Fisher Scientific). A 3 mm diameter hole in the cap allowed thecapillary tube to hang freely in the container, but permitted the Cahn balancearm to connect to it (Fig. 2A). The tip of the proboscis was suspended abovethe water, without touching it (Fig. 2B). A drop of motor oil (Castrol, SAE5W-30) was used to seal the space between the hole edges and external wallof the tube, preventing evaporation and serving as a lubricant to enable thetube to move during wicking experiments. The tip of the proboscis wasbrought in contact with the water by raising the stage with the water vesselat 20 μm s−1 (Fig. 2C). From the control experiments, we found that thetrapped air bubble separating the top of the sealed vessel from the watersurface required about 1 h to reach full saturation with water vapor (99%relative humidity, RH) when the water filled the vessel to a height ofy=30 mm.
Data acquisitionTwo loops were used for force measurements (loop a and loop b; Fig. 2A).Loop a could measure a force up to 1.5 mN; loop b was less sensitive and
could measure a force up to 7.5 mN. A reference weight on loop c was usedto counterbalance the sample weight, allowing maximum sensitivity. Theratio of the applied masses on the three loops (a:b:c) was 1:5:1, meaning thata 100 mg sample on loop a or loop c created the same torque as a 500 mgsample on loop b.
A special function of the Cahn DCA-322 – the zero depth of immersion(ZDOI) – can set the starting moment for weight measurements. Themoment when the proboscis tip first touched the water was chosen as theZDOI point; we experimentally found that this point could be distinguishedby setting a minimum force threshold of Fmin=5 μN. With this choice of theZDOI point, if the measured force was less than 5 μN, the stage continuedupward movement. The balance was zeroed; when the stage moved up, theforce became negative due to friction and wiggling of the capillary tube(Miller et al., 1983). However, this background noise was less than 5 μN,and was not recorded (Fig. 8). When the proboscis touched the water, theforce rapidly increased, reflecting the action of the wetting force, which wassignificantly larger than the ZDOI threshold (Miller et al., 1983). Thefriction on the capillary tube exerted by the lubricating layer of oil wasalways smaller than the threshold value Fmin.
When the tip of the proboscis touched the water and the measured forcebecame greater than Fmin, the stage continued to rise up to 0.1 mm at20 μm s−1, confirming that the proboscis tip was immersed in water. Anegative slope in Fig. 8 was associated with the immersion process and wascaused by buoyancy and increased viscous friction forces at the meniscuswhen the proboscis became immersed (Miller et al., 1983). The stage wasthen stopped. The entire setup was allowed 1 min to stabilize beforeacquiring the force change for the next 60 min (red line, Fig. 8). After thestage was stopped, a meniscus inside the capillary tube was observed, andall incremental changes of force detected by the analyzer were attributed tothe incremental change of weight of the water column invading the tube asa result of capillary action.
Measurement of surface tension (σ)The surface tension of deionized water was measured using the Wilhelmymethod with the Cahn DCA-322 (Adamson and Gast, 1997). A platinumwire (250 μm diameter) was used as a standard probe (Miller et al., 1983).The wire was cleaned with ethanol and heated to red-hot with an oxidizingflame. The Wilhelmy equation F=σpcosθ was used, where F is the wettingforce and p is the perimeter of the probe. The contact angle was assumed tobe zero, θ=0 deg; hence, cosθ=1 because of the high surface energy of theplatinum (Miller et al., 1983). Deionized water was measured three times,yielding an average surface tension of σ=71.4±0.5 mN m−1.
Determining Jurin height (Zc) of a capillary tubeThe contact angle of the internal meniscus was measured indirectly byanalyzing the Jurin height (Zc), defined as the maximum possible height ofthe liquid column co-existing with the liquid reservoir (Jurin, 1917–1919):Zc=Pc/ρg=2σcosθ/(ρgr). Deionized water (η: 1 mPa s, ρ: 1000 kg m–3) in a
A B
V/V
0
Time (s)
0.2
0.4
0.6
0.8
1.0
20 40 60 80 100
55.6%
40%
25%
Fig. 7. Determination of droplet volume and sucrose concentrations fedfrom by monarch butterflies. (A) Monarch butterfly feeding from a dropletof sucrose as an example of an image used for estimation of droplet volume.(B) Dynamics of the change in droplet volume V with respect to initial volumeV0 as a function of time for three sucrose concentrations; standard errors arefrom eight different experiments for each sucrose concentration.
–5
0
5
10
15
20
0.5 5 50 500 5000
Forc
e (μ
N)
Time (s)
Approach of water surface
Dipping proboscis into water
Establishment of stable wicking flow
Data acquisition
Fig. 8. Typical experimental curve showing force changes at differentsteps of stage movement. A steep jump of the blue line allowed the zerodepth of immersion (ZDOI) point to be defined. The proboscis was immersedfarther into the water for 0.1 mm (green line). After 1 min (purple line), thechange of water weight for 60 min was collected (red line). Arrow indicatesthe ZDOI threshold.

The
Jour
nal o
f Exp
erim
enta
l Bio
logy
2137
RESEARCH ARTICLE The Journal of Experimental Biology (2014) doi:10.1242/jeb.097998
glass capillary tube with a 250 μm radius (r) was used to determine the Jurinlength at room temperature (20–21°C). Three experiments were performed,and the average Jurin height was calculated as Zc=0.029±0.001 m.
APPENDIXDerivation of the basic equations to determine permeabilityof the butterfly proboscisThe center of Cartesian coordinates was taken at the water surface,with the y-axis pointing upward. The flow potential Φ wasintroduced as the sum of the pressure in water P(y) at position y andhydrostatic pressure due to the weight of the liquid column:
Φ = P(y) + ρgy , (A1)
where ρ is water density and g is acceleration due to gravity. By thisdefinition, the pressure at the water surface is zero and the potentialis zero. Thus, Darcy’s law is written through the flow potential asQ=–kpA/η(∂Φ/∂y), where kp is the permeability of the proboscis, η isthe liquid viscosity and ∂Φ/∂y is the potential gradient along theproboscis. With this definition of permeability, the material parameterkp could be obtained by measuring the total flow rate (Q) and thepotential gradient and by knowing the proboscis cross-sectional areaand viscosity of liquid used in our experiments. We measured the flowrate directly with a Cahn DCA-322, but the potential gradient was notdefined. Therefore, data interpretation required additional informationregarding fluid flow. Below, a model is presented to allow us toextract the permeability from the experimental data.
Liquid discharge through the drinking region of the foodcanal (Q
.H)
The cross-sectional area in the drinking region of the food canal, A,changes from the tip to the proximal end of the drinking region. Theshape of the food canal in the drinking region was assumed to beconical (Fig. 7). The radius of the food canal at the submerged tip isdenoted by R0, and the radius of the food canal at the proximal end ofthe drinking region is denoted by Rp. Introducing the cone angle φ,the radius of the food canal at position y from the tip is expressed asR(y)=R0+ytanφ. Using the Hagen–Poiseuille law and assuming thatthe taper angle is small, we approximated the permeability of thedrinking region of the food canal as kH=(R0+ytanφ)2/8. Accordingly,water discharge through a cross-sectional area A(y) is expressed as:
where subscript H refers to the drinking region. The flow dischargethrough any proboscis cross-section y is the same at any timemoment t, QH=QH(t). Substituting this relationship into Eqn A2 andintegrating it, we get:
where H is the drinking region length and PH is the pressure at theend of the food canal. Solving Eqn A3 for QH, the liquid dischargethrough the drinking region of the food canal is expressed as:
Liquid discharge through the non-drinking region of the foodcanal (Q
.p)
Proximal to the drinking region, y>H, the cone angle φ of the foodcanal becomes small (Fig. 3) and the food canal in the non-drinking
=η
∂Φ∂
= π + ϕη
∂Φ∂
Qk A y
yR y
y–
( )–
( tan )8
, (A2)HH H 0
4H
∫η
π + ϕ= Φ = +ρ
g
Q t yR y
H P H8 ( )d
( tan )– ( ) – ( ) , (A3)
HH
04 H H
0
∫= +ρ ηπ + ϕ
gQ t P Hy
R y( ) – ( )
8 d( tan )
. (A4)H
H H0
40
region is modeled by a straight cylindrical tube with radius Rp.Therefore, the flow of the liquid column can be described by theHagen–Poiseuille law (Adamson and Gast, 1997) written in Darcy’sform as Qp=–(kpA/η)(∂Φp/∂y), with kp=Rp
2/8. Subscript p refers tothe non-drinking region of the food canal. Using the massconservation equation, we obtain ∂Qp/∂y=∂2Φp/∂y2=0. By integratingthis equation, the linear distribution of the potential along the liquidcolumn, Φp=cy+d, can be inferred, where c and d are time-dependent functions that can be found from the boundaryconditions. The boundary conditions state that the pressure at theend of the drinking region of the food canal, y=H, must be equal tothe pressure in the water column at the same position, y=H.Therefore, PH+ρgH=cH+d. At the inserted end of the food canal,y=Lp, the pressure is written as Pp+ρgLp=cLp+d. From these twoboundary conditions, it follows that c=[Pp–PH+ρg(Lp–H)]/(Lp–H)and d=Pp+ρgLp–Lp[Pp–PH+ρg(Lp–H)]/(Lp–H)=PH+H(Pp–PH)/(Lp–H).With the obtained constants, liquid discharge through the rest of thefood canal is expressed as:
The pressure at the end of the drinking region of the food canal,PH, can be related using the conservation of mass, QH=Qp:
Taking the integral and using the definition Rp=R0+Htanφ, we canexpress the pressure PH as:
where we introduce the constants:
a = 3tanφR03Rp
3 / (Rp3 – R0
3) (A8) and
b = Rp4 / (Lp – H) . (A9)
These constants contain the structural parameters of the proboscis.Plugging Eqn A7 into Eqn A4, the liquid discharge through thenon-drinking region of the food canal is expressed as:
Meniscus motion through the capillary tube and relatedwater discharge (Q
.c)
Liquid discharge through the capillary tube is the same as that givenby Eqn A4. Conservation of mass requires the equality Qp=Qc,where the flow rate through the capillary tube is given by theHagen–Poiseuille law, with the pressure at one end y=Lp being Pp
and at the other end, that is, at the meniscus position y=Lp+L(t),being Pc:
= η =π
η+ρ gQ k A a
RP P L H L H– ( / ) –
8[ – ( – )] / ( – ) . (A5)p p
p4
p H p p
∫+ ρη
π +
=πη
+ρ
g
g
P H yR y
R P P L H L H
– ( )8 d
( tan φ)
–8
[ – ( – )] / ( – ) . (A6)
H
H0
40
p4
p H p p
=+ρ ρ
+g g
PbP b L H aH
a b( – ) –
, (A7)Hp p
= πη +
+ρ gQaba b
P L–8 ( )
( ) . (A10)p p p
πη +
+ρ
= πη
+ +ρ
g
g
aba b
P L
rP P L L L L
–8 ( )
( )
–8
[ ( – )] / ( – ) . (A11)
p p
4
p c p p
The
Jour
nal o
f Exp
erim
enta
l Bio
logy
2138
RESEARCH ARTICLE The Journal of Experimental Biology (2014) doi:10.1242/jeb.097998
Solving this equation for Pp yields:
Plugging Eqn A12 into Eqn A7 and then into Eqn A4 andexpressing its left side through the meniscus velocity Qc=πr2dL/dt,the basic equation describing the kinetics of meniscus propagationthrough the complex conduit consisting of the proboscis andcapillary tube is expressed as:
AcknowledgementsWe thank Bethany Kauffman, Steven Rea, and Taras Andrukh for helping withhigh-speed imaging of butterfly feeding behavior.
Competing interestsThe authors declare no competing financial interests.
Author contributionsC.-C.T. prepared the samples, designed and performed all permeabilityexperiments, and analyzed data; D.M. performed all feeding experiments with livebutterflies and analyzed data; C.E.B. prepared samples and conducted SEMimaging; P.H.A. conceived the project, prepared samples, and analyzed data;K.G.K. conceived the project, designed experiments, set up the models, analyzeddata and, together with P.H.A. and C.E.B., wrote the manuscript.
FundingThis work was supported by the National Science Foundation through Grants EFRI0937985 and PoLS 1305338.
ReferencesAdamson, A. W. and Gast, A. P. (1997). Physical Chemistry of Surfaces. New York,
NY: Wiley.Adler, P. H. (1987). Temporal feeding patterns of adult Heliothis zea (Lepidoptera:
Noctuidae) on pigeonpea nectar. Environ. Entomol. 16, 424-427.Asadi, M. (2005). Beet-Sugar Handbook, pp. 779-801. Hoboken, NJ: John Wiley &
Sons, Inc.Barth, F. G. (1991). Insects and Flowers: The Biology of a Partnership. Princeton, NJ:
Princeton University Press.Batchelor, G. K. (2000). An Introduction to Fluid Dynamics. New York, NY: Cambridge
University Press.Bauder, J. A.-S., Handschuh, S., Metscher, B. D. and Krenn, H. W. (2013).
Functional morphology of the feeding apparatus and evolution of proboscis length inmetalmark butterflies (Lepidoptera: Riodinidae). Biol. J. Linn. Soc. Lond. 110, 291-304.
Bennet-Clark, H. C. (1963). Negative pressures produced in the pharyngeal pump ofthe blood-sucking bug, Rhodnius prolixus. J. Exp. Biol. 40, 223-229.
Borrell, B. J. (2006). Mechanics of nectar feeding in the orchid bee Euglossaimperialis: pressure, viscosity and flow. J. Exp. Biol. 209, 4901-4907.
Borrell, B. J. and Krenn, H. W. (2006). Nectar feeding in long-proboscid insects. InEcology and Biomechanics: A Mechanical Approach to the Ecology of Animals andPlants (ed. A. Herrel, T. Speck and N. P. Rowe), pp. 185-205. Boca Raton, FL: CRC.
Büttiker, W., Krenn, H. W. and Putterill, J. F. (1996). The proboscis of eye-frequenting and piercing Lepidoptera (Insecta). Zoomorphology 116, 77-83.
Christophers, S. R. (1960). Aëdes aegypti (L.) the Yellow Fever Mosquito: Its LifeHistory, Bionomics and Structure. London: Cambridge University Press.
Cohn, D. L. (1954). Optimal systems: I. The vascular system. Cohn. Bull. Math.Biophys. 16, 59-74.
Cohn, D. L. (1955). Optimal systems: II. The vascular system. Bull. Math. Biophys. 17,219-227.
=η
ρ
+ +gL
tr P L
L Lr a b
ab
dd 8
( – )
–( )
. (A13)2
c
p
4
=
+⎛⎝⎜
⎞⎠⎟
+ ρ ρ+
⎡
⎣⎢
⎤
⎦⎥
g gP
aba b
rL L
r PL L
rL L
L LabL
a b1
––
– –( – ) – . (A12)p
4
p
4c
p
4
pp
p
Dullien, F. A. L. (1991). Porous Media: Fluid Transport and Pore Structure. New York,NY: Academic Press.
Eastham, L. E. S. and Eassa, Y. E. E. (1955). The feeding mechanism of the butterflyPieris brassicae L. Philos. Trans. R. Soc. B 239, 1-43.
Grimaldi, D. and Engel, M. S. (2005). Evolution of the Insects. New York, NY:Cambridge University Press.
Heinrich, B. (1975). Energetics of pollination. Annu. Rev. Ecol. Syst. 6, 139-170. Jurin, J. (1917-1919). An account of some experiments shown before the Royal
Society; with an enquiry into the cause of the ascent and suspension of water incapillary tubes. Philos. Trans. R. Soc. 30, 1717-1719.
Karolyi, F., Morawetz, L., Colville, J. F., Handschuh, S., Metscher, B. D. and Krenn,H. W. (2013). Time management and nectar flow: flower handling and suctionfeeding in long-proboscid flies (Nemestrinidae: Prosoeca). Naturwissenschaften 100,1083-1093.
Kingsolver, J. G. (1985). Butterfly engineering. Sci. Am. 253, 106-113. Kingsolver, J. G. and Daniel, T. L. (1979). On the mechanics and energetics of nectar
feeding in butterflies. J. Theor. Biol. 76, 167-179. Kingsolver, J. G. and Daniel, T. L. (1995). Mechanics of food handling by fluid-
feeding insects. In Regulatory Mechanisms in Insect Feeding (ed. R. F. Chapmanand G. de Boer), pp. 32-74. New York, NY: Springer.
Knopp, M. C. N. and Krenn, H. W. (2003). Efficiency of fruit juice feeding in Morphopeleides (Nymphalidae, Lepidoptera). J. Insect Behav. 16, 67-77.
Krenn, H. W. (1997). Proboscis assembly in butterflies (Lepidoptera) – a once in alifetime sequence of events. Eur. J. Entomol. 94, 495-501.
Krenn, H. W. (2010). Feeding mechanisms of adult Lepidoptera: structure, function,and evolution of the mouthparts. Annu. Rev. Entomol. 55, 307-327.
Krenn, H. W. and Kristensen, N. P. (2000). Early evolution of the proboscis ofLepidoptera: external morphology of the galea in basal glossatan moths, withremarks on the origin of the pilifers. Zool. Anz. 239, 179-196.
Krenn, H. W. and Muhlberger, N. (2002). Groundplan anatomy of the proboscis ofbutterflies (Papilionoidea, Lepidoptera). Zool. Anz. 241, 369-380.
Kristensen, N. P. (1984). Studies on the morphology and systematics of primitiveLepidoptera (Insecta). In Steenstrupia, Vol. 10, No. 5, pp. 141-191. Copenhagen:Copenhagen Zoological Museum.
Kwauk, K. J. (2012). Fluid uptake by the lepidopteran proboscis in relation to structure,Clemson, SC: Clemson University.
Lehane, M. J. (2005). The Biology of Blood-Sucking in Insects. New York, NY:Cambridge University Press.
Lehnert, M. S., Monaenkova, D., Andrukh, T., Beard, C. E., Adler, P. H. and Kornev,K. G. (2013). Hydrophobic-hydrophilic dichotomy of the butterfly proboscis. J. R.Soc. Interface 10, 20130336.
Lucas, R. (1918). Ueber das zeitgesetz des kapillaren aufstiegs von flussigkeiten.Kolloid-Zeitschrift 23, 15-22.
Malone, M., Watson, R. and Pritchard, J. (1999). The spittlebug Philaenus spumariusfeeds from mature xylem at the full hydraulic tension of the transpiration stream.New Phytol. 143, 261-271.
May, P. G. (1985). Nectar uptake rates and optimal nectar concentrations of twobutterfly species. Oecologia 66, 381-386.
Miller, B., Penn, L. S. and Hedvat, S. (1983). Wetting force measurements on singlefibers. Colloids and Surfaces 6, 49-61.
Monaenkova, D., Lehnert, M. S., Andrukh, T., Beard, C. E., Rubin, B., Tokarev, A.,Lee, W. K., Adler, P. H. and Kornev, K. G. (2012). Butterfly proboscis: combining adrinking straw with a nanosponge facilitated diversification of feeding habits. J. R.Soc. Interface 9, 720-726.
Rashevsky, N. (1960). Mathematical Biophysics. New York, NY: Dover Publications.Scheidegger, A. E. (1974). The Physics of Flow Through Porous Media. Toronto, ON:
University of Toronto.Tokarev, A., Kaufman, B., Gu, Y., Andrukh, T., Adler, P. H. and Kornev, K. G.
(2013). Probing viscosity of nanoliter droplets of butterfly saliva by magneticrotational spectroscopy. Appl. Phys. Lett. 102.
Tsai, C.-C. and Kornev, K. G. (2013). Characterization of permeability of electrospunyarns. Langmuir 29, 10596-10602.
Tsai, C. C., Mikes, P., Andrukh, T., White, E., Monaenkova, D., Burtovyy, O.,Burtovyy, R., Rubin, B., Lukas, D., Luzinov, I. et al. (2011). Nanoporous artificialproboscis for probing minute amount of liquids. Nanoscale 3, 4685-4695.
Vogel, S. (2003). Comparative Biomechanics: Life’s Physical World. Princeton, NJ:Princeton University Press.
Wannenmacher, G. and Wasserthal, L. T. (2003). Contribution of the maxillarymuscles to proboscis movement in hawkmoths (Lepidoptera: Sphingidae) – anelectrophysiological study. J. Insect Physiol. 49, 765-776.
Washburn, E. (1921). The dynamics of capillary flow. Phys. Rev. 17, 273-283.