parabolic-trough technology...
TRANSCRIPT
i
Parabolic-Trough TechnologyRoadmap:
A Pathway for Sustained CommercialDevelopment and Deployment of Parabolic-
Trough Technology
January 1999
Prepared by:
Hank Price David KearneySunLab/NREL Kearney and Associates
Golden, Colorado Del Mar, [email protected] [email protected]
iii
ACKNOWLEDGEMENTS
The authors believe that the Parabolic-Trough Technology Roadmap represents an importantmilestone in helping to advance the state of parabolic-trough technology. We would like toacknowledge the contributions of the core team that helped organize the roadmapping workshopand further developed the strategy that emerged from the workshop. In addition, we thank theparticipants in the workshop whose experience, energy, and vision were essential to the success ofthe roadmapping process. We also thank KJC Operating Company for providing actual plantperformance data and pictures of the technology. Finally, we express appreciation to the U.S.Department of Energy Concentrating Solar Power Program (Gary Burch and Tom Rueckert) andSunLab Management (Craig Tyner, Tom Williams, and James Chavez) for programmatic andfinancial support for the roadmap workshop and the development of this plan.
ROADMAP CORE TEAM
Gilbert Cohen – KJC Operating CompanyRaymond Dracker – BechtelDavid Kearney – Kearney and AssociatesGary Nakarado – NRELJon Pietruszkiewicz – BechtelHank Price – NREL
ROADMAP WORKSHOP PARTICIPANTSBOULDER, COLORADO, JANUARY 20-22, 1998
Avi Brenmiller – SOLEL Gilbert Cohen – KJC Operating CompanyRay Dracker – Bechtel Patricia Cordeiro – SandiaMichael Geyer – DLR/MD-PSA Yoel Gilon – SOLEL ConsultantAlexander Jenkins – California David Kearney – Kearney and Associates Energy CommissionGreg Kolb – Sandia Mike Lotker – Formerly of LUZRod Mahoney – Sandia Kenneth May – Industrial Solar TechnologyMark Mehos – NREL Gary Nakarado – NRELPaul Nava – Pilkington Solar International Jon Pietruszkiewicz – BechtelMike Prairie – Sandia Hank Price – NRELRichard Spencer – World Bank/GEF Craig Tyner – SandiaTom Williams – NREL Facilitator - Lynn Kaemmerer – NREL
Parabolic-Trough Technology Roadmap January 1999
iv
TABLE OF CONTENTS
Acknowledgements .................................................................................................................... iiiTable of Contents .......................................................................................................................ivList of Figures .............................................................................................................................vList of Tables ..............................................................................................................................vExecutive Summary.................................................................................................................... 1Introduction ................................................................................................................................ 2Market Assessment ..................................................................................................................... 5Technology Baseline ................................................................................................................... 9Technology Vision .....................................................................................................................14Technology Roadmap ................................................................................................................18
Crosscutting Technology Issues..............................................................................................18Component Development........................................................................................................19System Development..............................................................................................................24Market Development..............................................................................................................29
Roadmap Initiatives ...................................................................................................................34
Parabolic-Trough Technology Roadmap January 1999
v
LIST OF FIGURES
Figure 1 Parabolic-Trough Roadmap Workshop participants .................................................... 2Figure 2. LUZ System Two Collector (LS-2) ............................................................................ 3Figure 3. SEGS VI historical performance................................................................................. 9Figure 4. Collector cost breakdown ..........................................................................................10Figure 5. Cost reduction opportunities......................................................................................12Figure 6. Cost of trough technology today ................................................................................13Figure 7. Trough technology development steps and cost vs. market opportunities.....................17Figure 8. Schematic of a third-generation LUZ parabolic-trough collector (LS-3) .....................19Figure 9. Row of LS-2 Collectors at Kramer Junction ..............................................................20Figure 10. Component development activity time line .................................................................23Figure 11. SEGS VI power block...............................................................................................24Figure 12. Power block piping....................................................................................................25Figure 13. System development activity time line........................................................................28Figure 14. Annual direct normal solar radiation for the United States and Mexico .......................33
LIST OF TABLES
Table 1. Parabolic-Trough Project Status ................................................................................... 7Table 2. Critical Market Requirements for Intermediate-Load Dispatchable Power ..................... 8Table 3. Technology Development and Deployment Activities ...................................................16Table 4. Component Development Metrics ................................................................................22Table 5. System Development Metrics.......................................................................................28
Parabolic-Trough Technology Roadmap January 1999
Page 1
EXECUTIVE SUMMARY
Technology roadmapping is a needs-driven technology planning process that helps identify, select,and develop technology alternatives to satisfy a set of market needs. The U.S. Department ofEnergy's Office of Power Technologies' Concentrating Solar Power (CSP) Program recentlysponsored a technology roadmapping workshop for parabolic-trough technology. The workshopwas attended by an impressive cross section of industry and research experts. The goals of theworkshop were to evaluate the market potential for trough power projects, develop a betterunderstanding of the current state of the technology, and to develop a conceptual plan foradvancing the state of parabolic-trough technology. This report documents and extends theroadmap that was conceptually developed during the workshop. Key findings of the workshopwere:
• A number of parabolic-trough power project opportunities may soon be realized. Theseprojects are driven by the expanding global power market, increasing interest in greenhousegas reduction, and a growing interest in “green” power. India, Egypt, Morocco, and Mexicohave active trough project development programs in place and are in varying stages of theapproval process to receive grants from the Global Environment Facility. Independent powerproducers are in the early stages of design and development for potential parabolic-troughpower projects in Greece (Crete), Spain, and the United States (Arizona). Given successfuldeployment in one or more of these initial markets, additional project opportunities areexpected in these and other regions.
• Parabolic-trough technology is the only CSP technology that has demonstrated sufficiently lowrisk to gain the attention of the financial community and independent power developers fornear-term projects. The nine solar electric generating station (SEGS) plants, 354 MWe of netsolar electric generating capacity, continue to operate well in California's Mojave Desert andhave accumulated nearly 100 plant-years of commercial operating experience.
• Significant technology advances have occurred since the last SEGS plants were developed.Proven and expected technology improvements indicate that cost reductions of over 50% andperformance increases of up to 50% may be feasible. An appropriately focused research,development, and demonstration effort for trough technologies could achieve a levelized energycost of 4¢–5¢/kilowatt-hour.
• A reasonable, modest cost pathway exists for moving parabolic-trough technology forward.The plan articulated in this roadmap suggests gradual steps in technology advances anddeployments that allow parabolic troughs to mature to the point that they can compete directlywith conventional power technologies in many sunbelt regions around the globe.
• U.S. industry currently has several competitive strengths for developing this market, but isunlikely to be successful in the near term without forming international collaborations. Withoutthese collaborations the U.S. competitive position could erode significantly given thesignificantly greater funding (from both government and private industry) of European troughresearch efforts.
Parabolic-Trough Technology Roadmap January 1999
Page 2
INTRODUCTION
TECHNOLOGY ROADMAPPING
The U.S. Department of Energy (DOE) has adopted the planning method known as technologyroadmapping for much of its program development. Technology roadmapping is a needs-driventechnology planning process that helps identify, select, and develop technology alternatives tosatisfy a set of product needs. The roadmapping approach used here is one formulated by SandiaNational Laboratories’ Strategic Business Development Group. Using this approach, thedevelopment of a technology roadmap includes the following:
• Identify the “product” that will be the focus of the roadmap.
• Identify the critical market requirements and performance and cost targets.
• Specify the major technology areas.
• Specify the technology drivers and their targets.
• Identify technology alternatives and their time lines.
• Recommend the technology alternatives that should be pursued.
• Create the technology roadmap report.
PARABOLIC-TROUGH TECHNOLOGY ROADMAPPING
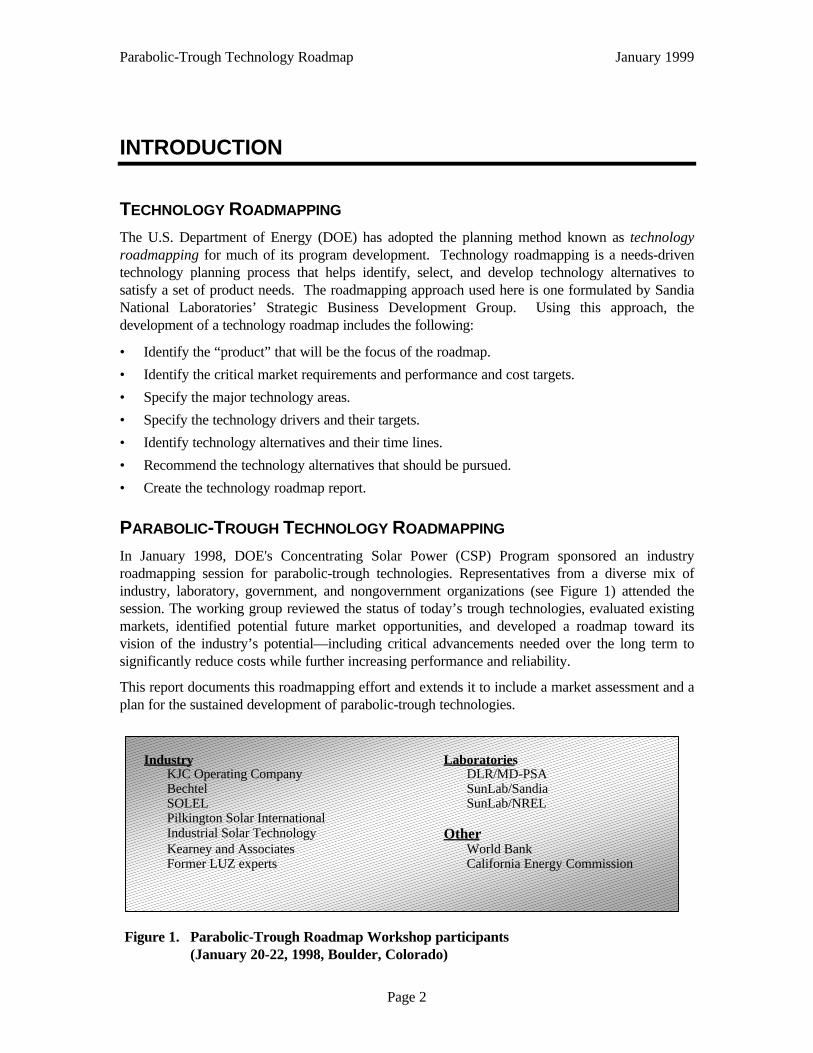
In January 1998, DOE's Concentrating Solar Power (CSP) Program sponsored an industryroadmapping session for parabolic-trough technologies. Representatives from a diverse mix ofindustry, laboratory, government, and nongovernment organizations (see Figure 1) attended thesession. The working group reviewed the status of today’s trough technologies, evaluated existingmarkets, identified potential future market opportunities, and developed a roadmap toward itsvision of the industry’s potential—including critical advancements needed over the long term tosignificantly reduce costs while further increasing performance and reliability.
This report documents this roadmapping effort and extends it to include a market assessment and aplan for the sustained development of parabolic-trough technologies.
Industry LaboratoriesKJC Operating Company DLR/MD-PSABechtel SunLab/SandiaSOLEL SunLab/NRELPilkington Solar InternationalIndustrial Solar Technology OtherKearney and Associates World BankFormer LUZ experts California Energy Commission
Figure 1. Parabolic-Trough Roadmap Workshop participants(January 20-22, 1998, Boulder, Colorado)
Parabolic-Trough Technology Roadmap January 1999
Page 3
WHY FOCUS ON TROUGHS?
In recent years, the U.S. Department ofEnergy's CSP Program has not directlysupported the development ofparabolic-trough technology. Troughtechnology was recognized to becommercially available, but believed byDOE to have only limited potential forfuture cost reduction. Technologiessuch as power towers and dish/enginesystems were thought to offer greateropportunity for improved performanceand lower cost. Several events,however, have recently caused DOE toreevaluate its position on parabolic-trough technologies.
Ø Dramatic changes in the world-wide power industry are causing changes in how new technologies are developed and deployedinto the marketplace. As a result, tower and dish technologies that were being developed forutility customers who would share some of the initial deployment risk must now find newpathways into the competitive marketplace. This will likely delay deployment of thesetechnologies.
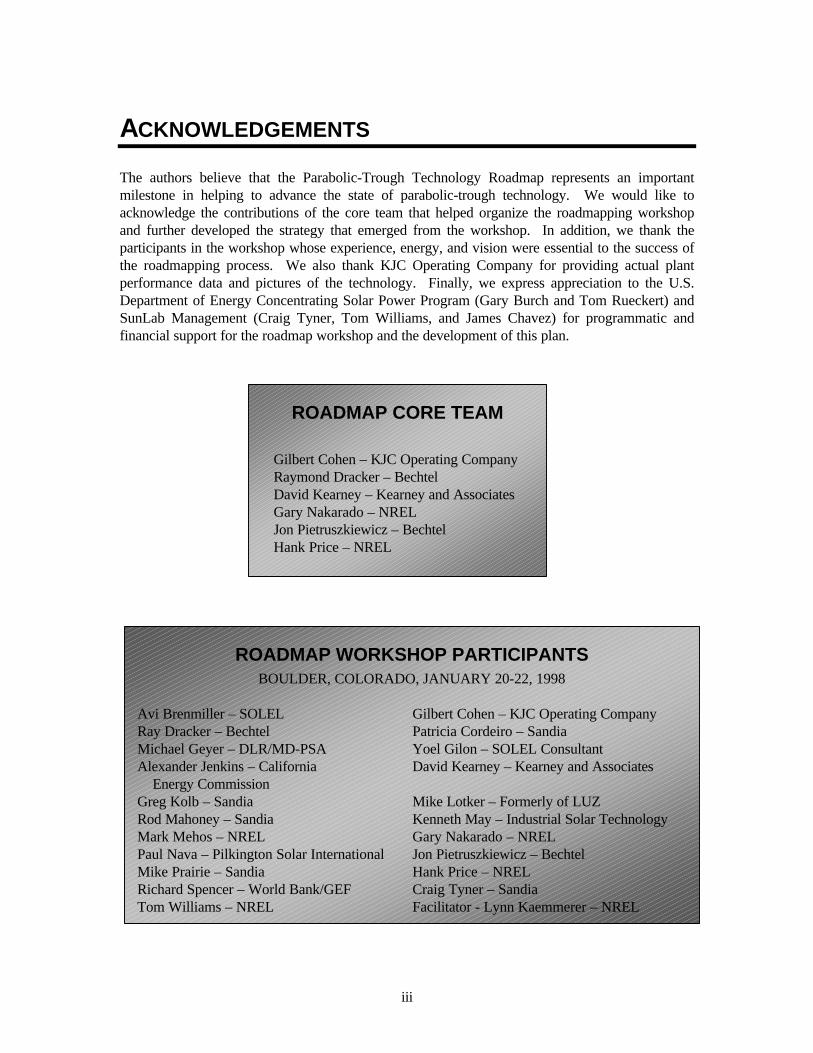
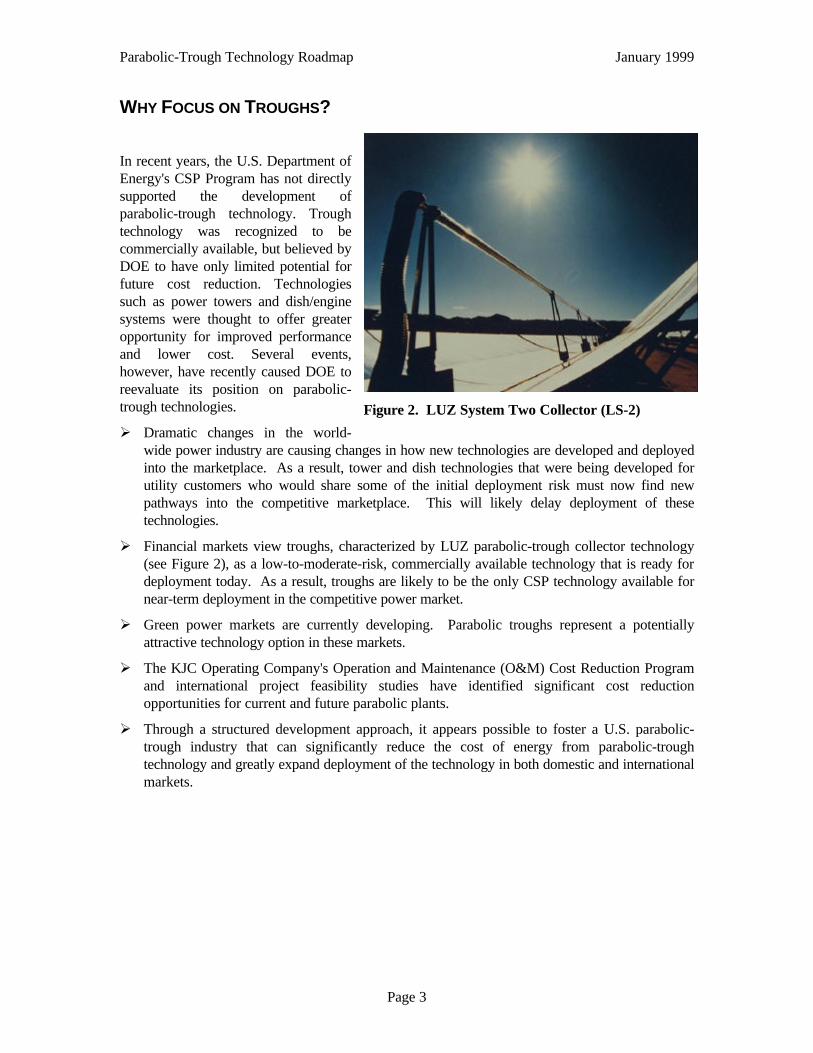
Ø Financial markets view troughs, characterized by LUZ parabolic-trough collector technology(see Figure 2), as a low-to-moderate-risk, commercially available technology that is ready fordeployment today. As a result, troughs are likely to be the only CSP technology available fornear-term deployment in the competitive power market.
Ø Green power markets are currently developing. Parabolic troughs represent a potentiallyattractive technology option in these markets.
Ø The KJC Operating Company's Operation and Maintenance (O&M) Cost Reduction Programand international project feasibility studies have identified significant cost reductionopportunities for current and future parabolic plants.
Ø Through a structured development approach, it appears possible to foster a U.S. parabolic-trough industry that can significantly reduce the cost of energy from parabolic-troughtechnology and greatly expand deployment of the technology in both domestic and internationalmarkets.
Figure 2. LUZ System Two Collector (LS-2)
Parabolic-Trough Technology Roadmap January 1999
Page 4
WHAT FOLLOWS…
This document comprises the following sections: market assessment, trough technology baseline,roadmap development vision, technology roadmap, and roadmap initiatives.
Ø Market Assessment
This section begins with an analysis that identifies potential future power market environmentsfollowed by a more detailed assessment of the current state of the power market. Probablenear-term, mid-term, and long-term markets for trough technologies are then identified.Finally, the critical market requirements are identified for the next 20 years.
Ø Technology Baseline
This section provides an overview of the current state of parabolic-trough technology followedby a review of the key opportunities to reduce the cost of future projects. Finally, the cost ofpower from a next-generation parabolic-trough plant is discussed.
Ø Roadmap Development Vision
The section describes the key elements of the roadmap and the major challenges for thetechnology. It then describes the vision for how parabolic-trough technologies will bedeveloped in the future.
Ø Technology Roadmap
This section describes the major technology areas: crosscutting technology, componentdevelopment, system development, and market development. In each of these areas, the keytechnology drivers are identified and various technology alternatives are addressed. Wherepossible, detailed metrics for the technology drivers have been included and time lines forvarious technology alternatives have been included. These time lines map back to the overallroadmap vision.
Ø Roadmap Initiatives
This final section describes a number of initiatives that the DOE CSP program and SunLabmight follow to implement the key elements of the parabolic-trough roadmap.
Parabolic-Trough Technology Roadmap January 1999
Page 5
MARKET ASSESSMENT
POWER MARKET SCENARIOS
In attempting to understand future market opportunities it is useful to develop different scenariosabout the nature of emerging markets. The trough workshop participants identified three marketscenarios that seem to be relevant for future trough development.
Ø Scenario 1: Low-Cost Competitive Power Market
Energy prices remain low for approximately the next 20 years. Power markets are dominatedby the trend toward privatization and least-cost power options. Independent power producers(IPPs) are the primary suppliers of new power generation. Concentrating solar powertechnologies will be used in niche applications characterized by high fuel prices; inenvironmentally friendly markets that will pay a premium for green power; or in applicationsin which solar technologies can leverage off conventional technologies to drive solar costsdown (such as the Integrated Solar Combined-Cycle System [ISCCS]). In this environment,CSP technologies need to focus on driving down costs. Wind power will likely be the primarycompetition for CSP applications.
Ø Scenario 2: Global Climate Change
Global climate change causes more nations to invest significant resources to reduce greenhousegas emissions. Carbon dioxide (CO2) reduction becomes the major driver for the developmentof CSP technologies. Economic incentives are put into place to create a market opportunity.In this case, the primary focus will be on rapid deployment of CO2 reduction technologies anddevelopment of large, high-capacity-factor grid-connected plants. Repowering of existingplants presents an important opportunity to minimize costs. Development of thermal orelectric storage is a high priority.
Ø Scenario 3: Fossil Fuel Price Escalation
Fossil fuel prices escalate due to declining production or through political developments orother events that result in reduced production of one or more fossil fuels. In this scenario,other fuel and energy technologies are developed to replace the demand for fossil fuels. Duringthis period, significant price fluctuations are seen until demand for alternative fuel and energytechnologies can replace a significant portion of the demand for conventional fuels. Increasingenergy prices and energy price uncertainty will drive the demand for solar technologies in thisscenario.
The activities developed later in the roadmap address one or more of these scenarios. AlthoughScenario 1 is generally thought to be the more realistic picture of the near-term future, Scenarios 2and 3 are potentially of such significance that it is appropriate to include activities that also addressthese as an insurance policy for the future.
Parabolic-Trough Technology Roadmap January 1999
Page 6
MARKET SUMMARY
Ø Competitive Price of Power
The competitive price of baseload power in markets with well-developed infrastructure andaccess to low-cost fossil fuel (coal and natural gas) is 2.5¢–4¢/kilowatt-hour (kWh).
Ø Intermittent Power
Power that is intermittent and that cannot be dispatched at will—such as wind power—is onlyvalued at the fuel and incremental O&M cost of the avoided generation. This energy wouldtypically be valued at 2¢–3¢/kWh. Dispatchable power, possible with CSP technologies usingeither storage or hybridization, does not suffer from this limitation.
Ø Intermediate Load Power
In many cases, new capacity is needed to meet peak loads and is not needed for 24-hour-per-day operation. The competitive price of intermediate and peak load generation can besignificantly higher than that for baseload generation. The competitive price for intermediateload generation (20%–40% annual capacity factors) is approximately 4¢–6¢/kWh forconventional power technologies. It is critical that an intermediate load technology bedispatchable to meet the peak load. For most developing regions, nighttime peaking will beimportant; for these markets, storage or hybrid design configurations will be necessary.Dispatchable technologies will have an advantage here.
Ø Niche Markets
In general, niche market opportunities exist where the levelized cost of power is 6¢–8¢/kWh.These niche opportunities exist due to high fuel prices (e.g., island systems) or as a result of ahigher value being placed on green power generation.
Ø Current International Opportunities
The international market is driven by internal host country energy programs and encouraged bythe positive attitudes of the Global Environment Facility (GEF) and the World Bank towardthe implementation and development of CSP systems. These opportunities exist in developingcountries, and their progress is strongly influenced (and frequently delayed) by bureaucraticsnags, shifting internal politics, broader energy issues (such as requirements for restructuringimposed by World Bank policies), and other factors. In recent years, discussions have beenactive with energy planners, utilities, and government agencies in India, Mexico, Egypt,Jordan, Morocco, Greece (Crete), Brazil, Iran, China, and Spain (see Table 1). Interest andearly steps are gaining momentum in other parts of Africa as well. Although it is impossible topredict how any of these initiatives will develop over the next few years, opportunities clearlyexist. Most countries have focused on parabolic-trough technology as having already reachedthe commercial stage, with the recognition that power towers or dish-engine systems maybecome a more cost-effective option at some point in the future.
Ø Current U.S. Domestic Market Opportunities
Concentrating solar power technologies are primarily suited to locations with a high directnormal solar resource, such as the Southwest. The current wave of deregulation and utilityrestructuring is driving the market toward least-cost power, making it difficult for CSPtechnologies to compete. However, a number of states are including green power requirementsin their restructuring legislation. Arizona, Nevada, and California have included solar
Parabolic-Trough Technology Roadmap January 1999
Page 7
portfolio standards or a system benefits charge to help foster the deployment of solar power.These types of policies are likely necessary to allow continued development of the U.S. powermarket.
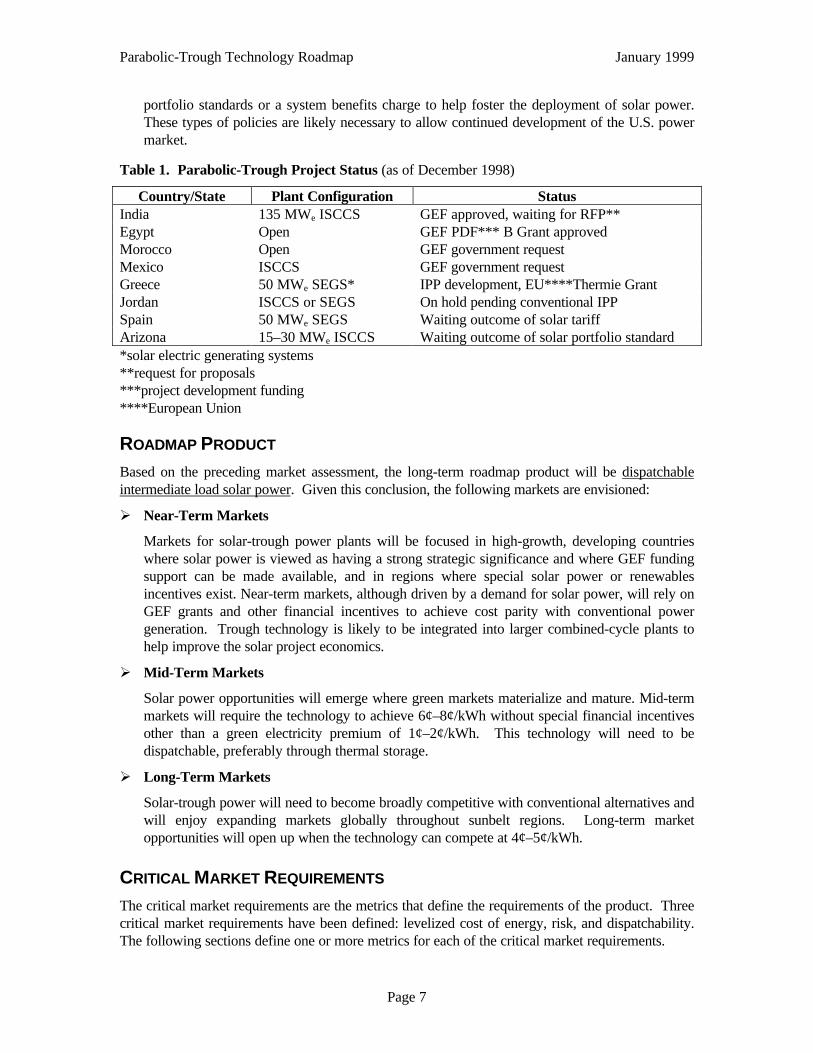
Table 1. Parabolic-Trough Project Status (as of December 1998)
Country/State Plant Configuration StatusIndia 135 MWe ISCCS GEF approved, waiting for RFP**Egypt Open GEF PDF*** B Grant approvedMorocco Open GEF government requestMexico ISCCS GEF government requestGreece 50 MWe SEGS* IPP development, EU****Thermie GrantJordan ISCCS or SEGS On hold pending conventional IPPSpain 50 MWe SEGS Waiting outcome of solar tariffArizona 15–30 MWe ISCCS Waiting outcome of solar portfolio standard*solar electric generating systems**request for proposals***project development funding****European Union
ROADMAP PRODUCT
Based on the preceding market assessment, the long-term roadmap product will be dispatchableintermediate load solar power. Given this conclusion, the following markets are envisioned:
Ø Near-Term Markets
Markets for solar-trough power plants will be focused in high-growth, developing countrieswhere solar power is viewed as having a strong strategic significance and where GEF fundingsupport can be made available, and in regions where special solar power or renewablesincentives exist. Near-term markets, although driven by a demand for solar power, will rely onGEF grants and other financial incentives to achieve cost parity with conventional powergeneration. Trough technology is likely to be integrated into larger combined-cycle plants tohelp improve the solar project economics.
Ø Mid-Term Markets
Solar power opportunities will emerge where green markets materialize and mature. Mid-termmarkets will require the technology to achieve 6¢–8¢/kWh without special financial incentivesother than a green electricity premium of 1¢–2¢/kWh. This technology will need to bedispatchable, preferably through thermal storage.
Ø Long-Term Markets
Solar-trough power will need to become broadly competitive with conventional alternatives andwill enjoy expanding markets globally throughout sunbelt regions. Long-term marketopportunities will open up when the technology can compete at 4¢–5¢/kWh.
CRITICAL MARKET REQUIREMENTS
The critical market requirements are the metrics that define the requirements of the product. Threecritical market requirements have been defined: levelized cost of energy, risk, and dispatchability.The following sections define one or more metrics for each of the critical market requirements.
Parabolic-Trough Technology Roadmap January 1999
Page 8
Ø Levelized Energy Cost (LEC)
The cost of electricity is the primary system requirement for any electric power generationtechnology. The levelized cost of energy is the most common approach used for comparing thecost of power from competing technologies. There are two approaches for calculating theLEC. The first, a simplified approach, calculates an annualized cost using a fixed charge rateand divides it by the annual electric generation. The second approach uses a full financialcash-flow model to perform a similar calculation. The latter approach is the one used in thisroadmap because it more accurately reflects the parameters that will drive decisions onselecting one project over another. In general, the cost of power must be competitive withalternative power generation options after taking into account any special incentives availableto the technology. This could include green-pricing production incentives, grants (such asthose from GEF), or special tax incentives.
Ø Risk
The level of risk for the project must account for all potential sources of risk: technology,scheduling, finances, politics, and exchange rate. The level of risk generally will definewhether or not a project can be financed and at what rates of return.
Ø Dispatchability
One of the primary benefits of CSP technologies is that they can be dispatched either throughthe use of thermal storage or through hybridization with conventional fuels. Dispatchabilitymeans that power can be generated when it is needed to meet peak-system power loads. Theprimary metrics for dispatchability are the time when the peak load occurs, the length of thepeak-load period, and the capacity factor the system must maintain during the peak period.For example, the current SEGS plants in California have a peak period between 1200 and1800 hours on summer weekdays, and the plants must maintain an 80% capacity factor duringthis period.
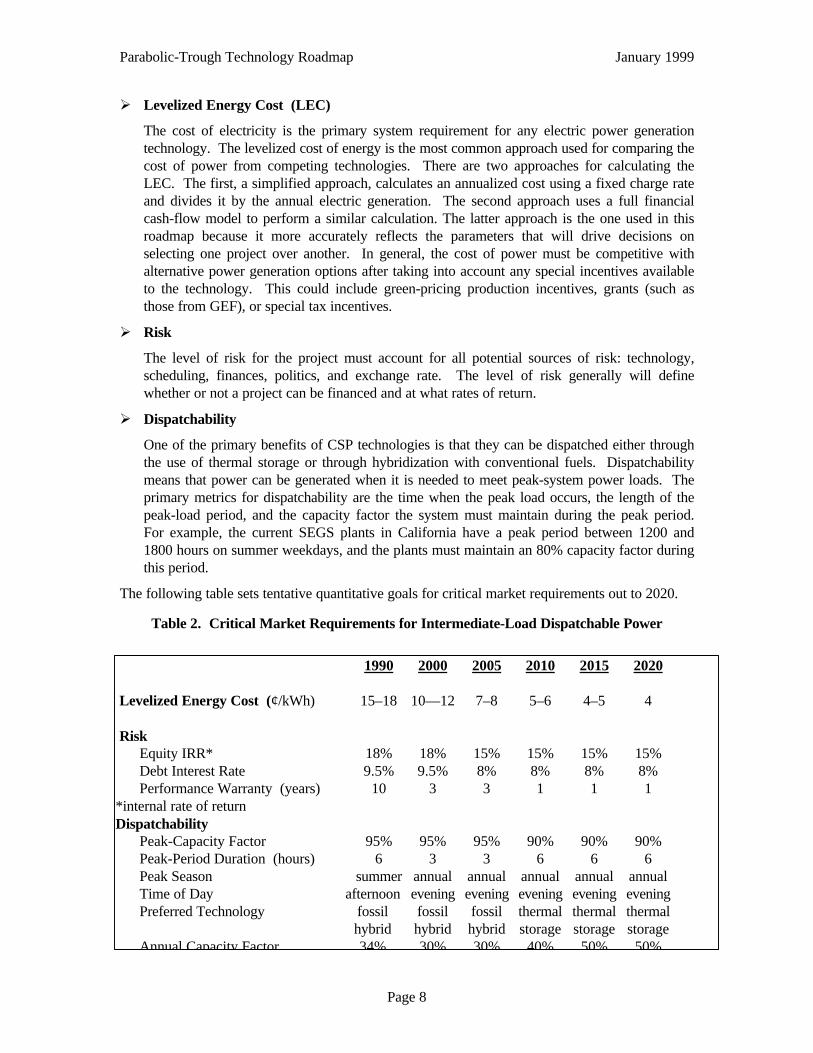
The following table sets tentative quantitative goals for critical market requirements out to 2020.
Table 2. Critical Market Requirements for Intermediate-Load Dispatchable Power
1990 2000 2005 2010 2015 2020
Levelized Energy Cost (¢/kWh) 15–18 10—12 7–8 5–6 4–5 4
Risk Equity IRR* 18% 18% 15% 15% 15% 15% Debt Interest Rate 9.5% 9.5% 8% 8% 8% 8% Performance Warranty (years) 10 3 3 1 1 1*internal rate of returnDispatchability Peak-Capacity Factor 95% 95% 95% 90% 90% 90% Peak-Period Duration (hours) 6 3 3 6 6 6 Peak Season summer annual annual annual annual annual Time of Day afternoon evening evening evening evening evening
Preferred Technology fossil fossil fossil thermal thermal thermalhybrid hybrid hybrid storage storage storage
Annual Capacity Factor 34% 30% 30% 40% 50% 50%
Parabolic-Trough Technology Roadmap January 1999
Page 9
TECHNOLOGY BASELINE
Although all nine of the original SEGS plants continue to operate today, no new plants have beenbuilt since 1990. During the construction of these plants, significant cost reductions were achieved,driving the cost of electricity down from 24¢/kWh to 8¢/kWh (1988 dollars). Tax incentives andattractive power purchase contracts that were available at the time were largely responsible for theeconomic viability of these projects. With the expiration of many of these tax incentives and thecontinued drop in conventional energy prices, these plants would not be competitive in today'spower market. Updating these costs to show the cost in 1998 dollars and the current taxenvironment raises the cost of power to about 12¢/kWh for an 80-MW SEGS plant.
CURRENT STATUS OF TROUGH TECHNOLOGY
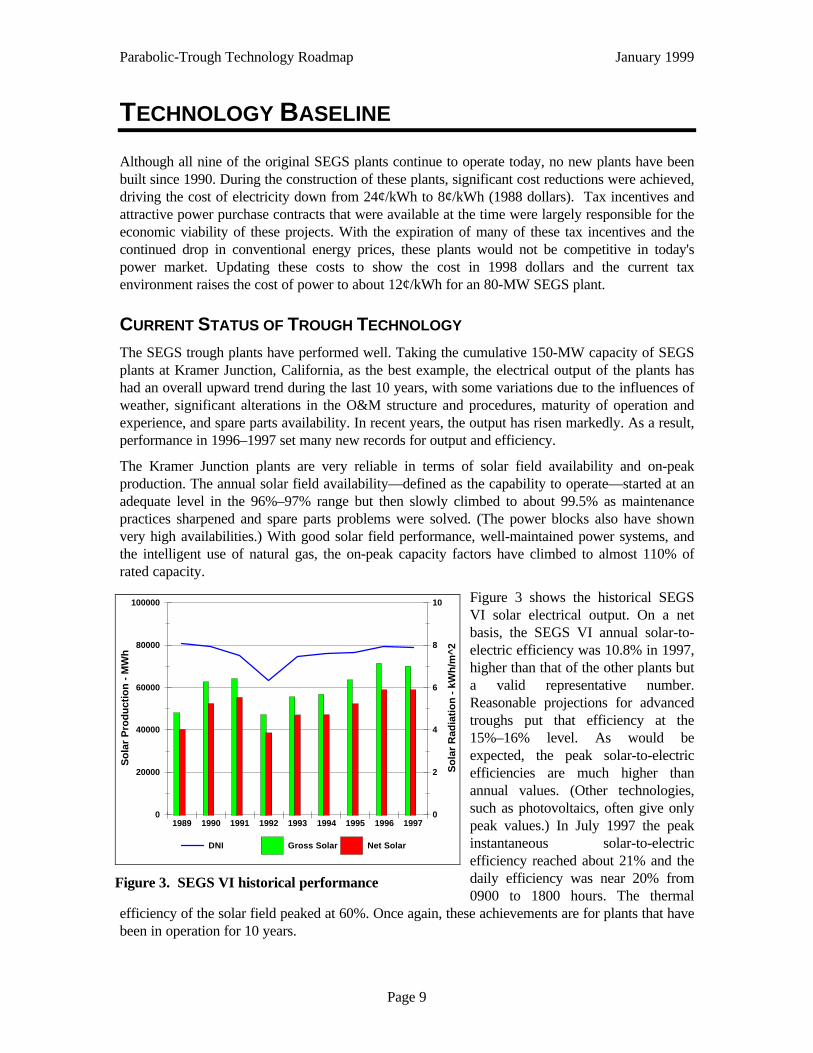
The SEGS trough plants have performed well. Taking the cumulative 150-MW capacity of SEGSplants at Kramer Junction, California, as the best example, the electrical output of the plants hashad an overall upward trend during the last 10 years, with some variations due to the influences ofweather, significant alterations in the O&M structure and procedures, maturity of operation andexperience, and spare parts availability. In recent years, the output has risen markedly. As a result,performance in 1996–1997 set many new records for output and efficiency.
The Kramer Junction plants are very reliable in terms of solar field availability and on-peakproduction. The annual solar field availability—defined as the capability to operate—started at anadequate level in the 96%–97% range but then slowly climbed to about 99.5% as maintenancepractices sharpened and spare parts problems were solved. (The power blocks also have shownvery high availabilities.) With good solar field performance, well-maintained power systems, andthe intelligent use of natural gas, the on-peak capacity factors have climbed to almost 110% ofrated capacity.
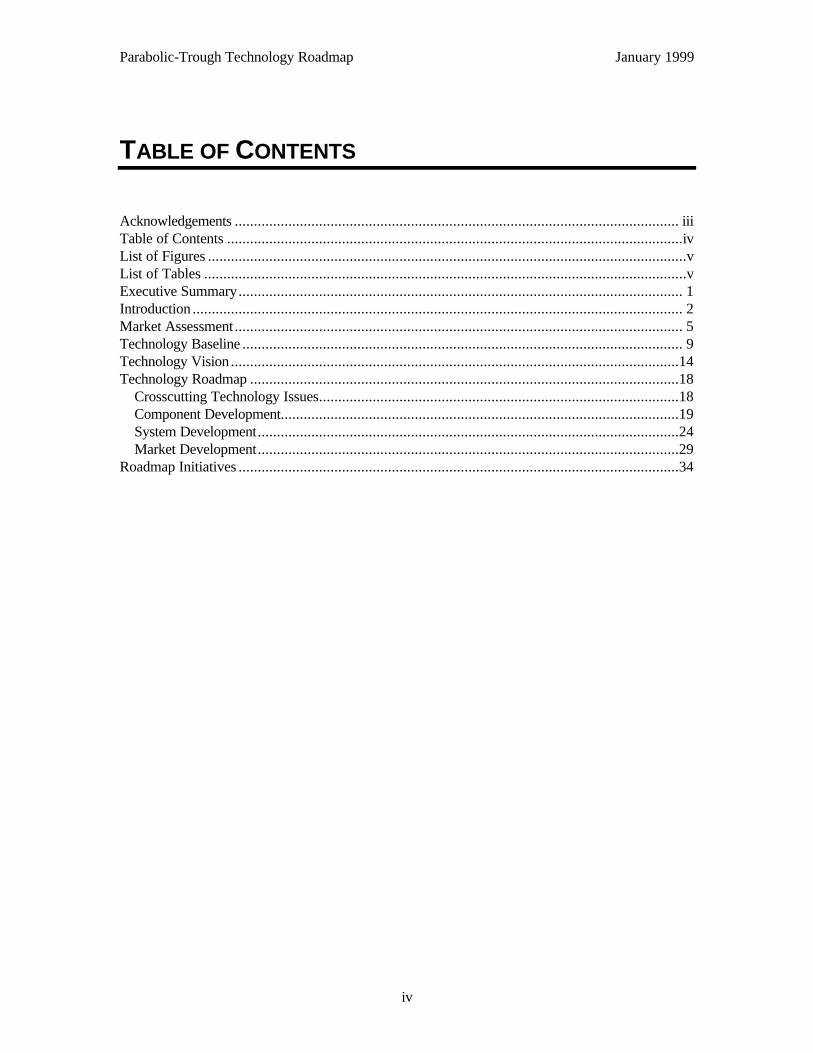
Figure 3 shows the historical SEGSVI solar electrical output. On a netbasis, the SEGS VI annual solar-to-electric efficiency was 10.8% in 1997,higher than that of the other plants buta valid representative number.Reasonable projections for advancedtroughs put that efficiency at the15%–16% level. As would beexpected, the peak solar-to-electricefficiencies are much higher thanannual values. (Other technologies,such as photovoltaics, often give onlypeak values.) In July 1997 the peakinstantaneous solar-to-electricefficiency reached about 21% and thedaily efficiency was near 20% from0900 to 1800 hours. The thermal
efficiency of the solar field peaked at 60%. Once again, these achievements are for plants that havebeen in operation for 10 years.
0
20000
40000
60000
80000
100000
So
lar
Pro
du
ctio
n -
MW
h
0
2
4
6
8
10
So
lar
Rad
iati
on
- k
Wh
/m^
2
1989 1990 1991 1992 1993 1994 1995 1996 1997
DNI Gross Solar Net Solar
Figure 3. SEGS VI historical performance
Parabolic-Trough Technology Roadmap January 1999
Page 10
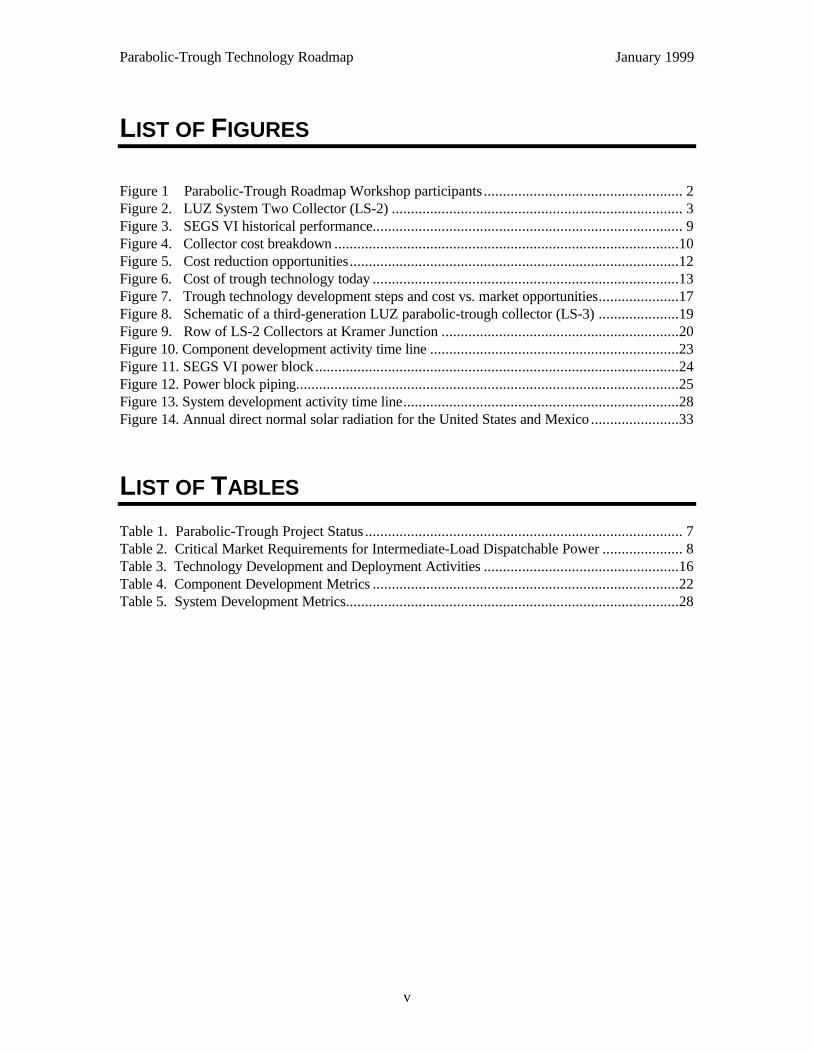
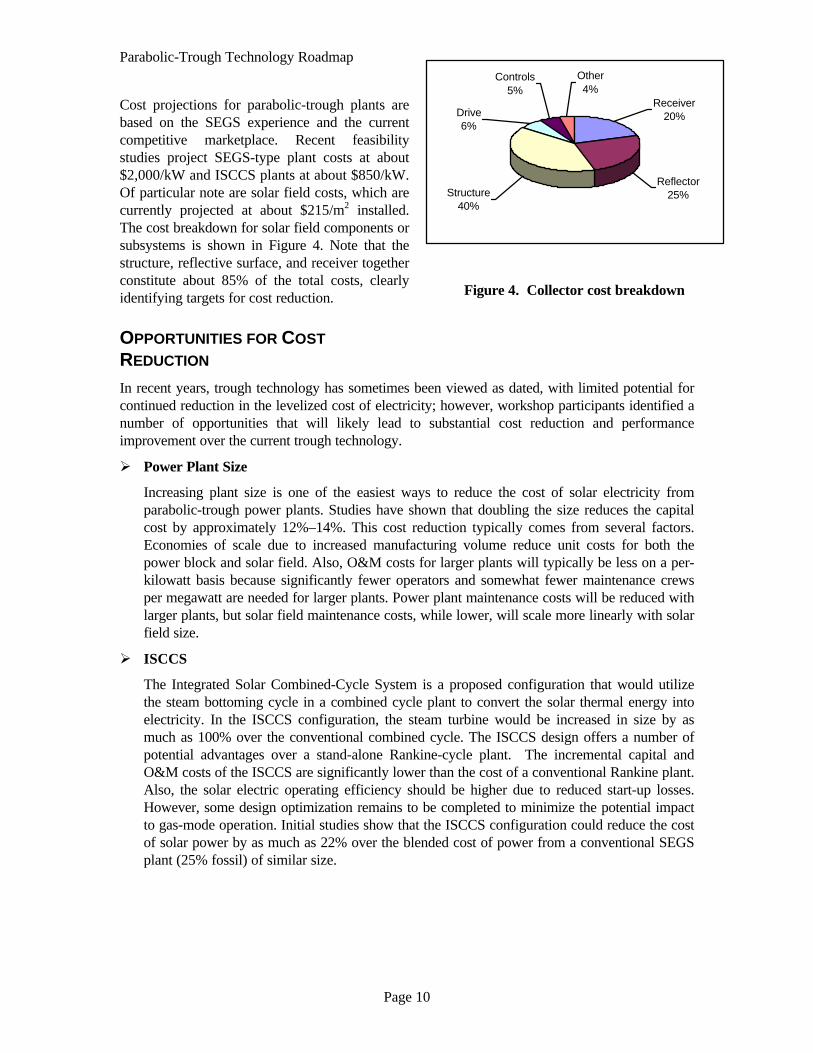
Cost projections for parabolic-trough plants arebased on the SEGS experience and the currentcompetitive marketplace. Recent feasibilitystudies project SEGS-type plant costs at about$2,000/kW and ISCCS plants at about $850/kW.Of particular note are solar field costs, which arecurrently projected at about $215/m2 installed.The cost breakdown for solar field components orsubsystems is shown in Figure 4. Note that thestructure, reflective surface, and receiver togetherconstitute about 85% of the total costs, clearlyidentifying targets for cost reduction.
OPPORTUNITIES FOR COST
REDUCTION
In recent years, trough technology has sometimes been viewed as dated, with limited potential forcontinued reduction in the levelized cost of electricity; however, workshop participants identified anumber of opportunities that will likely lead to substantial cost reduction and performanceimprovement over the current trough technology.
Ø Power Plant Size
Increasing plant size is one of the easiest ways to reduce the cost of solar electricity fromparabolic-trough power plants. Studies have shown that doubling the size reduces the capitalcost by approximately 12%–14%. This cost reduction typically comes from several factors.Economies of scale due to increased manufacturing volume reduce unit costs for both thepower block and solar field. Also, O&M costs for larger plants will typically be less on a per-kilowatt basis because significantly fewer operators and somewhat fewer maintenance crewsper megawatt are needed for larger plants. Power plant maintenance costs will be reduced withlarger plants, but solar field maintenance costs, while lower, will scale more linearly with solarfield size.
Ø ISCCS
The Integrated Solar Combined-Cycle System is a proposed configuration that would utilizethe steam bottoming cycle in a combined cycle plant to convert the solar thermal energy intoelectricity. In the ISCCS configuration, the steam turbine would be increased in size by asmuch as 100% over the conventional combined cycle. The ISCCS design offers a number ofpotential advantages over a stand-alone Rankine-cycle plant. The incremental capital andO&M costs of the ISCCS are significantly lower than the cost of a conventional Rankine plant.Also, the solar electric operating efficiency should be higher due to reduced start-up losses.However, some design optimization remains to be completed to minimize the potential impactto gas-mode operation. Initial studies show that the ISCCS configuration could reduce the costof solar power by as much as 22% over the blended cost of power from a conventional SEGSplant (25% fossil) of similar size.
Structure40%
Reflector25%
Receiver20%
Controls5%
Drive6%
Other4%
Figure 4. Collector cost breakdown
Parabolic-Trough Technology Roadmap January 1999
Page 11
Ø Advanced Trough Collector
As illustrated above, the structure constitutes about 40% of the solar field cost, whereas thereflectors and receivers each cost from 20%–25% of the total. In the SEGS design, steelprovides the major strength, with thick glass mirror panels giving the parabolic shape to thereflecting surface. Lower-cost designs can be explored for the steel structure, with a possiblealternative of a lighter aluminum or composite structure integrated with a front surfacereflector on film, thin glass, or structural member. Evolutionary improvements in the receiversare also possible.
Ø Direct Steam Generation (DSG)
In the DSG concept, steam is generated directly in the parabolic-trough collectors. This savescost by eliminating the need for the heat transfer fluid (HTF) system and reduces the efficiencyloss involved with using a heat exchanger to generate steam. DSG should also improve thesolar field operating efficiency due to lower average operating temperatures and improved heattransfer in the collector receiver. The trough collectors would require some modification due tothe higher operating pressure and lower fluid flow rates. Control of a DSG solar field likelywill be more complicated than the HTF systems and may require a more complex design layoutand a tilted collector. DSG also makes it more difficult to provide any thermal storage. A pilotdemonstration of DSG technology is in progress at the Plataforma Solar de Almería (PSA) inSpain.
Ø Solar Power Park Development
One opportunity for significantly reducing the cost of CSP plants is to develop multiple plantsat the same location in a solar power park environment. The power park offers a number ofpotential opportunities for reducing cost. If multiple projects are planned together, projectdevelopment and engineering costs per project will likely be reduced. If the O&M is performedby a single company, significant reductions in overhead and improved O&M efficiency andskill coverage are possible. If the plants are built consecutively and the same constructioncrews are used for all plants, construction costs should be reduced through labor learningcurve efficiencies. Multiple projects will mean multiyear manufacturing runs on solar collectorcomponents, resulting in reduced cost per collector. Competitive bidding of major power plantequipment, materials, and services will likely result in greater cost reduction for multipleprojects. Building five plants in a phased project approach at the same site could in factreduce costs by 25% to 30% for a single project.
Ø Project Financial Structure
Parabolic-trough plants are capital-intensive projects. The cost of capital and the type ofproject financing can have a significant impact on the final cost of power. In the past, theSEGS projects were all financed as IPP projects. Significant cost reductions are possible ifprojects are owned by investor-owned utilities (IOUs), municipal utilities, or by the newgeneration companies (GenCos) that are being created as part of utility restructuring. Costreductions approximately 10%–40% are possible through alternative ownership and financingstructures.
Ø Tax Equity
Studies have shown that capital-intensive power projects, such as parabolic-trough plants, paya higher percentage of taxes than expense-intensive projects, such as fossil fuel technologies.
Parabolic-Trough Technology Roadmap January 1999
Page 12
One study for the California Energy Commission comparing taxes paid by concentrating solarpower technologies with taxes paid by fossil technologies showed that approximate tax equitywas achieved with a 20% federal investment tax credit and property tax exemption for CSPtechnologies. Tax equity in this case results in an 18% reduction in levelized energy cost.Although these results apply to the specific case tested, it shows the approximate level of taxequalizers necessary to gain parity between solar and conventional technologies.
Ø Low-Cost Debt
Finally, a number of institutions have indicated that low-cost debt may be available forrenewable power projects. Given the capital intensity of solar technologies, this offers one ofthe largest opportunities for cost reduction. For example, the availability of 2% debt in place of9.5% debt could reduce the levelized cost of energy by more than 30%.
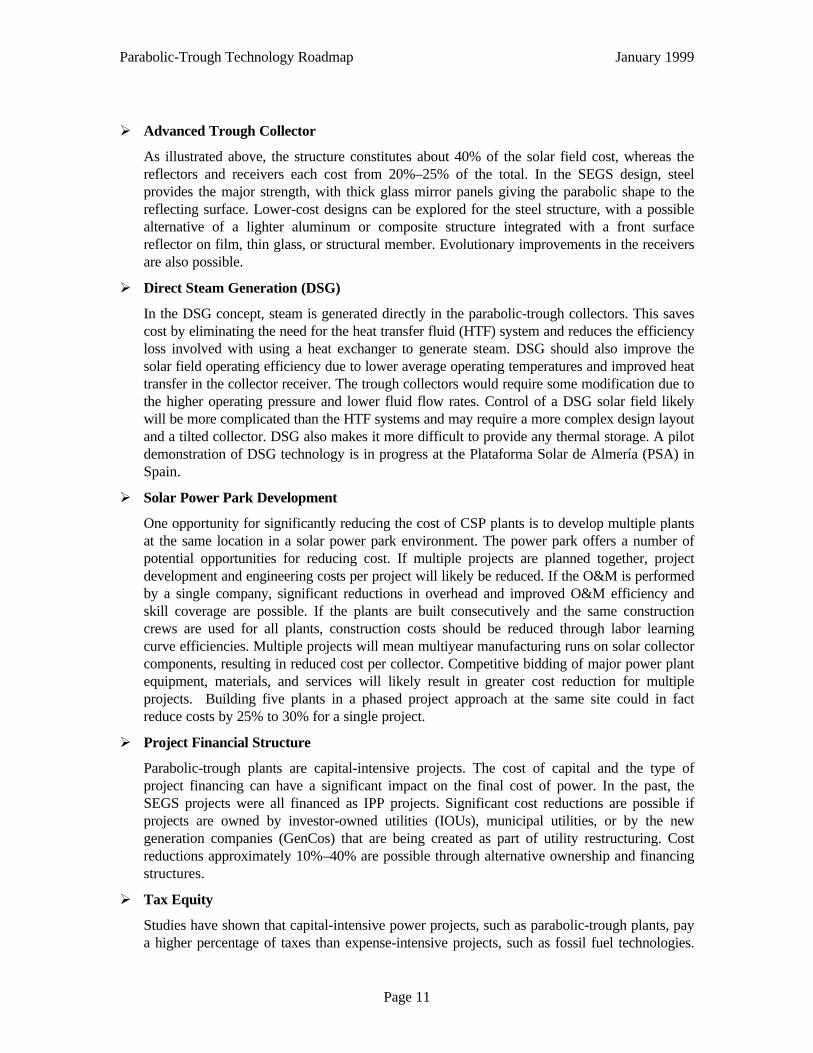
Figure 5 summarizes the opportunities for cost reduction in parabolic-trough power technology.These cost reduction opportunities are generally multiplicative, but not all would be taken together.Although cost reduction is often thought to result primarily from the introduction of advancedtechnologies, it is clear that the most significant opportunities for cost reduction are through non-technology development areas. The largest opportunities result from the type of project financingand the existence of a power park to consolidate construction and O&M costs.
0%
5%
10%
15%
20%
25%
30%
35%
% R
edu
ctio
n in
LE
C
50 to 160MW
ISCCSHybrid
Tech.Dev.
SolarPark
GenCoFinance
TaxEquity
2% Debt
Figure 5. Cost reduction opportunities
THE COST OF TROUGH TECHNOLOGY TODAY
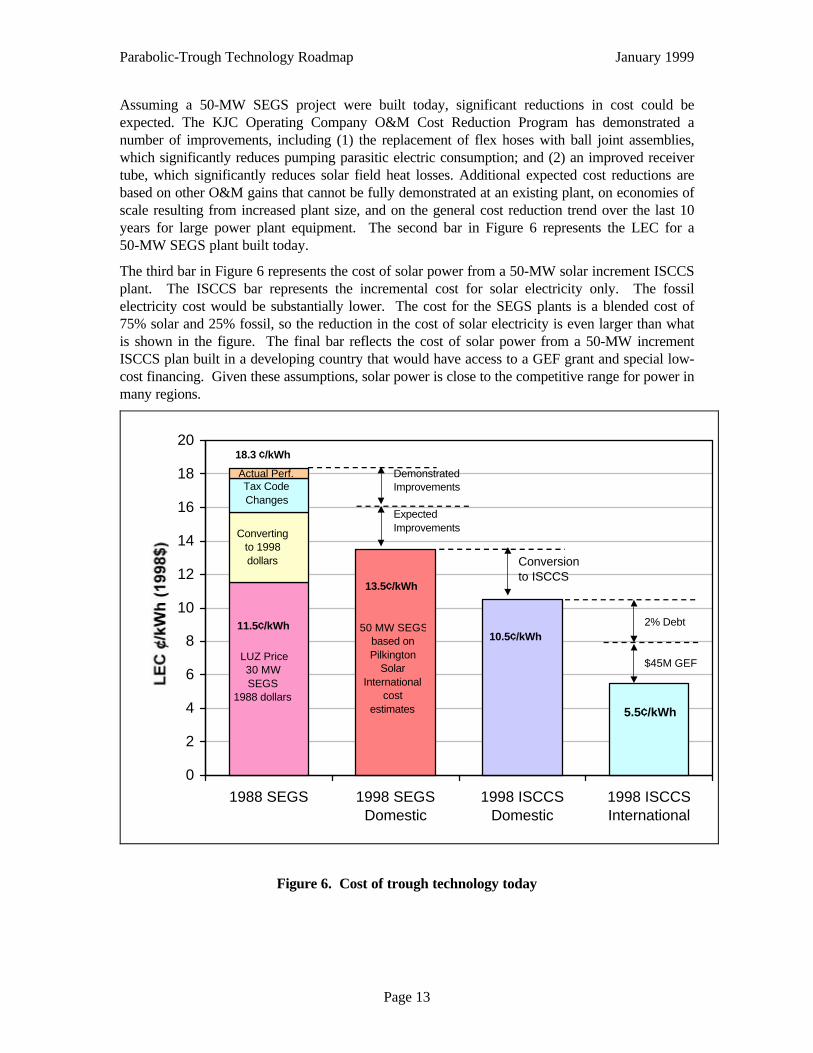
What would a trough power plant cost today? LUZ reported costs starting at 24¢/kWh for SEGS Idown to 8¢/kWh for SEGS IX. These values were calculated in 1988 dollars and with the tax andfinancial structure of the projects at the time. Figure 6 shows what the cost of power from the 30-MW SEGS VI would be today after correcting for inflation, incorporating changes in the tax code,and adjusting for the actual performance of the plant. In the case of SEGS VI, if the same plantwere built again today, the levelized cost of energy from the plant increases from 11.5¢/kWh in1988 dollars (based on predicted performance) to 18.3¢/kWh in 1998 dollars (based on actualperformance).
Parabolic-Trough Technology Roadmap January 1999
Page 13
Assuming a 50-MW SEGS project were built today, significant reductions in cost could beexpected. The KJC Operating Company O&M Cost Reduction Program has demonstrated anumber of improvements, including (1) the replacement of flex hoses with ball joint assemblies,which significantly reduces pumping parasitic electric consumption; and (2) an improved receivertube, which significantly reduces solar field heat losses. Additional expected cost reductions arebased on other O&M gains that cannot be fully demonstrated at an existing plant, on economies ofscale resulting from increased plant size, and on the general cost reduction trend over the last 10years for large power plant equipment. The second bar in Figure 6 represents the LEC for a50-MW SEGS plant built today.
The third bar in Figure 6 represents the cost of solar power from a 50-MW solar increment ISCCSplant. The ISCCS bar represents the incremental cost for solar electricity only. The fossilelectricity cost would be substantially lower. The cost for the SEGS plants is a blended cost of75% solar and 25% fossil, so the reduction in the cost of solar electricity is even larger than whatis shown in the figure. The final bar reflects the cost of solar power from a 50-MW incrementISCCS plan built in a developing country that would have access to a GEF grant and special low-cost financing. Given these assumptions, solar power is close to the competitive range for power inmany regions.
0
2
4
6
8
10
12
14
16
18
20
1988 SEGS 1998 SEGSDomestic
1998 ISCCSDomestic
1998 ISCCSInternational
Conversionto ISCCS
DemonstratedImprovements
ExpectedImprovements
$45M GEF
2% Debt
5.5¢/kWh
10.5¢/kWh
13.5¢/kWh
11.5¢/kWh
LUZ Price30 MW SEGS
1988 dollars
Convertingto 1998 dollars
Tax Code Changes
18.3 ¢/kWh
Actual Perf.
50 MW SEGS based on Pilkington
SolarInternational
cost estimates
Figure 6. Cost of trough technology today
Parabolic-Trough Technology Roadmap January 1999
Page 14
TECHNOLOGY VISION
Based on the market and technology information provided above, the participants at the troughroadmap workshop created a vision for sustained development and deployment of parabolic-troughtechnology. The sections below highlight the key elements of this vision and the key technologychallenges that must be addressed. The final section provides the development vision assumed bythe trough roadmap.
KEY ELEMENTS OF THE TROUGH ROADMAP
Ø Technology and Market Development
The roadmap must include both technology and market development components. Even withsignificant technological improvements, trough technology would achieve only a fraction of itspotential without a concerted market development effort. Likewise, a market developmenteffort without a significant technology development focus would be ineffective.
Ø Near-Term and Long-Term Opportunities
Based on the market scenarios outlined, opportunities exist for trough technologies both in thenear and long term. For troughs to be successful, the trough roadmap must have both near-term and long-term components.
Ø Collaborations
In order for trough technology to be successful, all stakeholder groups (industry, government,laboratories, financial institutions, regulators, and policy makers) must work together todevelop a cohesive development program. U.S. collaboration with European and Israelitechnology providers and research facilities that have been working to market and improve thetechnology will also enhance U.S. industry's chances for success.
KEY TECHNOLOGY CHALLENGES
A number of technology challenges must be addressed if trough technology is to be successful inthe future power market.
Ø Cost Reduction and Performance Improvement
The cost of trough technology must be reduced for it to be competitive in future powermarkets. Based on initial estimates, cost reductions of 50% appear to be possible, but this willrequire a focused technology development effort in combination with real project deploymentopportunities. Performance improvements of up to 50% are within reach with advancements inthe technology.
Ø Reintroduction of Troughs
Even if the next trough project were to begin today, by the time it is completed, nearly 10 yearswill have passed since LUZ completed its last trough project. Some of the knowledge basedeveloped by LUZ will have been lost in that time. Even with the lessons learned since then, itwill be difficult for the next developer to immediately improve on the LUZ experience. This
Parabolic-Trough Technology Roadmap January 1999
Page 15
lag effect will be even more pronounced if the next project is developed at a location outsidethe United States.
Ø Industry Development
Since the time that LUZ went out of business, the IPP industry has matured significantly.Although a single developer/technology provider such as LUZ is not required, a troughconsortium will need to work together efficiently with a common set of development objectives.In addition, the consortium must determine how the technology will be warranted, and how riskwill be shared.
Ø Information Transfer
Although troughs are often treated as a dated technology with little room for improvement, theKJC O&M Cost Reduction Program identified a number of opportunities for cost reductionand performance improvements. The opportunity remains for significant changes in key designelements (e.g., structure, reflectors, and HCEs). In addition, parabolic troughs havedemonstrated excellent performance to date as characterized by the existing LUZ troughplants. The challenge will be to bring the message about the capabilities and opportunities forparabolic trough technology to governments and to the power and financial industries.
Ø Risk Reduction
Risk is a general term used to describe the uncertainties that could have a negative impact on aproject. Risk can result from uncertainties in cost, schedule, technology, resource availability,power sales, financial parameters, political stability, or location. When a project is beingconsidered, investors (debt and equity) will analyze it to evaluate the financial merit versus therisk. If the risk is high, the financial return must be sufficiently high to justify the potentialrisk, thus increasing the cost of capital. Unfortunately, projects using new technologies andprojects in developing countries are usually considered high risk. It is important to minimizeproject risk whenever possible.
Parabolic-Trough Technology Roadmap January 1999
Page 16
TROUGH DEVELOPMENT VISION
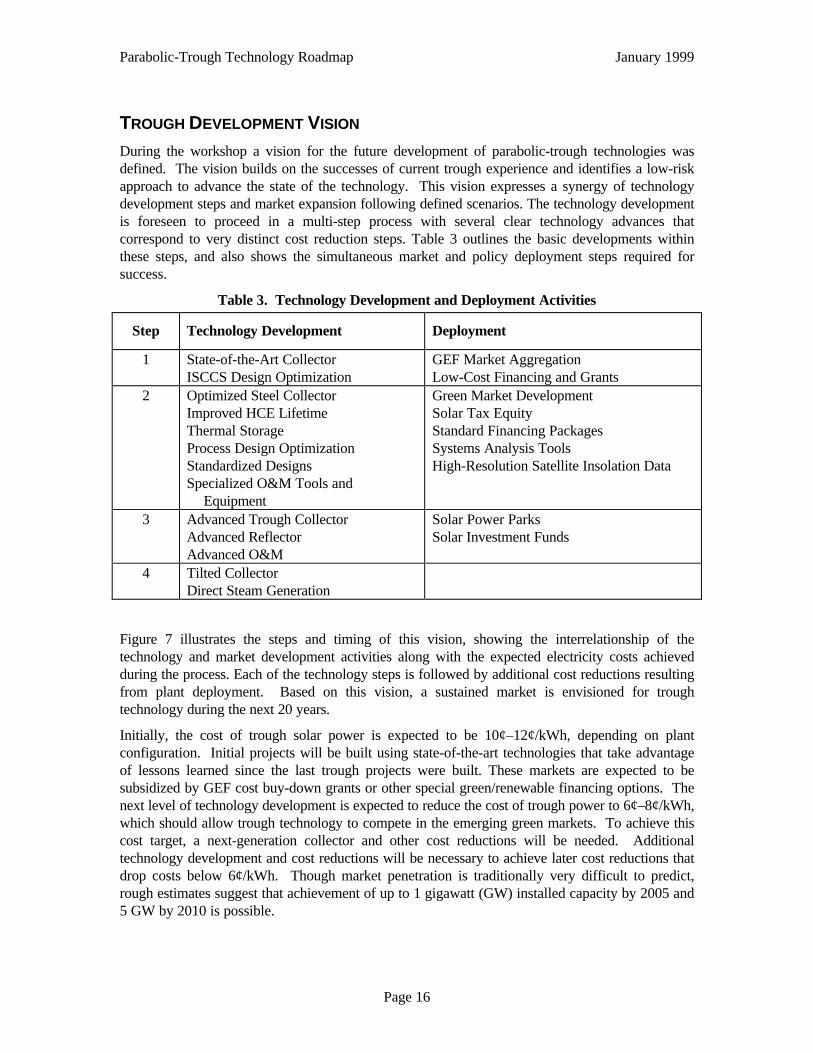
During the workshop a vision for the future development of parabolic-trough technologies wasdefined. The vision builds on the successes of current trough experience and identifies a low-riskapproach to advance the state of the technology. This vision expresses a synergy of technologydevelopment steps and market expansion following defined scenarios. The technology developmentis foreseen to proceed in a multi-step process with several clear technology advances thatcorrespond to very distinct cost reduction steps. Table 3 outlines the basic developments withinthese steps, and also shows the simultaneous market and policy deployment steps required forsuccess.
Table 3. Technology Development and Deployment Activities
Step Technology Development Deployment
1 State-of-the-Art CollectorISCCS Design Optimization
GEF Market AggregationLow-Cost Financing and Grants
2 Optimized Steel CollectorImproved HCE LifetimeThermal StorageProcess Design OptimizationStandardized DesignsSpecialized O&M Tools and
Equipment
Green Market DevelopmentSolar Tax EquityStandard Financing PackagesSystems Analysis ToolsHigh-Resolution Satellite Insolation Data
3 Advanced Trough CollectorAdvanced ReflectorAdvanced O&M
Solar Power ParksSolar Investment Funds
4 Tilted CollectorDirect Steam Generation
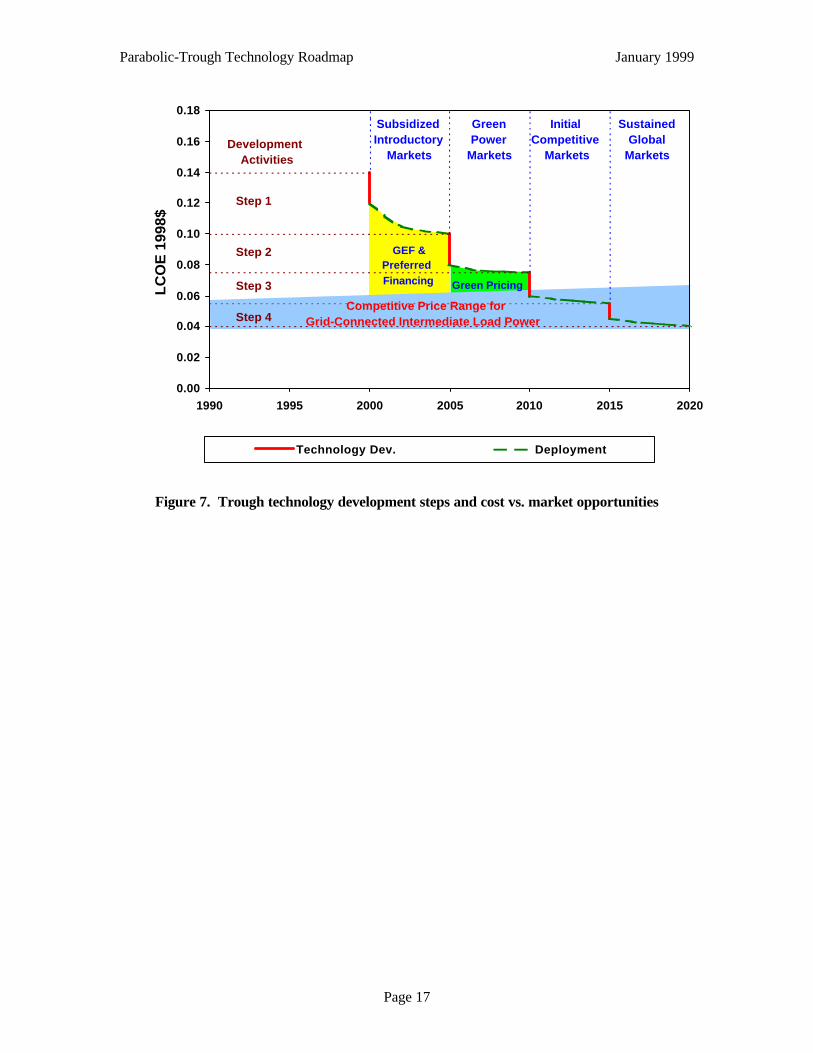
Figure 7 illustrates the steps and timing of this vision, showing the interrelationship of thetechnology and market development activities along with the expected electricity costs achievedduring the process. Each of the technology steps is followed by additional cost reductions resultingfrom plant deployment. Based on this vision, a sustained market is envisioned for troughtechnology during the next 20 years.
Initially, the cost of trough solar power is expected to be 10¢–12¢/kWh, depending on plantconfiguration. Initial projects will be built using state-of-the-art technologies that take advantageof lessons learned since the last trough projects were built. These markets are expected to besubsidized by GEF cost buy-down grants or other special green/renewable financing options. Thenext level of technology development is expected to reduce the cost of trough power to 6¢–8¢/kWh,which should allow trough technology to compete in the emerging green markets. To achieve thiscost target, a next-generation collector and other cost reductions will be needed. Additionaltechnology development and cost reductions will be necessary to achieve later cost reductions thatdrop costs below 6¢/kWh. Though market penetration is traditionally very difficult to predict,rough estimates suggest that achievement of up to 1 gigawatt (GW) installed capacity by 2005 and5 GW by 2010 is possible.
Parabolic-Trough Technology Roadmap January 1999
Page 17
Figure 7. Trough technology development steps and cost vs. market opportunities
0.00
0.02
0.04
0.06
0.08
0.10
0.12
0.14
0.16
0.18
1990 1995 2000 2005 2010 2015 2020
LC
OE
199
8$
Technology Dev. Deployment
GEF & Preferred Financing
Green Power
Markets
InitialCompetitive
Markets
SustainedGlobal
Markets
Step 1
Step 2
Step 3
Step 4
DevelopmentActivities
Competitive Price Range forGrid-Connected Intermediate Load Power
SubsidizedIntroductory
Markets
Green Pricing
Parabolic-Trough Technology Roadmap January 1999
Page 18
TECHNOLOGY ROADMAP
The roadmapping approach used here defines “major technology areas” that can help achieve thecritical market requirements for the product. The product in this case is intermediate-loaddispatchable solar power. The major technology areas for the trough roadmap are crosscuttingtechnology, component development, system development, and market development.
CROSSCUTTING TECHNOLOGY ISSUES
Crosscutting technology issues cut across all areas of the technology roadmap.
SYSTEM METRICS AND BASELINE DATA
A consistent set of metrics needs to be developed for evaluating all activities in the roadmap.These metrics should define the key technology drivers and their targets and eventually tie backinto the critical system requirements. These usually will be cost, performance, or reliabilitymetrics.
ANALYSIS TOOLS
Analytical tools and models must be developed to allow system metrics to be assessed and valued.These tools include performance and financial models.
QUALITY AND RELIABILITY
Procedures and training should be put in place to ensure that standards are maintained throughdesign, manufacture, construction, start-up, operation, and maintenance. These include designcontrol, documentation control, and component and system reliability tracking.
Parabolic-Trough Technology Roadmap January 1999
Page 19
COMPONENT DEVELOPMENT
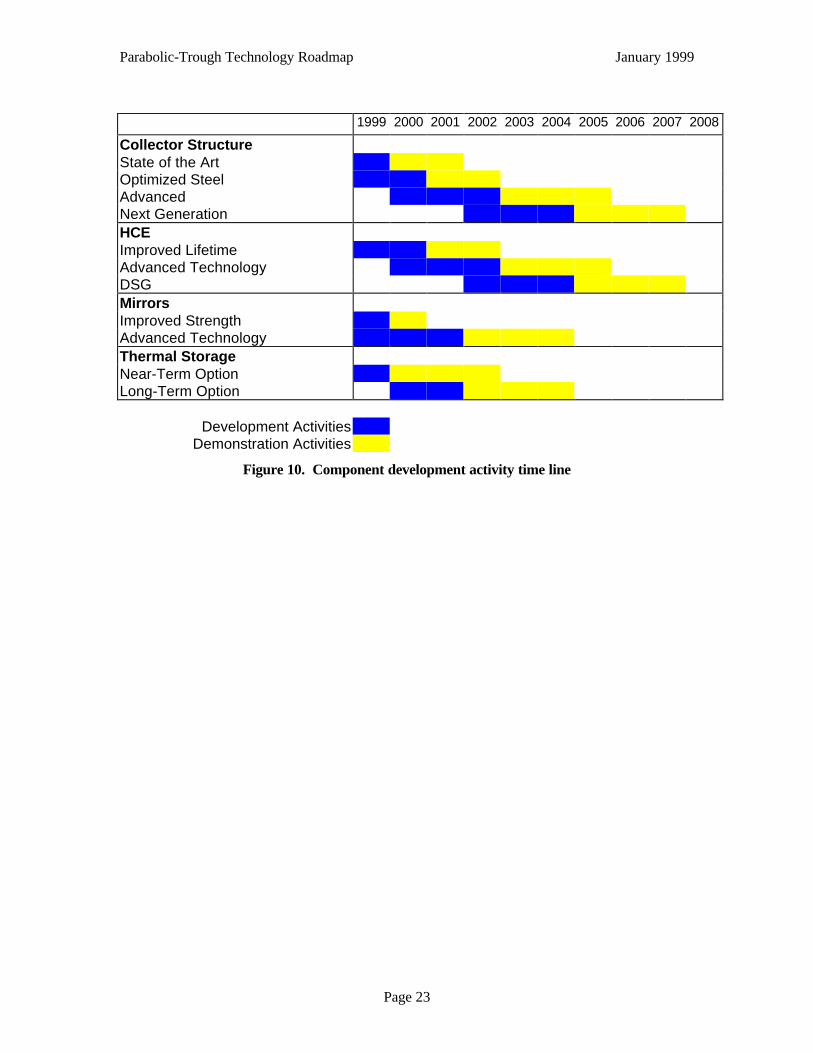
This section focuses on technology development of components or subsystems of the collector andsolar field. Collector components include all the components and subsystems that are part of themodular trough concentrator assemblies. The basic subsystems are the structure, receiver,reflector, tracking system, interconnecting piping, and the control system. Solar field systemsrequiring further development include direct steam generation in the field itself, and thermalstorage. The key technology metrics for each of the subsystems are shown in Table 4. Time linesfor various subsystem technology alternatives are shown in Figure 10 (see page 23).
TROUGH STRUCTURE
This subsystem includes all of the structure, including the foundations, pylons, trusses and torquetubes, mirror and receiver support arms, and fasteners. The structure establishes and maintainsoptical alignment of the parabolic shape, withstands the wind, and supports the other subsystems.This category also includes all labor required to install and align the structure during construction,and subsequent O&M of the structure during the life of the project.
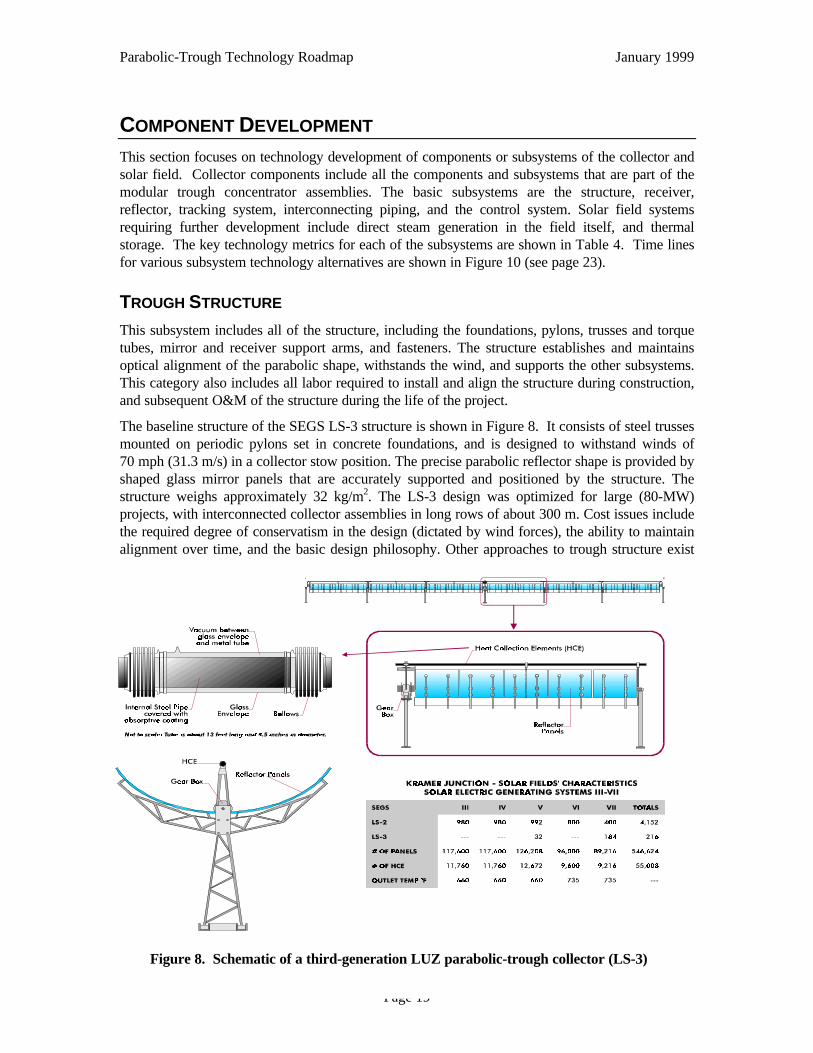
The baseline structure of the SEGS LS-3 structure is shown in Figure 8. It consists of steel trussesmounted on periodic pylons set in concrete foundations, and is designed to withstand winds of70 mph (31.3 m/s) in a collector stow position. The precise parabolic reflector shape is provided byshaped glass mirror panels that are accurately supported and positioned by the structure. Thestructure weighs approximately 32 kg/m2. The LS-3 design was optimized for large (80-MW)projects, with interconnected collector assemblies in long rows of about 300 m. Cost issues includethe required degree of conservatism in the design (dictated by wind forces), the ability to maintainalignment over time, and the basic design philosophy. Other approaches to trough structure exist
Figure 8. Schematic of a third-generation LUZ parabolic-trough collector (LS-3)
Parabolic-Trough Technology Roadmap January 1999
Page 20
(e.g., torque tubes and lighter metals, with a cable system providing strength), and new innovativedesigns may be possible. The structure currently represents about 40% of the total collector cost—easily the highest single subsystem cost and a prime target for cost reduction. Collector technologydevelopment, however, must advance in a logical manner. The first step is to define the currentstate-of-the-art collector that will be used in the next plants constructed. The second step is todevelop an optimized trough collector design that will focus on further cost reduction in the next-generation trough plants. Advanced designs must be developed to continue driving down the costand increasing collector efficiency.
Ø State-of-the-Art Collector
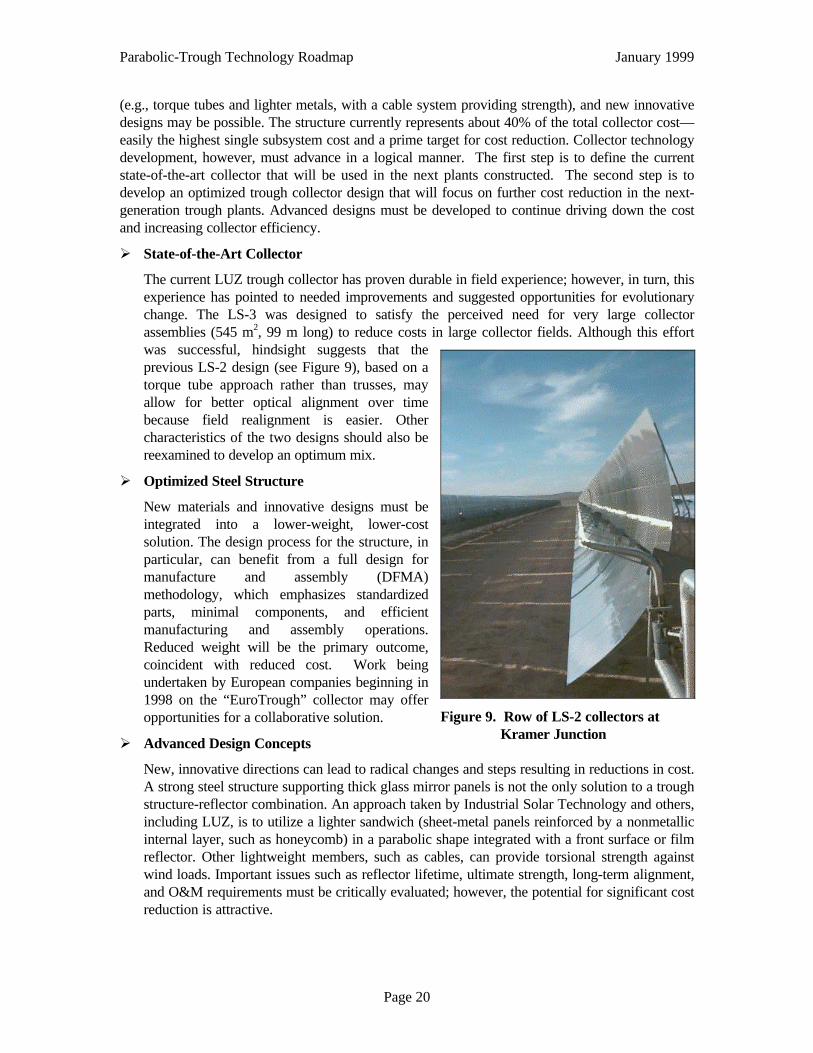
The current LUZ trough collector has proven durable in field experience; however, in turn, thisexperience has pointed to needed improvements and suggested opportunities for evolutionarychange. The LS-3 was designed to satisfy the perceived need for very large collectorassemblies (545 m2, 99 m long) to reduce costs in large collector fields. Although this effortwas successful, hindsight suggests that theprevious LS-2 design (see Figure 9), based on atorque tube approach rather than trusses, mayallow for better optical alignment over timebecause field realignment is easier. Othercharacteristics of the two designs should also bereexamined to develop an optimum mix.
Ø Optimized Steel Structure
New materials and innovative designs must beintegrated into a lower-weight, lower-costsolution. The design process for the structure, inparticular, can benefit from a full design formanufacture and assembly (DFMA)methodology, which emphasizes standardizedparts, minimal components, and efficientmanufacturing and assembly operations.Reduced weight will be the primary outcome,coincident with reduced cost. Work beingundertaken by European companies beginning in1998 on the “EuroTrough” collector may offeropportunities for a collaborative solution.
Ø Advanced Design Concepts
New, innovative directions can lead to radical changes and steps resulting in reductions in cost.A strong steel structure supporting thick glass mirror panels is not the only solution to a troughstructure-reflector combination. An approach taken by Industrial Solar Technology and others,including LUZ, is to utilize a lighter sandwich (sheet-metal panels reinforced by a nonmetallicinternal layer, such as honeycomb) in a parabolic shape integrated with a front surface or filmreflector. Other lightweight members, such as cables, can provide torsional strength againstwind loads. Important issues such as reflector lifetime, ultimate strength, long-term alignment,and O&M requirements must be critically evaluated; however, the potential for significant costreduction is attractive.
Figure 9. Row of LS-2 collectors atKramer Junction
Parabolic-Trough Technology Roadmap January 1999
Page 21
Parabolic-trough collectors have traditionally been installed horizontally, simplifying structuraldesign but suffering from the cosine effects fundamental to a one-axis tracking system. Apartial solution is to tilt the trough axis toward the south, allowing a higher useful flux on thecollector but introducing design and maintenance complexity. Risk and cost-benefit analysesshould be performed for this modification.
RECEIVER TUBE
The receiver tube has a major influence on the efficiency and reliability of the solar field. Thenewest receiver currently in use at the SEGS plants—termed a Heat Collection Element (HCE) andsupplied by SOLEL—was initially developed by LUZ. During the last few years, the HCE hasundergone additional development. Currently, the selective surface and the overall designcharacteristics are excellent. However, reliability and maintainability continue to be unsatisfactory.Relying on an evacuated annulus to minimize convection losses, this receiver suffers fromexcessive failures in the integrity of the outer glass envelope and the long-term level of vacuum.Additionally, the cost of the tube is significant in terms of overall solar field costs. Hence,increased lifetime, better maintainability, and lower cost must all be achieved.
Several design features that maintain the vacuum also require further development. First is a glass-to-metal seal between the glass enclosure tube and the expansion bellows. Little is known about itslong-term integrity, and accurate field monitoring of vacuum degradation is needed. Second is themeans to maintain the vacuum. In the SEGS HCE, the vacuum is maintained over time by the useof absorbing getters or a special hydrogen removal device, which uses reverse osmosis. The latter,although effective, has led to premature failures of the HCEs due to excessive thermal stresses.Because the vacuum adds significantly to receiver efficiency, this area requires close attention.
MIRROR FACETS
The current glass mirrors have an excellent reflective surface design; however, reduced mirrorbreakage would lead to reduced spare parts and maintenance costs. Although only on the order of1% per year, this is significant in absolute terms because of the large number of mirror panels. Theas-new reflectivity of the mirrors—about 94%—can be reestablished after soiling by high-pressurewashing with demineralized water, and corrosion of the silver layer has not proven to be a problemin the desert environment. However, the method of attachment of the mirrors to the structure is notas reliable as required, especially in high winds, leading to excessive failures at the attachmentinterface. New advancements in the attachment method, or strengthened mirror panels, arerequired.
Front-surface mirrors or film reflectors could reduce the cost of the reflective surface in the solarfield. This is an important goal, as the current design constitutes about 25% of the solar field cost.Although the reflector and structure form an integral unit to provide a highly reflective, accuratelyshaped parabolic trough, the issue is not simply one of a better reflective surface. A front-surfacemirror on less-expensive glass (e.g., ordinary “green” glass) is one concept; silvered nonmetallicfilm on a structure consisting of both metallic and nonmetallic components is another. Fundamentalcost-trade-off studies and advancement of the necessary components are required to explore cost-reduction approaches.
Parabolic-Trough Technology Roadmap January 1999
Page 22
THERMAL STORAGE
Thermal storage can be valuable in a number of operating conditions, such as markets requiringproduction shifts (e.g., where demand peaks occur in the evening) or locations where partly cloudyconditions are common and short-term buffering would be beneficial (e.g., Hawaii). Trough systemfeasibility studies have identified the need for thermal storage systems in locations such as northernMorocco, Crete, and Hawaii. The system usually postulated is a concrete-oil-iron sensible-heatstorage system, though LUZ proposed the use of phase-change salts in a cascade design. However,neither system is ready for deployment: serious engineering development and prototypeimplementation are required for the first, whereas more basic development is required for the latter.A molten salt similar to the one used in the Solar Two power tower system, but for lowertemperatures, also deserves evaluation. Success in this area will significantly extend themarketability of trough technology.
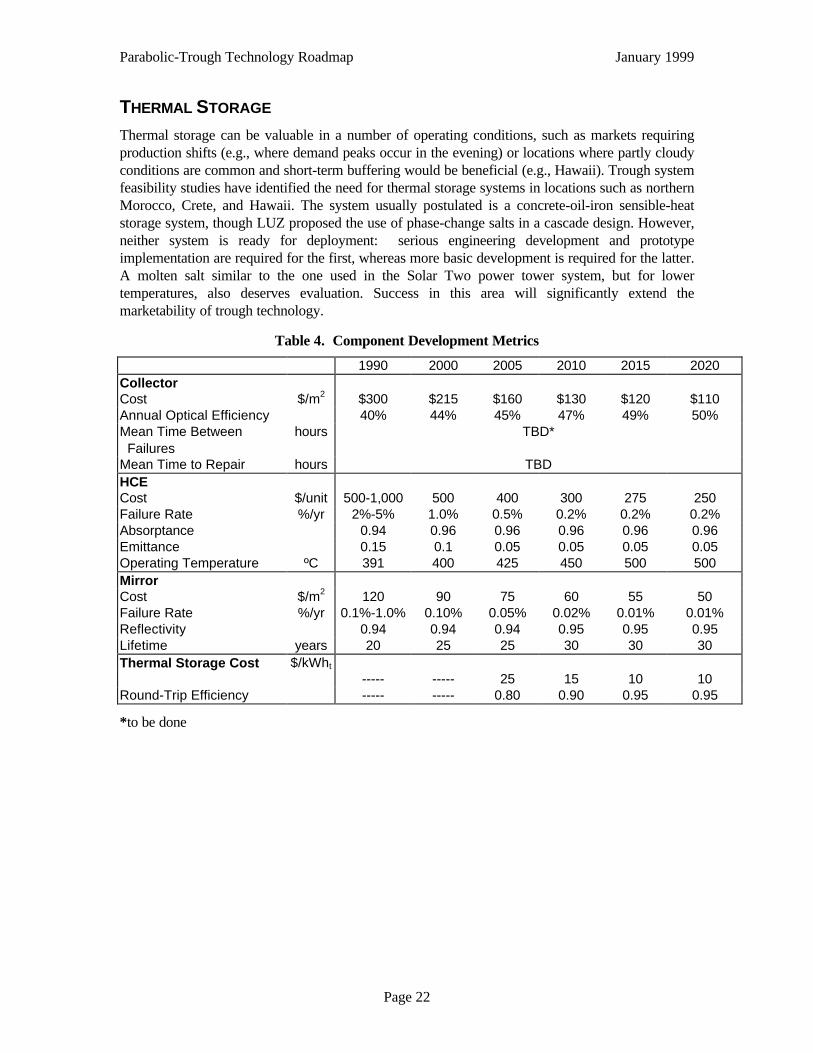
Table 4. Component Development Metrics
1990 2000 2005 2010 2015 2020CollectorCost $/m2 $300 $215 $160 $130 $120 $110Annual Optical Efficiency 40% 44% 45% 47% 49% 50%Mean Time Between Failures
hours TBD*
Mean Time to Repair hours TBDHCECost $/unit 500-1,000 500 400 300 275 250Failure Rate %/yr 2%-5% 1.0% 0.5% 0.2% 0.2% 0.2%Absorptance 0.94 0.96 0.96 0.96 0.96 0.96Emittance 0.15 0.1 0.05 0.05 0.05 0.05Operating Temperature ºC 391 400 425 450 500 500MirrorCost $/m2 120 90 75 60 55 50Failure Rate %/yr 0.1%-1.0% 0.10% 0.05% 0.02% 0.01% 0.01%Reflectivity 0.94 0.94 0.94 0.95 0.95 0.95Lifetime years 20 25 25 30 30 30Thermal Storage Cost $/kWht
----- ----- 25 15 10 10Round-Trip Efficiency ----- ----- 0.80 0.90 0.95 0.95
*to be done
Parabolic-Trough Technology Roadmap January 1999
Page 23
1999 2000 2001 2002 2003 2004 2005 2006 2007 2008
Collector StructureState of the ArtOptimized SteelAdvancedNext GenerationHCEImproved LifetimeAdvanced TechnologyDSGMirrorsImproved StrengthAdvanced TechnologyThermal StorageNear-Term OptionLong-Term Option
Development ActivitiesDemonstration Activities
Figure 10. Component development activity time line
Parabolic-Trough Technology Roadmap January 1999
Page 24
SYSTEM DEVELOPMENT
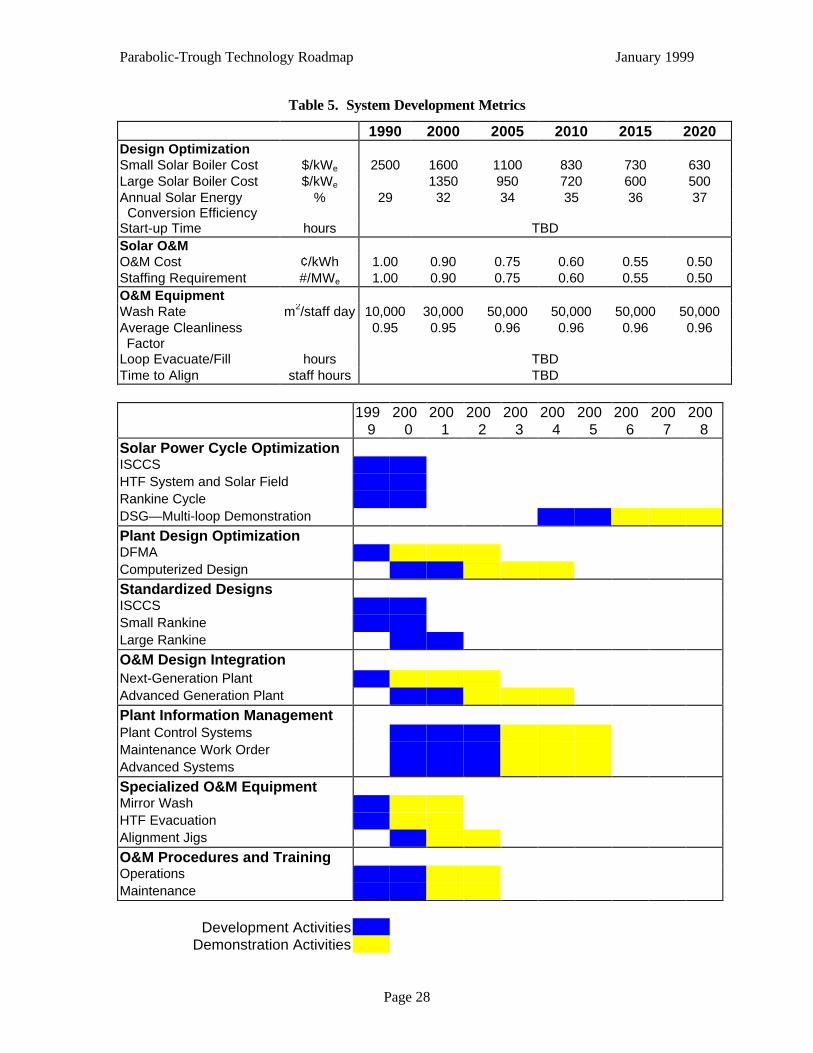
System development refers to all aspects of integrating solar and non-solar components andsystems into a complete, fully integrated concentrating solar power plant product. Key areas offocus identified by the trough roadmap working group are solar power cycle optimization, designoptimization, the development of standardized products, and improved integration of operation andmaintenance activities. The key metrics for each of the system development areas focus are shownin Table 5. Time lines for various system development alternatives are shown in Figure 13.
SOLAR POWER CYCLE OPTIMIZATION
Power cycle optimization represents a significant opportunity for cost reduction and possiblyperformance improvement in future plants. Early SEGS plants basically used off-the-shelf powerplant technology. At later SEGS plants, LUZ attempted to optimize the power cycle designthrough custom component selection. As a result, steam cycle efficiency was improved, parasiticelectric consumption was reduced, and plant start-up improved. This resulted in the use of reheatsteam turbine cycles and variable-speed pumps, for example. Additional improvements in plantefficiency and operation are thought to be possible through continued efforts in design integration.
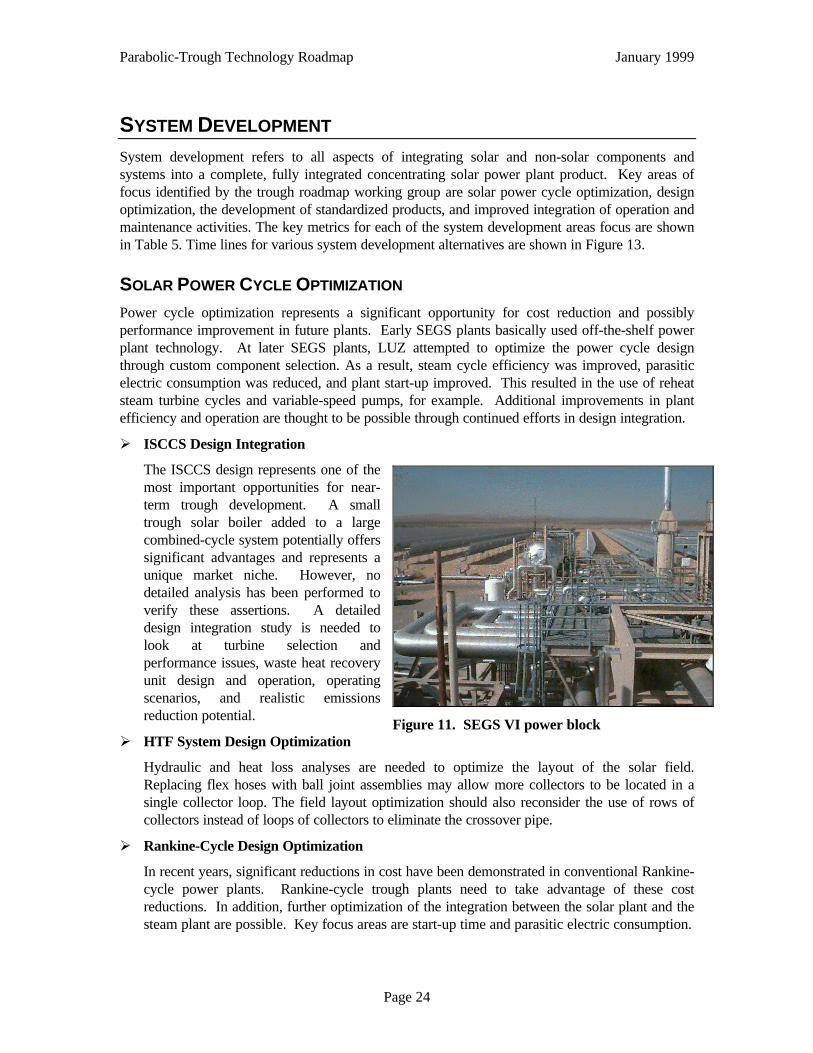
Ø ISCCS Design Integration
The ISCCS design represents one of themost important opportunities for near-term trough development. A smalltrough solar boiler added to a largecombined-cycle system potentially offerssignificant advantages and represents aunique market niche. However, nodetailed analysis has been performed toverify these assertions. A detaileddesign integration study is needed tolook at turbine selection andperformance issues, waste heat recoveryunit design and operation, operatingscenarios, and realistic emissionsreduction potential.
Ø HTF System Design Optimization
Hydraulic and heat loss analyses are needed to optimize the layout of the solar field.Replacing flex hoses with ball joint assemblies may allow more collectors to be located in asingle collector loop. The field layout optimization should also reconsider the use of rows ofcollectors instead of loops of collectors to eliminate the crossover pipe.
Ø Rankine-Cycle Design Optimization
In recent years, significant reductions in cost have been demonstrated in conventional Rankine-cycle power plants. Rankine-cycle trough plants need to take advantage of these costreductions. In addition, further optimization of the integration between the solar plant and thesteam plant are possible. Key focus areas are start-up time and parasitic electric consumption.
Figure 11. SEGS VI power block
Parabolic-Trough Technology Roadmap January 1999
Page 25
Ø Direct Steam Generation
For a number of years it has been proposed that parabolic-trough systems will benefit in bothperformance and cost from generation of steam directly in the solar field, eliminating theexpensive heat transfer fluid, the thermodynamic disadvantages of an intermediate heattransport system between the solar field and power block, and the HTF-to-steam heatexchangers. Although there are both pros and cons to this approach, it has generally beenviewed positively by LUZ and the current trough development community. An importantprototype development is currently under way at the Plataforma Solar de Almería, albeitlimited in scope to one to two rows of collectors. Because some flow-instability studies havesuggested that instabilities between a higher number of parallel rows may be the mostimportant concern, further prototype systems may be required after testing at the PSA.
PLANT DESIGN OPTIMIZATION
Suppliers of power plant technologies have identified a number of approaches for reducing the costof conventional power plants. These include a focus on simplifying the design, using standard off-the-shelf components, minimizing field construction requirements, and developing standard designs.Yet the current SEGS plants are a mixture of complex and custom system designs. Very littlestandardization exists between the solar field, HTF system, and steam cycle designs. Valves,piping, and instrumentation are often different. Although LUZ made significant efforts to reducecomplexity at the later plants (eliminating flow balance valves at SEGS IX and simplifying thesteam plant design through elimination of the gas boiler), significant opportunities exist for designimprovement.
Ø Plant DFMA Methodology
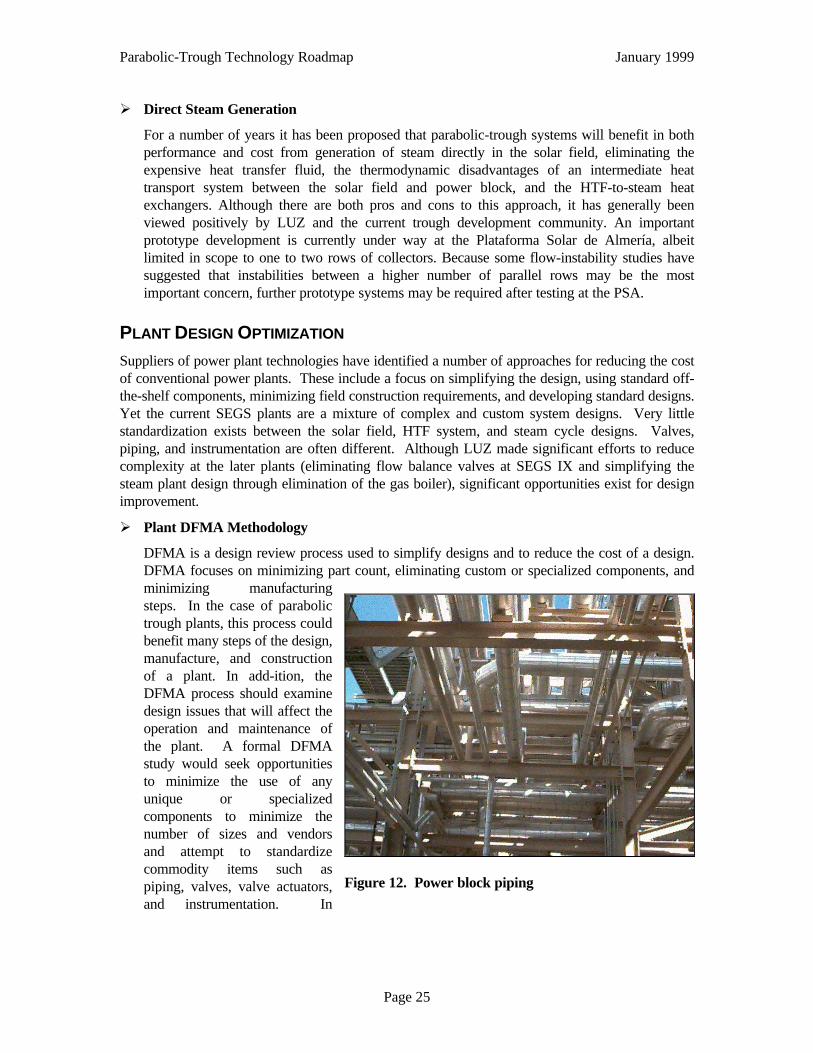
DFMA is a design review process used to simplify designs and to reduce the cost of a design.DFMA focuses on minimizing part count, eliminating custom or specialized components, andminimizing manufacturingsteps. In the case of parabolictrough plants, this process couldbenefit many steps of the design,manufacture, and constructionof a plant. In add-ition, theDFMA process should examinedesign issues that will affect theoperation and maintenance ofthe plant. A formal DFMAstudy would seek opportunitiesto minimize the use of anyunique or specializedcomponents to minimize thenumber of sizes and vendorsand attempt to standardizecommodity items such aspiping, valves, valve actuators,and instrumentation. In
Figure 12. Power block piping
Parabolic-Trough Technology Roadmap January 1999
Page 26
addition, efforts should be made to minimize site construction requirements, use prefabricatedor skid-mounted components and systems where possible, minimize the use of instrumentationand valves, and minimize piping runs.
Ø Computerized Design
Significant advancements have been made in the last 10 years in developing computerizeddesign tools. These tools not only allow for much quicker design and manufacture ofcomponents, but also for engineering analysis to be performed on the design. For example,wind-load testing can be performed on a concentrator design to make sure each component isdesigned (and not overdesigned) to handle the appropriate loads.
STANDARDIZED SOLAR BOILER PRODUCTS
In today's competitive marketplace, one of the approaches being used to reduce the cost of powergeneration technologies is to develop standard designs. Bechtel, for example, has its "Power Line"standard power plant designs that it uses to bid new projects. The concept is to develop a detaileddesign package that is 90% complete and only needs minor additions to account for the uniqueaspects of the site, infrastructure, and other local requirements. LUZ had developed a standard 80-MWe design for the SEGS X–XII projects located at Harper Lake, California. However, eachproject under consideration today seems to be heading toward a customized design for eachlocation. The industry must move toward standard products and designs that can be used for anylocation.
The following solar boiler products have been identified as the most probable designs for generalapplication:
Ø Small Rankine plant for stand-alone applications (30–50 MWe)
Ø Large Rankine plant for solar power park applications (150–200 MWe)
Ø Small ISCCS for large fossil combined-cycle plants (30–50 MWe solar equivalent—the samesolar plant as the small Rankine system).
Standard design packages should be developed for each of the standard solar boiler productsidentified above. In addition, we need to start educating decision makers to stop focusing on smallstand-alone Rankine plants and to start considering large solar power parks.
Parabolic-Trough Technology Roadmap January 1999
Page 27
OPERATION AND MAINTENANCE
Operation and maintenance is an important element of the levelized electricity cost forconcentrating solar power plants because of the large number of parts in the solar field. Importantlessons have been learned and advancements made through the cooperative KJC OperatingCompany/Sandia program on O&M cost reduction, pointing to steps that need to be refined andimplemented in future systems. Guidelines need to be developed to allow designers to includeO&M considerations in the design phases, including such features as redundancy, ease of access,rapid replacement, and facilitation of nighttime maintenance.
Ø Specialized O&M Equipment
Development of specialized industrial-grade O&M equipment can significantly reduce O&Mcosts at solar power plant facilities. Specialized O&M equipment includes mirror washingmachines, tools for rapid reflectivity measurements, collector alignment jigs and tools, andHTF evacuation trailers.
Ø Plant Information Management
Optimum management of a solar plant requires rapid access to plant information. Given thecomplex and distributed nature of a solar power plant, extensive information gathering,analysis, and reporting systems are required. This information includes plant operating data,engineering designs and specifications, maintenance data, spare parts inventory, procurementstatus, and all financial information. These are normally part of the conventional power plantmanagement system, but must be modified to adequately handle a distributed solar field aswell. In particular, tracking and handling of solar field maintenance requirements and planningcan be critically important.
Ø O&M Procedures and Training
Given the nonstandard nature of these projects, custom solar field and power plant O&Mtraining manuals and procedures should be developed. The KJC/Sandia cooperative programmentioned above has made an excellent start in this area. Availability of these types ofdocuments are critical for rapid start-up of new plants and the ability to obtain design-levelperformance from the plants.
Parabolic-Trough Technology Roadmap January 1999
Page 28
Table 5. System Development Metrics
1990 2000 2005 2010 2015 2020 Design Optimization Small Solar Boiler Cost $/kWe 2500 1600 1100 830 730 630 Large Solar Boiler Cost $/kWe 1350 950 720 600 500 Annual Solar Energy Conversion Efficiency
% 29 32 34 35 36 37
Start-up Time hours TBD Solar O&M O&M Cost ¢/kWh 1.00 0.90 0.75 0.60 0.55 0.50 Staffing Requirement #/MWe 1.00 0.90 0.75 0.60 0.55 0.50 O&M Equipment Wash Rate m2/staff day 10,000 30,000 50,000 50,000 50,000 50,000 Average Cleanliness Factor
0.95 0.95 0.96 0.96 0.96 0.96
Loop Evacuate/Fill hours TBD Time to Align staff hours TBD
199
9 200
0 200
1 200
2 200
3 200
4 200
5 200
6 200
7 200
8 Solar Power Cycle Optimization ISCCS HTF System and Solar Field Rankine Cycle DSG—Multi-loop Demonstration Plant Design Optimization DFMA Computerized Design Standardized Designs ISCCS Small Rankine Large Rankine O&M Design Integration Next-Generation Plant Advanced Generation Plant Plant Information Management Plant Control Systems Maintenance Work Order Advanced Systems Specialized O&M Equipment Mirror Wash HTF Evacuation Alignment Jigs O&M Procedures and Training Operations Maintenance
Development Activities Demonstration Activities
Parabolic-Trough Technology Roadmap January 1999
Page 29
Figure 13. System development activity time line
MARKET DEVELOPMENT
Market development refers to all aspects of marketing and developing solar power projects. Keyareas of focus identified by the workshop participants are the market creation, financing issues,risk reduction, taxation policy, resource assessment, and analysis tools.
MARKET CREATION
Although a number of countries are interested in parabolic-trough technology, no real projects arecurrently under way. Representatives from many countries express interest yet do not have themandate from their government or power market environment to facilitate a real projectopportunity. In this type of environment, many countries are looking for small custom pilotprojects to evaluate. In addition, projects of this type must typically make their way through acomplex maze of government bureaucracy full of potential pitfalls. This type of environment is notconducive to creating a healthy market or providing an environment that will help drive technologyprices to competitive levels.
Ø Market Aggregation
One approach under consideration is to aggregate GEF grant-type projects into a single-project, multiple-build scenario. In essence, this concept would develop three trough projectsin different countries (though, perhaps, in the same region). The projects would be developedand financed as a single package and built in a phased approach. This approach would helpreduce the cost of the projects and allow for lessons learned at one project to be used in thenext.
Ø Solar Power Parks
Although much effort is currently focused on developing the next project, it is important tolook at the long-term market. If trough technologies are to eventually provide a significantcontribution to the global power mix, they will need to be developed in large solar power parkenvironments. Solar power parks offer a number of advantages through economies of scaleand opportunities for continuous builds that can help drive prices down and overall efficiencyup. The current focus should be on identifying the best regions and beginning to develop thepolicies that would enable the power parks to be developed.
FINANCING ISSUES
One of the key issues facing the development of large, grid-connected concentrating solar powertechnologies is the amount of capital resources required to finance projects. If the technology issuccessful, a multibillion-dollar capital market could emerge. As such, it is important tounderstand and address key issues relevant to trough technologies.
Ø Low-Cost Capital
Access to low-cost capital is essential for capital-intensive technologies such as parabolic-trough power plants. Currently, projects require a risk premium on both equity and debt overthe rates charged to conventional power technologies. Efforts must be made to reduce the riskpremium and actively search for low-cost capital that is available to environmentally friendlytechnologies.
Parabolic-Trough Technology Roadmap January 1999
Page 30
Ø Grants
Several grants can be used to buy down the cost of environmentally friendly technologies. TheGlobal Environment Facility,1 as part of its effort to foster technologies that can help mitigategreenhouse gases, is one such opportunity. The European Union's Thermie project providesanother grant opportunity.
Ø Multi-Institutional Financial Facility
Complex mixtures of institutions usually participate in the financing of large power projects.The integration of these participants into a single financing package can have a detrimentalimpact on the amount of time required to achieve financial closure on a project, especiallywhen the project is the first of a kind. The advanced development of a multi-institutionalfinancial facility that would be used to finance a number of parabolic-trough projects couldboth speed the process and reduce the transactional cost of financing each project.
RISK REDUCTION
Risk is a general term used to describe the uncertainties that could have a negative financial impacton a project. Risk can result from uncertainties in cost, schedule, technology, resource availability,power sales, financial parameters, political stability, or location. When a project is beingconsidered, investors (debt and equity) analyze the project to evaluate the financial merit versus therisk. If the risk is high, the financial return must be sufficiently high to justify the potential risk.Thus, increased risk results in increased cost of capital. Unfortunately, projects using newtechnologies and projects in developing countries are usually considered high risk. It is important tominimize project risk whenever possible.
Ø Technology Risk
Technology risk is one of the key barriers to the development of new technologies. Financialinstitutions prefer to take no technology risk when possible and otherwise like to see anytechnology demonstrated for a number of years before investing in it. In place of demonstratedoperating experience, financial institutions like to see a performance guarantee backed by alarge corporation with deep pockets. LUZ, for example, was forced to issue letters of credit tocover potential warranty payments. Future projects will need to develop some approach toensure investor confidence in trough technology. This will likely include some form ofperformance warranty with appropriate backing. One important contribution to reducing riskof future projects is the development of a fund to act as a guarantee for future projects. Otheropportunities for reducing risk include building more conservatism into the design andperformance projections, and using a team with experience from the original SEGS plants.Finally it is important to make sure that all new technologies are sufficiently demonstratedprior to introduction into a commercial project.
Ø Development Risk
1 See World Bank/GEF Operational Program Number 7—Reducing the Long-Term Costs of LowGreenhouse Gas-Emitting Energy Technologies.
Parabolic-Trough Technology Roadmap January 1999
Page 31
Parabolic-trough technologies carry many development risks. First, most market opportunitiesare believed to be in developing countries. These markets often have a large amount of riskbecause of political and or economic instability, currency exchange rates, the state of maturityof their private power industry, and the general issues of international business in a developingcountry. The general trend toward competitive markets is causing another key issue tosurface—the lack of long-term power purchase agreements.
TAXATION POLICIES
In the global marketplace, taxation policies have a significant influence on major investmentdecisions. As a result, taxation policies can indirectly dictate which technologies will succeed. Inthe case of electric generation technologies in the United States, federal, state, and local tax codestend to show a preference for expense-intensive technologies such as conventional fossil-fueledpower plants over capital-intensive technologies such as parabolic-trough power plants. Thespecial tax incentives that existed in the 1980s pushed the spectrum to the other extreme andencouraged the development of the SEGS plants.
There are two general reasons to focus on tax incentives. The first is to encourage the developmentof the technology because it provides special societal values that would not otherwise be addressedby the marketplace. These include the creation of new jobs, energy resource diversification, andpotential environmental benefits. The second reason for special tax incentives is in cases in whichthe current tax code would unfairly penalize a technology compared to another technology thatprovides a similar service.
Many of the special taxation policies that stimulated trough development in the 1980s have beenreduced or eliminated. Federal investment tax credits have been reduced to 10%, although federallaw still allows accelerated depreciation of solar equipment. California state investment tax creditswere eliminated, as was the solar property tax exclusion. As a result, new CSP technologies willpay a higher tax burden than conventional fossil technologies.
Ø Investment and Production Tax Credits
Investment tax credits were a big part of the success of the SEGS projects. Early projectswere largely driven by state and federal investment tax credits that were as high as 55% of thetotal project investment cost. Investment tax credits are intended to encourage the developmentof new technologies. However, in the case of wind power, investment tax credits resulted in alot of tax-driven projects that either operated poorly or never operated at all. As a result,electricity production-based tax credits are being used for wind power technologies today.Given the current levels of investment and production tax credits, solar technologies would bebetter served by switching to the same production-based tax credits that wind technologiescurrently receive.
Ø Solar Property Tax Exemption
At a solar power plant, the solar field can be viewed as a 30-year supply of fuel. Withoutspecial tax exemptions, a solar power plant would be forced to pay property tax on the solarfield land and equipment. This would be equivalent to a conventional plant having to payproperty tax on a 30-year supply of fuel. Because the solar field represents a major portion ofthe total capital cost of the plant, property tax on this equipment represents a significant costpenalty for solar technologies. In the past, California exempted large-scale CSP technologiesfrom paying property tax on solar-related property. In the LUZ projects, this was assumed toinclude all land and equipment except those related to the backup fossil-fired systems. This
Parabolic-Trough Technology Roadmap January 1999
Page 32
means that the conventional part of the steam plant also received the property tax exemptionbecause it was necessary for solar operation. This may give an unfair tax advantage to thesolar plant and thereby penalizes the local government that operates on the income fromproperty taxes. Future efforts may be better served by only asking for the property taxexemption on the "fuel" portion of the solar plant, and not including the conventional system.This approach simplifies the issue, especially when considering large hybrid systems that havesmall solar contributions.
Ø Sales Tax Exemption
This exemption is similar to the property tax exemption. Because fossil fuels do not pay salestaxes, solar equipment should be exempted from sales tax. Paying sales tax on the solarproperty is comparable to a fossil plant having to pay sales tax on a 30-year fuel supply upfront, while the plant is under construction. A property tax exemption on solar equipmentwould allow solar technologies to compete with fossil technologies.
RESOURCE ASSESSMENT
Access to high-quality direct normal insolation (DNI) data is essential for deploying parabolic-trough plants. Generally, there is either no measured solar resource data or only limited dataavailable for most promising international locations. The desired format and accuracy of the DNIdata depends on the stage of a project's development. For scoping studies, which look at thefeasibility of a technology in a specific region, maps that show average daily DNI totals for eachmonth and on an annual basis (+/-15% accuracy) are probably sufficient. For prefeasibilitystudies, hourly DNI data sets (+/-10% accuracy) are necessary. For feasibility and design studies,hourly or smaller time increment data (+/-5%) are needed, with some accounting for potential inter-annual variability.
Ø High-Resolution DNI Maps and Data
NREL's Renewable Energy Resources group has generated a number of DNI and cloud covermaps for many promising locations (see Figure 14). These maps have proven to be veryvaluable to industry. This effort should be expanded to complete DNI maps for all promisingregions and to utilize new higher-resolution satellite data to increase spatial and temporalresolution of the maps.
Ø Meteorological Data Generator
Given the limited ground measurement data available and the time required for collecting arepresentative data set (7–10 years), it is desirable to have the ability to create an hourly DNIdata set for any given location. The same data used to generate the DNI maps could be used tocreate hourly data sets.
Ø Standard Meteorological Site Instrumentation
In most cases, it will be desirable to install some form of DNI, temperature, and windmeasurement instrumentation at a site to verify the meteorological data prior to installation of aplant. Standardized designs, equipment, procedures, and Quality and Assurance processesshould be developed and used.
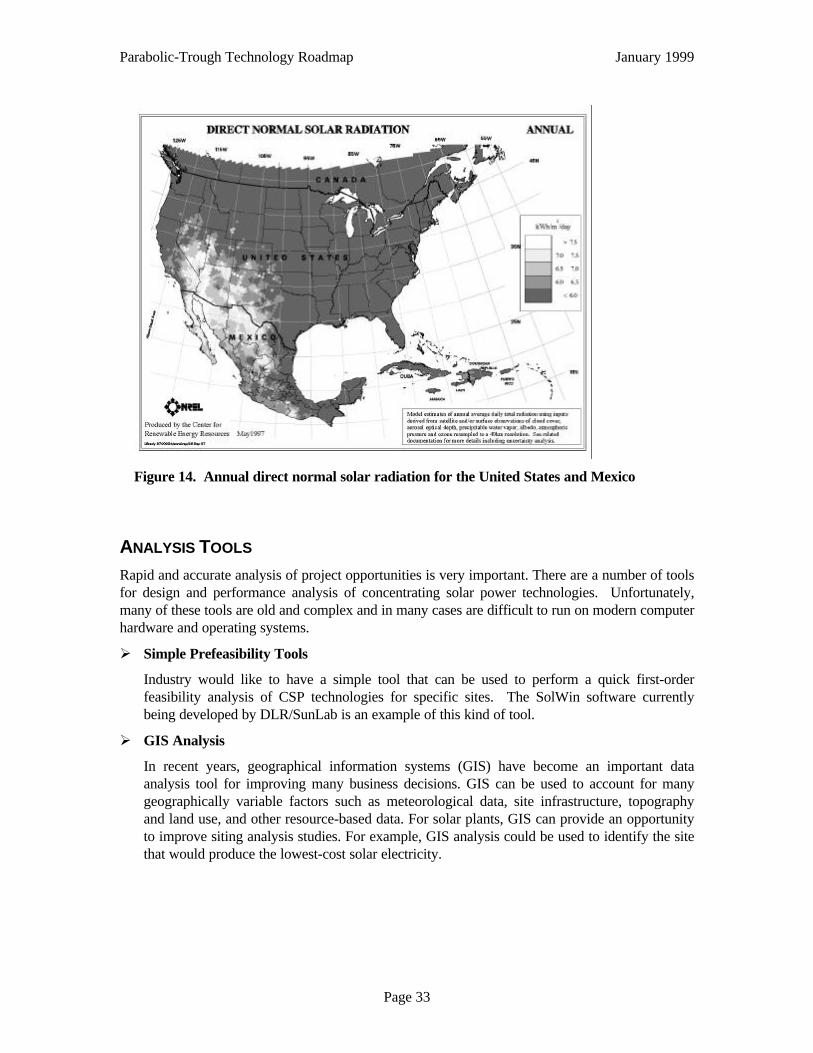
Parabolic-Trough Technology Roadmap January 1999
Page 33
ANALYSIS TOOLS
Rapid and accurate analysis of project opportunities is very important. There are a number of toolsfor design and performance analysis of concentrating solar power technologies. Unfortunately,many of these tools are old and complex and in many cases are difficult to run on modern computerhardware and operating systems.
Ø Simple Prefeasibility Tools
Industry would like to have a simple tool that can be used to perform a quick first-orderfeasibility analysis of CSP technologies for specific sites. The SolWin software currentlybeing developed by DLR/SunLab is an example of this kind of tool.
Ø GIS Analysis
In recent years, geographical information systems (GIS) have become an important dataanalysis tool for improving many business decisions. GIS can be used to account for manygeographically variable factors such as meteorological data, site infrastructure, topographyand land use, and other resource-based data. For solar plants, GIS can provide an opportunityto improve siting analysis studies. For example, GIS analysis could be used to identify the sitethat would produce the lowest-cost solar electricity.
Figure 14. Annual direct normal solar radiation for the United States and Mexico
Parabolic-Trough Technology Roadmap January 1999
Page 34
ROADMAP INITIATIVES
WHAT NEXT?
Opportunities exist now for major advancements in the deployment of trough technology, based onbold steps on technology, system, and market development fronts. The technology has beencommercially successful in early deployment; global environmental issues remain a strong concern,favoring renewable energy systems; and international demand for new power generation haschanged the nature of power system implementation. Three initiatives have been initially identifiedto help implement this roadmap and move trough technology forward.
Ø Near-Term Trough Development
The United States is uniquely positioned to play a key role in the future development of troughtechnologies as a result of the experience and expertise gained at the current SEGS plants. AU.S. trough R&D initiative could be used to expand U.S. industry involvement in worldwidetrough deployments and to help advance the state of the technology. The specific objectives ofthe U.S. trough R&D initiative are:
• Bring industry together to form a trough consortium that will aggressively pursueprojects. Given the high up-front cost of power plant development, most companies arecurrently not willing to make the investment necessary on their own to push troughdevelopment forward. Although many look for the next "LUZ" to come forward todevelop the next project, power plant development today may require an integrated supplyand development consortium to share the risk of building new power plants. This initiativewould encourage the development of a formalized parabolic-trough supply consortium thatcould supply trough power plants.
• Provide a mechanism for continued development of trough technology that supports theneeds of industry. Although the EuroTrough project is focusing on developing the next-generation tough collector, there is much research and development that needs to be doneto advance the current state of the art in parabolic-trough technology to support the nexttrough plants built. Given the high-risk nature of future trough development, mostcompanies are currently not willing to invest significant amounts of money to advance thestate of the technology. The USA Trough initiative will provide seed money to encouragedevelopment activities necessary to support the next trough plants built. Many lessonshave been learned from the existing SEGS plants, which can improve the next plants built.This initiative would focus on those lessons and make sure they are applied in the nexttrough plants built.
• Increase U.S. content of domestic and international trough projects. Although currenttrough plant designs utilize mirrors from Germany (Pilkington) and receiver tubes fromIsrael (SOLEL), the majority of system cost (over 75%) comes from other sources. Forthe next plants built, the mirrors and receiver tubes would most likely come from thosesame sources. U.S. companies could provide much of the remaining system for domesticprojects, and even a significant portion for international projects. However, for this tooccur, U.S. industry must be an active participant in future developments, otherwise otherinternational firms are likely to take their place. This initiative would also focus on
Parabolic-Trough Technology Roadmap January 1999
Page 35
increasing the U.S. scope and supply of trough power plants for both domestic andinternational projects.
• Provide a mechanism for U.S. companies to collaborate with Europeans, Israelis, andothers to promote development of international trough projects. Currently, a number ofinternational companies are working to advance the state of parabolic-trough collectortechnology. In many cases, this work has proceeded along divergent paths, which couldlead to confusion and inefficient use of limited resources. The participants in the troughworkshop felt that strengthened collaborations between all parties could allow for a morefocused and unified plan with the greatest chance of success. As such, the USA Troughproject should include collaborations with the EuroTrough group and the Israeli firm thatcontinues to advance the state of the LUZ trough technology. Possibly more importantly,these collaborations should also include activities that focus on the development ofinternational trough project opportunities.
Ø Strategic Alliances and Market Awareness
Although parabolic-trough technology represents the most successful and lowest-cost solarpower technology available today and for the foreseeable future, it has limited stakeholdersupport from the renewable community, and is often portrayed as a dated technology with noplace in the evolving power environment. Although the participants in the parabolic-troughworkshop believe that many of these perceptions are incorrect, it is clear that these issues needto be addressed and efforts need to be made to better understand the potential and the benefitsof parabolic-trough technology. Unfortunately, these are not simple issues to sort out.
One approach being considered is to convene a new workshop that would address many of themarket-related issues and barriers that are hindering the deployment of parabolic troughs andother CSP technologies. Key stakeholders and experts would be brought together to help createa vision and a plan to carry trough development forward.
The specific objectives of the workshop would be to:
• Look for opportunities to encourage the development of solar power markets bothdomestically and abroad
• Look for opportunities to address financing and taxation issues
• Develop a new vision for trough power and provide a mechanism for disseminatinginformation to key stakeholders.
Those at SunLab believe that parabolic-trough technology represents the lowest-cost near-termoption for solar power. Support for trough technology today could help pave the way forother, less mature technologies such as power towers and dish/engine systems to be morereadily accepted in the future.
Ø SEGS Collaborations
The existing SEGS facilities provide an important showcase for trough technology that isimportant for future trough development. In addition, access to O&M experience at theseplants provides SunLab a unique opportunity to observe how real commercial systems andcomponents perform after extended operation. A strategic opportunity exists forcollaborations between SunLab and the existing SEGS facilities. This will allow thelaboratories to gain a better understanding of system performance, reliability, and cost, andthe existing facilities to benefit from the technical experience and capabilities of SunLab.
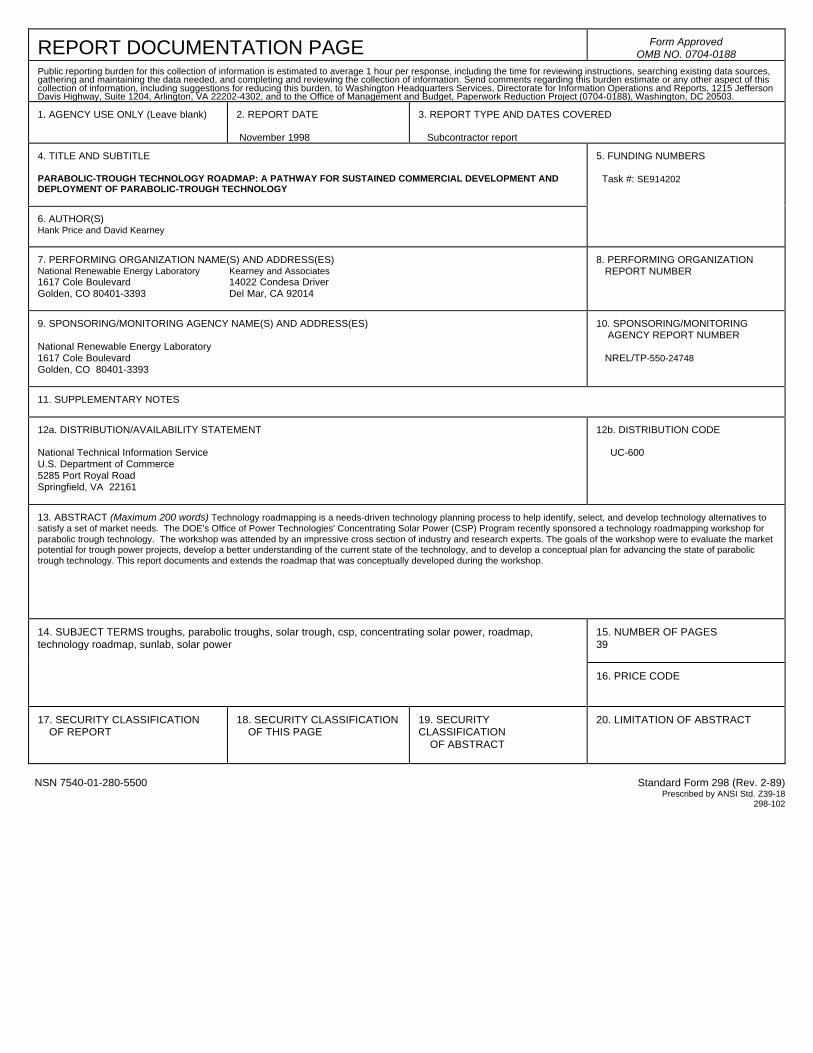
REPORT DOCUMENTATION PAGE Form ApprovedOMB NO. 0704-0188
Public reporting burden for this collection of information is estimated to average 1 hour per response, including the time for reviewing instructions, searching existing data sources,gathering and maintaining the data needed, and completing and reviewing the collection of information. Send comments regarding this burden estimate or any other aspect of thiscollection of information, including suggestions for reducing this burden, to Washington Headquarters Services, Directorate for Information Operations and Reports, 1215 JeffersonDavis Highway, Suite 1204, Arlington, VA 22202-4302, and to the Office of Management and Budget, Paperwork Reduction Project (0704-0188), Washington, DC 20503.
1. AGENCY USE ONLY (Leave blank) 2. REPORT DATE
November 1998
3. REPORT TYPE AND DATES COVERED
Subcontractor report
4. TITLE AND SUBTITLE
PARABOLIC-TROUGH TECHNOLOGY ROADMAP: A PATHWAY FOR SUSTAINED COMMERCIAL DEVELOPMENT ANDDEPLOYMENT OF PARABOLIC-TROUGH TECHNOLOGY
6. AUTHOR(S)Hank Price and David Kearney
5. FUNDING NUMBERS
Task #: SE914202
7. PERFORMING ORGANIZATION NAME(S) AND ADDRESS(ES)National Renewable Energy Laboratory Kearney and Associates1617 Cole Boulevard 14022 Condesa DriverGolden, CO 80401-3393 Del Mar, CA 92014
8. PERFORMING ORGANIZATION REPORT NUMBER
9. SPONSORING/MONITORING AGENCY NAME(S) AND ADDRESS(ES)
National Renewable Energy Laboratory1617 Cole BoulevardGolden, CO 80401-3393
10. SPONSORING/MONITORING AGENCY REPORT NUMBER
NREL/TP-550-24748
11. SUPPLEMENTARY NOTES
12a. DISTRIBUTION/AVAILABILITY STATEMENT
National Technical Information ServiceU.S. Department of Commerce5285 Port Royal RoadSpringfield, VA 22161
12b. DISTRIBUTION CODE
UC-600
13. ABSTRACT (Maximum 200 words) Technology roadmapping is a needs-driven technology planning process to help identify, select, and develop technology alternatives tosatisfy a set of market needs. The DOE's Office of Power Technologies' Concentrating Solar Power (CSP) Program recently sponsored a technology roadmapping workshop forparabolic trough technology. The workshop was attended by an impressive cross section of industry and research experts. The goals of the workshop were to evaluate the marketpotential for trough power projects, develop a better understanding of the current state of the technology, and to develop a conceptual plan for advancing the state of parabolictrough technology. This report documents and extends the roadmap that was conceptually developed during the workshop.
15. NUMBER OF PAGES39
14. SUBJECT TERMS troughs, parabolic troughs, solar trough, csp, concentrating solar power, roadmap,technology roadmap, sunlab, solar power
16. PRICE CODE
17. SECURITY CLASSIFICATION OF REPORT
18. SECURITY CLASSIFICATION OF THIS PAGE
19. SECURITYCLASSIFICATION OF ABSTRACT
20. LIMITATION OF ABSTRACT
NSN 7540-01-280-5500 Standard Form 298 (Rev. 2-89)Prescribed by ANSI Std. Z39-18
298-102