outline -- 2007 long-term care plan
TRANSCRIPT

Connecticut Long-Term Care Planning Committee
___________________________________________
Balancing the System:
Working Toward Real Choice for Long-Term Services and Supports in Connecticut
A Report to the General Assembly
January 2013

Balancing the System:
Working Toward Real Choice for Long-Term Services and Supports in Connecticut
A Report to the General Assembly
January 2013
TABLE OF CONTENTS
I. EXECUTIVE SUMMARY .............................................................................................................. 1
A. Balancing the System ............................................................................................................ 1
B. Facts and Trends.................................................................................................................... 4 C. What’s New in Connecticut .................................................................................................. 5
D. Goals, Recommendations and Action Steps ....................................................................... 12 E. Development and Implementation of the Plan .................................................................... 18 A. Vision .................................................................................................................................. 20
B. Mission ................................................................................................................................ 20 C. Principles Governing the System of Long-Term Services and Supports ............................ 20
III. LONG-TERM SERVICES AND SUPPORTS IN CONNECTICUT .................................................... 21
A. The People........................................................................................................................... 21 B. Long-Term Services and Supports ...................................................................................... 25
C. Financing ............................................................................................................................. 36
IV. FUTURE DEMAND FOR LONG-TERM SERVICES AND SUPPORTS ........................................... 43
A. Population and Disability Trends ........................................................................................ 43 B. Demand for Long-Term Services and Supports .................................................................. 45
C. Caregiver Supply and Demand ........................................................................................... 48
V. GOALS AND RECOMMENDATIONS ........................................................................................ 51
A. Introduction ......................................................................................................................... 51
B. Goals.................................................................................................................................... 52 C. Long-Term Recommendations ............................................................................................. 56 D. Short-Term Recommendations ............................................................................................ 57
VI. CONCLUSIONS ......................................................................................................................... 62
ii
Appendices
A. Authorizing Statute for the Long-Term Care Planning Committee and the Long-Term Care Advisory Council
B. Long-Term Care Planning Committee Membership
C. Long-Term Care Advisory Council Membership
D. Sources of Public Comment
E. Long-Term Services and Supports Planning Efforts
F. Status Report: 2010 Long-Term Care Plan for Connecticut, June 2012
G. State Long-Term Services and Supports Programs and Expenditures – SFY 2011-2012
iii
ACKNOWLEDGEMENTS Many individuals and organizations provided invaluable assistance in the development of this Plan. Thanks to all the members of the Long-Term Care Planning Committee for their efforts. In addition, appreciation is extended to the members of the Long-Term Care Advisory Council who worked in partnership with the Planning Committee to enhance the quality of this Plan. Thanks also to all the individuals and organizations that took the time to review drafts of the Plan throughout its development and provided helpful recommendations and advice.
1
I. EXECUTIVE SUMMARY
A. Balancing the System
People of all ages and from all socio-economic, racial and ethnic backgrounds need long-term services and supports (LTSS). They are our parents, siblings, children, co-workers and neighbors. Whether challenged with limitations due to injuries, developmental disabilities, mental illness, chronic health conditions, or the aging process, they all share a common need for support in order to live, work and play. LTSS are needed to help people carry out basic functions such as eating, dressing or bathing, the tasks necessary for independent community living, such as shopping, managing finances and house cleaning and the tasks necessary to lead a normal life, such as work and recreation. Likewise, needs range from minimal personal assistance with basic activities to virtually total care. These needs for LTSS are being met at home, in the community, in congregate residences and in institutional settings. This Long-Term Services and Supports Plan (Plan) addresses the needs for LTSS of the citizens of Connecticut. Developed by the Long-Term Care Planning Committee in collaboration with the Long-Term Care Advisory Council, this Plan was produced to educate and provide recommendations to policymakers regarding what steps Connecticut should initiate and continue to take in order to achieve a balanced and person-centered LTSS system over time through 2025. It is Connecticut’s goal to establish a LTSS system that offers individuals the services and supports of their choice in the least restrictive and most enhancing setting. This means providing real choices to Connecticut residents regarding the types of supports that they need and requires a system that is person-focused and driven. To reach this goal, Connecticut must first address the fact that the LTSS system is out of balance. As in the 2010 Plan, the 2013 Plan is committed to balancing the LTSS system in terms of the ratio of home and community-based and institutional care and the ratio of public and private resources. By balancing the ratio of community-based and institutional services, what is meant is not a system with an equal split between community and institutional services. Instead, a more balanced system in Connecticut would meet the 2025 goal of 75 percent of individuals receiving Medicaid LTSS in the community and 25 percent receiving LTSS in institutions. Central to achieving this balance is a commitment to independence and choice for all individuals seeking services and supports. Towards this end, this new Plan continues to address the development and maintenance of a person-centered system of LTSS across the lifespan and across all disabilities with the focus on informed choice, least restrictive and most enhancing setting, and community inclusion.

2
Three years have passed since the last Plan and much has changed to improve Connecticut’s LTSS system, yet there is more to be done. Changes in policy and funding on the federal and state level have fostered progress in creating a balanced LTSS system in Connecticut. Despite this progress and the many highlights which are described later in this Executive Summary, Connecticut’s LTSS system still faces the same rules, barriers and challenges that were in place three years ago. To address these challenges, the Plan centers around two central themes.
1. Long-Term Services and Supports Affects Everyone
LTSS will affect all of us at some point in our lives. Whether it is because we need services and supports ourselves, or we are providing care for someone in need, regardless of age, health or wealth, it is unlikely that we will be able to escape the issue. In keeping with this theme, this Plan is designed to address the current and future needs of all individuals in need of LTSS, regardless of their age or disability. This is the fourth Plan developed by the Long-Term Care Planning Committee under the Committee’s expanded mandate to go beyond the needs of older adults and address the system as a whole, encompassing all individuals with disabilities and their families. Therefore, all of the recommendations and action steps put forward in this Plan apply to individuals of all ages and disabilities, unless specifically noted. While we recognize that certain populations have not received the equal footing they deserve in terms of attention and resources in LTSS planning and program development, we have deliberately been inclusive in our recommendations and have not segmented out certain groups of individuals or disabilities. This strategy is designed to break down some of the barriers experienced by individuals with certain disabilities and promote a philosophy that is person-centered and focused on the needs of individuals and their families. It is important to note that not only will virtually everyone be touched by the LTSS system at some point in their lives, but improvements in this system also benefit society at large. For example, addressing the shortage of LTSS workers also addresses the need for health professionals in other settings, and improving access to public transportation benefits everyone, not only individuals with disabilities. Accordingly, the critical terms used in this Plan are defined as follows: Long-term services and supports (LTSS) refer to a broad range of paid and unpaid
services for persons who need assistance due to a physical, cognitive or mental disability or condition. LTSS consist largely of personal assistance with the routine tasks of life as well as additional activities necessary for living independently at home, at work, at school and at recreational activities. Unlike medical care where the goal is to cure or control an illness, the goal of LTSS is to allow an individual to

3
attain and maintain the highest reasonable level of functioning in the course of everyday activities and to contribute to independent living.
Home and community-based care encompasses home care, adult day care, respite, community housing options, transportation, personal assistants, assistive technology and employment services.
Institutional care includes nursing facilities, intermediate care facilities for people with mental retardation (ICF/MRs), psychiatric hospitals, and chronic disease hospitals.
2. The Current System Is Out of Balance
Connecticut’s LTSS system has many positive elements and great strides have been made in providing real choices and options for older adults and individuals with disabilities. Despite these gains, the system is still fundamentally out of balance in two important areas.
Balancing the Ratio of Home and Community-Based and Institutional Care
In order to provide real choices to individuals and families there needs to be equal access to community and institutional care, regardless of age and disability. While there are several sources of payment for LTSS, Medicaid is by far the largest payer and therefore is the focus of this discussion. Traditionally, in Connecticut and nationwide, Medicaid has made access to institutional care easier than home and community-based care. Largely, this is a result of federal Medicaid rules and regulations. Consequently, the ratio between care and supports provided in the home and community and those provided in institutions has consistently been out of balance and skewed towards institutional care. It is important to note that while the Medicaid program provides a critical benchmark for the balancing of the LTSS system, there are other important sources of funding for LTSS in Connecticut. For example, the mental health system is substantially funded with state dollars, and the Department of Developmental Services (DDS) provides many services for individuals with intellectual disability with State funds. Also, a number of services for older adults are funded through the federal Older Americans Act. Programs and services funded by other sources are discussed when relevant and appropriate throughout this Plan. In order to realize the Vision and Mission provided in Section II of this Plan, Connecticut must continue its efforts not only to balance the mix between home and community-based and institutional care, but must strive for a system that provides more options for home and community-based care so that individuals with disabilities and their families have real choices and control over the services and supports they receive. Institutional care plays a vital role in the continuum of LTSS. However, Connecticut should develop a system whereby individuals enter institutions by choice and not because the necessary and reasonable supports are unavailable for them to live in the community.

4
In addition, the LTSS system must provide support to the network of informal caregivers and ensure the recruitment and retention of formal caregivers, whose respective roles are essential, complementary and form the backbone of the LTSS system. This will become increasingly critical as the number of individuals receiving home and community-based care increases over the next several decades.
Balancing the Ratio of Public and Private Resources
The second area of imbalance involves the resources spent on LTSS. The need for LTSS is one of the most complex and difficult issues for individuals and families to understand and discuss. Many people are under the false impression that Medicare, and other health insurance programs, will cover their LTSS needs. This misunderstanding, coupled with the fact that most individuals understandably would rather not face, or discuss, the possibility of becoming disabled and dependent, leads most people to do little or no planning for their future LTSS costs. The lack of Medicare and health insurance coverage for LTSS, combined with high costs of care, accessibility of affordable long-term care insurance policies and the lack of planning, has created a LTSS financing system that is overly reliant on the Medicaid program. Medicaid, by default, has become the primary public program for LTSS. However, in order to access Medicaid, individuals must first impoverish themselves. Therefore, we have a system that requires individuals to spend all their savings first in order to receive government support for their ongoing needs. If our current system continues unchanged, not only will we experience more and more impoverishment as increasing numbers of Connecticut residents need LTSS, but the Medicaid safety net will start to erode. The financing of our LTSS system must be based on a balanced public/private alliance that stresses personal responsibility for those who can afford it coupled with the necessary obligation of government to provide supports for those who lack the resources to meet their needs.
B. Facts and Trends
People of all ages and from all socio-economic, racial and ethnic backgrounds need LTSS.
Disabilities affect 10.4 percent of all Connecticut residents – 367,557 individuals in 2010. (See page 21)
It is estimated that 69 percent of 65 year olds will need LTSS as they age: 79 percent for women and 58 percent for men. On average, they will need three years of LTSS. (See page 21)
Home and community-based services (HCBS) help people with LTSS needs stay in their homes and communities while reducing LTSS spending. States that have expanded their Medicaid home and community-based services programs require

5
increases in short term spending, followed by a reduction in institutional spending and long-term cost savings. (See page 39)
Medicaid pays the majority of LTSS expenses. In Connecticut, in state fiscal year (SFY) 2012, Medicaid LTSS expenses accounted for 14 percent of the state budget and 47 percent of the Medicaid budget. (See page 38)
C. What’s New in Connecticut
Some of the major changes that have been made to the system of LTSS in Connecticut in the last three years are described below (also see Appendix F). Although significant progress has been made in improving choice, opportunities for self-direction, community inclusion and access to community-based services, many inequities remain in access to services and many individuals have unmet needs for LTSS. More is needed if we are to meet our goals for achieving real choice and truly balancing the LTSS system.
Progress in Meeting the Balancing Goals
This Plan advocates that by providing more choices for those with LTSS needs and assuring access to needed services, by 2025 the Connecticut Medicaid program should be serving 75 percent of LTSS clients in home and community-based settings1, with only 25 percent choosing institutional care2. The proportion of Medicaid LTSS clients receiving services in the community has increased from 46 percent in SFY 2003 to 56 percent in SFY 2012. Slowly, but surely, the Connecticut Medicaid program is moving in the right direction and meeting the Long-Term Services and Supports Plan’s target of one percent increase a year.
With regard to public spending on LTSS, between SFY 2003 and SFY 2012 the proportion of Medicaid LTSS expenditures received in the community increased by 10 percent, rising from 31 percent to 41 percent of all Medicaid LTSS expenditures – an average increase of one percent per year. Likewise, there was a 10 percent decrease in the proportion of expenditures for LTSS provided in institutional settings. Overall, total Medicaid LTSS expenditures increased by approximately 45 percent between SFY 2003 and SFY 2012 ($1.914 billion to $2.770 billion).
Long-Term Services and Supports Scorecard for Connecticut
As part of a national survey, a State Long-Term Services and Supports Scorecard based on the experience of older adults and people with physical disabilities (a subset of the population using LTSS) was published by AARP in 2011. Connecticut received an overall
1 The Medicaid long-term care community services include home health services, hospice, home and
community based waiver programs, and targeted case management for mental health and developmental
disabilities.
2 The Medicaid long-term care institutional services include nursing facilities, hospice, intermediate care
facilities for persons with developmental disabilities (ICF/MRs), and chronic disease hospitals.

6
ranking of 11 among all the 50 states in the country. The score card looks at four areas of measurement, with each number ranking the state among all 50 states:
1) Affordability and access (CT = 8);
2) Choice of setting and provider (CT = 25);
3) Quality of life and quality of care (CT = 17); and
4) Support for family caregivers (CT = 20).
Money Follows the Person Rebalancing Demonstration
The Money Follows the Person (MFP) Rebalancing Demonstration, which began operation in December 2008, has been a leading force in Connecticut’s efforts to rebalance the system of LTSS to reflect consumer needs and choice. The program, located within the Department of Social Services (DSS), serves Medicaid eligible individuals across the age span with physical disabilities, mental illness and intellectual and cognitive disabilities. Under MFP, as of October 30, 2012, a total of 1,253 individuals have been transitioned from a nursing facility to community living. Connecticut has established five rebalancing benchmarks under MFP that are aligned with the goals of the Long-Term Services and Supports Plan:
1. Transition 5,200 people from institutions to the community.
2. Increase dollars to home and community-based services.
3. Increase hospital discharges to the community rather than to institutions.
4. Increase the probability of returning to the community during the six months following nursing home admission.
5. Increase the percentage of LTSS participants living in the community compared to an institution.
Progress in meeting these benchmarks is monitored through ongoing evaluations by the University of Connecticut Center on Aging at http://www.uconn-aging.uchc.edu/money_follows_the_person_demonstation_evaluation_reports.html.
MFP has also worked to advance the principle of informed risk. In June 2011, the MFP program, in collaboration with the Department of Public Health (DPH) and the Home Health Services Legislative Work Group, convened Connecticut's first statewide conference on "Informed Risk When Choosing Community Based Long Term Care Services and Supports," which was followed by regional meetings.
Long-Term Services and Supports Rightsizing Initiative
The Rightsizing Initiative, under the direction of the MFP Rebalancing Demonstration, was developed to respond to the projected rapid growth in the need for community-based LTSS over the next 10 to 15 years in Connecticut.
Public Act 11-242, Sections 83 & 84

7
DSS is mandated to develop a strategic plan, consistent with the State’s long-term care plan, to rebalance the Medicaid LTSS system. In developing the plan, DSS must include providers representing in-home, institutional, and community settings and may contract with nursing facilities and home and community-based providers to implement the Plan. The new law permits DSS to waive DPH codes regulating nursing facilities, residential care homes, and assisted living service agencies if (1) a regulated provider requires such a waiver to carry out the strategic plan and (2) the DSS commissioner determines that the waiver will not endanger the health or safety of the provider’s residents or clients. The new law exempts from the general Certificate of Need moratorium on new nursing facility beds those beds relocated to a new facility to meet priority needs identified in the strategic plan.
Rightsizing Strategic Plan The Rightsizing Plan, Rebalancing Long-Term Services and Supports, expected to be released by DSS in January 2013, is the result of a multi-month process of stakeholder briefings, engagement, and data and systems analysis. It also meets the requirements of Public Act 11-242, which requires DSS to develop a strategic plan, consistent with this LTSS Plan, to rebalance the Medicaid LTSS system. According to the most recent draft of the Rightsizing Plan: By 2025, more than 48,000 individuals in Connecticut are expected to need
Medicaid LTSS – an increase of more than 8,000 individuals over current levels. The ratio of clients receiving Medicaid home and community-based and
institutional services is expected to shift from 56%/44% respectively in SFY 2012 to 76%/24% by 2025.
Currently, the key initiative driving these results is the Money Follows the Person Rebalancing Initiative.
Rightsizing Grants DSS, in partnership with the Department of Economic and Community Development (DECD), is developing a request for proposals for the planning and implementation of LTSS rightsizing initiatives for which nursing facilities, in conjunction with community partners, may apply. For SFY 2013, $13 million in funding is available for these grants: $3 million in federal funding and $10 million in state bond funds.
Aging in Place
As mandated by Special Act 12-6, a task force was established in August 2012 to study how the state can encourage “aging in place.” This study will examine (1) infrastructure and transportation improvements, (2) zoning changes to facilitate home care, (3) enhanced nutrition programs and delivery options, (4) improved fraud and abuse protections, (5) expansion of home health care options, (6) tax incentives, and (7) incentives for private insurance. Findings and recommendations are due to the legislature by January 1, 2013.
8
Home and Community-Based Services Programs
Mental Health Transition Services The Department of Mental Health and Addiction Services (DMHAS) has implemented two programs: (1) the Nursing Home Diversion and Transition (NHDT) Program, which strives to keep clients out of nursing facilities and in the community with a variety of supportive services; and (2) the Mental Health Home and Community-Based Services Waiver, which is one of only three in the country. Both programs collaborate with the Money Follows the Person (MFP) Demonstration Grant. The NHDT Program is working with several Area Agencies on Aging around specific clients who have mental health and/or substance abuse problems.
Employment and Day Supports Medicaid Waiver This new Medicaid waiver developed by DDS and approved by the Centers for Medicare and Medicaid Services (CMS) began on April 1, 2011 and supports individuals who live with family or in their own homes and have a strong natural support system. The funding cap for this waiver is $28,000 per person annually.
Nursing Facilities
Moratorium The moratorium on new nursing facility beds was extended from June 30, 2012 until June 30, 2016.3 DSS continues to analyze and monitor the need for beds. Several methods are used to reduce unneeded capacity such as de-licensing or reclassifying beds.
Nursing Facility Closures
According to the Connecticut Annual Nursing Facility Census Survey, there were a total of nine nursing facilities in the state that closed since the last LTSS Plan (2010 – 2012)4. As of September 30, 2012, there were 232 licensed nursing facilities in the State.
Workforce
The MFP Workforce Development Workgroup developed the Long-Term Care Workforce Strategic Plan to support expansion of 9,000 additional LTSS workers by 2016. $300,000 per year is available to fund the plan. A partnership has been established with the Workforce Investment Boards. http://www.cga.ct.gov/coa/pdfs/publications/2012/workforce%20plan%202.27.12.pdf
3 Public Act 12-118
4 State of Connecticut Annual Nursing Facility Census, Office of Policy and Management, Policy
Development and Planning Division, 2012
9
Executive Order #10 issued by Governor Dannel Malloy called for the creation of a Personal Care Attendant Quality Home Care Workforce Council charged with ensuring the quality of long-term personal home care. The Council, which began meeting in December 2011, was required to study issues relating to the recruitment and retention of personal care attendants and to develop a plan and make recommendations to the Commissioner of Social Services to improve the quality, stability and availability of personal care attendants. http://www.governor.ct.gov/malloy/cwp/view.asp?a=3997&q=499272
Executive Order #10 also called for the creation of a Personal Care Attendant Working Group charged with the task to “…make recommendations on the best ways to structure collective bargaining rights and relationship for designated majority representative of personal care attendants to enable such representatives to collectively bargain the terms and conditions of the participation of personal care attendants in the PCA waiver programs.” The final report was delivered to Governor Malloy on February 15, 2012: Personal Care Attendant Working Group Final Report, http://www.governor.ct.gov/malloy/cwp/view.asp?a=3997&q=499270.
Public Act 12-33 allows personal care attendants (PCAs) to collectively bargain with the State through an employee organization (i.e. a union) over reimbursement rates, benefits, payment procedures, contract grievance arbitration, training, professional development, and other requirements and opportunities.
Transportation
Wheelchair accessible taxis were introduced this year in Hartford, New Haven, and Bridgeport. Taxi services can be used to meet urgent transportation needs without making a reservation and are usually less expensive than wheelchair accessible livery services.
Taxi voucher programs are now available in Hartford, New Haven, Bridgeport, and eastern Connecticut. The voucher program extends beyond the Americans with Disabilities Act (ADA) paratransit service area and hours by providing a pre-paid taxi voucher card at a 50% reduced price to people defined as having a disability under the ADA regulations. The voucher may be used for taxi trips that go beyond the ADA service area, during times that ADA paratransit is not available and for same day service 24 hours per day, seven days per week.
Local bus service at night began in Waterbury in the fall of 2012. Service in Waterbury ended at 6 P.M. for many years, but has been expanded until midnight through a financial partnership with the local community college.
10
State Government
A Department on Aging is to be established on January 1, 2013. In 2005, the legislature reestablished the department effective January 1, 2007, and has delayed the implementation for the last six years.
On July 1, 2012, the Department of Rehabilitation Services (DORS) was created as established by Public Act 11-44 and Public Act 12-1, June Special Session. DORS brings together the programs formerly known as the DSS Bureau of Rehabilitation Services, the Board of Education and Services for the Blind, the Commission on the Deaf and Hearing Impaired, the Workers’ Rehabilitation Program, and the driver Training Program for People with Disabilities.
Federal Government
In April 2012, the federal Administration for Community Living (ACL) was established within the Department of Health and Human Services (www.hhs.gov/acl). This new organization combines the efforts and achievements of the Administration on Aging, the Office on Disability and the Administration on Developmental Disabilities in a single agency with the goal of increasing access to community supports and full participation, while focusing attention and resources on the unique needs of older Americans and people with disabilities.
To address coverage gaps in long-term care, the federal Affordable Care Act (ACA) established a national, voluntary insurance program entitled the Community Living Assistance Services and Supports (CLASS) program. CLASS was designed to expand options for working adults who become functionally disabled and require LTSS. Adults who meet eligibility criteria would receive a cash benefit that could be used to purchase community-based services and supports and other LTSS. The Department of Health and Human Services determined that the CLASS program could not be self-sustaining, as required by the ACA, and, therefore has not implemented the CLASS program.
The ACA passed into law in March 2010 contains several provisions that encourage states to expand Medicaid home and community-based options:
o Extends the Money Follows the Person (MFP) demonstration program through
FFY 2016. MFP provides states with an enhanced federal medical assistance percentage (FMAP) for 12 months for each Medicaid beneficiary transitioned from an institution to the community during the demonstration period. The law also shortens the period of time during which participants must reside in an institutional setting before being eligible to transition into a community setting—from six months to 90 days. The number of transitions anticipated under Connecticut’s MFP program has been increased to reflect these changes.

11
o Creates the State Balancing Incentive Program (BIP) that provides enhanced federal matching payments to states that increase the proportion of Medicaid LTSS dollars going toward home and community-based services. In December 2012, Connecticut was awarded over $72 million from 2013 through 2015 based on an enhanced federal match rate of two percent for non-institutional LTSS. Under this agreement, Connecticut will develop and strengthen a no wrong door/ single entry point system, conflict free case management services, and a core standardized assessment instrument.
o Establishes the Community First Choice Option to provide statewide home and
community-based attendant supports and services to individuals with incomes up to 300% of Supplemental Security Income (SSI) who require an institutional level of care. States electing this state plan option will receive an FMAP increase of six percentage points for these services.
o Makes improvements to the home and community-based services state plan
option (under section 1915(i) of the Social Security Act) by expanding the set of covered services, covering individuals with higher levels of need, and allowing states to extend full Medicaid benefits to individuals receiving home and community-based services.
o In a proposed settlement of a nationwide class-action lawsuit in October 2012, the federal government agreed to stop a practice that required many Medicare beneficiaries to show a likelihood of medical or functional improvement before Medicare would pay for skilled nursing and therapy services in someone’s home. Under the agreement, Medicare will pay for such services if they are needed to maintain the patient’s current condition or prevent or slow further deterioration, regardless of whether the patient’s condition is expected to improve. This does not change the fact that Medicare does not pay for long-term services and supports and an individual must continue to have a documented need for skilled health care in order to be eligible for Medicare coverage of home health services. The settlement also does not change Medicare’s rules regarding skilled nursing facility care which require the individual to need daily skilled care and limits Medicare’s benefit to no more than 100 days per episode of care.
Other State Plans Addressing Long-Term Services and Supports
State Plan on Aging: October 1, 2010 – September 30, 2013 http://www.nasuad.org/documentation/tasc/state%20plans/Connecticut%20State%20Plan.pdf
Aging and Disability Resource Centers (ADRC) Five Year Plan – Goal of statewide coverage. http://www.ct.gov/agingservices/lib/agingservices/pdf/connecticutaoaadrcstatewideplan042711.pdf

12
2010-15 Consolidated Plan for Housing and Community Development - http://www.ct.gov/ecd/lib/ecd/housing_plans/2010-15_cp_-_hud_approved.pdf
2011-2012 Action Plan for Housing and Community Development, July 5, 2011 - http://www.ct.gov/ecd/lib/ecd/housing_plans/final_action_plan.pdf
D. Goals, Recommendations and Action Steps
The goals and recommendations provided in this Plan are put forward to improve the balance of the system of LTSS in Connecticut for individuals of all ages and across all types of disabilities and their families. In addition to two rebalancing goals, this Plan provides a set of long-term and short-term recommendations. The long-term recommendations provide a high level view of the essential components of a well-balanced and person-centered system of LTSS. These recommendations are reflective of a system of services and supports, and as such, must be viewed as both interrelated and interdependent. The short-term recommendations reflect strategic priorities identified for action over the next three years (2013-2015). In 2005, a broad philosophical statement was enacted in Connecticut statute to guide policy and budget decisions. It states “that Connecticut’s long-term care plan and policy must provide that individuals with long-term care needs have the option to choose and receive long-term care and support in the least restrictive, appropriate setting.” This simple statement, designed to make real choices for individuals a reality, provides a larger framework for Connecticut upon which the Plan goals and recommendations rest. Overall, the recommendations in this Plan are primarily focused on initiatives State government can undertake. While the focus of this Plan is on State government, it is important to recognize the vital role that cities, towns, the private sector and individuals and families play in the LTSS system. Government at all levels must work in partnership with individuals, families and the private sector in order to develop a quality and effective system.
Goals
1. Balance the ratio of home and community-based and institutional care:
Develop a system that provides for more choice and opportunities for community integration as alternatives to all institutional settings, and increases the proportion of individuals receiving Medicaid long-term home and community-based care from 56 percent in 2012 to 75 percent by 2025, requiring approximately a 1.4 percent increase in the proportion of individuals receiving Medicaid long-term services and supports in the community every year.

13
2. Balance the ratio of public and private resources:
Increase the proportion of costs for long-term services and supports covered by private insurance and other dedicated sources of private funds to 25 percent by 2025. Such an increase in private insurance and other sources of private funding would reduce the burden both on Medicaid and on individuals’ out-of-pocket expenses. Nationally, private insurance (long-term care and other health insurance) represented 11.6 percent of spending for long-term services and supports in 2010.5
Long-Term Recommendations
Optimally, a robust system of LTSS that is able to maximize autonomy, choice and dignity will provide a full range of services and supports. Individuals, regardless of disability or age, should have the options that allow them to live their lives as meaningfully and productively as possible in the settings that best suit their needs and preferences, in the least restrictive environment. As in any system, all the constituent parts are interrelated and interdependent. In order to meet the growing demand for LTSS and the goals set forth in this plan, investment in the community-based infrastructure is critical. Over the long term, to realize the vision and achieve the goals set out in this plan, actions must be taken on the following fronts:
Provide true individual choice and self-direction to all users of long-term services
and supports.
Promote efforts to enhance quality of life in various long-term services and
supports settings.
Ensure the availability of a wide array of support services for those living in the
community, including meals and adult day care.
Ensure quality of long-term services and supports in the context of a flexible and
person-centered service delivery system that acknowledges the dignity of risk.
Achieve greater integration and uniformity of administration of State long-term
services and supports serving both older adults and people with disabilities and
their families, and emphasize policies related to function as opposed to age or
diagnosis.
Encourage communities to take an active role in planning and supporting long-term services and supports for their residents.
5 “Other dedicated sources of private funds” means private long-term care insurance, other types of private
insurance and other private spending for nursing facilities and home health services. It does not include
“out-of-pocket” spending or informal care. Source: National Health Policy Forum; The Basics: National
Spending for Long-Term Services and Supports; George Washington University; February 23, 2012.

14
Address the long-term services and supports education and information needs of
the Connecticut public, including specialized educational efforts to specific
groups, such as baby boomers and employers.
Address the anticipated long-term services and supports workforce shortage.
Provide support to informal caregivers.
Preserve and expand affordable and accessible housing for older adults and
individuals with disabilities, including assisted living, residential care homes, and
other supportive housing and emergency housing options for older adults.
Encourage and enable the provider community to transform and develop
services and supports that will help to achieve the goals of this Plan.
Expand and improve employment opportunities and vocational rehabilitation for
persons with disabilities and older adults.
Increase availability of readily accessible, affordable, and inclusive transportation
that accommodates the need for family and direct care worker companions.
Improve quality of life and reduce utilization of long-term services and supports
and health care services by focusing on health promotion and disease
prevention.
Address emergency preparedness/disaster planning for older adults and persons with disabilities.
Short-Term Recommendations
These short-term recommendations provide an action agenda for improving the system of long-term services and supports in Connecticut in the three years spanning 2013 through 2015. Criteria for proposing these targeted priority recommendations are that they will help to ensure the success of the system of long-term services and supports and can be acted upon in the next three years.
Programs and Services
Adequately support and increase the number of slots of all the existing Medicaid home and community-based services waivers to meet the needs of all eligible applicants.

15
In the State-funded tiers of the Connecticut Home Care Program for Elders, eliminate the required co-payment.
Identify skills needed for nursing facility residents who desire to transition back to the community and provide appropriate skill training and resources.
Expand funding for State-funded respite services, such as the Statewide Respite Program, the state-funded tiers of the Connecticut Home Care Program for Elders and the Department of Developmental Services in-home and out-of-home respite services in order to provide support to informal caregivers.
Support family caregivers through compensation with the development of the new Adult Family Living initiative.
Address isolation of all older adults and individuals with disabilities living in the community. Also, address the impact of isolation on elder abuse and exploitation.
Strengthen the connection of State and local services by strengthening the relationship to senior centers, municipal government offices and services offered locally.
Infrastructure
Achieve greater integration of and uniformity of administration of State long-term services and supports serving both older adults and people with disabilities and their families, and emphasize policies related to function as opposed to age or diagnosis.
Under the Balancing Incentive Program (BIP), create the BIP infrastructure investments of a consumer friendly statewide No Wrong Door system, a conflict free case management, and a uniform assessment tool.
With a focus upon hospital admission and discharge, use best efforts to divert individuals to an appropriate care setting of their choice.
Address the historical fragmentation of the Medicaid home and community-based
waivers, which are associated with specific age and diagnostic eligibility criteria.
o Explore the development of a broader 1915(i) State plan amendment to provide home and community-based supports based exclusively on functional limitations and financial need.
Provide timely eligibility decisions regarding eligibility in all government sponsored long-term services and supports programs.

16
Expand Aging and Disability Resource Centers (Community Choices) statewide in support of providing information, referral, assistance and LTSS options counseling.
Achieve greater integration of employment of persons with disabilities into the Money Follows the Person Rebalancing Initiative and home and community-based services.
Support improved coordination, communication and guidance among the medical care, behavioral health and long-term services and supports systems.
o Ensure that current and future initiatives such as Money Follows the Person,
Rightsizing, and the Demonstration to Integrate Care for Medicare-Medicaid
Enrollees (MMEs) are well coordinated and complementary.
o Support the development of electronic health records by providers of long-
term services and supports and exchange of electronic health records among
providers across the Connecticut health care system to streamline care
transitions, coordinate care delivery and improve quality and outcomes.
o Support a learning collaborative approach to bring together providers across
disciplines and perspectives, and to learn from older adults and individuals
with disabilities.
Change the names of the Long Term Care Planning Committee and the Long Term Care Advisory Council to the Long Term Services and Supports Planning Committee and the Long Term Services and Supports Advisory Council.
Financing
Achieve adequate and sustainable provider reimbursement levels that support the
cost of long-term services and supports and quality requirements for all segments of
the long-term services and supports continuum in order to ensure capacity to meet
the evolving needs and demographics of Connecticut residents.
Provide greater flexibility in the budgeting and use of Medicaid funds for long-term
services and supports.
Capture and reinvest cost savings across the long-term services and supports
continuum.
o Reinvest savings resulting from Money Follows the Person, the Balancing
Incentive Program and other emerging Medicaid long-term services and

17
supports programs to enhance the availability and capacity of home and
community based services.
Reform the Medicaid rate setting system to reflect quality, reimbursement related
to the actual costs of care, and uncompensated care for all LTSS providers across the
continuum consistent with long-term services and supports rebalancing, rightsizing
and a range of home and community based service initiatives.
Explore various methods to increase the private sector's greater involvement as a
payer of long-term services and supports.
o Explore the development of tax incentives for the purchase of private long-
term care insurance, including tax incentives for employer-based coverage.
Work with the Federal government to preserve Older Americans Act funding. This
federal funding source is currently at risk.
Quality
Enable a collaborative, flexible and efficient regulatory environment that is adaptive
and receptive to individual provider’s forward thinking ideas and planning. Such an
environment would encourage providers of the long-term services and supports
continuum to adjust, modernize and diversify their models of care to address
current and future consumer needs and expectations, which in turn should lead to
higher quality care.
The Departments of Public Health and Social Services should work together to ensure consistency among their respective regulations.
Review licensing certification requirements and Probate Court protocols (currently there is no licensing for conservators or guardians) for training of community-based formal caregivers, conservators and guardians to assure that the specialized needs of the individual, such as those with Alzheimer’s disease, are met and provide training where there are gaps.
Expand the scope of the Long-Term Care Ombudsman program to provide Ombudsman support to consumers receiving long-term services and supports regardless of setting in order to align the program with Medicaid LTSS rebalancing efforts. Additional appropriations to the Long-Term Care Ombudsman program would be necessary to expand beyond their current jurisdiction.

18
Housing
Support programs that divert or transition individuals from nursing facilities or other
institutions to community housing options.
Address the community housing needs of nursing facility residents who are
returning to the community because they no longer need this level of care but have
lost their community residence.
Develop new housing alternatives for persons with serious and persistent mental
illness who do not need nursing facility level of care.
Support legislation that requires new homes to provide features to make it easier for
individuals with mobility-impairments to live in and visit.
Continue the progressive State investment in the development of housing that is
affordable and accessible for older adults and persons with disabilities.
Encourage the growth and development of community- based service models that
bring long- term services and supports to housing residents. Work with the federal
government to secure at-risk housing subsidy, preservation, and development funds.
Workforce
Endorse the full recommendations of the Long-Term Services and Supports
Workforce Development Strategic Plan.
http://www.cga.ct.gov/coa/pdfs/publications/2012/workforce%20plan%202.27.12.
E. Development and Implementation of the Plan
Development
The Long-Term Care Planning Committee, created under Public Act 98-239, is charged with developing for the General Assembly a long-term care plan for Connecticut every three years. Committee membership is comprised of representatives of nine State agencies and the Chairs and Ranking Members of the General Assembly’s Human Services, Public Health and Aging Committees (see Appendix B for a list of Planning Committee members). The Long-Term Care Advisory Council, created under Public Act 98-239, composed of providers, consumers and advocates, provides advice and recommendations to the Planning Committee (see Appendix C for a list of Advisory Council members). In 2012, the Long-Term Care Planning Committee embarked on the development of its sixth long-term care plan in partnership with the Advisory Council. The Advisory Council

19
worked with the Planning Committee in four essential areas: providing data, identifying areas of need, developing recommendations, and obtaining public input. The Advisory Council assisted the Planning Committee with gathering broad public input on the draft Plan from diverse organizations and individuals throughout Connecticut with an interest in LTSS. Public comment was solicited twice: on the draft recommendation in July and August of 2012 and the full Plan in October and November of 2012. (See Appendix D – Sources of Public Comment).
Implementation
To implement the majority of the recommendations and action steps included in this Plan, the Governor and General Assembly will need to make decisions regarding statutory changes and allocation of resources. For those items that the Governor and the General Assembly choose to pursue, the State agencies represented on the Planning Committee, in collaboration with the Long-Term Care Advisory Council, will work together to implement those recommendations and action steps. For those aspects of the Plan that do not require legislative changes or allocation, or reallocation, of resources, the State agencies represented on the Planning Committee, in collaboration with the Long-Term Care Advisory Council, will work together to address these items and periodically review their progress. In addition, annually, from 2013 through 2016, the Long-Term Care Planning Committee will choose to focus on several strategic priorities among the short term recommendations based on: 1) timeliness; 2) readiness for implementation or change; 3) availability of funding; and 4) need for coordination with other entities or programs.
20
II. VISION, MISSION AND GOVERNING PRINCIPLES
The Long-Term Care Planning Committee developed and continues to refine its Vision, Mission and Governing Principles to guide the development of its Long-Term Services and Supports (LTSS) Plan and recommendations for enhancing the system of LTSS in Connecticut. They provide a philosophical framework that values choice, person-centered care, and a seamless continuum of services and supports for all individuals in need of LTSS, regardless of disability and across the lifespan of fluctuating needs.
A. Vision
Connecticut residents have access to a full range of high-quality LTSS that maximize autonomy, choice and dignity.
B. Mission
To provide guidance for the development of a comprehensive system of community-based and institutional LTSS options. Such a system should promote access to affordable, high-quality, cost-effective services and supports that are delivered in the most integrated, life-enhancing setting.
C. Principles Governing the System of Long-Term Services and Supports
The system must:
1. Provide equal access to home and community-based care and institutional care.
2. Assure that people have control and choice with respect to their own lives.
3. Be adequately financed and structured to assure that decision-making and service delivery are based on the needs of the individuals and families served and on the needs of employees who provide care and services.
4. Deliver services in a culturally competent manner to meet the needs of a diverse population.
5. Assure that individuals have meaningful rights and protections.
6. Include an information component to educate individuals about available services and financing options.
7. Assure mechanisms for integration with related services and systems including acute medical care, housing and transportation services.
8. Include a prevention component to educate individuals regarding actions that can be taken to reduce the chances of needing long-term services and supports.
9. Include a strong independent advocacy component for those in need.
10. Include meaningful consumer input at all levels of system planning and implementation.

21
III. LONG-TERM SERVICES AND SUPPORTS IN CONNECTICUT
A. The People
People of all ages and from all socio-economic, racial and ethnic backgrounds need long-term services and supports (LTSS). They are our parents, siblings, children, co-workers, veterans and neighbors. They are us. Whether challenged with limitations due to injuries, developmental disabilities, mental illness, chronic health conditions, or the aging process, they all share a common need for assistance in order to live, learn, work and play. Assistance may be needed to carry out basic functions such as eating, dressing or bathing (activities of daily living -- ADLs) or tasks necessary for independent community living, such as shopping, managing finances and house cleaning (instrumental activities of daily living -- IADLs). Likewise, needs range from minimal personal assistance with basic activities to virtually total care. These LTSS needs are being met at home, in the community, at work, in congregate residences and in institutional settings. It is important to note that LTSS is different from medical care. The major distinction is that the goal of LTSS is to allow an individual to attain and maintain an optimal level of functioning in everyday living. The goal of medical care is to cure or control an illness.
A Word about the Data
Currently, there is no single source of information on the need for LTSS among individuals with disabling chronic illness and conditions in Connecticut. There is also no one source of information that looks at needs across the lifespan or across types of disabilities. In order to develop a picture of the need for LTSS in Connecticut, regardless of disability, limitation or age, a broad array of sources has been consulted. Complicating our understanding of who needs LTSS is the fact that there is no single accepted definition of disability or way of defining the need for LTSS. Research findings vary from study to study depending on how the population in need is defined and whether the focus is on individuals with disabilities in general or those with LTSS needs specifically. Disability, which is most commonly defined in terms of long-standing limitations in tasks and activities, is used in this Plan as a measure for the need for LTSS, unless otherwise specified, although it is acknowledged that not everyone with a disability will need supports at any given time. Much of the data on disability in Connecticut used in this Plan is drawn from the U.S. Census Bureau 2010 American Community Survey (ACS). In this survey, disability is defined as “the product of interactions among individuals’ bodies; their physical, emotional, and mental health; and the physical and social environment in which they live, work, or play. Disability exists where this interaction results in limitations of

22
TABLE 1
Number of Persons with Disabilities in Connecticut by Age, 2010
Age Total
Population
Persons
with a Disability Percentage
<5 201,685 757 0.4%
5 to 17 613,325 27,975 4.6% 18 to 34 730,132 31,506 4.3%
35 to 64 1,489,946 147,834 9.9%
65 to 74 255,172 53,565 21.0%
75+ 229,653 105,920 46.1%
Total 3,519,913 367,557 10.4%
Source: U.S. Census Bureau, 2010 American Community Survey, One Year Estimates, Connecticut, Custom Table from B18101
activities and restrictions to full participation at school, at work, at home, or in the community.” The ACS uses six disability items to determine an individual’s disability status: 1) hearing difficulty, 2) vision difficulty, 3) cognitive difficulty, 4) ambulatory difficulty, 5) self care difficulty, and 6) independent living difficulty.6 It should be noted that the numbers of individuals with psychiatric disabilities in Connecticut may be undercounted in the ACS.
Who Needs Long-Term Services and Supports?
National Perspective
Approximately 12 million people, or about 4 percent of the total U.S. population, are in need of some level of LTSS. In the community, about 10 to 11 million people, or 4 percent, need help with one or more ADLs or IADLs; roughly 4.7 million, or almost 2 percent, need help with ADLs; and about 3.2 million need help with two or more ADLs. Although older adults are proportionally much more likely than younger people to need long-term services and supports, approximately half of the individuals living in the community needing help with one or more ADLs or IADLs are non elderly.7 Among older adults, it is estimated that 69 percent of 65 year olds will need LTSS as they age: 79 percent for women and 58 percent for men. On average, they will need three years of LTSS. Although over 30 percent of people age 65 will not need LTSS, 17 percent will need up to one year; 12 percent will need from one to two years; 20 percent will need from two to five years; and 20 percent will need 5 years or more.8
Connecticut
Disabilities affect 10.4 percent of Connecticut residents, lower
6 U.S. Census Bureau, American Community Survey, 2010 Subject Definitions, pages 56-59.
http://www.census.gov/acs/www/Downloads/data_documentation/SubjectDefinitions/2010_ACSSubjectDe
finitions.pdf 7 H. Stephen Kay, Charlene Harrington, and Mitchell P. LaPlante; Long-Term Care: Who Gets It, Who
Providers It, Who Pays, and How Much?; Health Affairs, Vol. 29:1; January 2010; pages 11-21. 8 Peter Kemper et al, “Long-Term Care Over an Uncertain Future: What Can Current Retirees Expect?,
Inquiry 42, no. 2 (Winter 2005/2006): 335-350.

23
than the national average of 11.9 percent.9 In 2010, there were 367,557 individuals living in Connecticut with some type of long-lasting condition or disability (Table 1). Disability rates rise with age, with 3.5 percent of children and youth under age 18
9 U.S. Census Bureau, 2010 American Community Survey, Selected Social Characteristics (U.S. DP02 and
Connecticut B18101). Data includes individuals living in households and group quarters and exclude the
population living in institutions. The American Community Survey, which samples housing units and their
occupants, provides Census data every year instead of once in ten years.
69%49% 46% 39%
34%51% 54% 61%
Under 18 18 to 64 65 to 74 75+
FIGURE 3 Proportion of Individuals with
Disabilities by Age and Gender, 2010
Male Female
Source: U.S. Census Bureau, American Community Survey, Connecticut, 2010

24
reporting a disability, 8.1 percent of adults age 18 to 64, and 32.9 percent of older adults age 65 and over (Figure 1a). Although the largest proportion of the Connecticut population with a disability is found among those ages 65 and over (Figure 1a), 49 percent of the total numbers of persons with a disability are adults between the ages of 21 and 64 (Figure 1b and 2). Among individuals with disabilities, the ratio of males to females shifts as the population ages, as is the case in the general population. Among children and youth with disabilities, 69 percent are males. By the senior years, this proportion is reversed, with females comprising 61 percent of those with disabilities age 75 and older (Figure 3).
Source: U.S. Census, 2010 American Community Survey, Connecticut, Table S1810: Disability Characteristics
The distribution of types of disabilities in the population varies considerably by age (Figure 4). The proportion of individuals with disabilities increases with age, affecting less than one percent of children under age five and steadily rising to 33 percent of adults age 65 and older. Among individuals in the 5 to 17 year old group, the greatest reported difficulty is cognitive (3.3 percent). Among adults age 18 to 64, the greatest difficulty is ambulatory (4.0 percent) followed by cognitive (3.5 percent). Among individuals age 65 and older, ambulatory difficulties are most prevalent (19.8 percent) followed by independent living difficulties (14.4 percent). Cognitive difficulties were experienced by the same proportion of individuals in the 5 to 17 and the 18 to 65 age
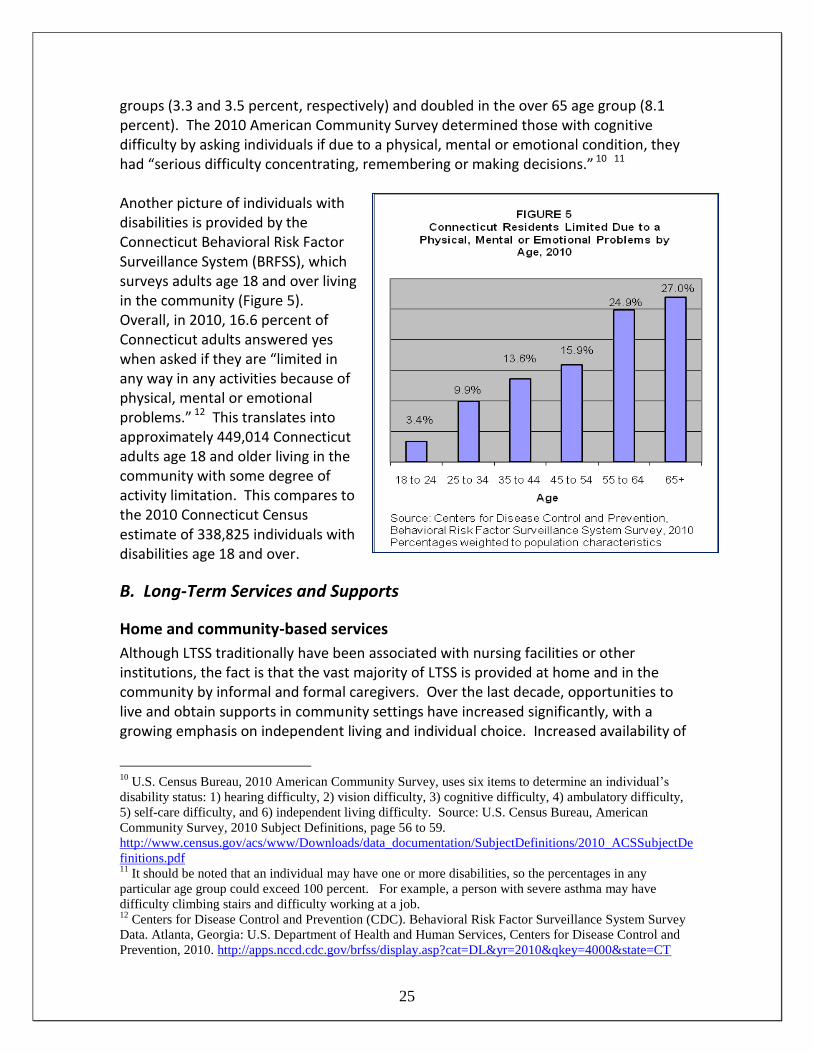
25
groups (3.3 and 3.5 percent, respectively) and doubled in the over 65 age group (8.1 percent). The 2010 American Community Survey determined those with cognitive difficulty by asking individuals if due to a physical, mental or emotional condition, they had “serious difficulty concentrating, remembering or making decisions.” 10 11 Another picture of individuals with disabilities is provided by the Connecticut Behavioral Risk Factor Surveillance System (BRFSS), which surveys adults age 18 and over living in the community (Figure 5). Overall, in 2010, 16.6 percent of Connecticut adults answered yes when asked if they are “limited in any way in any activities because of physical, mental or emotional problems.” 12 This translates into approximately 449,014 Connecticut adults age 18 and older living in the community with some degree of activity limitation. This compares to the 2010 Connecticut Census estimate of 338,825 individuals with disabilities age 18 and over.
B. Long-Term Services and Supports
Home and community-based services
Although LTSS traditionally have been associated with nursing facilities or other institutions, the fact is that the vast majority of LTSS is provided at home and in the community by informal and formal caregivers. Over the last decade, opportunities to live and obtain supports in community settings have increased significantly, with a growing emphasis on independent living and individual choice. Increased availability of
10
U.S. Census Bureau, 2010 American Community Survey, uses six items to determine an individual’s
disability status: 1) hearing difficulty, 2) vision difficulty, 3) cognitive difficulty, 4) ambulatory difficulty,
5) self-care difficulty, and 6) independent living difficulty. Source: U.S. Census Bureau, American
Community Survey, 2010 Subject Definitions, page 56 to 59.
http://www.census.gov/acs/www/Downloads/data_documentation/SubjectDefinitions/2010_ACSSubjectDe
finitions.pdf 11
It should be noted that an individual may have one or more disabilities, so the percentages in any
particular age group could exceed 100 percent. For example, a person with severe asthma may have
difficulty climbing stairs and difficulty working at a job. 12
Centers for Disease Control and Prevention (CDC). Behavioral Risk Factor Surveillance System Survey
Data. Atlanta, Georgia: U.S. Department of Health and Human Services, Centers for Disease Control and
Prevention, 2010. http://apps.nccd.cdc.gov/brfss/display.asp?cat=DL&yr=2010&qkey=4000&state=CT

26
Source: National Assoc. for Home Care and Hospice, Basic
Statistics about Home Care, Updated 2010, Appendix A, Fig. 2.
home and personal care supports have allowed greater numbers of individuals to remain in their homes and avoid or delay moving to an institutional setting. Home and community-based care includes a range of varied services and supports provided either formally by paid individuals or informally by family and friends. Typically, the level of formal support used increases with age, functional impairment and income. In addition to private homes, community settings can include adult day care, assisted living, residential care homes, continuing care retirement communities, small group homes and congregate housing.
Home Care Services
In the U.S., approximately 33,000 home care providers delivered care to an estimated 12 million individuals who required services due to acute illness, long-term health conditions, permanent disability, or terminal illness. Of these agencies, 10,580 were Medicare certified in 2009.13 Nationally, 80 percent of home health care costs incurred in 2009 were covered by government payers (federal, state and local). Medicare paid the largest share of skilled home care costs, covering 41 percent of the total payments. Private sources, including private insurance and out-of-pocket payment, represented 20 percent of payments (Figure 6). It is important to note that home health care represents only a portion of home care services and generally addresses more medically oriented needs. In Connecticut, paid home care services are provided by home health care agencies, homemaker-home health aide agencies, homemaker-companion agencies, and privately hired caregivers. Home health care agencies, which are licensed by DPH, provide care in the home
that is typically prescribed by an individual's physician as part of a written plan of
13
National Association for Home Care and Hospice, Basic Statistics About Home Care, Updated 2010.

27
care. These agencies offer skilled nursing, home health aide services, physical therapy, occupational therapy, speech therapy, and hospice services. Non-medical services include helping individuals with activities of daily living such as bathing, dressing and eating; assistance with cooking, cleaning, and other housekeeping jobs; and managing medications. Although home health care may include some non-medical home care services such as homemakers and companions, home health care is more medically oriented, helping individuals recover from an illness or injury. Home health care agencies, unlike homemaker-home health aide agencies and homemaker-companion agencies, may be eligible for Medicare reimbursement. As of June 30, 2012, there were 101 agencies licensed by DPH to provide home health care services in Connecticut.14
Homemaker-home health aide agencies, which are licensed by DPH, are similar to
homemaker-companion agencies in that they provide non-medical assistance to individuals. In addition, they have the authority to provide training programs and competency evaluations for home health aides. As of June 30, 2012, there were 7 licensed agencies in Connecticut.15
Homemaker-companion agencies provide non-medical assistance to persons with
disabilities and older adults and must be registered with the Department of Consumer Protection. Tasks generally include grocery shopping, meal preparation, laundry, light housekeeping and transportation to appointments. As of June 30, 2012, there were 375 registered homemaker-companion agencies active in Connecticut.16
Privately hired caregivers often provide personal care and are hired directly by an
individual in need of support. The individual who hires them is the employer and is responsible for paying for unemployment, social security, workers compensation, taxes and liability insurance.
Adult Day Care
Adult day services are an option for frail older adults who want to remain in their homes. They provide respite to family caregivers as well as therapeutic care for cognitive and physically impaired older adults. Health, personal care and social services are provided to adults who do not need the continuous services of a nursing facility or institutional setting and are able to leave their homes. Individuals receive professional services ranging from social activities and therapeutic recreation to nursing care and rehabilitation services, representing a blend of traditional health and social services.17
14
Connecticut Department of Public Health, 2012. 15
Connecticut Department of Public Health, 2012. 16
Connecticut Department of Consumer Protection, 2012. 17
The Connecticut Association of Adult Day Centers, http://canpa.memberclicks.net/adult-day-centers ,
April 2012.

28
Adult day care centers are not regulated by DPH. Instead, the Connecticut Association of Adult Day Centers (CAADC) is authorized by DSS to provide a program of peer review and certification, which is required in order for an adult day center to receive State funds. As of July 2012, there were 48 adult day centers certified by CAADC serving people who receive State assistance.18
Public Home and Community-Based Programs - Medicaid Waivers and State-Funded Programs
An array of Medicaid and State-funded programs has been developed in Connecticut to address the need for LTSS for those living at home or in other community settings. Medicaid, through its home and community-based waiver programs, is the major public financing mechanism for providing LTSS in community settings. Under both Medicaid and State-funded programs, individuals who would otherwise require the level of care provided in an institutional setting are served in the community. Most people express a strong preference for home and community-based services over institutional care since it allows them to live in their own homes, participate in community life and exert more control over their own affairs.19 For Ages 65 and Older Connecticut Home Care Program for Elders (CHCPE): provides home and community-based services to frail older adults age 65 and over as an alternative to nursing facility admission. The program has a Medicaid waiver as well as State-funded component. A no waiting list policy was established in 1997. 1. Medicaid Elder Waiver: constitutes the Medicaid portion of the CHCPE. On June 30,
2012, it provided community-based services to 10,437 older adults age 65 and older, who would otherwise be institutionalized. Available services include adult day care, homemaker, companion, chore, home delivered meals, emergency response systems, care management, home health, skilled nursing, respite, assisted living and minor home modifications. The monthly average number of participants for SFY 2012 was 10,345.
2. State-Funded CHCPE: constitutes the State-funded portion of the CHCPE and
provides the same services as the Medicaid Elder Waiver except that plans of care are capped at lower levels. The program serves adults age 65 and older with higher income and asset levels than permitted under the Waiver portion. The program will also cover individuals with fewer needs than under the Medicaid Elder Waiver. The monthly average number of participants for SFY 2012 was 4,262.
18
The Connecticut Association of Adult Day Centers, http://canpa.memberclicks.net/adult-day-centers,
July 2012. 19
Teresa A. Keenan, Ph.D., Home and Community Preferences of the 45+ Population, AARP, 2010

29
For Ages 18 to 64
Connecticut Home Care Program for Disabled Adults (CHCPDA): is a state-funded pilot program that provides services based upon the CHCPE model. The program serves up to 50 individuals age 18 to 64 with degenerative, neurological conditions who are not eligible for other programs and who need case management and other supportive services. On June 30, 2012, there were 50 people enrolled. Medicaid Acquired Brain Injury Waiver: provides 19 specific behavioral and support services to persons between the ages of 18 and 64 with acquired brain injury. The monthly average number of participants during SFY 2012 was 398. Medicaid Personal Care Assistance Services (PCA) Waiver: provides personal care services to persons with physical disabilities who are age 18 to 64 years of age. In this person directed program, participants hire and direct their own care. The monthly average number of participants during SFY 2012 was 829.
For All Ages DDS Individual and Family Support (IFS) Waiver: provides in-home, day, vocational and family supports services for people who live in their own or family home. In SFY 2012, the monthly average number of participants was 3,940. DDS Comprehensive Supports Waiver: provides for the vocational and in-home services needed for people who need a more intensive level of support to remain in their own family home. These services are delivered in licensed settings (community living arrangements, community companion homes and assisted living) and include residential and family support services, vocational and day services and specialized and support services. In SFY 2012, the monthly average number of participants was 4,733. DDS Employment and Day Supports (EDS) Waiver: provides support to individuals who live with family or in their own homes and have a strong natural support system. This includes children under the age of 21 with complex medical needs who would otherwise require institutional placement and individuals over the age of 18 who require career development, supported employment or community-based day supports, respite, and/or behavioral supports to remain in their own or their family home. In SFY 2012, the monthly average number of participants was 125. Mental Health Waiver: administered by the Department of Mental Health and Addictions Services, this program diverts people with serious mental illness from nursing facilities and works to discharge those who no longer need to live in a nursing facility. The program began on April 1, 2009. As of June 30, 2012, there were 109 individuals enrolled and using waiver services.

30
For Children Medicaid Katie Beckett Waiver: offers case management and home health services primarily to disabled children who would normally only qualify for Medicaid in an institution. The waiver itself offers only case management services, but the families have access to full Medicaid benefits, including home health and physical therapy. The program operates within available appropriations. The number of participants as of June 30, 2012 was 198.
State Long-Term Care Programs
In addition to the programs listed above, there are a wide range of LTSS that support individuals with disabilities and chronic health conditions that are funded or operated by State agencies. A description of these State agencies can be found in Appendix G as well as charts describing State LTSS programs, their eligibility requirements and participants and program expenditures.
Municipal, Non-Profit, Private Sector and Volunteer Services
In addition to the State programs, a wide array of statewide, regional and local long-term services and supports exist throughout Connecticut that are administered by government agencies, non-profit and for-profit organizations, as well as volunteer groups. Each city and town provides services and accommodations to address the needs of older adults and persons with disabilities. Connecticut has five regional Centers for Independent Living, five Area Agencies on Aging, and a number of statewide and local mental health councils and advisory councils for persons with disabilities. There is also the Corporation for Independent Living, which is a non-profit partner focused on new housing initiatives for persons with disabilities. Also indispensable to the system of care are the myriad of volunteer organizations that address the needs of individuals with specific chronic illnesses and conditions, providing support and companionship that foster “sustainable” independent living.
Community Housing Options
A number of housing options with LTSS are available in Connecticut, enabling individuals with LTSS needs the opportunity to avoid entering an institution. Residential housing is considered community living, where the goal is to provide an environment where people can live with maximum independence and minimum restrictions. In fostering choice, self-determination, independence and community integration, it is important to assure that residential housing is community-based and not institutional. In distinguishing between residential and institutional settings, five aspects can be considered: 1) residential scale and characteristics; 2) privacy; 3) autonomy, choice and

31
control within the residential settings; 4) integration with the greater community; and 5) resident control over moving to, remaining in, or leaving the setting.20 The community housing options described below all provide some common meals, housekeeping, and some degree of personal services, but vary with respect to the extent and range of services and staffing provided, the types of accommodations available, and requirements for residency.
Congregate Housing
Congregate housing provides frail older adults with private living arrangements, moderate supportive services, and common areas of dining, socialization and other activities. These facilities furnish at least one daily meal, which is usually included in the monthly fee, housekeeping services and a variety of social and recreational activities.
20
Rosalie A. Kane et al, Community-Based Residential Care Settings as Rebalancing Vehicles: State
Strategies to Make Them More like Home than like Institutions, Submitted to the Division of Advocacy and
Special Programs, Centers for Medicare and Medicaid Services, August 2008, page 7.
TABLE 2 Community Housing Options in Connecticut, June 30, 2012
# Facilities
# Units/ Beds/ Residents
Age
State Funded Congregate Housing
24 984 residents 62 and older
Managed Residential Communities (Assisted Living)
111 N/A Adults and older adults
Residential Care Homes
101 2,763 beds Adults and older adults
Continuing Care Retirement Communities
19 N/A Older adults
Nursing Facilities
232 27,611 beds (as of 9/30/12)
All ages
Source: Office of Policy and Management, 2012

32
They are generally meant for individuals who are basically self-sufficient but need a few services to help them to live independently. As of June 30, 2012, 984 people age 62 and over lived in 24 State-funded congregate housing facilities in Connecticut. Residents were all low-income and had a minimum of one ADL limitation. Beginning in 2001, DECD and DSS introduced assisted living services within State-funded congregate housing facilities. Twelve of the 24 congregate facilities are participating in this service expansion. As of June 30, 2012, 149 congregate housing residents were actively enrolled in the assisted living program. Throughout the year, more than 209 residents were served under this program. 21
Assisted Living Services/ Managed Residential Communities
Assisted Living Services Agencies (ALSAs) are an alternative for older adults who need assistance with activities of daily living (e.g. bathing, dressing), but who do not require the intensive medical and nursing care provided in a nursing facility. In Connecticut, ALSAs are licensed to provide assisted living services in managed residential communities (MRCs). Assisted living services can be provided in a number of different settings, such as continuing care retirement communities or elderly housing, as long as the facility provides the services to qualify as a MRC. Services provided by the MRC include laundry, transportation, housekeeping, meals, and recreational activities. Individuals choosing to live in an MRC may purchase LTSS from the ALSA allowing them to live in their own apartment. Primarily, assisted living services in the MRC are available to individuals age 55 and older. As of June 30, 2012, there were 83 ALSAs licensed in Connecticut providing services in 111 managed residential facilities.22 Since the cost of living in a MRC and the assisted living services purchased are virtually all paid out of pocket, these community living arrangements are available to individuals who can afford the cost of both room and board and services. Through a collaborative effort of DECD, DPH, OPM and DSS, Connecticut has made assisted living services available to lower-income individuals through the Assisted Living Demonstration Project, State-funded congregate housing, HUD complexes and the Private Pay Assisted Living Pilot.
Residential Care Homes
Residential care homes are facilities that provide a room, meals and supervision, but no nursing services, for individuals whose limitations prevent them from living alone. Services vary from facility to facility but may include dietary and housekeeping services, monitoring of prescription medication, social and recreational opportunities, and assistance with activities of daily living. Residential care homes in Connecticut are
21
Connecticut Department of Economic and Community Development, 2012. 22
Connecticut Department of Public Health, 2012.

33
licensed by DPH. As of June 30, 2012, there were 101 residential care homes in Connecticut with a total of 2,763 beds.23
Continuing Care Retirement Communities
Continuing Care Retirement Communities (CCRCs) provide residents, through contractual agreements, lifetime shelter and access to a wide variety of services, including long-term health services. Each resident pays a substantial entrance fee and monthly fees in exchange for a living unit and access to services. Various levels of care such as independent living, assistance with daily activities and nursing facility care are typically provided on CCRC campuses. As their needs change, residents are usually able to move from one level of care to another without leaving the community. If a CCRC does not have a nursing facility on campus, it often has an arrangement with a nearby nursing facility to admit its residents on a priority basis. Each CCRC is mandated to register with DSS by filing an annual disclosure statement. Although CCRC are not licensed by the state, various components of their LTSS packages, such as residential care beds, assisted living services, and nursing facility care are licensed by DPH. As of June 30, 2012 there were 19 CCRCs operating in Connecticut, and two “CCRC at Home” providers. 24
Supportive Housing
Designed to enable individuals and families to live independently in the community, supportive housing provides permanent, affordable rental housing with access to individualized health, support and employment services. People living in supportive housing usually hold their own leases and have all the rights and responsibilities of tenants. In addition, they have the option to use a range of training and support services such as case management, budgeting and independent living skills, health care and recovery services, and employment services.
Residential Settings for Individuals with Intellectual Disability
DDS administers or contracts for residential services from independent living, individualized home supports, continuous residential supports, community living arrangements, community companion homes, and residential center settings.25
Individualized Home Supports -- Some people need minimal hours of staff support to live in their own place or family home. This staff support may be in the form of assistance with budgets, shopping and/or leisure activities. People receiving Individualized Home Supports get staff support from a few hours a day to only a few hours a month, depending on the needs of the person. On June 30, 2012, 2,733 individuals received Individualized Home Supports.
23
Connecticut Department of Public Health, 2012. 24
Connecticut Department of Social Services, 2012 25
Connecticut Department of Developmental Services, 2012

34
Community Companion Homes -- People with intellectual disability live in a family setting that is not within their own family. People in these settings live with a family that has received training and licensing from DDS. On June 30, 2012, 401 individuals lived in Community Companion Homes.
Continuous Residential Supports-- People who need overnight support and live with three or fewer people share an apartment or house and have staff from an agency or hired privately. On June 30, 2012, 450 individuals lived in Continuous Residential Supports.
Community Living Arrangements -- People who need 24 hour support are provided with staff in group home settings. Usually, two to six people share an apartment or house and have staff available to them 24 hours a day. On June 30, 2012, 3,757 individuals lived in Community Living Arrangements.
Residential Settings for Individuals with Psychiatric or Addiction Disorders
DMHAS funds several types of residential settings for individuals age 18 and older with psychiatric or addiction disorders. In SFY 2012, a total of 56,107 individuals received mental health services in the community and 1,831 received services in inpatient settings. Also in SFY 2012, a total of 59,738 individuals received substance abuse services in the community and 3,220 received inpatient services.26 Psychiatric disorders Group Homes – A community-based residence with on-site staffing 24 hours per day,
seven days a week. In SFY 2012, 258 individuals lived in these group home settings. Supervised Housing – Services are provided in intensively managed housing where
individuals live in private or shared apartments with staff co-located 24 hours per day, seven days a week. In SFY 2012, 834 individuals lived in supervised housing.
Supported Housing – Community-based private or shared apartments with weekly
visits and support services. Staff is on call 24 hours per day, seven days a week, although they are not necessarily located on site. In SFY 2012, 1,950 individuals resided in supported housing.
Addiction disorders Long-Term Care – A 24 hour per day, seven days a week staffed residence with a
structured recovery environment providing substance abuse intermediate and long-term residential treatment or care. In SFY 2012, 1,831 individuals participated in this program.
26
Connecticut Department of Mental Health and Addiction Services, 2012

35
Institutional Care Settings
Nursing Facilities
Nursing facilities provide personal and skilled nursing care 24 hours a day. This level of care is often used when an individual has a condition that requires 24-hour supervision, substantial needs based on activities of daily living (ADL) or cognitive status, inadequate informal support, or insufficient financial resources to pay for home and community-based services. In addition to serving long-term services and supports needs, nursing facilities are also relied upon for short term post-acute rehabilitation services. There are two types of nursing facilities licensed in Connecticut: chronic and convalescent nursing facilities (skilled nursing facilities) and rest homes with nursing supervision (intermediate care facilities). On September 30, 2012, there were 25,084 individuals residing in Connecticut nursing facilities. The majority of residents were white (85 percent), female (70 percent), and without a spouse (82 percent), a profile that has remained consistent over the years. Twelve percent of the residents were under age 65, 39 percent were between age 65 and 84 and 49 percent were age 85 or older.27 Connecticut had a total of 27,611 licensed nursing facility beds as of September 30, 2012. Since 1991, efforts have been made to reduce the number of residents in Connecticut’s nursing facilities by placing a moratorium on additional beds. Despite the
27
State of Connecticut Annual Nursing Facility Census, Office of Policy and Management, Policy
Development and Planning Division, 2012.
TABLE 3
Percent Distribution of Residents in Connecticut Nursing Facilities by
Payment Source on September 30, 1995 and 2011
Payment Source 1995 2011
Medicaid 68 70
Medicare 11 15
Private Pay 20 10
Insurance 2 1
Other < 1 2
Source: State of Connecticut Nursing Facility Registry and Connecticut Annual Nursing
Facility Census, Office of Policy and Management, Policy Development and Planning
Division.

36
moratorium, from 1991 to 1994, the total number of licensed beds increased from 29,391 to 32,149. This was due to the addition of beds that had been approved before the moratorium went into effect. From 1994 to 2012, the total number of licensed beds decreased by 4,538, or 14 percent. 28 In 2011, the average daily cost to a nursing facility resident paying privately in Connecticut was $368 a day for a semi-private room, or over $134,000 a year. Medicaid was the primary source of payment for 70 percent of nursing facility residents in Connecticut as of September 30, 2011, with Medicare covering 15 percent and private pay covering 12 percent.29 (Table 3)
Intermediate Care Facilities for Persons with Mental Retardation – ICF/MR
On June 30, 2012, a total of 993 people over the age of 18 in Connecticut resided in either a DDS or private provider operated ICF/MR. Of these individuals, 610 people resided in an ICF/MR operated by DDS in one of six locations throughout the state. Another 383 individuals resided in group homes operated at an ICF/MR level of care by private agencies. Of all of the people living in an ICF/MR, 459 (46 percent) were between the age of 18 and 54, 338 (34 percent) were between the ages of 55 and 64, and 206 (20 percent) were age 65 and over. At this level of care, individuals received residential and day habilitation services, prevocational services and supported employment services. All services are financed through the State Medicaid Program.30
Chronic Disease Hospitals
On June 30, 2012, there were six chronic disease hospitals in Connecticut with a total of 832 beds.31 These long-term hospitals provide diagnosis, care and treatment of a wide range of chronic diseases.
C. Financing
In the U.S., $207.9 billion was spent on LTSS in 2010, representing eight percent of all personal health care spending. Medicaid is the dominant source of payment for LTSS (62.2%), followed by out-of-pocket payments by individuals and families (21.9%). Other private and public sources cover the balance of expenditures (16.0%). Medicare plays no role in financing LTSS, since the purpose is to cover acute and post-acute medical care for people age 65 and older and for younger individuals who qualify for Social Security because of disability (Figure 7).32 In addition to these expenditures is the unpaid care provided by family members and other informal caregivers.
28
State of Connecticut Nursing Facility Registry and Connecticut Annual Nursing Facility Census, Office
of Policy and Management, Policy Development and Planning Division. 29
State of Connecticut Annual Nursing Facility Census, Office of Policy and Management, Policy
Development and Planning Division, 2012. 30
Connecticut Department of Developmental Services, 2012 31
Connecticut Department of Public Health, 2012. 32
National Health Policy Forum; The Basics: National Spending for Long-Term Services and Supports;
George Washington University; February 23, 2012.

37
Nationally, most LTSS spending goes to the relatively small minority of individuals in nursing facilities. In contrast, the vast majority of community residents needing LTSS receive only unpaid assistance. Furthermore, although about half of all individuals receiving LTSS are under age 65, four-fifths of LTSS spending is for elderly individuals.33 At the individual level, those who have sufficient income and assets are likely to pay for their LTSS needs on their own, out of their own personal resources or through a long-term care insurance policy. Medicaid will pay for those who meet the financial eligibility criteria and have limited financial resources, or deplete them paying for their care. Medicare may pay for individuals who are eligible and require skilled or recuperative care for a short time, but do not cover individuals with stable chronic conditions. The Older Americans Act is another Federal program that helps pay for LTSS services. As financial circumstances and the need for care changes, a variety of payment sources may be used.34
Medicaid
The Medicaid program, jointly funded by the state and federal government, is the primary payer for LTSS in the U.S. and the major public program providing coverage for nursing facility care, accounting for 62 percent of all LTSS spending in 2010 (Figure 7). Medicaid provides coverage for people who are poor and disabled. It also provides LTSS for individuals who qualify for Medicaid because they have ‘spent down’ their assets due to the high costs of such care and have become nearly impoverished. For example, many older adults become eligible for Medicaid as a result of depleting their assets to pay for nursing facility care that Medicare does not cover.
33
H. Stephen Kay, Charlene Harrington, and Mitchell P. LaPlante; Long-Term Care: Who Gets It, Who
Providers It, Who Pays, and How Much?; Health Affairs, Vol. 29:1; January 2010; page 11. 34
U.S. Department of Health and Human Services, National Clearinghouse for Long-Term Care
Information, Who Pays for Long-Term Care?
http://www.longtermcare.gov/LTC/Main_Site/Paying/Public_Programs/Index.aspx

38
In SFY 2012, the Connecticut Medicaid program spent $2.770 billion on LTSS. These Medicaid LTSS expenses account for 47 percent of all Medicaid spending and 14 percent of total expenditures for the State of Connecticut. 35 Looking at Connecticut’s expenses for Medicaid LTSS in more detail, 41 percent was spent on home and community-based services and 59 percent on institutional care (Figure 8). Breaking down Medicaid home and community-based waiver services further, we see that services for the developmentally disabled account for 26 percent of long-term care expenses, in contrast to eight percent for the Elder, Personal Care Assistance, Katie Beckett, Acquired Brain Injury, and Mental Health waivers combined. Over time, the proportion of Medicaid LTSS expenses for home and community-based services has increased from 23 percent in SFY 1996 to 41 percent in SFY 2012. A consistent conclusion from research on Medicaid home and community-based services waivers is that these services provide savings over care in institutional settings over the long term.36 In addition, experience from other states has shown that home and community-based services help people with disabilities stay in their homes while reducing LTSS spending. Researchers at the Institute for Health and Aging at the University of California, San Francisco, found that the growth in spending was greater for states offering limited community-based services than for states with large, well-established home and community-based programs. They conclude that while expansion of home and community-based services requires a short-term increase in spending, it is followed by a reduction in institutional spending and long-term cost savings.37
Medicare
The federal Medicare program provides health care coverage for people age 65 and older. Individuals under age 65 with disabilities are also covered, however, only after they have received Social Security disability benefits for two years. Although Medicare
35
Office of Policy and Management, Policy Development and Planning Division, 2012 36
Julie Robison, PhD et al, Transition from Home Care to Nursing Home: Unmet Needs in a Home- and
Community-Based Program for Older Adults, Journal of Aging & Social Policy, 24:251-270, 2012, pages
252-253. 37
H. Stephen Kaye et al, Do Noninstitutional Long-Term Care Services Reduce Medicaid Spending?
Health Affairs, Vol. 28, No. 1, January/February, 2009, pgs 262-272.

39
is the major health insurance program for older adults and certain persons with disabilities, it does not cover LTSS costs. Medicare covers medically necessary care and focuses on medical acute care, such as doctor visits, drugs, and hospital stays. Medicare covers nursing facility stays for no more than 100 days following a hospital stay of at least three days, paying for all of the first 20 days and a portion of the next 80 days. Assisted living costs are not covered. With regard to home health care, coverage is limited by type and duration. For homebound persons needing part-time skilled nursing care or physical therapy services, Medicare pays for home health care, including personal care services provided by home health aides.
Out-Of-Pocket Spending / Private Pay
Nationally in 2010, approximately 21.9 percent of spending for LTSS was paid directly by individuals (about $45.4 billion), rendering out-of-pocket payments as the second largest source of long-term care financing (Figure 7). This includes direct payment of services as well as deductibles and co-payments for services primarily paid by another source, but does not include the uncompensated costs of informal caregivers.
Private Insurance Spending
In 2010, coverage from private insurance and other private spending for nursing facilities and home health services represented 11.6 percent of LTSS expenditures in the U.S. (Figure 7). Sources of private insurance include supplemental Medicare coverage (Medigap), traditional health insurance, and private long-term care insurance.
Private Long-Term Care Insurance
Long-term care insurance covers services needed by people who cannot perform every day activities on their own due to a chronic condition, limited ability to function or deterioration in mental capacity. It covers a wide range of services that include bathing, dressing, eating, using the toilet, continence, and transferring from a bed to a chair. Since individuals in need of LTSS do not usually require skilled help, the services are not generally covered by private health insurance or Medicare. Depending upon the policy, care can be provided in a variety of places, including: a person's home, a nursing facility, through community-based services (i.e., adult day care) and in a variety of assisted living settings (i.e., continuing care retirement communities, residential care homes, assisted living facilities).38 In Connecticut, the number of individuals who purchased long-term care insurance in 2011 was 6,047. As of December 31, 2011, there were 109,106 Connecticut residents with a private long-term care insurance policy in force.39
38
Connecticut Partnership for Long-Term Care, Frequently Asked Questions, April 2011 39
Office of Policy and Management, Policy Development and Planning Division, 2012

40
Connecticut Partnership for Long-Term Care40
The Partnership is a unique alliance between State government and the private insurance industry developed to: Provide individuals with a way to plan for their long-term care needs without the
risk of impoverishment; Enhance the standards of private long-term care insurance; Provide public education about long-term care; and Conserve State Medicaid funds.
The most unique aspect of a Connecticut Partnership policy is the Medicaid Asset Protection feature. This feature provides dollar for dollar asset protection: for every dollar that a Partnership policy pays out in benefits, a dollar of assets can be protected from Medicaid spend down rules. When determining Medicaid eligibility, any assets a policy holder has up to the amount the Partnership insurance policy paid in benefits will be disregarded. The Partnership Medicaid Asset Protection feature is not available under non-Partnership policies. As of September 30, 2012, there were over 56,500 Partnership policies sold in Connecticut. Purchasers of Partnership policies range in age from 20 to 88 years old, with the average age at purchase being 57 years old. Over 1,700 Partnership policyholders have utilized benefits under their policies, with over $133 million in benefits paid. Only 116 Partnership policyholders have accessed Medicaid utilizing the Asset Protection earned under their policies. This has helped the Partnership save the State over $15.3 million in Medicaid long-term care funds with larger savings projected for the future. Connecticut was the first state to implement a Partnership. From 1992, when the Partnership was first launched, through 2006, New York, Indiana and California developed similar Partnership programs. Due to changes in federal law (Deficit Reduction Act of 2005) making it easier for states to establish Partnership programs, 36 new states have developed Partnership programs. Connecticut currently has reciprocity with all the Partnership states, except California, for the granting of Medicaid Asset Protection under the program.
Older Americans Act
Another major source of federal LTSS funds is the Older Americans Act (OAA), enacted in 1965 to promote the well being of older persons and help them remain independent in their communities. The OAA provides federal funds to pay for home and community-based LTSS for older adults, generally 60 and older, and their families. States are required to target assistance to persons with the greatest social or economic need. Services funded under this Act include information and referral, counseling, outreach, congregate meal sites and home-delivered meals, transportation, long-term care
40
Connecticut Partnership for Long-Term Care, 2012

41
ombudsman services, legal services, elderly protective services, and employment services programs for older adults.
The federal Administration on Aging provided $17.6 million in FFY 2011 to the DSS Aging Services Division. Of these funds, $16 million were distributed by formula to the Area Agencies on Aging who in turn contract with community-based organizations to provide social and nutritional services. The remaining $1.6 million of these funds were special grants received by Aging Services, including Aging and Disability Resource Centers, Empowering Older People to Take Control of Their Health (Evidence-Based Health Promotion), Alzheimer’s disease and Supportive Services, and Elder Abuse Prevention. Both federal and State funds for Aging Services provided a multitude of services to 77,317 seniors.
State Supplement Program/ Aid to the Aged, Blind and Disabled (AABD)
The State Supplement Program provides a monthly cash benefit for basic living expenses to low-income individuals who are age 65 and over, individuals who are disabled and between the ages of 18 and 64, or individuals who are blind. Benefit amounts vary based on an individual’s needs and expenses. Those eligible for State Supplement benefits are also eligible for Medicaid. Those receiving a State Supplement benefit live in a variety of settings, including their own apartments, housing for older adults or persons with disabilities, or residential care homes.
Rental Subsidies
Many individuals with disabilities need assistance with covering their rental costs if they are going to be able to live in the community. While federal Medicaid law prohibits home and community-based services waiver programs from covering the costs of room and board (room and board expenses are only covered in institutional settings under Medicaid), there are both state and federal sources of rental support in the form of Section 8 vouchers, rental subsidies in State-funded congregate facilities, the State's rental assistance program, State Supplement funds and other sources.
Veterans Affairs
The federal Department of Veterans Affairs (VA) pays for LTSS for service-related disabilities and for certain other eligible veterans, and other health programs such as nursing facility care and at-home care for aging veterans with LTSS needs. Veterans who do not have service-related disabilities but who are unable to pay for the cost of necessary care may also receive LTSS. In Connecticut, the VA funds a Veteran Directed Home and Community Based Services (VDHCBS) program through the Department of Social Services. Veterans served through this program have the opportunity to self-direct their own care and receive services in their home by the caregiver of their choice. The Sgt. John L. Levitow Veterans’ Health Center at the Connecticut State Veterans’ Home provides long term quality health care to veterans with chronic and disabling medical conditions. These conditions include, but are not limited to, chronic obstructive

42
pulmonary disease (COPD), congestive heart disease (CHF), Cardiovascular Accident, Parkinson’s disease, Alzheimer’s disease and other dementias. The facility also provides End-of-Life care, Palliative care and Respite care. The Health Center is licensed by the Department of Public Health as a Chronic Disease Hospital and is recognized by the U.S. Department of Veterans’ Affairs as a Nursing Facility.
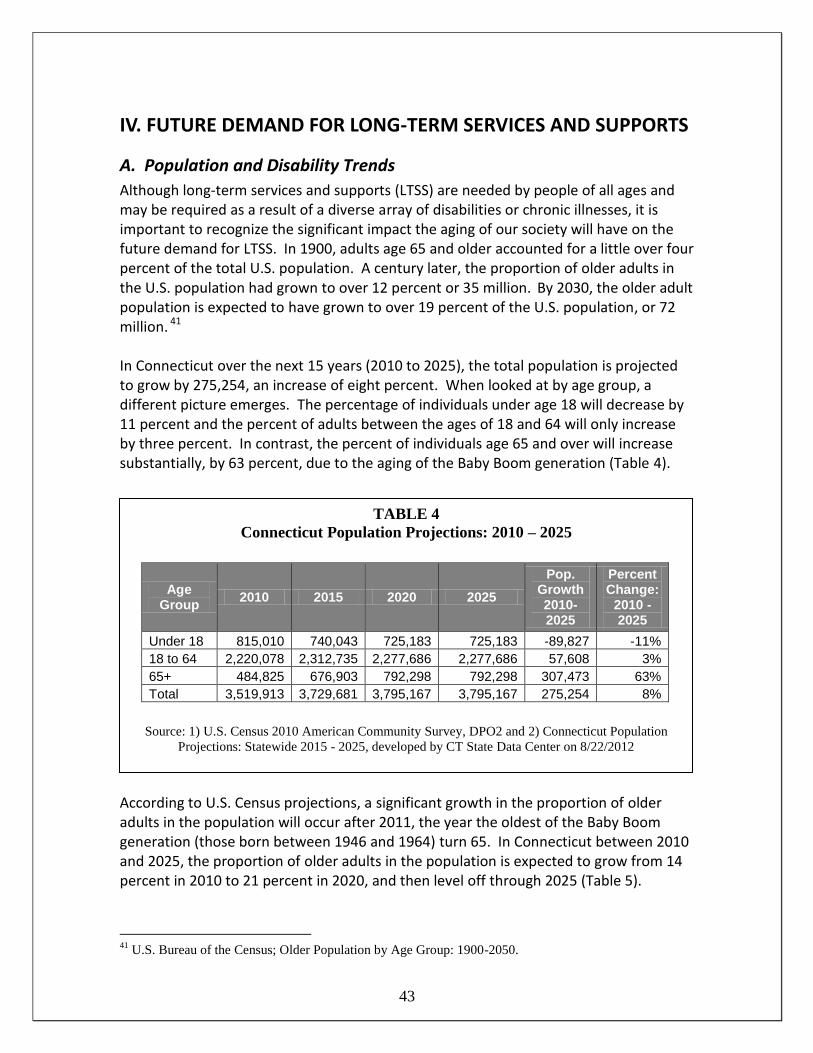
43
IV. FUTURE DEMAND FOR LONG-TERM SERVICES AND SUPPORTS
A. Population and Disability Trends
Although long-term services and supports (LTSS) are needed by people of all ages and may be required as a result of a diverse array of disabilities or chronic illnesses, it is important to recognize the significant impact the aging of our society will have on the future demand for LTSS. In 1900, adults age 65 and older accounted for a little over four percent of the total U.S. population. A century later, the proportion of older adults in the U.S. population had grown to over 12 percent or 35 million. By 2030, the older adult population is expected to have grown to over 19 percent of the U.S. population, or 72 million. 41 In Connecticut over the next 15 years (2010 to 2025), the total population is projected to grow by 275,254, an increase of eight percent. When looked at by age group, a different picture emerges. The percentage of individuals under age 18 will decrease by 11 percent and the percent of adults between the ages of 18 and 64 will only increase by three percent. In contrast, the percent of individuals age 65 and over will increase substantially, by 63 percent, due to the aging of the Baby Boom generation (Table 4).
According to U.S. Census projections, a significant growth in the proportion of older adults in the population will occur after 2011, the year the oldest of the Baby Boom generation (those born between 1946 and 1964) turn 65. In Connecticut between 2010 and 2025, the proportion of older adults in the population is expected to grow from 14 percent in 2010 to 21 percent in 2020, and then level off through 2025 (Table 5).
41
U.S. Bureau of the Census; Older Population by Age Group: 1900-2050.
TABLE 4
Connecticut Population Projections: 2010 – 2025
Age Group
2010 2015 2020 2025
Pop. Growth 2010-2025
Percent Change:
2010 - 2025
Under 18 815,010 740,043 725,183 725,183 -89,827 -11%
18 to 64 2,220,078 2,312,735 2,277,686 2,277,686 57,608 3%
65+ 484,825 676,903 792,298 792,298 307,473 63%
Total 3,519,913 3,729,681 3,795,167 3,795,167 275,254 8%
Source: 1) U.S. Census 2010 American Community Survey, DPO2 and 2) Connecticut Population
Projections: Statewide 2015 - 2025, developed by CT State Data Center on 8/22/2012

44
TABLE 6
Projection of Non-Institutionalized Persons with Disabilities in Connecticut by Age:
2010 – 2025
2010 2025 2010 / 2025
Increase Percent Increase
Under 18 28,732 25,381 -3,351 -11.7%
18 to 64 179,340 184,493 5,153 2.9%
65+ 159,485 260,666 101,181 63.4%
Total 367,557 470,540 102,983 28.0%
Source: Office of Policy and Management based on Sources: 1) U.S. Census Bureau, 2010 American
Community Survey DP02, 2) Connecticut Population Projections: Statewide 2015 - 2025, developed by
Connecticut State Data Center on 8/22/2012
.
TABLE 5
Connecticut Population Projections,
Percent Distribution of Population by Age: 2010 – 2025
Age
2010
2015
2020
2025
Under 18 23% 20% 19% 19%
18 to 64 63% 62% 60% 60%
65+ 14% 18% 21% 21%
Source: Office of Policy and Management calculation based on: 1) U.S. Census 2010 American
Community Survey, DPO2 and 2) Connecticut Population Projections: Statewide 2015 - 2025,
developed by CT State Data Center on 8/22/2012
In 2010, the U.S. Census estimated that there were 367,557 individuals in Connecticut with one or more disabilities (excluding individuals living in institutions). Between 2010 and 2025, this number is expected to grow by 28 percent, or 102,983 people, to an estimated 470,540.42 However, when broken down by age, dramatically different trends appear that parallel the general population trends. The number of individuals with disabilities under age 18 is projected to decrease by nearly 12 percent (-3,351) over 15 years and the number of individuals with disabilities age 18 to 64 is projected to increase by almost three percent (5,153). In contrast, the population with disabilities age 65 and older is expected to significantly increase by 101,181 or 63 percent (Table 6).
42
These projections are based on the 2010 Census disability data applied to State Population Projections
through 2025. The Census does not tabulate disability status for individuals in institutions. Disability
projections assume a constant rate of disability over time.

45
B. Demand for Long-Term Services and Supports
Ideally, an estimate of the future demand for LTSS in Connecticut would include all aspects of the system in a single picture, including publicly and privately financed services and formal and informal care. However, creating such a comprehensive picture is not possible without more complete data on privately financed services and the use of informal care. Short of this, what is critical in terms of public policy is an understanding of the impact of future demand on the Medicaid financed long-term community and institutional services and supports once the baby boom generation ages. By focusing on Medicaid, what is not accounted for is the demand for LTSS among individuals who either depend upon unpaid caregivers and family, those with private long-term care insurance, those who pay out of pocket and those who depend upon other sources of federal and state funds. As discussed in Section III, Medicaid is the largest and most significant payer of LTSS at both the state and national level. Of the 41,725 Medicaid clients who received LTSS in Connecticut each month in SFY 2012, 56 percent received services in the community and 44 percent received care in an institutional setting (Table 7). If these ratios remain steady over the next decade and a half and disability rates do not vary, U.S. Census Bureau disability data and population projections for Connecticut suggest that in the year 2025 there will be a 28 percent increase in individuals receiving Medicaid LTSS: an additional 6,583 Medicaid clients receiving LTSS in the community and an additional 5,100 receiving care in institutions (Table 8). To meet this additional demand for LTSS, Medicaid expenditures are expected to grow from $2.770 billion in SFY 2012 to $6.368 billion in 2025, assuming current ratios of institutional and community care and a five percent annual inflation rate (Table 9).
TABLE 7
Connecticut Medicaid Long-Term Care Clients and Expenditures: SFY 2012
SFY 2012 Medicaid LTC Clients, Monthly Average
SFY 2012 Medicaid LTC Expenditures
Community-based Care 23,509 $1.128 billion
Institutional Care 18,216 $1.643 billion
Total 41,725 $2.770 billion
Source: Office of Policy and Management, 2012.
Does not total due to rounding

46
TABLE 8
Projections of Connecticut Medicaid Long-Term Care Clients by Current and Optimal Ratios of Community and Institutional Care
SFY 2012 and SFY 2025
2012 Client
Ratio
2025 clients/ monthly average
Change from 2012 to 2025
Optimal Client Ratio
2025 Optimal clients/ monthly Average
Change from 2012 to 2025
Community-based Care 56% 30,092 6,583 75% 40,056 16,547
Institutional Care 44% 23,316 5,100 25% 13,352 -4,864
Total 53,408 11,683 53,408 11,683
Source: Office of Policy and Management, Policy and Planning Division, 2012 based on: (1) Department of Social Services Medicaid data for SFY 2012; (2) U.S. Census Bureau, 2010 American Community Survey DP02, 2) Connecticut Population Projections: Statewide 2015 - 2025, developed by Connecticut State Data Center on 8/22/2012
TABLE 9 Projections of Connecticut Medicaid Long-Term Care Expenditures by
Current and Optimal Client Ratios of Community and Institutional Care SFY 2012 and SFY 2025 in Billions
Current
Client Ratio
2025 Expenditures with Current Client Ratio
Change from 2012 to 2025
Optimal Client Ratio
2025 Expenditures with Optimal Client Ratio
Change from 2012 to 2025
Community-based Care 56% $2.592 $1.465 75% $3.447 $2.319
Institutional Care 44% $3.776 $2.133 25% $2.161 $.519
Total $6.368 $3.598 $5.608 $2.837
Note: Expenditure projections include a 5 percent annual compound rate increase. Numbers do not total due to rounding. Source: Office of Policy and Management, Policy and Planning Division, 2012 based on: (1) Department of Social Services Medicaid data for SFY 2012; (2) U.S. Census Bureau, 2010 American Community Survey DP02, 2) Connecticut Population Projections: Statewide 2015 - 2025, developed by Connecticut State Data Center on 8/22/2012

47
If current ratios of Medicaid community and institutional LTSS were to evolve over time to reflect the greater emphasis on home and community-based services achieved in other states, Connecticut could develop a LTSS system that provides community-based care to 75 percent instead of 56 percent of its Medicaid long-term care clients. If the number of Medicaid clients receiving LTSS in 2025 reflected this optimal ratio, Connecticut could expect an additional 16,547 clients receiving community-based services and supports, and a decrease of 4,864 individuals receiving care in institutions when compared to actual 2012 levels (Table 8). By holding the number of individuals served in 2025 constant, and increasing the proportion of individuals receiving community-based care to 75 percent, Medicaid LTSS expenditures are projected to be $5.608 billion, instead of $6.368 billion; $760 million less than the State might otherwise have spent (Table 9). Total Medicaid LTSS expenditures in 2025 are projected to be lower under the optimal ratios because in general, although the same numbers of people are served, the cost of serving people at home and in the community, on average,43 is significantly lower than serving them in institutions. In forecasting future demand for LTSS in Connecticut, it is important to note that there are many variables that will affect these estimates, whether related to changes in public policy, demographics, medical advances, or health status. On an individual level, not all people with a disability, whether it is physical, developmental, or psychiatric, will require LTSS. Those who do need LTSS often have needs that fluctuate over time, depending on their health, the nature of their disability and personal circumstances. Individuals vary in the level of supports they need, with the majority of people requiring support with instrumental activities of daily living (IADLs), and others requiring more intense support. Furthermore, the amount and type of informal care available from family and friends will influence the amount of paid care that is required. By way of comparison, in the U.S., Medicaid spending for community-based LTSS amounted to 44 percent of all expenditures for Medicaid LTSS. A comparison of states provided in Table 10 shows New Mexico to have the highest proportion of Medicaid long-term spending for home and community-based services (82.8 percent) and Mississippi to be the lowest (14.4 percent). Among the states, Connecticut ranks 22nd, with 44.1 percent of Medicaid LTSS expenditures for home and community-based services. 44, 45 Although no one other state’s model can be totally replicated in
43
Although the average cost of serving people in the community is less expensive than care in institutions,
this is not the case in all circumstances, such as the cost of caring at home for a person with Alzheimer’s
disease or other severe disabilities. 44
Due to different methodology, this analysis calculated that Connecticut Medicaid program spent 44.1
percent for community-based long-term services and supports in 2011, in contrast to the analysis by the CT
Office of Policy and Management, which calculated a percentage of 40 percent in 2011. 45
45
In this analysis by Thomson Reuters, community-based services include waivers authorized under
Section 1915(c) of the Social Security Act; personal care; home health; HCBS authorized under Section
1115 or Section 1915(a) of the Social Security Act; Program of All-Inclusive Care for the Elderly (PACE);

48
Connecticut, spending patterns in other states illustrate that greater ratios of home and community-based care are achievable. If Connecticut is to reach a ratio of 75 percent for community-based care sooner than 2025, balancing efforts will need to be more aggressive.
C. Caregiver Supply and Demand
Informal Caregivers
Relatives, friends and other unpaid caregivers account for the vast majority of individuals providing LTSS to individuals across the lifespan. Looking at this another way, only 13 percent of people needing any type of LTSS use paid helpers in either a
rehabilitative services; private duty nursing; state plan HCBS authorized under Section 1915(i) of the
Social Security Act; self-directed personal assistance services authorized under Section 1915(j) of the
Social Security Act. Institutional services include nursing homes; intermediate care facilities for people
with mental retardation (ICF/MR); mental health facilities – regular payments; mental health facilities –
disproportionate share payments.
TABLE 10 Percent of Medicaid Long-Term Care Spending for
Home and Community-Based Services, FY 2011
State
Percent
U.S. Rank
New Mexico 82.8 1
Oregon 74.5 2
Minnesota 68.0 3
Vermont 64.9 5
Maine 51.8 13
Massachusetts 47.1 17
Rhode Island 46.1 20
Connecticut 44.1 22
U.S. 44.0
New Hampshire 41.2 29
Mississippi 14.4 51
Source: Steve Eiken, Kate Sredl, Brian Burwell, and Lisa Gold; Medicaid Expenditures for Long-Term Services and Supports: 2011 Update; Thomson Reuters; October 31, 2011

49
primary or secondary role.46 In 2009, there were 42 million family caregivers in the U.S providing care to an adult with limitations in daily activities at any one time and almost 62 million throughout the year. Over this time, the estimated economic value of unpaid contributions from informal caregivers was approximately $450 billion, up from an estimated $375 billion in 2007. In fact, the economic value of caregiving exceeded total Medical spending in the U.S. for both medical and LTSS. In Connecticut in 2009, there were an estimated 486,000 caregivers at any given time, accounting for an estimated $5.8 billion in unpaid contributions.47
Paid Direct Caregivers
While the majority of LTSS are provided by unpaid family members or other informal caregivers, paid direct caregivers form a large and growing percentage of the workforce, both in Connecticut and nationally.
Table 11 Connecticut 2008 and Projected 2018 Occupations
Occupational Title Employment Change
2008 2018 Number Percent
Personal and Home Care Aides 12,364 17,774 5,410 43.8%
Home Health Aides 13,600 18,248 4,648 34.2%
Registered Nurses 36,715 42,049 5,334 14.5%
Nursing Aides, Orderlies, and Attendants 25,835 27,767 1,932 7.5%
Occupational Therapists 1,734 1,985 251 14.5%
Occupational Therapist Assistants 430 489 59 13.7%
Physical Therapists 3,727 4,377 650 17.4%
Physical Therapist Aides 520 629 109 21.0%
Physical Therapist Assistants 414 487 73 17.6%
Respiratory Therapists 1,140 1,333 193 16.9%
Speech-Language Pathologists 1,482 1,656 174 11.7%
Source: Office of Policy and Management, from Connecticut Department of Labor, Connecticut Statewide Forecast: 2008 – 2018, http://www1.ctdol.state.ct.us/lmi/ctoccgroups.asp
46
H. Stephen Kay, Charlene Harrington, and Mitchell P. LaPlante; Long-Term Care: Who Gets It, Who
Providers It, Who Pays, and How Much?; Health Affairs, Vol. 29:1; January 2010; page 15. 47
Lynn Feinberg et al, Valuing the Invaluable: 2011 Update; The Growing Contributions and Costs of
Family Caregiving, AARP Public Policy Institute 2011 Update.

50
Paid direct caregivers go by a number of titles, include nurse’s aides, personal care assistants and home health aides. In 2011, there were an estimated 50,000 direct-care workers in Connecticut providing daily services and supports to older adults and individual with disabilities who needed assistance with personal care and other daily activities of living. Between 2008 and 2018, the demand for paid direct care workers in Connecticut is expected to grow by 23 percent, with an increasing number employed in community-based settings.48 Current efforts to balance the institutional bias of the current long-term services and supports system are leading to a greater percentage of people receiving long-term services and supports at home. As a result, LTSS occupations in Connecticut will see double-digit figure growth between 2008 and 2018. The impact of this shift on the paid caregiver workforce in Connecticut is reflected in a predicted 44 percent rise in personal and home care aide positions and a 34 percent increase in home health aide positions (Table 11).
48
CT Commission on Aging; Direct Care Workforce Development Strategic Plan; February, 2011;
http://www.cga.ct.gov/coa/pdfs/publications/2012/workforce%20plan%202.27.12.pdf
51
V. GOALS and RECOMMENDATIONS
A. Introduction
The goals and recommendations provided in this Plan are put forward to improve the balance of the system of long-term services and supports (LTSS) in Connecticut for individuals of all ages and across all types of disabilities and their families. In addition to two rebalancing goals, this Plan provides a set of long-term and short-term recommendations. The long-term recommendations provide a high level view of the essential components of a well balanced and person centered system of LTSS. These recommendations are reflective of a system of services and supports, and as such, must be viewed as both interrelated and interdependent. The short-term recommendations reflect strategic priorities identified for action over the next three years (2013-2015). In 2005, a broad philosophical statement was enacted in Connecticut statute to guide policy and budget decisions. It states that “Connecticut’s long-term care plan and policy must provide that individuals with long-term care needs have the option to choose and receive long-term care and support in the least restrictive, appropriate setting.” This simple statement provides a larger framework for Connecticut to make the necessary changes to the laws and regulations that govern the State’s system of LTSS to make real choices for people a reality. As Connecticut continues its work to balance its system of LTSS, progress must be made on multiple fronts. A balanced system of LTSS is one where policies, incentives and services are aligned to allow individuals with LTSS needs to live fulfilling and productive lives. Balancing the mix of home and community-based and institutional care as well as the mix of public and private resources is needed if Connecticut hopes to provide real LTSS choices for its residents and to achieve the long-standing Vision, Mission and Governing Principles put forth by this and previous Long-Term Care Plans. Over the years, Connecticut has made notable progress towards this goal, but more must be done to meet needs today as well as to anticipate the demands on the system of LTSS that will be made by the aging of the baby boom generation. Overall, the recommendations are primarily focused on initiatives State government can undertake. While the focus of this Plan is on State government, it is important to recognize the vital role that cities, towns, the private sector and individuals and families play in the system of LTSS. Government at all levels must work in partnership with individuals, families and the private sector in order to develop a quality and effective system.

52
B. Goals
1. Balance the ratio of home and community-based and institutional care
GOAL #1: Develop a system that provides for more choice and opportunities for community integration as alternatives to all institutional settings, and increases the proportion of individuals receiving Medicaid long-term home and community-based care from 56 percent in 2012 to 75 percent by 2025, requiring approximately a 1.4 percent increase in the proportion of individuals receiving Medicaid long-term services and supports in the community every year.
Over the last decade, Connecticut has made significant progress in developing home and community-based and residential alternatives to institutional care. Examples abound. Connecticut eliminated its waiting list for home care for elders; expanded income eligibility for State-funded home care for elders; introduced subsidized assisted living in State-funded congregate facilities, HUD complexes and private pay assisted living communities; developed affordable assisted living units; increased funding and capacity for various Medicaid home and community-based services waiver programs; expanded access to personal care services for individuals eligible for Medicaid; developed a long-term services and supports website and is in the midst of a robust and ongoing effort to rebalance the system of LTSS through the Money Follows the Person Rebalancing Initiative. In the 10 years since the establishment of the Plan’s goal of improving the balance between home and community-based services and institutional care (SFY 2003 – 2012), this goal has been met, with a steady increase in the proportion of Medicaid long-term care clients served in the community of one percent a year, from 46 percent to 56 percent (Table 12). However, to meet the goal of 75 percent of Medicaid clients receiving LTSS in the community by 2025, this pace must accelerate to 1.4 percent a year. With regard to expenditures, between SFY 2003 and SFY 2012, the proportion of Medicaid dollars for LTSS spent on services received in the community increased by one percent a year (Table 13).

53
TABLE 12 Proportion of Connecticut Medicaid LTSS Clients over Time
SFY Home & Community Care Institutional Care
Total Monthly Average LTSS Medicaid Clients
2002-2003 46% 54% 37,969
2003-2004 49% 51% 39,305
2004-2005 50% 50% 40,417
2005-2006 51% 49% 41,773
2006-2007 52% 48% 41,335
2007-2008 52% 48% 40,057
2008-2009 53% 47% 40,097
2009-2010 54% 46% 40,442
2010-2011 55% 45% 41,402
2011-2012 56% 44% 41,725
Source: Office of Policy and Management, Policy Development and Planning Division, 2012
TABLE 13 Proportion of Connecticut Medicaid LTSS Expenditures over Time
SFY Home & Community Care Institutional Care
Total LTSS Medicaid Expenses in billions
2002-2003 31% 69% $1.914
2003-2004 33% 67% $1.955
2004-2005 35% 65% $1.977
2005-2006 32% 68% $2.227
2006-2007 33% 67% $2.299
2007-2008 33% 67% $2.404
2008-2009 35% 65% $2.498
2009-2010 38% 62% $2.587
2010-2011 40% 60% $2.695
2011-2012 41% 59% $2.770
Source: Office of Policy and Management, Policy Development and Planning Division, 2012

54
If Connecticut is able to meet the goal of serving three out of every four Medicaid LTSS clients in the community, the impact on future LTSS expenditures will be significant. Additionally, Connecticut would be offering more choice to its residents. Based on U.S. Census Bureau disability data and population projections, and assuming the proportion of individuals with disabilities remains the same, it is estimated that by 2025 the number of persons with disabilities in Connecticut will grow by 102,983 or 28 percent. However, this increase is concentrated among older adults, with a 63 percent increase among individuals age 65 and older. For individuals with disabilities under age 18, an estimated 11.7 percent decrease is projected between 2012 and 2025 and for those ages 18 to 64, the number is expected to increase by only 2.9 percent. (Table 9) Assuming current ratios of community-based to institutional care, a five percent per year inflation rate and a 28 percent increase in the number of individuals with disabilities, Medicaid expenditures for LTSS are anticipated to grow from $2.770 billion in SFY 2012 to $6.368 billion by SFY 2025 to meet the expected increase in demand for long-term care. (Tables 7 and 9) However, if 75 percent of Medicaid clients receive community care in 2025, these LTSS expenditures are only expected to be $5.608 billion, which is $760 million less than the State might otherwise have spent that year. This cost avoidance over time not only allows Connecticut to provide relief to the Medicaid budget but also allows Connecticut to meet the needs of a larger group of individuals. This Plan takes a conservative approach to projecting the numbers of individuals with disabilities over the next fifteen years by holding the percentage of persons with disabilities constant over time. As described in Chapter IV, the percentage of older adults with disabilities has fallen over the last two decades. Experts disagree whether this decline in the rate of disability will continue or whether the expected demographic changes will overwhelm these gains. Fluctuations in either direction in the rate of disability will have an impact on the cost of providing LTSS.
2. Balancing the ratio of public and private resources
GOAL #2: Increase the proportion of costs for long-term services and supports covered by private insurance and other dedicated sources of private funds to 25 percent by 2025. Such an increase in private insurance and other sources of private funding would reduce the burden both on Medicaid and on individuals’ out-of-pocket expenses. Nationally, private insurance (long-term care and other health insurance) represented 11.6 percent of spending for long-term services and supports in 2010.49
49
“Other dedicated sources of private funds” means private long-term care insurance, other types of private
insurance and other private spending for nursing homes and home health services. It does not include “out-
of-pocket” spending or informal care. Source: National Health Policy Forum; The Basics: National
Spending for Long-Term Services and Supports; George Washington University; February 23, 2012.
55
Long-term services and supports is one of the most complex and difficult issues for individuals and families to understand and discuss. Many people are under the false impression that Medicare, and other health insurance programs, will cover their LTSS needs. This misunderstanding, coupled with the fact that most individuals would rather not face, or discuss, the possibility of becoming disabled and dependent, leads most people to do little or no planning for their future LTSS costs. The lack of Medicare and health insurance coverage for LTSS, combined with the lack of planning, has created a LTSS financing system that is overly reliant on the Medicaid program. Medicaid, by default, has become the primary public program for LTSS. However, in order to access Medicaid, individuals must first impoverish themselves. Therefore, we have a system that requires individuals to spend all their savings first in order to receive government support for their ongoing needs. In order for Connecticut residents to have real choices about what type of long-term services and supports they receive and where those services are provided, there needs to be a better balance between public and private resources. An over reliance on the Medicaid program as the primary source for LTSS financing threatens to reduce choices as budget pressures will only mount as the need for LTSS increases. Resources such as insurance benefits and other dedicated sources of private LTSS funding (i.e. reverse annuity mortgages) are needed to help balance the ratio of public and private funds in the system. If enough individuals would plan for their LTSS needs through long-term care insurance or dedicated savings, there would be more Medicaid funding for community-based care and people would not have to deplete their assets if they required prolonged LTSS. For example, the burden for paying for LTSS on both the state Medicaid program (62.2 percent) and individuals paying out-of-pocket (21.9 percent) would be significantly reduced if the proportion of LTSS costs covered by private insurance (long-term care and other health insurance - 11.6 percent) successfully reached 25 percent (See Figure 7). If these reductions in expenses were evenly divided between Medicaid and out-of-pocket costs for individuals, then Medicaid’s share of the costs could be reduced by 30 percent. Using today’s dollars, and a Medicaid LTSS budget of approximately $2.770 billion, that would equate to $819 million in annual savings. These savings could be partially allocated to the General Fund and partially used to help fund enhancements to the LTSS system, such as infrastructure and service improvements, leading to more choices for individuals and their families. Private long-term care insurance has emerged to specifically cover the personal and custodial care services and supports that comprise most of what is referred to as LTSS, including both home-based and institutional services. However, private long-term care insurance (LTCI) has its limitations. The premium for LTCI is priced based on the purchaser’s age. The older someone is the more expensive the policy. Therefore, for many individuals who wait too long to plan for their LTSS, LTCI may not be affordable.

56
Also, there will always be a portion of the population where LTCI is not affordable at any age. In addition, in order to purchase LTCI an individual must generally pass a medical underwriting screen (there are some exceptions to this in large group/employer offerings). Individuals who are already in need of LTSS, or have conditions, such as Multiple Sclerosis or Parkinson’s Disease, that, even if there are no symptoms at the time the individual applies for coverage, will very likely lead to needing LTSS, aren’t able to purchase the coverage. Given its limitations, private LTCI is not a panacea. However, it can play a more significant role than it does today in financing LTSS. In Connecticut, the presence of the Partnership for Long-Term Care program makes LTCI more affordable for many since they need only purchase an amount of coverage equal to the amount of assets they wish to protect. In addition to LTCI as a planning tool, Connecticut needs to be creative in the development of other financing options that can help to balance the ratio of public and private resources in the system.
C. Long-Term Recommendations
Optimally, a robust system of LTSS that is able to maximize autonomy, choice and dignity will provide a full range of services and supports. Individuals, regardless of disability or age, should have the options that allow them to live their lives as meaningfully and productively as possible in the settings that best suit their needs and preferences, in the least restrictive environment. As in any system, all the constituent parts are interrelated and interdependent. In order to meet the growing demand for LTSS and the goals set forth in this plan, investment in the community-based infrastructure is critical. Over the long term, to realize the vision and achieve the goals set out in this plan, actions must be taken on the following fronts:
Provide true individual choice and self-direction to all users of long-term services
and supports.
Promote efforts to enhance quality of life in various long-term services and
supports settings.
Ensure the availability of a wide array of support services for those living in the
community, including meals and adult day care.
Ensure quality of long-term services and supports in the context of a flexible and
person-centered service delivery system that acknowledges the dignity of risk.
57
Achieve greater integration and uniformity of administration of State long-term
services and supports serving both older adults and persons with disabilities and
their families, and emphasize policies related to function as opposed to age or
diagnosis.
Encourage communities to take an active role in planning and supporting long-term services and supports for their residents.
Address the long-term services and supports education and information needs of
the Connecticut public, including specialized educational efforts to specific
groups, such as baby boomers and employers.
Address the anticipated long-term services and supports workforce shortage.
Provide support to informal caregivers.
Preserve and expand affordable and accessible housing for older adults and
individuals with disabilities, including assisted living, residential care homes, and
other supportive housing and emergency housing options for older adults.
Encourage and enable the provider community to transform and develop
services and supports that will help to achieve the goals of this Plan.
Expand and improve employment opportunities and vocational rehabilitation for
persons with disabilities and older adults.
Increase availability of readily accessible, affordable, and inclusive transportation
that accommodates the need for family and direct care worker companions.
Improve quality of life and reduce utilization of long-term services and supports
and health care services by focusing on health promotion and disease
prevention.
Address emergency preparedness/disaster planning for older adults and persons with disabilities.
D. Short-Term Recommendations
These short-term recommendations provide an action agenda for improving the system of long-term services and supports in Connecticut in the three years spanning 2013 through 2015. Criteria for proposing these targeted priority recommendations are that

58
they will help to ensure the success of the system of long-term services and supports and can be acted upon in the next three years.
Programs and Services
Adequately support and increase the number of slots of all the existing Medicaid home and community-based services waivers to meet the needs of all eligible applicants.
In the State-funded tiers of the Connecticut Home Care Program for Elders, eliminate the required co-payment.
Identify skills needed for nursing facility residents who desire to transition back to the community and provide appropriate skill training and resources.
Expand funding for State-funded respite services, such as the Statewide Respite Program, the state-funded tiers of the Connecticut Home Care Program for Elders and the Department of Developmental Services in-home and out-of-home respite services in order to provide support to informal caregivers.
Support family caregivers through compensation with the development of the new Adult Family Living initiative.
Address isolation of all older adults and individuals with disabilities living in the community. Also, address the impact of isolation on elder abuse and exploitation.
Strengthen the connection of State and local services by strengthening the relationship to senior centers, municipal government offices and services offered locally.
Infrastructure
Achieve greater integration of and uniformity of administration of State long-term services and supports serving both older adults and people with disabilities and their families, and emphasize policies related to function as opposed to age or diagnosis.
Under the Balancing Incentive Program (BIP), create the BIP infrastructure investments of a consumer friendly statewide No Wrong Door system, a conflict free case management, and a uniform assessment tool.
With a focus upon hospital admission and discharge, use best efforts to divert individuals to an appropriate care setting of their choice.
Address the historical fragmentation of the Medicaid home and community-based
waivers, which are associated with specific age and diagnostic eligibility criteria.

59
o Explore the development of a broader 1915(i) State plan amendment to provide home and community-based supports based exclusively on functional limitations and financial need.
Provide timely eligibility decisions regarding eligibility in all government sponsored long-term services and supports programs.
Expand Aging and Disability Resource Centers (Community Choices) statewide in support of providing information, referral, assistance and LTSS options counseling.
Achieve greater integration of employment of persons with disabilities into the Money Follows the Person Rebalancing Initiative and home and community-based services.
Support improved coordination, communication and guidance among the medical care, behavioral health and long-term services and supports systems.
o Ensure that current and future initiatives such as Money Follows the Person,
Rightsizing, and the Demonstration to Integrate Care for Medicare-Medicaid
Enrollees (MMEs) are well coordinated and complementary.
o Support the development of electronic health records by providers of long-
term services and supports and exchange of electronic health records among
providers across the Connecticut health care system to streamline care
transitions, coordinate care delivery and improve quality and outcomes.
o Support a learning collaborative approach to bring together providers across
disciplines and perspectives, and to learn from older adults and individuals
with disabilities.
Change the names of the Long Term Care Planning Committee and the Long Term Care Advisory Council to the Long Term Services and Supports Planning Committee and the Long Term Services and Supports Advisory Council.
Financing
Achieve adequate and sustainable provider reimbursement levels that support the
cost of long-term services and supports and quality requirements for all segments of
the long-term services and supports continuum in order to ensure capacity to meet
the evolving needs and demographics of Connecticut residents.
Provide greater flexibility in the budgeting and use of Medicaid funds for long-term
services and supports.

60
Capture and reinvest cost savings across the long-term services and supports
continuum.
o Reinvest savings resulting from Money Follows the Person, the Balancing
Incentive Program and other emerging Medicaid long-term services and
supports programs to enhance the availability and capacity of home and
community based services.
Reform the Medicaid rate setting system to reflect quality, reimbursement related
to the actual costs of care, and uncompensated care for all LTSS providers across the
continuum consistent with long-term services and supports rebalancing, rightsizing
and a range of home and community based service initiatives.
Explore various methods to increase the private sector's greater involvement as a
payer of long-term services and supports.
o Explore the development of tax incentives for the purchase of private long-
term care insurance, including tax incentives for employer-based coverage.
Work with the Federal government to preserve Older Americans Act funding. This
federal funding source is currently at risk.
Quality
Enable a collaborative, flexible and efficient regulatory environment that is adaptive
and receptive to individual provider’s forward thinking ideas and planning. Such an
environment would encourage providers of the long-term services and supports
continuum to adjust, modernize and diversify their models of care to address
current and future consumer needs and expectations, which in turn should lead to
higher quality care.
The Departments of Public Health and Social Services should work together to ensure consistency among their respective regulations.
Review licensing certification requirements and Probate Court protocols (currently there is no licensing for conservators or guardians) for training of community-based formal caregivers, conservators and guardians to assure that the specialized needs of the individual, such as those with Alzheimer’s disease, are met and provide training where there are gaps.
Expand the scope of the Long-Term Care Ombudsman program to provide Ombudsman support to consumers receiving long-term services and supports regardless of setting in order to align the program with Medicaid LTSS rebalancing

61
efforts. Additional appropriations to the Long-Term Care Ombudsman program would be necessary to expand beyond their current jurisdiction.
Housing
Support programs that divert or transition individuals from nursing facilities or other
institutions to community housing options.
Address the community housing needs of nursing facility residents who are
returning to the community because they no longer need this level of care but have
lost their community residence.
Develop new housing alternatives for persons with serious and persistent mental
illness who do not need nursing facility level of care.
Support legislation that requires new homes to provide features to make it easier for
individuals with mobility-impairments to live in and visit.
Continue the progressive State investment in the development of housing that is
affordable and accessible for older adults and persons with disabilities.
Encourage the growth and development of community- based service models that
bring long- term services and supports to housing residents. Work with the federal
government to secure at-risk housing subsidy, preservation, and development funds.
Workforce
Endorse the full recommendations of the Long-Term Services and Supports
Workforce Development Strategic Plan.
http://www.cga.ct.gov/coa/pdfs/publications/2012/workforce%20plan%202.27.12.

62
VI. CONCLUSIONS Over the next 15 years Connecticut will be challenged to develop a long-term services and supports (LTSS) system that is person focused and directed and provides real choices for individuals with disabilities and their families. Many uncertainties could affect the level of demand for LTSS in Connecticut. Disability rates may decline, medical technologies may reduce the incidence of certain chronic diseases, or new conditions may arise that increase the demand for LTSS. There are no guarantees. However, we do know that Connecticut residents want a system that maximizes the opportunity for all persons, regardless of age or disability, to live in the community as independently as possible. We also know that current levels of Medicaid LTSS expenditures for institutional care and the significant reliance on public funds for LTSS will not allow Connecticut to reach its goal of real LTSS choices and to adequately meet a possibly growing demand for services and supports. The time to take steps to balance the system is now. As outlined in this Plan, the shifting of the ratio of home and community-based and institutional care, coupled with a larger role for private funds in the system, will position Connecticut to be responsive to the potential LTSS needs of our citizens in the short and long-term and will help realize its goal of a system driven by choice and consumer control.