original author jurgen schulte, university of technology ... · original author jurgen schulte,...
TRANSCRIPT
LESSON: Gravitational Acceleration
VERSION: v05
VERSION AUTHOR: Steven Tuttle, University of Technology Sydney
ORIGINAL AUTHOR Jurgen Schulte, University of Technology Sydney
RIG: Remote Inclined Plane Rig Laboratory
2 / 28
Labshare – UTS © 2010 v05
Gravitational Acceleration Lesson Incline Plane Rig
Table of Contents 1. LESSON GOALS .............................................................................................................................. 3
1.1 LESSON LEARNING OBJECTIVES ................................................................................................... 3
1.2 LESSON APPLICATION AREA .......................................................................................................... 3
2. LESSON OVERVIEW ........................................................................................................................ 4
2.1 ESTIMATED TIME TO COMPLETE THE LESSON ............................................................................. 5
2.1.1 ESTIMATED RIG TIME REQUIRED BY THE LESSON .............................................................. 5
2.1.2 LESSON IS TIMED ..................................................................................................................... 5
2.1.3 TIME ALLOWED ........................................................................................................................ 5
3. PREREQUISITES.............................................................................................................................. 6
4. PREWORK ....................................................................................................................................... 7
5. PRETEST ......................................................................................................................................... 8
6. RIG APPARATUS & MATERIALS ..................................................................................................... 9
7. RIG INTERFACE ............................................................................................................................. 13
8. LEARN MORE ................................................................................................................................ 14
9. LESSON ASSIGNMENT .................................................................................................................. 15
9.1 SUPPLEMENTAL ............................................................................................................................ 17
10. LESSON ASSESSMENT ................................................................................................................. 18
10.1 SUBMISSION DETAILS ................................................................................................................ 18
10.2 ASSESSMENT COMPONENTS .................................................................................................... 18
10.2.1 WRITING A GOOD LAB REPORT .......................................................................................... 18
10.3 MARKING SCHEME ..................................................................................................................... 22
10.3.1 METHOD OF MARKING ......................................................................................................... 22
TEACHER ONLY SECTION .................................................................................................................... 23
1. SOLUTIONS ....................................................................................................................................... 24
2. TEACHING MATERIAL ...................................................................................................................... 25
3 / 28
Labshare – UTS © 2010 v05
1. LESSON GOALS
This remotely conducted laboratory experiment demonstrates how general textbook theory can be employed to determine the magnitude of a physical constant commonly used in engineering applications. Students will use basic mechanics (Newton’s laws) to find the magnitude of the gravitational constant g, its experimental accuracy, precision, and uncertainty.
1.1 LESSON LEARNING OBJECTIVES
o Conduct an experiment at a remote location using computer interfaces and robotic control.
o Extend experimental and analytical skills developed during previous experimental work.
o Analyze real-time measured data sequences. o Determine a common physical constant utilizing data obtained standard
engineering equipment. o Communicate findings from abstract data in a written professional report.
1.2 LESSON APPLICATION AREA
Basic mechanics (Newton’s Laws) are utilized in many disciplines of science and engineering. For example, physics, civil engineering, and mechanical engineering all use basic mechanics.
4 / 28
Labshare – UTS © 2010 v05
2. LESSON OVERVIEW
You are asked to take on the role of an Australian Standards technical officer to determine the gravitational constant using this particular rig and materials provided. This is a friction experiment using an incline plane rig to determine the universal gravitational constant, g.
The angle of incline and selection of blocks can be controlled through a browser interface. A transducer measures the kinetic properties of the blocks, i.e., the rate at which a particular block changes its position per (real-time) time sampling interval. A real-time velocity versus time graph is plotted in the telecontrol interface. A tab delimited file time and velocity is available from the telecontrol interface. A camera provides real time images of the experiment, though there is network lag in the video stream. Generally speaking, you must do the following to successfully complete the lesson:
PREPARE for the experiment
o Read and understand the lesson learning objectives. o Read the lesson overview. o Take and pass the lesson pretest. o Review and become familiar the rig apparatus and rig telecontrol
interface. o Identify parameters needed to calculate g and related uncertainties.
CONDUCT the experiment o Login to remote labs o Connect to the remote rig video stream. o Connect to the remote rig telecontrol interface. o Execute the experiment procedure (multiple times with each block). o Collect and record data.
ANALYZE the experiment data o Determine the average vertical acceleration of blocks as function of the
sine of the incline angle. o Extrapolate the vertical accelerations to an angle of 90 degrees to find
g. REPORT the experiment results
o Prepare and submit a report containing your testing methods, analytic findings, and uncertainties.
5 / 28
Labshare – UTS © 2010 v05
2.1 ESTIMATED TIME TO COMPLETE THE LESSON
It is estimated that five hours (5 hr) will be required to complete this lesson. One hour preparation: thirty minutes on the rig: four and half hours for analysis and report writing.
2.1.1 ESTIMATED RIG TIME REQUIRED BY THE LESSON Use of the rig to conduct the experiment procedure is estimated to be thirty minutes (0.5 hr)
2.1.2 LESSON IS TIMED This lesson is not timed.
2.1.3 TIME ALLOWED Not applicable.

6 / 28
Labshare – UTS © 2010 v05
3. PREREQUISITES
Textbook familiarity with Newton’s Laws. Access to the internet. High school level maths.

7 / 28
Labshare – UTS © 2010 v05
4. PREWORK
This lesson does not have prework.
8 / 28
Labshare – UTS © 2010 v05
5. PRETEST This lesson requires you to complete a pretest.
The purpose of this pretest is to ensure you understand the basic concepts which underlie this experiment. You must pass this pretest before being granted access to the remote laboratory. You must answer ?? correctly to proceed. Otherwise, you will be asked to take the test again.
1. Lorem ipsum dolor sit amet, consectetur adipiscing elit. Maecenas non enim
felis, sed porttitor libero. Pellentesque et neque eget felis euismod laoreet ut quis dolor. A B C D
2. Lorem ipsum dolor sit amet, consectetur adipiscing elit. Maecenas non enim
felis, sed porttitor libero. Pellentesque et neque eget felis euismod laoreet ut quis dolor. A B C D
3. Lorem ipsum dolor sit amet, consectetur adipiscing elit. Maecenas non enim
felis, sed porttitor libero. Pellentesque et neque eget felis euismod laoreet ut quis dolor. A B C D
4. Lorem ipsum dolor sit amet, consectetur adipiscing elit. Maecenas non enim
felis, sed porttitor libero. Pellentesque et neque eget felis euismod laoreet ut quis dolor. A B C D
9 / 28
Labshare – UTS © 2010 v05
6. RIG APPARATUS & MATERIALS
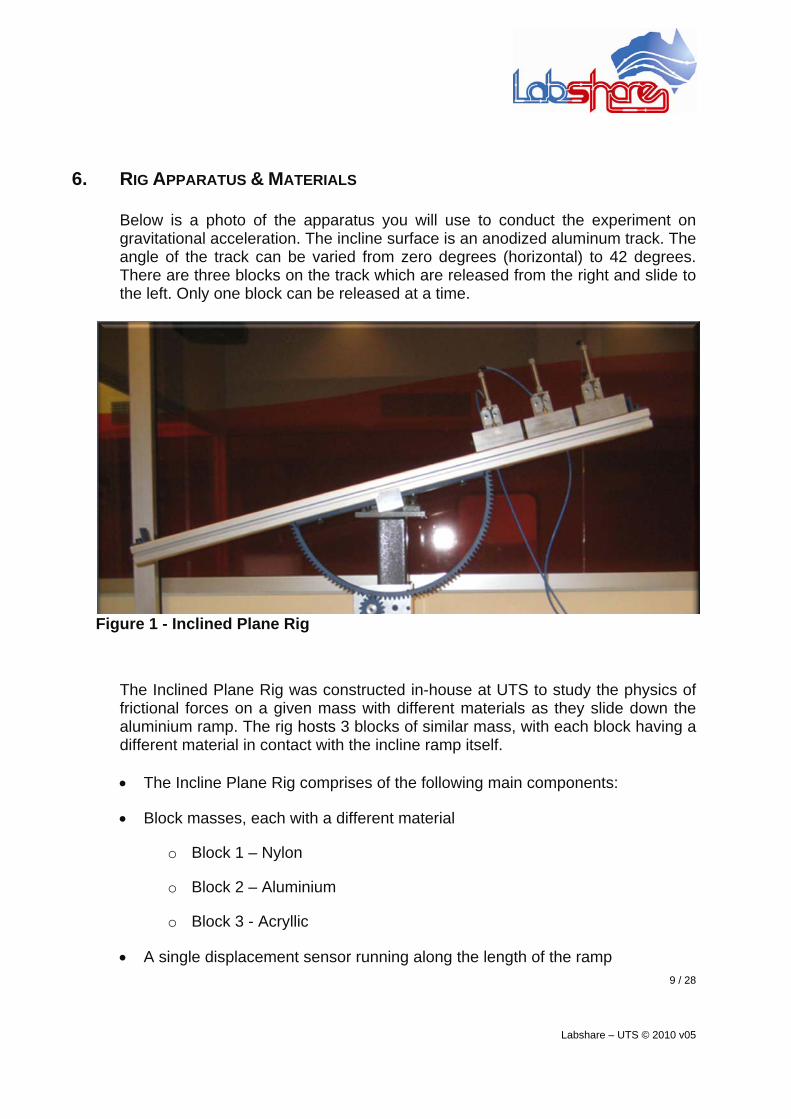
Below is a photo of the apparatus you will use to conduct the experiment on gravitational acceleration. The incline surface is an anodized aluminum track. The angle of the track can be varied from zero degrees (horizontal) to 42 degrees. There are three blocks on the track which are released from the right and slide to the left. Only one block can be released at a time.
Figure 1 - Inclined Plane Rig
The Inclined Plane Rig was constructed in-house at UTS to study the physics of frictional forces on a given mass with different materials as they slide down the aluminium ramp. The rig hosts 3 blocks of similar mass, with each block having a different material in contact with the incline ramp itself. The Incline Plane Rig comprises of the following main components:
Block masses, each with a different material
o Block 1 – Nylon
o Block 2 – Aluminium
o Block 3 - Acryllic
A single displacement sensor running along the length of the ramp
10 / 28
Labshare – UTS © 2010 v05
Cylinders which lock the blocks into position at either end of the ramp
A release stop so that all 3 blocks start from the same position each time
A motor and an encoder to drive and monitor the angle of the ramp
Limit switches beyond which the ramp will not incline
Data acquisition and control hardware
Web camera for visual feedback (integrated into the Control Software)
Control software front end written in LabVIEW
11 / 28
Labshare – UTS © 2010 v05
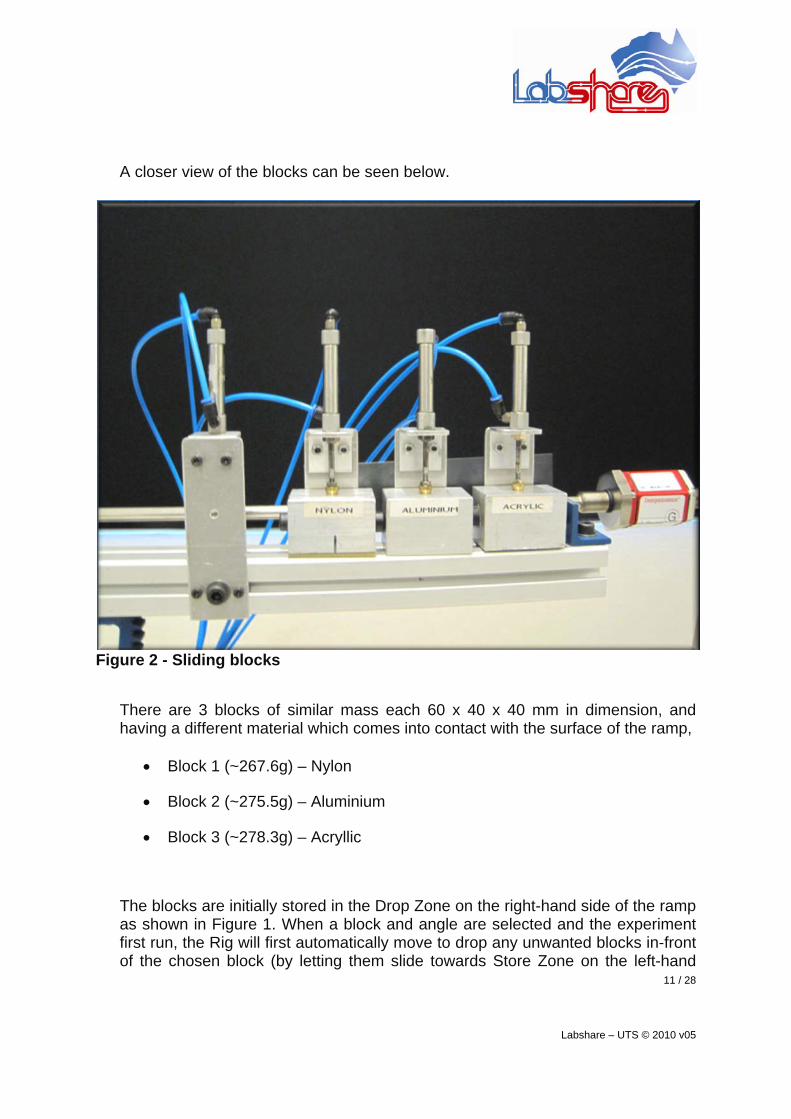
A closer view of the blocks can be seen below.
Figure 2 - Sliding blocks
There are 3 blocks of similar mass each 60 x 40 x 40 mm in dimension, and having a different material which comes into contact with the surface of the ramp,
Block 1 (~267.6g) – Nylon
Block 2 (~275.5g) – Aluminium
Block 3 (~278.3g) – Acryllic
The blocks are initially stored in the Drop Zone on the right-hand side of the ramp as shown in Figure 1. When a block and angle are selected and the experiment first run, the Rig will first automatically move to drop any unwanted blocks in-front of the chosen block (by letting them slide towards Store Zone on the left-hand

12 / 28
Labshare – UTS © 2010 v05
side of the rig) and then move this block into position against the Release Stop before settling at the target angle. When the user elects to release this block and begin measurement, it too will slide towards the Store Zone on the left and its displacement along the ramp recorded. Each block has a magnet embedded in the middle at the back from which its location along the ramp can be tracked via the displacement sensor.
13 / 28
Labshare – UTS © 2010 v05
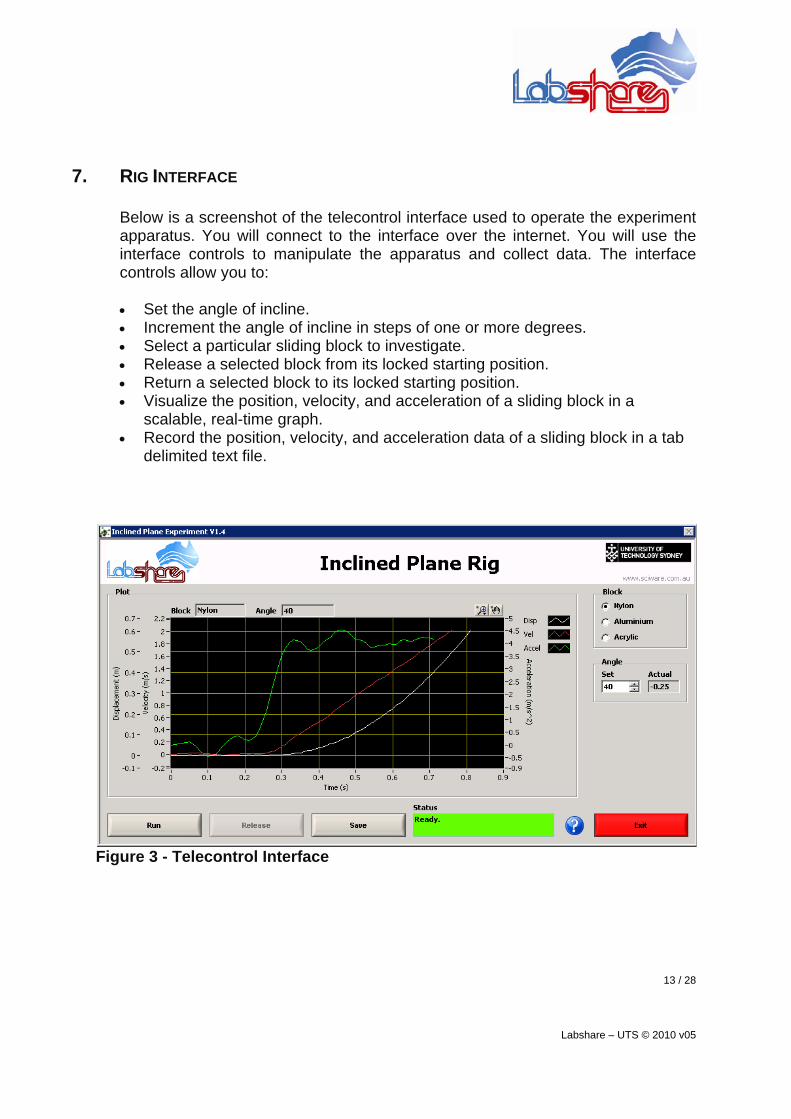
7. RIG INTERFACE
Below is a screenshot of the telecontrol interface used to operate the experiment apparatus. You will connect to the interface over the internet. You will use the interface controls to manipulate the apparatus and collect data. The interface controls allow you to: Set the angle of incline. Increment the angle of incline in steps of one or more degrees. Select a particular sliding block to investigate. Release a selected block from its locked starting position. Return a selected block to its locked starting position. Visualize the position, velocity, and acceleration of a sliding block in a
scalable, real-time graph. Record the position, velocity, and acceleration data of a sliding block in a tab
delimited text file.
Figure 3 - Telecontrol Interface
14 / 28
Labshare – UTS © 2010 v05
8. LEARN MORE
"Isaac Newton (1642–1727) is best known for having invented the calculus in the mid to late 1660s ...and for having formulated the theory of universal gravity — the latter in his Principia, the single most important work in the transformation of early modern natural philosophy into modern physical science." (http://plato.stanford.edu/entries/newton/)
Uses of Friction
(http://www.schoolforchampions.com/science/friction_uses.htm)
15 / 28
Labshare – UTS © 2010 v05
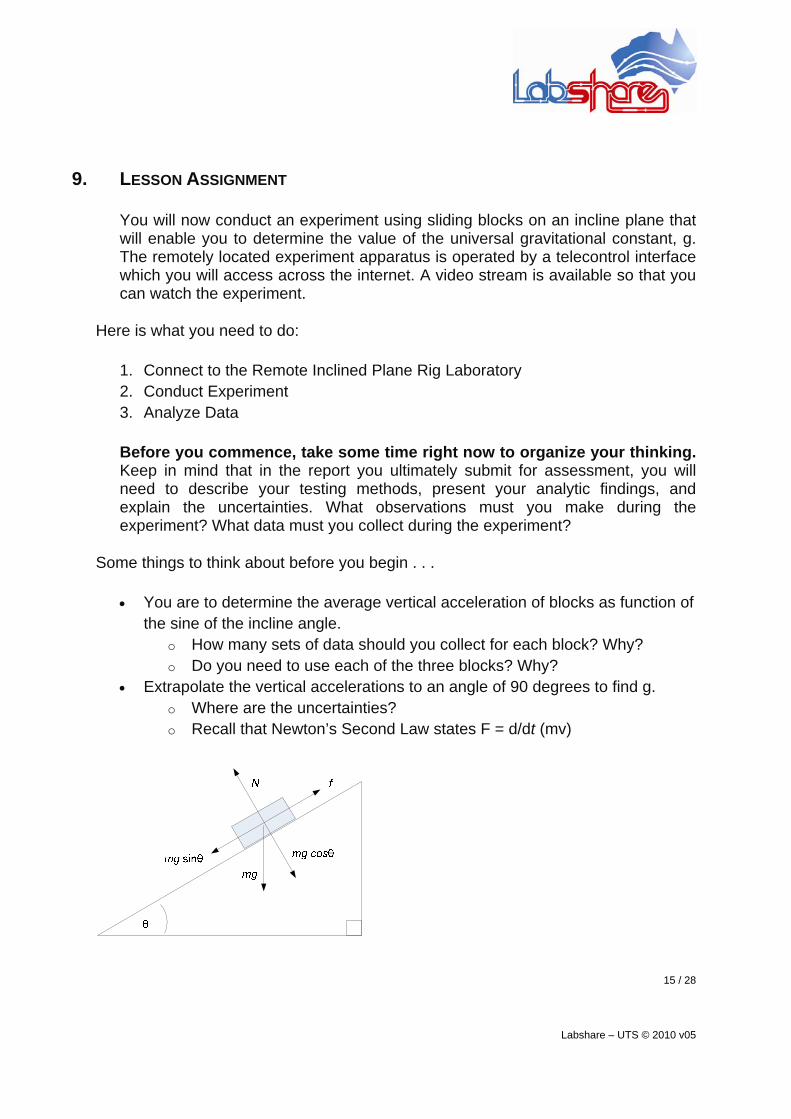
9. LESSON ASSIGNMENT You will now conduct an experiment using sliding blocks on an incline plane that will enable you to determine the value of the universal gravitational constant, g. The remotely located experiment apparatus is operated by a telecontrol interface which you will access across the internet. A video stream is available so that you can watch the experiment.
Here is what you need to do:
1. Connect to the Remote Inclined Plane Rig Laboratory 2. Conduct Experiment 3. Analyze Data
Before you commence, take some time right now to organize your thinking. Keep in mind that in the report you ultimately submit for assessment, you will need to describe your testing methods, present your analytic findings, and explain the uncertainties. What observations must you make during the experiment? What data must you collect during the experiment?
Some things to think about before you begin . . .
You are to determine the average vertical acceleration of blocks as function of the sine of the incline angle.
o How many sets of data should you collect for each block? Why? o Do you need to use each of the three blocks? Why?
Extrapolate the vertical accelerations to an angle of 90 degrees to find g. o Where are the uncertainties? o Recall that Newton’s Second Law states F = d/dt (mv)
16 / 28
Labshare – UTS © 2010 v05
Step 1: Connect to the Remote Inclined Plane Rig Laboratory
Open a new browser window and navigate to LabShare’s Sahara Labs Physics page, which is also the login page. http://138.25.49.202:7070/ Login with your credentials and proceed. For detailed instructions, please consult the Inclined Plane Rig User Guide I(forthcoming).
Step 2. Conduct Experiment
o Measure geometric properties of the incline and dynamic properties of the blocks.
o Measure dynamic properties of blocks at at least 4 different angles for each block.
Procedure
o Set angle of incline plane o Select block o Release block o Capture data o Reset and repeat
Step 3. Analyze Data
You should now have twelve sets of data (4 sets for each of the 3 blocks). You must now analyze these real-time measured data sequences.
o Determine the gravitational constant g for all three blocks at all measured angles.
o Determine the average gravitational constant g and its uncertainty for each block.
o Determine an average gravitational constant g for this rig, its uncertainty and the accuracy and precision of this particular experiment.
o Discuss any experimental uncertainties as well as any deviations from textbook theory.
17 / 28
Labshare – UTS © 2010 v05
You will prepare and submit a report containing your testing methods, analytic findings, and uncertainties. This report constitutes your assessable work and is discussed in Section 10 - Lesson Assessment -below.
9.1 SUPPLEMENTAL
This assignment does not have any supplemental materials.
Forthcoming: Inclined Plane Rig User Guide
18 / 28
Labshare – UTS © 2010 v05
10. LESSON ASSESSMENT
Now that you have completed the experiment and performed the data analysis, you must prepare and submit a report containing your testing methods, analytic findings, and uncertainties. To assist you in preparing and submitting your laboratory report, please consider the following:
10.1 SUBMISSION DETAILS
Due Date:
Only Microsoft Word or Adobe PDF will be accepted. Please submit your completed report via email attachment to your instructor by the due date.
10.2 ASSESSMENT COMPONENTS Your assessment for this lesson is based entirely on the report that you prepare and submit. This report must communicate your testing methods, analytic findings, and uncertainties. Some guidelines for writing a good lab report are now presented for your benefit.
10.2.1 WRITING A GOOD LAB REPORT
Please consider the following when writing your report. All engineers and scientists, whether they are advisers, technologists or consultants, have to prepare articles and reports detailing the work they have done, what they have found out and the implications of their results. An appreciation of what goes into a scientific report can best be acquired through practice in report writing as well as by critiquing articles prepared by others. The aim of this section is to provide guidelines for writing your report. A typical report will contain the following components:
o Title o Summary or abstract o Introduction o Materials and Methods o Results and Analysis o Discussion
19 / 28
Labshare – UTS © 2010 v05
o Acknowledgments o References
Title
Provide a meaningful title for your report.
Summary or Abstract
A summary is an overview of the experiment and its findings. It should be brief and avoid the detail that you will give in later sections. The goal is to get straight to the heart of the matter by explaining what you have done, why it is significant and what the major findings are. You might find this easier to write once you have completed the remainder of the report.
Introduction
The Introduction should contain the reason for carrying out the work, some discussions of background work which is useful for the reader to have, the reasons you decided on a particular method of taking measurements, which measurements should be made and the method of analysis. The Introduction should also contain a brief description of how the remainder of the report is structured.
Material and Methods
This section should contain sufficient information for the reader to be able to repeat the experimental work that you have undertaken. It should point out any difficulties that arose, for example, limitations of the measuring devices or problems in reproducing the experimental conditions. There may be insufficient measurements or there may be some doubt about whether measurements have been carried out properly. Ordinarily you would repeat ·such measurements but this may not be possible because of lack of time. You may decide to leave out anomalous or ambiguous results in order to make your conclusions clearer. Take care to explain fully your reasons for omitting these results because without such explanation it will appear you are just trying to fit preconceived conclusions.
20 / 28
Labshare – UTS © 2010 v05
Results and Analysis
This section presents the results of measurements taken, perhaps in a table, perhaps on a graph or perhaps in both ways. With these measurements some summarising information may be extracted. Your results should not be presented as a direct transcription from the laboratory notebook. You are not hiding results or taking short cuts by leaving out the individual records. You are being asked to demonstrate the ability to discriminate and interpret. Remember the reason for the investigation as presented in the 'Introduction' section should be the guide that directs the way you process your measurements. Tables, graphs and diagrams should be fully and correctly titled and should be understandable without the need to refer to the written part of the report. Similarly the text should be readable without the table and graphs.
Discussion
It will now be possible to make some recommendations, explore some implications or state some conclusions based on the work presented in the previous section. It will also be necessary to say how confident you are about your conclusions, what the limitations of your conclusions are and what is required if the study is to be extended into a wider area. You may also have recommendations on how to improve the methods of taking measurements. Present the major points of discussion first. These are related to the reason for carrying out the study. The other points should appear in subsequent paragraphs. Sometimes discussion can be difficult because the results are not as clear-cut as they could be. If this is the case you will have already mentioned in the 'Materials and Methods' section that some measurements may not be reliable.
Acknowledgments
If you have used extra data from another source such as another practical group then say so here. You may also wish to acknowledge suggestions you have received from a colleague or the demonstrator. Mention the particular suggestion that was made. Acknowledge any person who has helped you in preparing the report. The hallmarks of a good report are precision, clarity and, to a lesser extent, brevity. It follows that you should never hand in for assessment, an unchecked first draft of a report. Reading your own report to identify and correct errors will take a small amount of time compared with the improvements it will make. A second step, requiring no more time and often yielding a similar degree of improvement, is to ask a classmate (preferably not your partner in the
21 / 28
Labshare – UTS © 2010 v05
laboratory) to comment on it. Perhaps you can return the favour. This is not cheating. To use the critiquing of colleagues to produce an improved report (providing of course it is you who will make the eventual corrections and changes) is eminently scientific and laudable. Not only that, it is an excellent way of learning.
References
Here you should refer to books which provide background reading (eg. the first year text book). Give page numbers as well as title, author and publisher. You may have gone to the library to obtain some additional information. Once again be sure to give the specific page numbers for the relevant material.
22 / 28
Labshare – UTS © 2010 v05
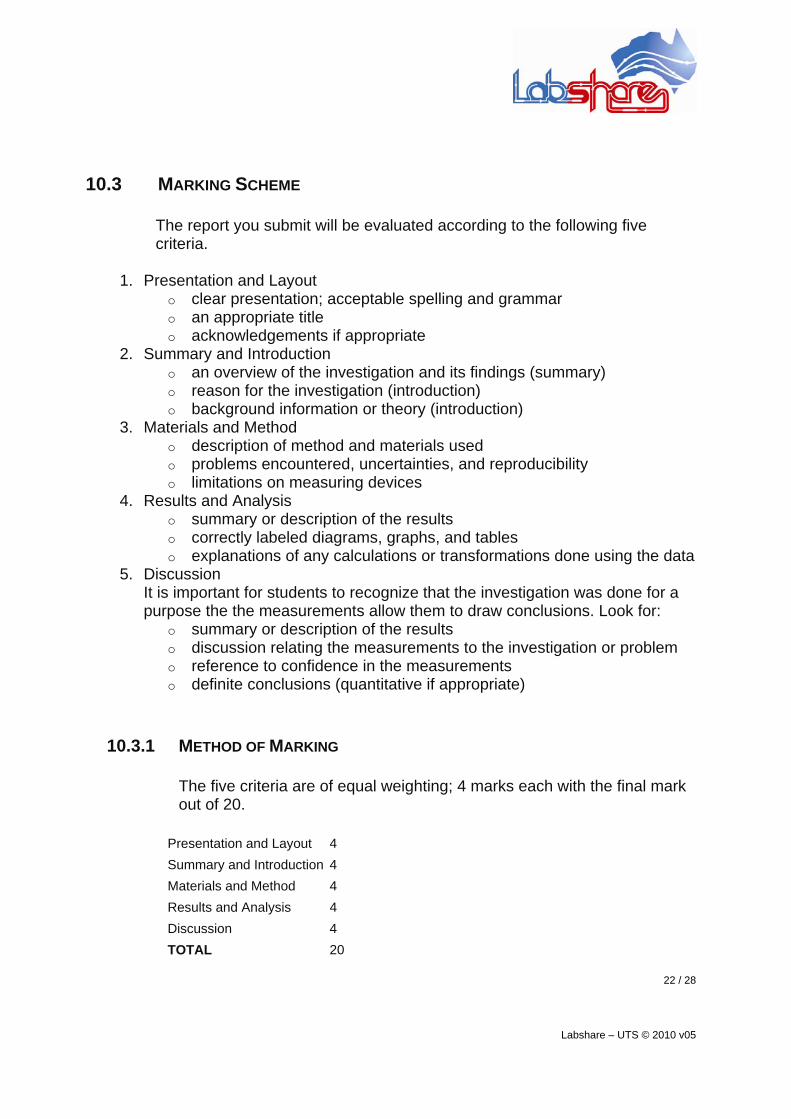
10.3 MARKING SCHEME
The report you submit will be evaluated according to the following five criteria.
1. Presentation and Layout
o clear presentation; acceptable spelling and grammar o an appropriate title o acknowledgements if appropriate
2. Summary and Introduction o an overview of the investigation and its findings (summary) o reason for the investigation (introduction) o background information or theory (introduction)
3. Materials and Method o description of method and materials used o problems encountered, uncertainties, and reproducibility o limitations on measuring devices
4. Results and Analysis o summary or description of the results o correctly labeled diagrams, graphs, and tables o explanations of any calculations or transformations done using the data
5. Discussion It is important for students to recognize that the investigation was done for a purpose the the measurements allow them to draw conclusions. Look for:
o summary or description of the results o discussion relating the measurements to the investigation or problem o reference to confidence in the measurements o definite conclusions (quantitative if appropriate)
10.3.1 METHOD OF MARKING The five criteria are of equal weighting; 4 marks each with the final mark out of 20.
Presentation and Layout 4
Summary and Introduction 4
Materials and Method 4
Results and Analysis 4
Discussion 4
TOTAL 20

23 / 28
Labshare – UTS © 2010 v05
TEACHER ONLY SECTION

24 / 28
Labshare – UTS © 2010 v05
1. SOLUTIONS Solutions are not yet available for this lesson.
Below, however, please find some example data.
exampledata.zip
25 / 28
Labshare – UTS © 2010 v05
2. TEACHING MATERIAL
Taking our Incline Plane Rig as an example - part of the standard coursework to go with the lab involves the study of friction (first year classical mechanics). The following link is to a 48min in-depth video lecture and demo on friction physics http://videolectures.net/mit801f99_lewin_lec08/. You may wish to integrate this video lecture as part of the Labshare lesson as it is already available in the public domain.
Moreover there seems to be a push towards moving lectures to form an "e-science video reference network" from a combination of universities, for instance:
o http://videolectures.net/site/about/ o http://videolectures.net/academia/
Here is a quick overview from Wikipedia that may prove helpful:
http://en.wikipedia.org/wiki/Inclined_plane#Calculation_of_forces_acting_on_an_object_on_an_inclined_plane
26 / 28
Labshare – UTS © 2010 v05
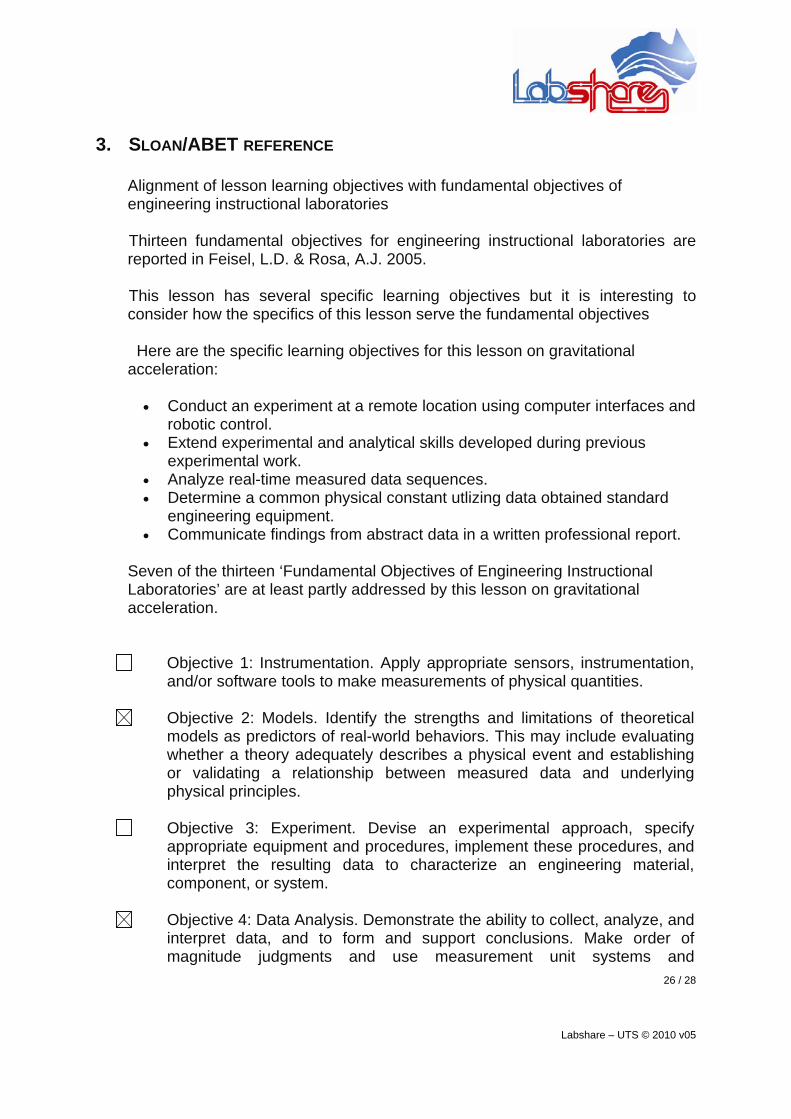
3. SLOAN/ABET REFERENCE
Alignment of lesson learning objectives with fundamental objectives of engineering instructional laboratories
Thirteen fundamental objectives for engineering instructional laboratories are reported in Feisel, L.D. & Rosa, A.J. 2005.
This lesson has several specific learning objectives but it is interesting to consider how the specifics of this lesson serve the fundamental objectives Here are the specific learning objectives for this lesson on gravitational acceleration:
Conduct an experiment at a remote location using computer interfaces and
robotic control. Extend experimental and analytical skills developed during previous
experimental work. Analyze real-time measured data sequences. Determine a common physical constant utlizing data obtained standard
engineering equipment. Communicate findings from abstract data in a written professional report.
Seven of the thirteen ‘Fundamental Objectives of Engineering Instructional Laboratories’ are at least partly addressed by this lesson on gravitational acceleration.
Objective 1: Instrumentation. Apply appropriate sensors, instrumentation, and/or software tools to make measurements of physical quantities.
Objective 2: Models. Identify the strengths and limitations of theoretical models as predictors of real-world behaviors. This may include evaluating whether a theory adequately describes a physical event and establishing or validating a relationship between measured data and underlying physical principles.
Objective 3: Experiment. Devise an experimental approach, specify appropriate equipment and procedures, implement these procedures, and interpret the resulting data to characterize an engineering material, component, or system.
Objective 4: Data Analysis. Demonstrate the ability to collect, analyze, and interpret data, and to form and support conclusions. Make order of magnitude judgments and use measurement unit systems and
27 / 28
Labshare – UTS © 2010 v05
conversions. \
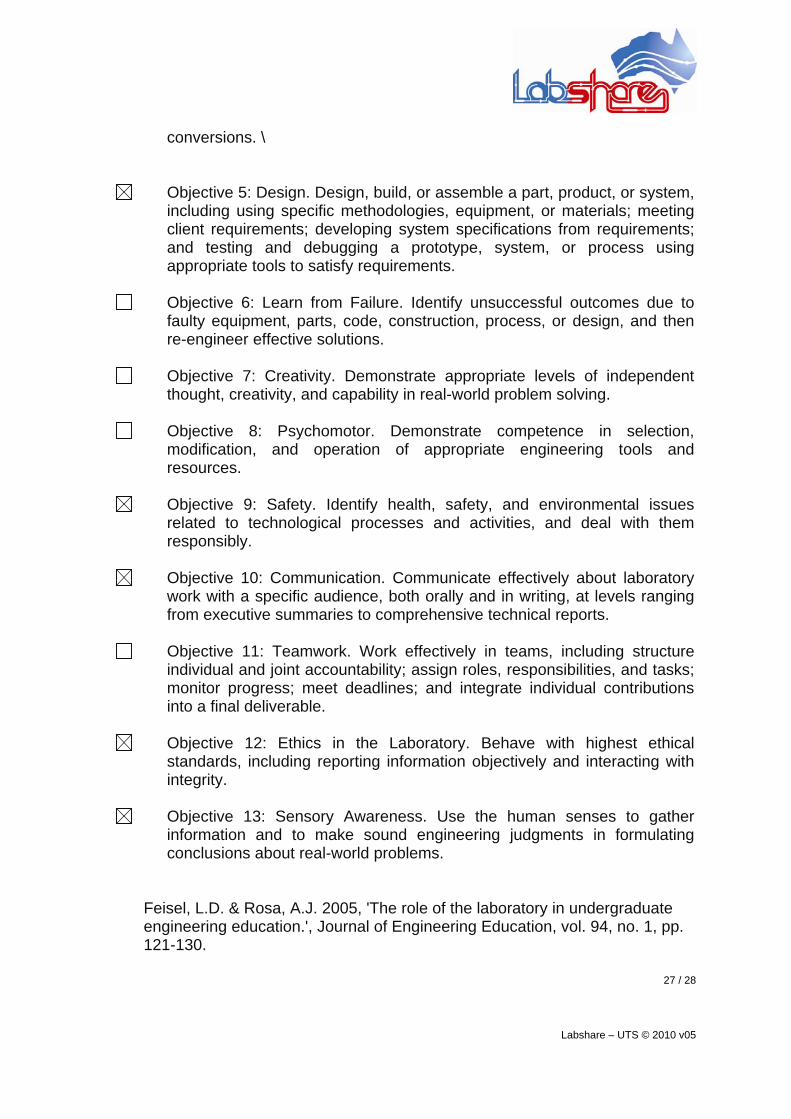
Objective 5: Design. Design, build, or assemble a part, product, or system, including using specific methodologies, equipment, or materials; meeting client requirements; developing system specifications from requirements; and testing and debugging a prototype, system, or process using appropriate tools to satisfy requirements.
Objective 6: Learn from Failure. Identify unsuccessful outcomes due to faulty equipment, parts, code, construction, process, or design, and then re-engineer effective solutions.
Objective 7: Creativity. Demonstrate appropriate levels of independent thought, creativity, and capability in real-world problem solving.
Objective 8: Psychomotor. Demonstrate competence in selection, modification, and operation of appropriate engineering tools and resources.
Objective 9: Safety. Identify health, safety, and environmental issues
related to technological processes and activities, and deal with them responsibly.
Objective 10: Communication. Communicate effectively about laboratory
work with a specific audience, both orally and in writing, at levels ranging from executive summaries to comprehensive technical reports.
Objective 11: Teamwork. Work effectively in teams, including structure
individual and joint accountability; assign roles, responsibilities, and tasks; monitor progress; meet deadlines; and integrate individual contributions into a final deliverable.
Objective 12: Ethics in the Laboratory. Behave with highest ethical
standards, including reporting information objectively and interacting with integrity.
Objective 13: Sensory Awareness. Use the human senses to gather
information and to make sound engineering judgments in formulating conclusions about real-world problems.
Feisel, L.D. & Rosa, A.J. 2005, 'The role of the laboratory in undergraduate engineering education.', Journal of Engineering Education, vol. 94, no. 1, pp. 121-130.
28 / 28
Labshare – UTS © 2010 v05
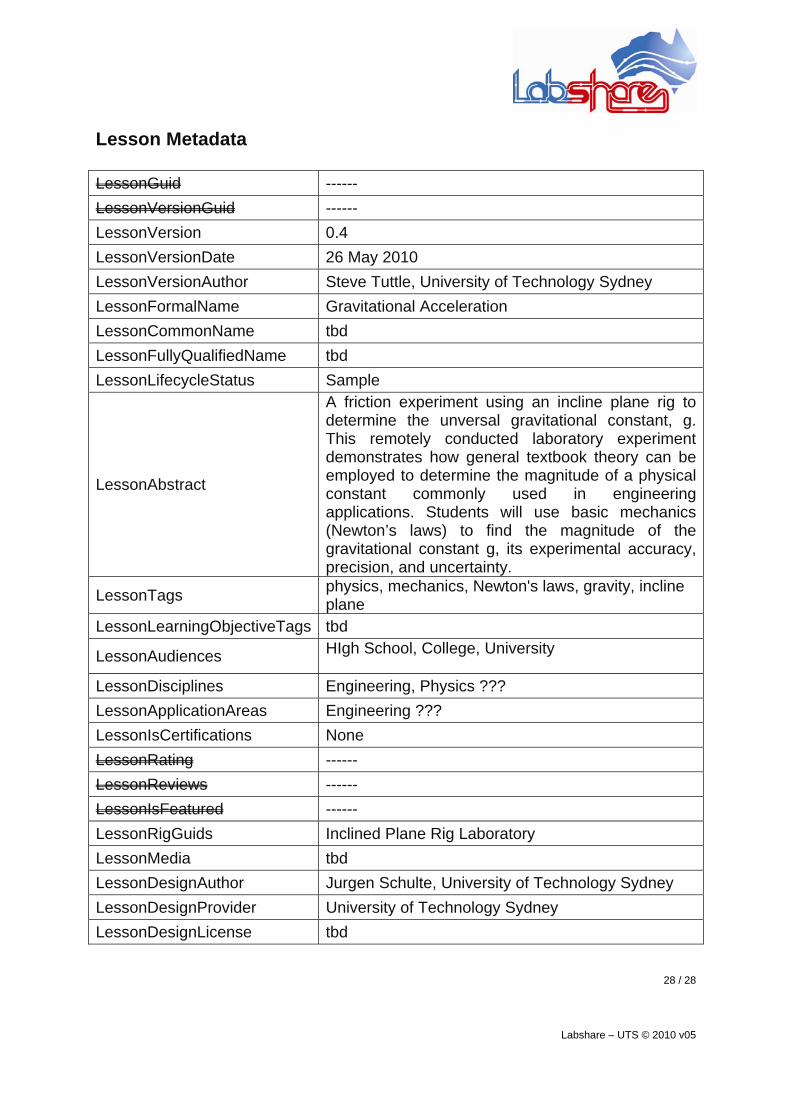
Lesson Metadata
LessonGuid ------
LessonVersionGuid ------
LessonVersion 0.4
LessonVersionDate 26 May 2010
LessonVersionAuthor Steve Tuttle, University of Technology Sydney
LessonFormalName Gravitational Acceleration
LessonCommonName tbd
LessonFullyQualifiedName tbd
LessonLifecycleStatus Sample
LessonAbstract
A friction experiment using an incline plane rig to determine the unversal gravitational constant, g. This remotely conducted laboratory experiment demonstrates how general textbook theory can be employed to determine the magnitude of a physical constant commonly used in engineering applications. Students will use basic mechanics (Newton’s laws) to find the magnitude of the gravitational constant g, its experimental accuracy, precision, and uncertainty.
LessonTags physics, mechanics, Newton's laws, gravity, incline plane
LessonLearningObjectiveTags tbd
LessonAudiences HIgh School, College, University
LessonDisciplines Engineering, Physics ???
LessonApplicationAreas Engineering ???
LessonIsCertifications None
LessonRating ------
LessonReviews ------
LessonIsFeatured ------
LessonRigGuids Inclined Plane Rig Laboratory
LessonMedia tbd
LessonDesignAuthor Jurgen Schulte, University of Technology Sydney
LessonDesignProvider University of Technology Sydney
LessonDesignLicense tbd