organizational profile – application summary...
TRANSCRIPT
1
Organizational Profile – Application Summary
Clarke American’s history dates back to 1874, with rootsin printing checks. Today’s customers have much moresophisticated requirements, and we have expanded ourtraditional line of check products with innovative, added-value products and services. We are proud of our past, with itsgrowth and prosperity, and are very excited about the future.P.1A ORGANIZATIONAL ENVIRONMENT
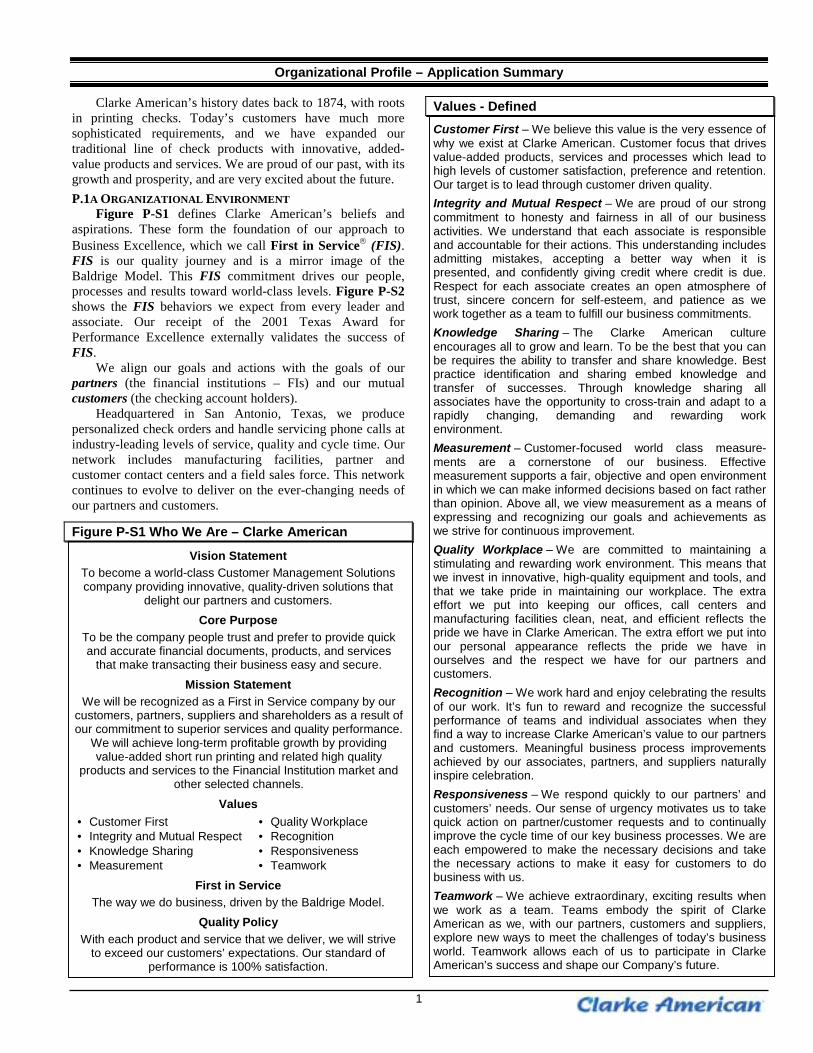
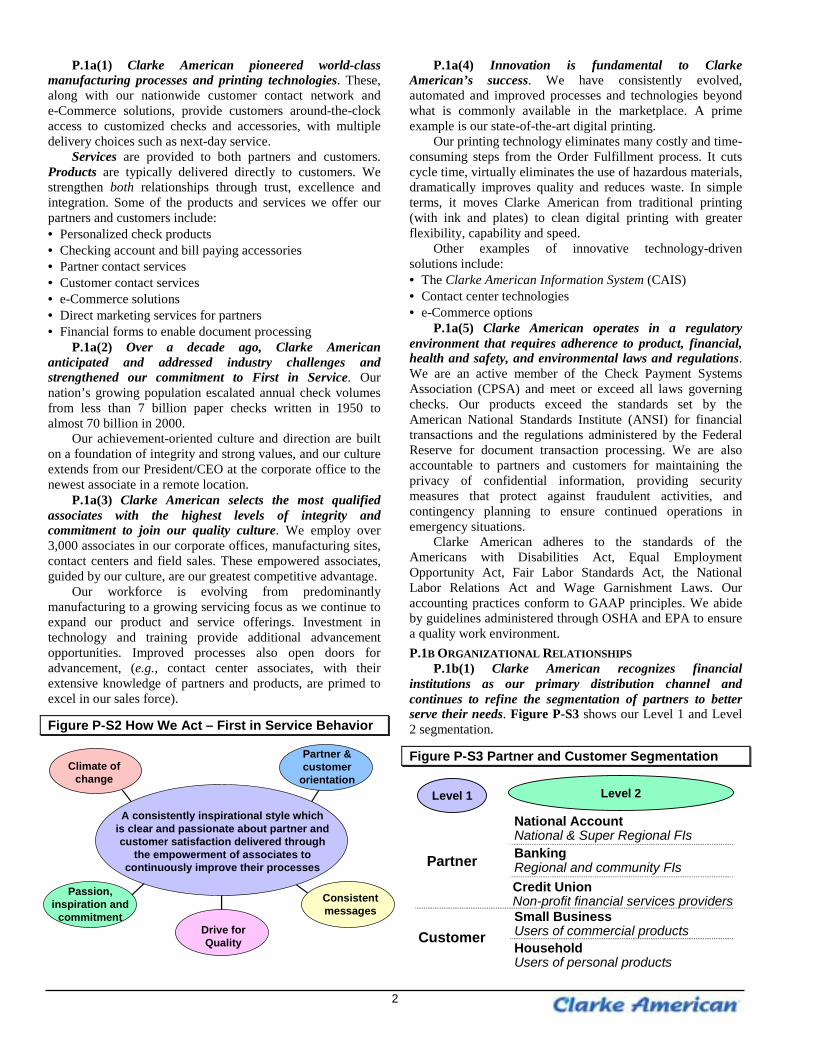
Figure P-S1 defines Clarke American’s beliefs andaspirations. These form the foundation of our approach toBusiness Excellence, which we call First in Service� (FIS).FIS is our quality journey and is a mirror image of theBaldrige Model. This FIS commitment drives our people,processes and results toward world-class levels. Figure P-S2shows the FIS behaviors we expect from every leader andassociate. Our receipt of the 2001 Texas Award forPerformance Excellence externally validates the success ofFIS.
We align our goals and actions with the goals of ourpartners (the financial institutions – FIs) and our mutualcustomers (the checking account holders).
Headquartered in San Antonio, Texas, we producepersonalized check orders and handle servicing phone calls atindustry-leading levels of service, quality and cycle time. Ournetwork includes manufacturing facilities, partner andcustomer contact centers and a field sales force. This networkcontinues to evolve to deliver on the ever-changing needs ofour partners and customers.
Figure P-S1 Who We Are – Clarke American
Vision StatementTo become a world-class Customer Management Solutionscompany providing innovative, quality-driven solutions that
delight our partners and customers.Core Purpose
To be the company people trust and prefer to provide quickand accurate financial documents, products, and services
that make transacting their business easy and secure.Mission Statement
We will be recognized as a First in Service company by ourcustomers, partners, suppliers and shareholders as a result ofour commitment to superior services and quality performance.
We will achieve long-term profitable growth by providingvalue-added short run printing and related high quality
products and services to the Financial Institution market andother selected channels.
Values• Customer First• Integrity and Mutual Respect• Knowledge Sharing• Measurement
• Quality Workplace• Recognition• Responsiveness• Teamwork
First in ServiceThe way we do business, driven by the Baldrige Model.
Quality PolicyWith each product and service that we deliver, we will strive
to exceed our customers’ expectations. Our standard ofperformance is 100% satisfaction.
Values - DefinedCustomer First – We believe this value is the very essence ofwhy we exist at Clarke American. Customer focus that drivesvalue-added products, services and processes which lead tohigh levels of customer satisfaction, preference and retention.Our target is to lead through customer driven quality.Integrity and Mutual Respect – We are proud of our strongcommitment to honesty and fairness in all of our businessactivities. We understand that each associate is responsibleand accountable for their actions. This understanding includesadmitting mistakes, accepting a better way when it ispresented, and confidently giving credit where credit is due.Respect for each associate creates an open atmosphere oftrust, sincere concern for self-esteem, and patience as wework together as a team to fulfill our business commitments.Knowledge Sharing – The Clarke American cultureencourages all to grow and learn. To be the best that you canbe requires the ability to transfer and share knowledge. Bestpractice identification and sharing embed knowledge andtransfer of successes. Through knowledge sharing allassociates have the opportunity to cross-train and adapt to arapidly changing, demanding and rewarding workenvironment.Measurement – Customer-focused world class measure-ments are a cornerstone of our business. Effectivemeasurement supports a fair, objective and open environmentin which we can make informed decisions based on fact ratherthan opinion. Above all, we view measurement as a means ofexpressing and recognizing our goals and achievements aswe strive for continuous improvement.Quality Workplace – We are committed to maintaining astimulating and rewarding work environment. This means thatwe invest in innovative, high-quality equipment and tools, andthat we take pride in maintaining our workplace. The extraeffort we put into keeping our offices, call centers andmanufacturing facilities clean, neat, and efficient reflects thepride we have in Clarke American. The extra effort we put intoour personal appearance reflects the pride we have inourselves and the respect we have for our partners andcustomers.Recognition – We work hard and enjoy celebrating the resultsof our work. It’s fun to reward and recognize the successfulperformance of teams and individual associates when theyfind a way to increase Clarke American’s value to our partnersand customers. Meaningful business process improvementsachieved by our associates, partners, and suppliers naturallyinspire celebration.Responsiveness – We respond quickly to our partners’ andcustomers’ needs. Our sense of urgency motivates us to takequick action on partner/customer requests and to continuallyimprove the cycle time of our key business processes. We areeach empowered to make the necessary decisions and takethe necessary actions to make it easy for customers to dobusiness with us.Teamwork – We achieve extraordinary, exciting results whenwe work as a team. Teams embody the spirit of ClarkeAmerican as we, with our partners, customers and suppliers,explore new ways to meet the challenges of today’s businessworld. Teamwork allows each of us to participate in ClarkeAmerican’s success and shape our Company’s future.
2
P.1a(1) Clarke American pioneered world-classmanufacturing processes and printing technologies. These,along with our nationwide customer contact network ande-Commerce solutions, provide customers around-the-clockaccess to customized checks and accessories, with multipledelivery choices such as next-day service.
Services are provided to both partners and customers.Products are typically delivered directly to customers. Westrengthen both relationships through trust, excellence andintegration. Some of the products and services we offer ourpartners and customers include:• Personalized check products• Checking account and bill paying accessories• Partner contact services• Customer contact services• e-Commerce solutions• Direct marketing services for partners• Financial forms to enable document processing
P.1a(2) Over a decade ago, Clarke Americananticipated and addressed industry challenges andstrengthened our commitment to First in Service. Ournation’s growing population escalated annual check volumesfrom less than 7 billion paper checks written in 1950 toalmost 70 billion in 2000.
Our achievement-oriented culture and direction are builton a foundation of integrity and strong values, and our cultureextends from our President/CEO at the corporate office to thenewest associate in a remote location.
P.1a(3) Clarke American selects the most qualifiedassociates with the highest levels of integrity andcommitment to join our quality culture. We employ over3,000 associates in our corporate offices, manufacturing sites,contact centers and field sales. These empowered associates,guided by our culture, are our greatest competitive advantage.
Our workforce is evolving from predominantlymanufacturing to a growing servicing focus as we continue toexpand our product and service offerings. Investment intechnology and training provide additional advancementopportunities. Improved processes also open doors foradvancement, (e.g., contact center associates, with theirextensive knowledge of partners and products, are primed toexcel in our sales force).
Figure P-S2 How We Act – First in Service Behavior
Climate ofchange
Partner &customer
orientation
Consistentmessages
Drive forQuality
Passion,inspiration and
commitment
A consistently inspirational style whichis clear and passionate about partner andcustomer satisfaction delivered through
the empowerment of associates tocontinuously improve their processes
P.1a(4) Innovation is fundamental to ClarkeAmerican’s success. We have consistently evolved,automated and improved processes and technologies beyondwhat is commonly available in the marketplace. A primeexample is our state-of-the-art digital printing.
Our printing technology eliminates many costly and time-consuming steps from the Order Fulfillment process. It cutscycle time, virtually eliminates the use of hazardous materials,dramatically improves quality and reduces waste. In simpleterms, it moves Clarke American from traditional printing(with ink and plates) to clean digital printing with greaterflexibility, capability and speed.
Other examples of innovative technology-drivensolutions include:• The Clarke American Information System (CAIS)• Contact center technologies• e-Commerce options
P.1a(5) Clarke American operates in a regulatoryenvironment that requires adherence to product, financial,health and safety, and environmental laws and regulations.We are an active member of the Check Payment SystemsAssociation (CPSA) and meet or exceed all laws governingchecks. Our products exceed the standards set by theAmerican National Standards Institute (ANSI) for financialtransactions and the regulations administered by the FederalReserve for document transaction processing. We are alsoaccountable to partners and customers for maintaining theprivacy of confidential information, providing securitymeasures that protect against fraudulent activities, andcontingency planning to ensure continued operations inemergency situations.
Clarke American adheres to the standards of theAmericans with Disabilities Act, Equal EmploymentOpportunity Act, Fair Labor Standards Act, the NationalLabor Relations Act and Wage Garnishment Laws. Ouraccounting practices conform to GAAP principles. We abideby guidelines administered through OSHA and EPA to ensurea quality work environment.P.1B ORGANIZATIONAL RELATIONSHIPS
P.1b(1) Clarke American recognizes financialinstitutions as our primary distribution channel andcontinues to refine the segmentation of partners to betterserve their needs. Figure P-S3 shows our Level 1 and Level2 segmentation.
Figure P-S3 Partner and Customer Segmentation
Level 1 Level 2
Partner
Customer
Credit UnionNon-profit financial services providersSmall BusinessUsers of commercial products
National AccountNational & Super Regional FIsBankingRegional and community FIs
HouseholdUsers of personal products
3
P.1b(2) Clarke American recognizes the importance ofbuilding long-term partnerships with key suppliers. Ourcontinued success in this area is critical to achieving ourgrowth. We expect suppliers to play a significant role inenhancing our competitive advantage as purchased costsbecome a larger portion of our total cost base and we seekadditional innovative solutions.
Suppliers are categorized as material, technology orservice providers. Supplier scorecards translate organizationalobjectives into supplier performance requirements; these aredeveloped jointly and reviewed at least three times each year.
We ensure key suppliers meet performance requirementsthrough workshops, conferences and meetings, and supplierscorecards. Using a “stoplight” model, suppliers are given anoverall green, yellow or red rating with action plansdeveloped to address gaps.P.2A COMPETITIVE ENVIRONMENT
P.2a(1) Clarke American has outperformed the marketin the FI check supply industry over the past five years.
Another source of competition to the FI check industry isdirect mail competitors with 20 percent of the US checkmarket. Their growth has come as a result of lower prices andconsumer awareness of the variety of check styles offeredthrough mail circulars. Three major players exist in thismarket.
P.2a(2) Our growth is attributable to our refined,consistent FIS strategy of partnering with FIs to providebest-in-class check printing and check-related services andproducts to enhance their businesses. During the early1990s, aggressive competitive pricing drove all checkproviders to significantly reduce costs. We increasedinvestment in our emerging FIS approach to ensureimprovement in quality, products and services. Thiscommitted strategy of differentiating through FIS is theprincipal factor in determining our success.
P.2b Clarke American uses a formal assessment tool,following a defined approach, to identify and analyzestrategic challenges. A semi-annual self-assessment,presented to the Board of Directors of our parent companydetails key strategic challenges and actions to monitor oralleviate the challenges. Clarke American addresses theserisks through our Strategic Plan Development and GoalDeployment processes.
P.2c We are passionately committed to our FIS journeythat has evolved to fully embody the Baldrige Criteria. FISincludes annual cycles of improvement and formal internaland external assessments that drive improvement actions.This approach, and the spirit of the Clarke American culture,creates an environment governed by process focus, yetinvigorated by innovative change. Our agility allows us tocontinually evolve to delight partners and customers.
An organizational zeal for both breakthrough andcontinuous improvement is driven through a sustained dualfocus on changing the business and running the business.Today’s rapidly changing business environment leads us tostrongly consider change the business opportunities whilebalancing run the business requirements. Every associateembraces this dual responsibility to both change and run thebusiness.
Our FIS Leadership System reaffirms the commitment toongoing improvement, with the Balanced Business Plan at itscore. Our High Performance Work System defines anorganization that promotes improvement and knowledgesharing through individual and team activity. Individualinitiative is expected of all associates through the S.T.A.R.suggestion program and Personal Development Plans, alignedwith company objectives through individual BusinessExcellence Agreements (BEA). The Team Excellence processdrives high performance teams through recognition, learningand knowledge sharing across the company. In addition, aFIS approach to process improvement, common FISlanguage, team disciplines and quality tools create an agileworkforce that communicates well and responds quickly andeffectively to improvement opportunities.
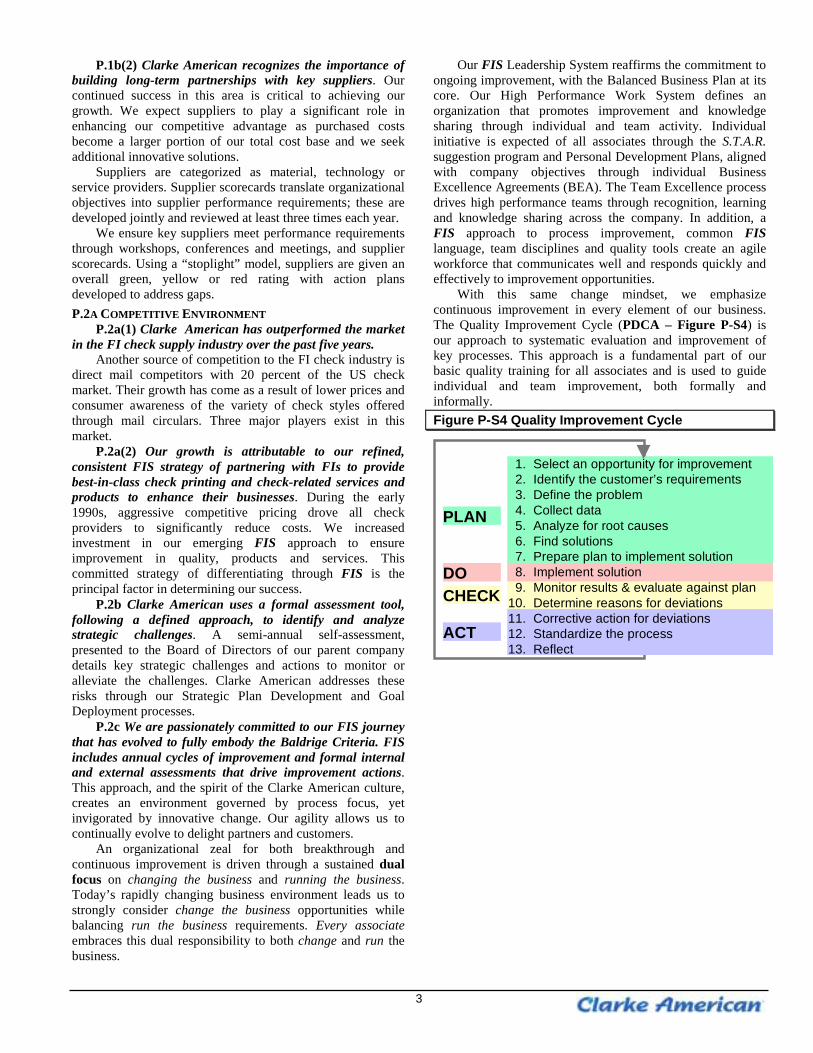
With this same change mindset, we emphasizecontinuous improvement in every element of our business.The Quality Improvement Cycle (PDCA – Figure P-S4) isour approach to systematic evaluation and improvement ofkey processes. This approach is a fundamental part of ourbasic quality training for all associates and is used to guideindividual and team improvement, both formally andinformally.Figure P-S4 Quality Improvement Cycle
ACT
PLAN
CHECKDO
1. Select an opportunity for improvement2. Identify the customer’s requirements3. Define the problem4. Collect data5. Analyze for root causes6. Find solutions7. Prepare plan to implement solution8. Implement solution9. Monitor results & evaluate against plan
10. Determine reasons for deviations11. Corrective action for deviations12. Standardize the process13. Reflect
4
Figure 1.1-S1 FIS Leadership SystemFigure 1.1-S1 FIS Leadership System
Partners &Members
Associates & Teams
Processes& Suppliers
Shareholders & CommunitiesReview
& AdjustReview
& Adjust
Learn& Innovate
Learn& Innovate
Performto Plan
Performto Plan
Communicate& Align
Communicate& Align
Set Direction& Plan
Set Direction& Plan
7
3
6
5
4
1
2
8
Category 1 – Leadership – Application Summary
Clarke American’s Key Leadership Team (KLT) is thepowerful, visionary leadership force that drives the companyto performance excellence in everything we do. The KLTincludes our President and Chief Executive Officer, our ChiefOperating Officer, the General Managers (GMs) of ourbusiness divisions, and the Vice Presidents (VPs) whochampion each of our core and enabling processes. Leaders atall levels live our values and model the CEO’s passion forexcellence and strong customer focus and cascade that energythroughout the organization.1.1 ORGANIZATIONAL LEADERSHIP
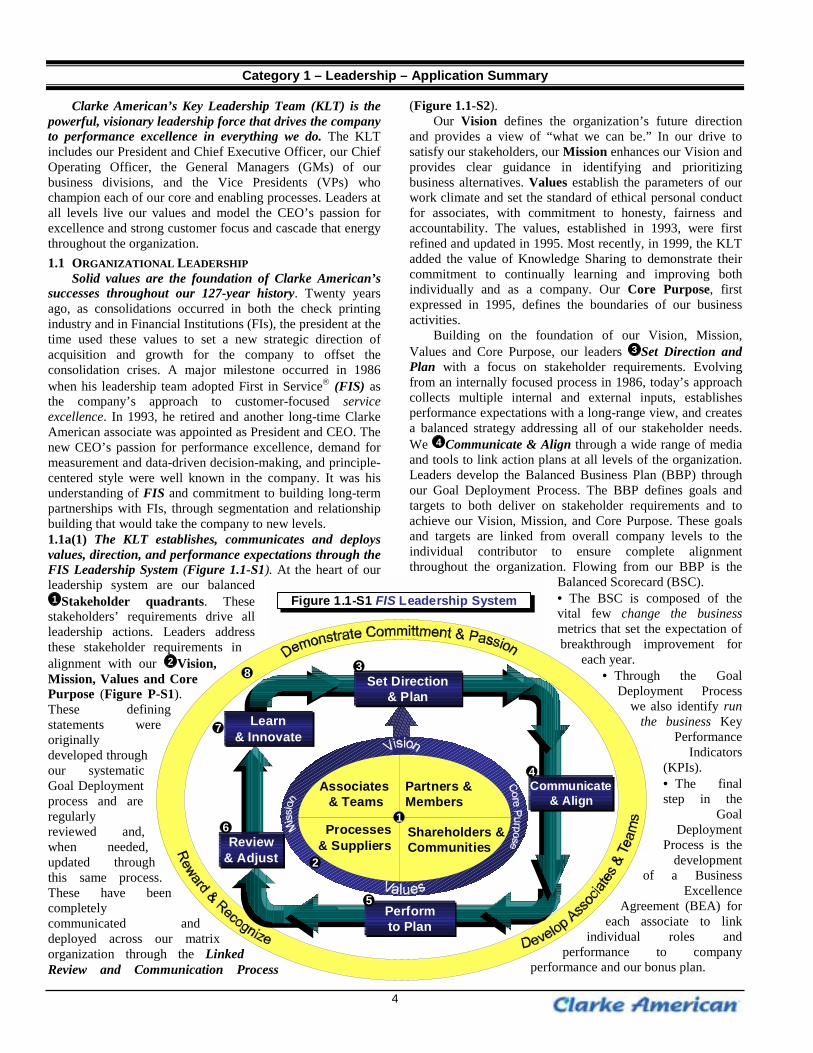
Solid values are the foundation of Clarke American’ssuccesses throughout our 127-year history. Twenty yearsago, as consolidations occurred in both the check printingindustry and in Financial Institutions (FIs), the president at thetime used these values to set a new strategic direction ofacquisition and growth for the company to offset theconsolidation crises. A major milestone occurred in 1986when his leadership team adopted First in Service� (FIS) asthe company’s approach to customer-focused serviceexcellence. In 1993, he retired and another long-time ClarkeAmerican associate was appointed as President and CEO. Thenew CEO’s passion for performance excellence, demand formeasurement and data-driven decision-making, and principle-centered style were well known in the company. It was hisunderstanding of FIS and commitment to building long-termpartnerships with FIs, through segmentation and relationshipbuilding that would take the company to new levels.1.1a(1) The KLT establishes, communicates and deploysvalues, direction, and performance expectations through theFIS Leadership System (Figure 1.1-S1). At the heart of ourleadership system are our balanced1 Stakeholder quadrants. These
stakeholders’ requirements drive allleadership actions. Leaders addressthese stakeholder requirements inalignment with our 2 Vision,Mission, Values and CorePurpose (Figure P-S1).These definingstatements wereoriginallydeveloped throughour systematicGoal Deploymentprocess and areregularlyreviewed and,when needed,updated throughthis same process.These have beencompletelycommunicated anddeployed across our matrixorganization through the LinkedReview and Communication Process
(Figure 1.1-S2).Our Vision defines the organization’s future direction
and provides a view of “what we can be.” In our drive tosatisfy our stakeholders, our Mission enhances our Vision andprovides clear guidance in identifying and prioritizingbusiness alternatives. Values establish the parameters of ourwork climate and set the standard of ethical personal conductfor associates, with commitment to honesty, fairness andaccountability. The values, established in 1993, were firstrefined and updated in 1995. Most recently, in 1999, the KLTadded the value of Knowledge Sharing to demonstrate theircommitment to continually learning and improving bothindividually and as a company. Our Core Purpose, firstexpressed in 1995, defines the boundaries of our businessactivities.
Building on the foundation of our Vision, Mission,Values and Core Purpose, our leaders 3 Set Direction andPlan with a focus on stakeholder requirements. Evolvingfrom an internally focused process in 1986, today’s approachcollects multiple internal and external inputs, establishesperformance expectations with a long-range view, and createsa balanced strategy addressing all of our stakeholder needs.We 4 Communicate & Align through a wide range of mediaand tools to link action plans at all levels of the organization.Leaders develop the Balanced Business Plan (BBP) throughour Goal Deployment Process. The BBP defines goals andtargets to both deliver on stakeholder requirements and toachieve our Vision, Mission, and Core Purpose. These goalsand targets are linked from overall company levels to theindividual contributor to ensure complete alignmentthroughout the organization. Flowing from our BBP is the
Balanced Scorecard (BSC).• The BSC is composed of thevital few change the businessmetrics that set the expectation ofbreakthrough improvement for
each year.• Through the Goal
Deployment Processwe also identify run
the business KeyPerformance
Indicators(KPIs).• The finalstep in the
GoalDeployment
Process is thedevelopment
of a BusinessExcellence
Agreement (BEA) foreach associate to link
individual roles andperformance to company
performance and our bonus plan.
5
While our Goal Deployment process is our primary toolfor communicating and aligning the organization, we alsocommunicate values, direction and expectations to associatesthrough a variety of mechanisms.
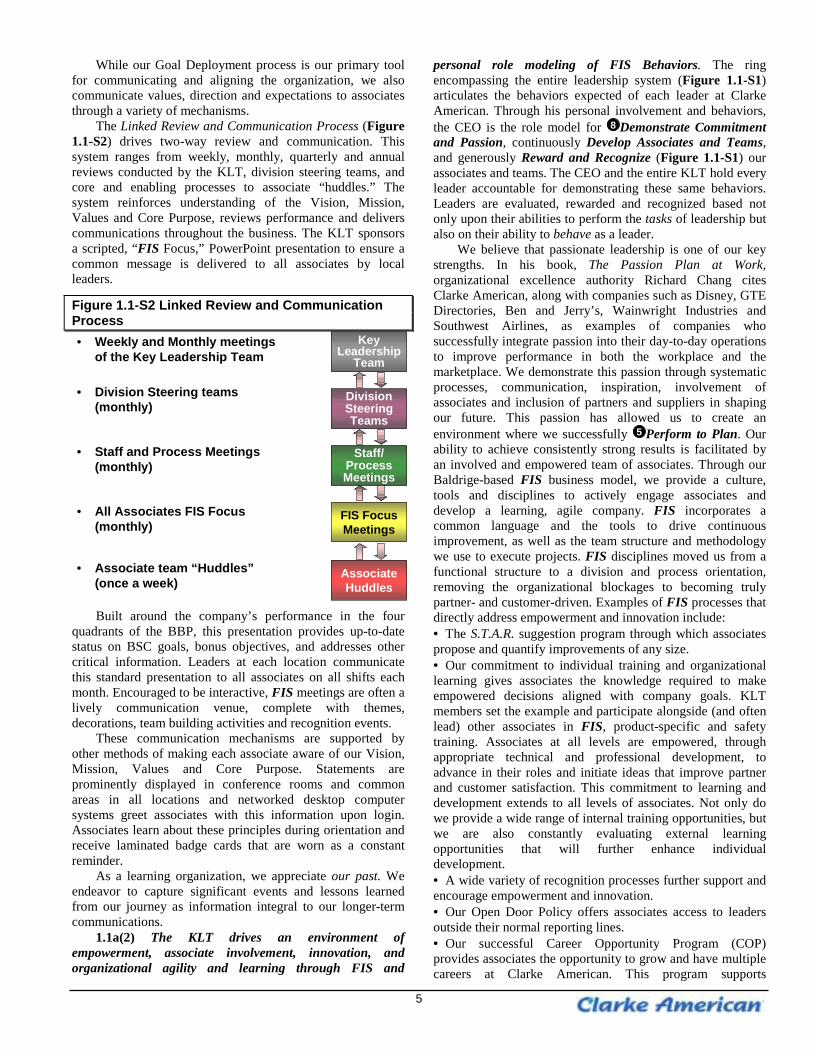
The Linked Review and Communication Process (Figure1.1-S2) drives two-way review and communication. Thissystem ranges from weekly, monthly, quarterly and annualreviews conducted by the KLT, division steering teams, andcore and enabling processes to associate “huddles.” Thesystem reinforces understanding of the Vision, Mission,Values and Core Purpose, reviews performance and deliverscommunications throughout the business. The KLT sponsorsa scripted, “FIS Focus,” PowerPoint presentation to ensure acommon message is delivered to all associates by localleaders.
Figure 1.1-S2 Linked Review and CommunicationProcess• Weekly and Monthly meetings
of the Key Leadership Team
• Division Steering teams(monthly)
• Staff and Process Meetings(monthly)
• All Associates FIS Focus(monthly)
• Associate team “Huddles”(once a week)
KeyLeadership
Team
DivisionSteeringTeams
Staff/ProcessMeetings
AssociateHuddles
FIS FocusMeetings
Built around the company’s performance in the fourquadrants of the BBP, this presentation provides up-to-datestatus on BSC goals, bonus objectives, and addresses othercritical information. Leaders at each location communicatethis standard presentation to all associates on all shifts eachmonth. Encouraged to be interactive, FIS meetings are often alively communication venue, complete with themes,decorations, team building activities and recognition events.
These communication mechanisms are supported byother methods of making each associate aware of our Vision,Mission, Values and Core Purpose. Statements areprominently displayed in conference rooms and commonareas in all locations and networked desktop computersystems greet associates with this information upon login.Associates learn about these principles during orientation andreceive laminated badge cards that are worn as a constantreminder.
As a learning organization, we appreciate our past. Weendeavor to capture significant events and lessons learnedfrom our journey as information integral to our longer-termcommunications.
1.1a(2) The KLT drives an environment ofempowerment, associate involvement, innovation, andorganizational agility and learning through FIS and
personal role modeling of FIS Behaviors. The ringencompassing the entire leadership system (Figure 1.1-S1)articulates the behaviors expected of each leader at ClarkeAmerican. Through his personal involvement and behaviors,the CEO is the role model for 8 Demonstrate Commitmentand Passion, continuously Develop Associates and Teams,and generously Reward and Recognize (Figure 1.1-S1) ourassociates and teams. The CEO and the entire KLT hold everyleader accountable for demonstrating these same behaviors.Leaders are evaluated, rewarded and recognized based notonly upon their abilities to perform the tasks of leadership butalso on their ability to behave as a leader.
We believe that passionate leadership is one of our keystrengths. In his book, The Passion Plan at Work,organizational excellence authority Richard Chang citesClarke American, along with companies such as Disney, GTEDirectories, Ben and Jerry’s, Wainwright Industries andSouthwest Airlines, as examples of companies whosuccessfully integrate passion into their day-to-day operationsto improve performance in both the workplace and themarketplace. We demonstrate this passion through systematicprocesses, communication, inspiration, involvement ofassociates and inclusion of partners and suppliers in shapingour future. This passion has allowed us to create anenvironment where we successfully 5 Perform to Plan. Ourability to achieve consistently strong results is facilitated byan involved and empowered team of associates. Through ourBaldrige-based FIS business model, we provide a culture,tools and disciplines to actively engage associates anddevelop a learning, agile company. FIS incorporates acommon language and the tools to drive continuousimprovement, as well as the team structure and methodologywe use to execute projects. FIS disciplines moved us from afunctional structure to a division and process orientation,removing the organizational blockages to becoming trulypartner- and customer-driven. Examples of FIS processes thatdirectly address empowerment and innovation include:• The S.T.A.R. suggestion program through which associatespropose and quantify improvements of any size.• Our commitment to individual training and organizationallearning gives associates the knowledge required to makeempowered decisions aligned with company goals. KLTmembers set the example and participate alongside (and oftenlead) other associates in FIS, product-specific and safetytraining. Associates at all levels are empowered, throughappropriate technical and professional development, toadvance in their roles and initiate ideas that improve partnerand customer satisfaction. This commitment to learning anddevelopment extends to all levels of associates. Not only dowe provide a wide range of internal training opportunities, butwe are also constantly evaluating external learningopportunities that will further enhance individualdevelopment.• A wide variety of recognition processes further support andencourage empowerment and innovation.• Our Open Door Policy offers associates access to leadersoutside their normal reporting lines.• Our successful Career Opportunity Program (COP)provides associates the opportunity to grow and have multiplecareers at Clarke American. This program supports
6
organizational learning through sharing of best practices andideas as associates move into various divisions or processes.Personal growth opportunities through upward and lateralmovement within the company help develop “associates forlife.”
Common language and tools let us quickly assemblededicated teams of varying sizes and duration anywherewithin the company, with confidence that they canimmediately become productive.
1.1b(1) The KLT reviews organizational performanceusing the continuous planning cycle (Figure 2.1-S1), ourannual Business Excellence Assessment, and a system ofquarterly, monthly and weekly review meetings(Figure 1.1-S2). These approaches allow us to 6 Review &Adjust performance and continuously facilitate improvement.
Through this structured set of weekly, monthly andquarterly reviews of operational performance and rapidlychanging market conditions, leaders assess performance andprogress towards short-term goals. During mid-year andannual plan reviews, the KLT reviews progress toward long-term goals and strategic direction. When they identifyopportunities for corrective action, plans are quickly modifiedand deployed through divisions and processes to ensuredelivery of performance commitments.
In these various reviews, the KLT tracks performance inboth our change the business BSC goals and in our run thebusiness KPIs. Company KPIs include current performancetargets and results. Our breakthrough performance measuresare reported through our BSC. In these review sessions, wealso track competitive performance through the partner andcustomer listening posts and associate needs through theannual Associate Opinion Survey.
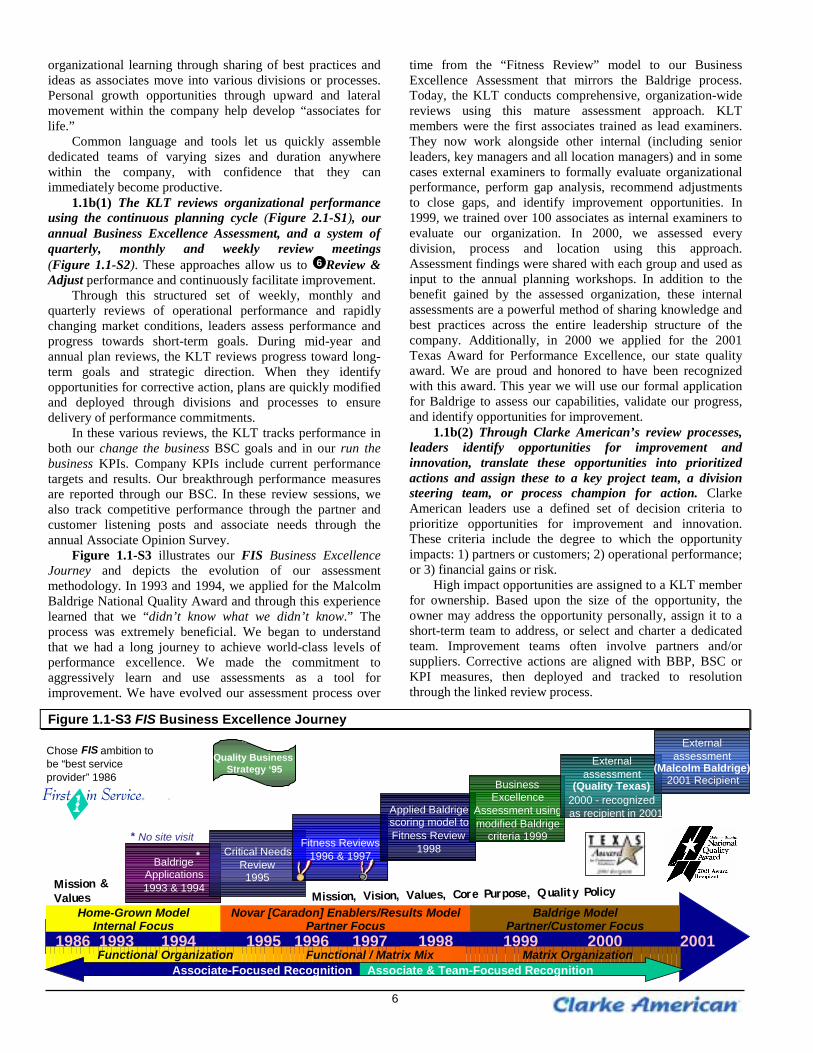
Figure 1.1-S3 illustrates our FIS Business ExcellenceJourney and depicts the evolution of our assessmentmethodology. In 1993 and 1994, we applied for the MalcolmBaldrige National Quality Award and through this experiencelearned that we “didn’t know what we didn’t know.” Theprocess was extremely beneficial. We began to understandthat we had a long journey to achieve world-class levels ofperformance excellence. We made the commitment toaggressively learn and use assessments as a tool forimprovement. We have evolved our assessment process over
time from the “Fitness Review” model to our BusinessExcellence Assessment that mirrors the Baldrige process.Today, the KLT conducts comprehensive, organization-widereviews using this mature assessment approach. KLTmembers were the first associates trained as lead examiners.They now work alongside other internal (including seniorleaders, key managers and all location managers) and in somecases external examiners to formally evaluate organizationalperformance, perform gap analysis, recommend adjustmentsto close gaps, and identify improvement opportunities. In1999, we trained over 100 associates as internal examiners toevaluate our organization. In 2000, we assessed everydivision, process and location using this approach.Assessment findings were shared with each group and used asinput to the annual planning workshops. In addition to thebenefit gained by the assessed organization, these internalassessments are a powerful method of sharing knowledge andbest practices across the entire leadership structure of thecompany. Additionally, in 2000 we applied for the 2001Texas Award for Performance Excellence, our state qualityaward. We are proud and honored to have been recognizedwith this award. This year we will use our formal applicationfor Baldrige to assess our capabilities, validate our progress,and identify opportunities for improvement.
1.1b(2) Through Clarke American’s review processes,leaders identify opportunities for improvement andinnovation, translate these opportunities into prioritizedactions and assign these to a key project team, a divisionsteering team, or process champion for action. ClarkeAmerican leaders use a defined set of decision criteria toprioritize opportunities for improvement and innovation.These criteria include the degree to which the opportunityimpacts: 1) partners or customers; 2) operational performance;or 3) financial gains or risk.
High impact opportunities are assigned to a KLT memberfor ownership. Based upon the size of the opportunity, theowner may address the opportunity personally, assign it to ashort-term team to address, or select and charter a dedicatedteam. Improvement teams often involve partners and/orsuppliers. Corrective actions are aligned with BBP, BSC orKPI measures, then deployed and tracked to resolutionthrough the linked review process.
Figure 1.1-S3 FIS Business Excellence Journey
Chose FIS ambition tobe “best serviceprovider” 1986
* No site visit
BaldrigeApplications1993 & 1994
1986 1993 1994 1995 1996 1997 1998 1999 2000 2001
Critical NeedsReview1995
Fitness Reviews1996 & 1997
Home-Grown ModelInternal Focus
Novar [Caradon] Enablers/Results Model Partner Focus
Baldrige ModelPartner/Customer Focus
Matrix OrganizationFunctional Organization Functional / Matrix MixAssociate-Focused Recognition Associate & Team-Focused Recognition
Mission & Values Mission, Vision, Values, Core Purpose, Quality Policy
Applied Baldrigescoring model toFitness Review
1998*
BusinessExcellence
Assessment usingmodified Baldrige
criteria 1999
Externalassessment
(Quality Texas)2000 - recognizedas recipient in 2001
Quality Business Strategy ‘95
Externalassessment
(Malcolm Baldrige)2001 Recipient
7
1.1b(3) We use multiple leadership measurement andevaluation tools and feedback mechanisms to improve bothindividual leadership performance and our leadershipsystem. Using these approaches, our leaders 7 Learn &Innovate (Figure 1.1-S1). This final step embodies thedisciplines of continuous organizational learning-understanding our performance, learning from our successesand opportunities, learning from best-in-class organizations,and revising our processes to drive improvement.
A comprehensive 360° Review Process was piloted bythe KLT in 2000 to allow for feedback to leaders. Results ofthis pilot are currently being evaluated for feedback,enhancement and expansion to other levels of leadership.
The Leadership Effectiveness Survey and LeadershipAssessment evaluate leaders against ten leadershipcompetencies. Results drive annual Personal DevelopmentPlan (PDP) action item development. As a refinement to theprocess, the Leadership Assessment was automated in 2001.
Each senior leader tracks individual progress againstcompany strategies and desired leadership behaviors acrossthe four quadrants of the BBP through the LeadershipScorecard (LSC). The LSC is an element of the leader’sperformance review.
The annual Associate Opinion Survey (AOS) contains asection that evaluates leadership effectiveness. Data collectedthrough this process are reviewed at an organizational level toidentify overall leadership opportunities and at a work grouplevel to identify individual leader opportunities. The KLTprioritizes and acts on overall leadership opportunities.Individual leaders review survey results and identify personaldevelopment opportunities that become a part of each leader’sPDP.
These approaches to evaluating and improving theleadership system and individual leadership capabilities haveproven effective.1.2 PUBLIC RESPONSIBILITY AND CITIZENSHIPClarke American takes an active leadership role in majorindustry and regulatory associations to ensure we areproactive in our approach to public responsibility. We alsoactively participate in programs that support the communitieswhere we conduct business.
1.2a(1) The KLT, as part of the strategic GoalDeployment process (Figure 2.1-S2), evaluates key areas ofpotential societal impact of our products, services andprocesses. If any issues arise, they are addressed at each stageof the planning, development and deployment process.
1.2a(2) In Goal Deployment, leaders capture and useinput from all stakeholders, particularly our partners andcustomers to anticipate and address public concerns withour products, services or processes. These studies, coupledwith ongoing benchmarking of best-in-class organizations,allow us to identify potential concerns and develop processesto address those concerns. Our leadership involvement inregulatory groups further ensures that we are giving ampleattention to this critical issue.
1.2a(3) Integrity and Mutual Respect are the foundationof all interactions with partners, customers and suppliers, aswell as among associates. These characteristics were part ofClarke American’s culture long before they were expressed aspart of our values in 1993. They gained even greater emphasiswhen incorporated into FIS communications and processes.We take a very proactive approach to ensuring that ourassociates will all demonstrate ethical business behavior.Rather than rely on traditional methods to train, monitor,report and retain, we focus most of our resources towardhiring associates who share our values. The AssociateHandbook, last updated in 2000, clearly states the behaviorsassociated with integrity that are required of all associates.When the Leadership Assessment was created in 1998,“Acting With Integrity” was included as one of the sixsections, with seven questions directly addressing this value.The Leadership Effectiveness Survey, created in 1999,addresses this value both directly and indirectly in thefeedback it solicits to ensure all leaders are role models forappropriate behaviors.
In 1999, Clarke American contracted with an outside firmto present a four-hour class on legal and ethical issues to allleadership, further emphasizing the behaviors associated withhonesty and integrity that are required of our associates. Thisclass also furnished information on how to deal with anyviolations. Because of our proactive hiring practices, we havehigh levels of success in recruiting and hiring associates whoshare our values.
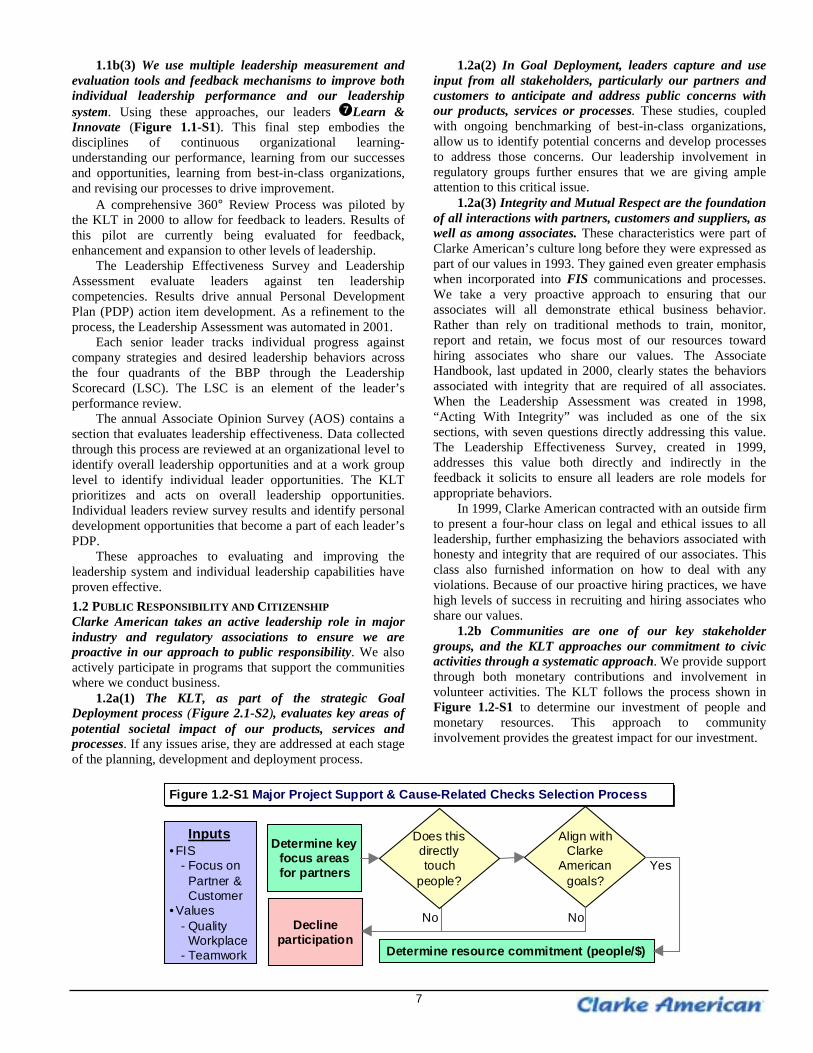
1.2b Communities are one of our key stakeholdergroups, and the KLT approaches our commitment to civicactivities through a systematic approach. We provide supportthrough both monetary contributions and involvement involunteer activities. The KLT follows the process shown inFigure 1.2-S1 to determine our investment of people andmonetary resources. This approach to communityinvolvement provides the greatest impact for our investment.
Inputs• FIS
- Focus on Partner &Customer
• Values- Quality
Workplace- Teamwork
Determine keyfocus areasfor partners
Align withClarke
Americangoals?
Declineparticipation
Determine resource commitment (people/$)
No
Yes
No
Does thisdirectlytouch
people?
Figure 1.2-S1 Major Project Support & Cause-Related Checks Selection ProcessFigure 1.2-S1 Major Project Support & Cause-Related Checks Selection Process
8
Our current corporate support is focused in three keyareas 1) overall community—United Way (UW) 2)education—Junior Achievement (JA); and 3) healthcare—Juvenile Diabetes Foundation (JDF). The United Way is ourprincipal, nationwide charitable activity. Associates enjoyparticipating in UW fund raising and service projects in thecommunities where we have a manufacturing operation orcontact center. Additionally, outside San Antonio, plant orcontact center managers identify two local causes to supportin addition to UW. This enables the company to providesupport where it is most needed.
In 1998, Clarke American began working with the UWof San Antonio and Bexar County to help them adopt ClarkeAmerican’s FIS process improvement methods. In addition
to training, we provided additional hours consulting with UWleadership on incorporating FIS techniques into their processes.At the end of the training, a business review report, similar to aBaldrige feedback report, was provided to the UW leadershipteam. This effort received “rave” reviews from the Director ofthe local United Way.
Clarke American has taken a proactive approach to manysocietal concerns through the creation of “cause-relatedchecking products” in partnership with a number of nationalorganizations. We produce checks and related merchandise withdesigns for eight causes including Save the Children, NationalBreast Cancer Organization, Wildlife Preservation Trust, ABetter Chance and others.
Category 2 – Strategic Planning – Application Summary
JanJul
Apr
Oct
Feb
Aug
Sep Nov
Dec
Jun
MayMar
PLANPLAN
DELIVERDELIVER
REVIEWREVIEW
THIN
KTH
INK
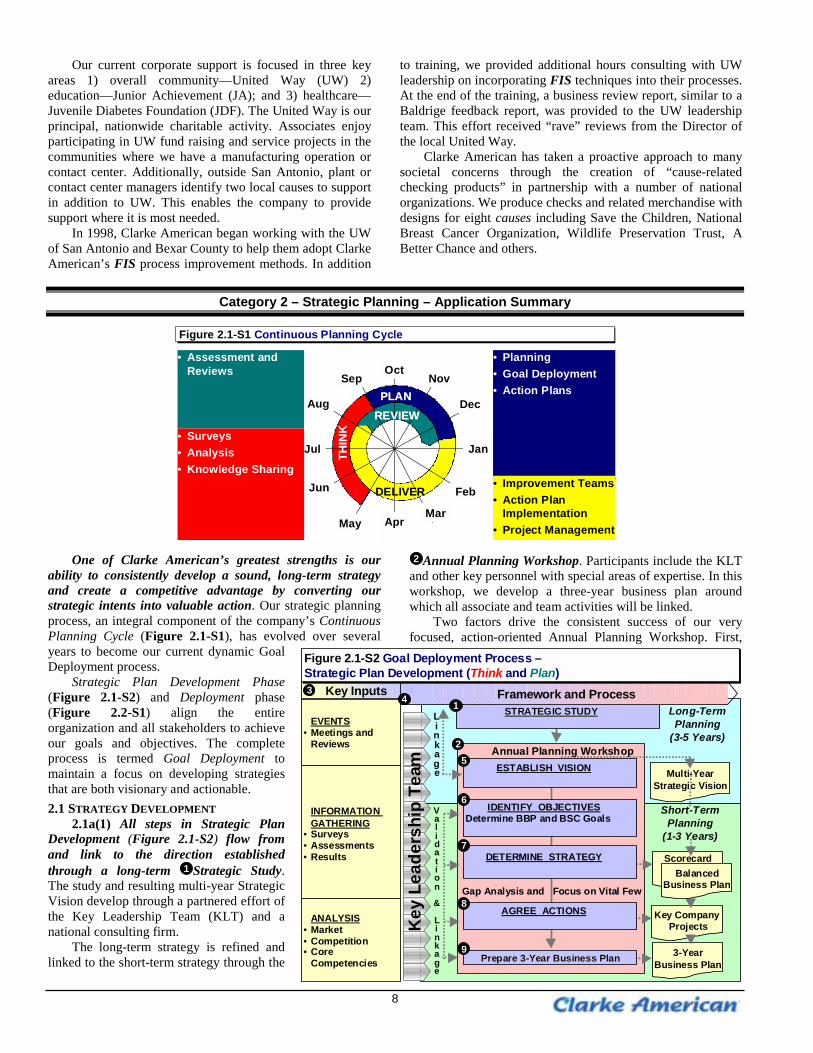
• Assessment andReviews
• Surveys• Analysis• Knowledge Sharing
• Planning• Goal Deployment• Action Plans
• Improvement Teams• Action Plan
Implementation• Project Management
Figure 2.1-S1 Continuous Planning CycleFigure 2.1-S1 Continuous Planning Cycle
One of Clarke American’s greatest strengths is ourability to consistently develop a sound, long-term strategyand create a competitive advantage by converting ourstrategic intents into valuable action. Our strategic planningprocess, an integral component of the company’s ContinuousPlanning Cycle (Figure 2.1-S1), has evolved over severalyears to become our current dynamic GoalDeployment process.
Strategic Plan Development Phase(Figure 2.1-S2) and Deployment phase(Figure 2.2-S1) align the entireorganization and all stakeholders to achieveour goals and objectives. The completeprocess is termed Goal Deployment tomaintain a focus on developing strategiesthat are both visionary and actionable.2.1 STRATEGY DEVELOPMENT
2.1a(1) All steps in Strategic PlanDevelopment (Figure 2.1-S2) flow fromand link to the direction establishedthrough a long-term 1 Strategic Study.The study and resulting multi-year StrategicVision develop through a partnered effort ofthe Key Leadership Team (KLT) and anational consulting firm.
The long-term strategy is refined andlinked to the short-term strategy through the
2 Annual Planning Workshop. Participants include the KLTand other key personnel with special areas of expertise. In thisworkshop, we develop a three-year business plan aroundwhich all associate and team activities will be linked.
Two factors drive the consistent success of our veryfocused, action-oriented Annual Planning Workshop. First,
Key Inputs
Multi-YearStrategic Vision
3-YearBusiness Plan
STRATEGIC STUDYSTRATEGIC STUDY
ESTABLISH VISION
IDENTIFY OBJECTIVESDetermine BBP and BSC Goals
Key Company Projects
Scorecard
Gap Analysis and Focus on Vital FewGap Analysis and Focus on Vital Few
Long-TermPlanning
(3-5 Years)
Short-TermPlanning
(1-3 Years)
Annual Planning WorkshopAnnual Planning Workshop
INFORMATION GATHERING
• Surveys• Assessments• Results
ANALYSIS• Market• Competition• Core
Competencies
EVENTS• Meetings and
Reviews
Key
Lea
ders
hip
Team
Linkage
Validation
&
Linkage
DETERMINE STRATEGY
AGREE ACTIONS
Prepare 3-Year Business PlanPrepare 3-Year Business Plan
3
6
7
8
9
52
Framework and Process4 1
Figure 2.1-S2 Goal Deployment Process –Strategic Plan Development (Think and Plan)Figure 2.1-S2 Goal Deployment Process –Strategic Plan Development (Think and Plan)
BalancedBusiness Plan
9
valuable 3 Key Inputs gathered and disseminated prior to themeeting inform participants about partner and customerrequirements, and other key items. Second, the 4 KeyLeadership Team come to the meeting passionate andprepared to participate, each representing their area ofexpertise. The workshop begins with a long-term visionperspective and works back to shorter-term objectives andactivities through four primary steps:1. Establish Vision 5
2. Identify Objectives 6
3. Determine Strategy 7
4. Agree upon Strategic Actions 8Upon completion of the Annual Planning Workshop, weprepare a 9 3-Year Business Plan using the objectives,strategies and projects approved by the KLT.
2.1a(2) We consider a wide range of internal andexternal inputs in our strategic studies and annual planningprocess. Competitive information is integrated throughout theplanning and execution of our strategy.
During development of the Balanced Business Plan, eachdivision and process assesses their operational andtechnological needs.
Our strategic study includes an analysis of staffing needs,by job type, to accomplish our strategy, and considers existingstaff and core competencies. We review and update theseneeds through goal deployment to ensure the proper resourcesare trained or hired and adequate funding is established.
We assess supplier capabilities and needs through ourcategory management process. Based upon knowledge ofpartner and customer requirements and of the businessdirection and vision, category management teams developsupply strategies and plans to meet current and future partnerand business requirements.
During development of the BBP, the KLT reviewsfinancial results, forecasts and trends to determine resourcerequirements and other parameters that will impact planopportunities. Financial information is prepared and presentedby both the Business Development and Operational Financedepartments during key input review. Business Developmentfocuses on our performance relative to competitors andprovides insight on both financial advantages andopportunities for improvement. Operational Finance focuseson internal performance using information gathered throughannual, quarterly and monthly revenue and expense forecastsprepared by each division and process.
2.1b(1) Clarke American establishes high-level, long-term strategic objectives during development of the strategicvision. We define shorter-term objectives, linked to thevision, during goal deployment.
2.1b(2) Clarke American’s strategic objectivesspecifically address our risks and challenges. For eachchallenge, we establish one or more initiatives to minimize oreliminate the risks.
Strategic objectives must balance the needs of all keystakeholders. We do this through effective use of the BBP.Reviewing and incorporating the needs of all stakeholders,while driving company actions through all four quadrants ofthe BBP, ensures an effective balance of focus and resources.
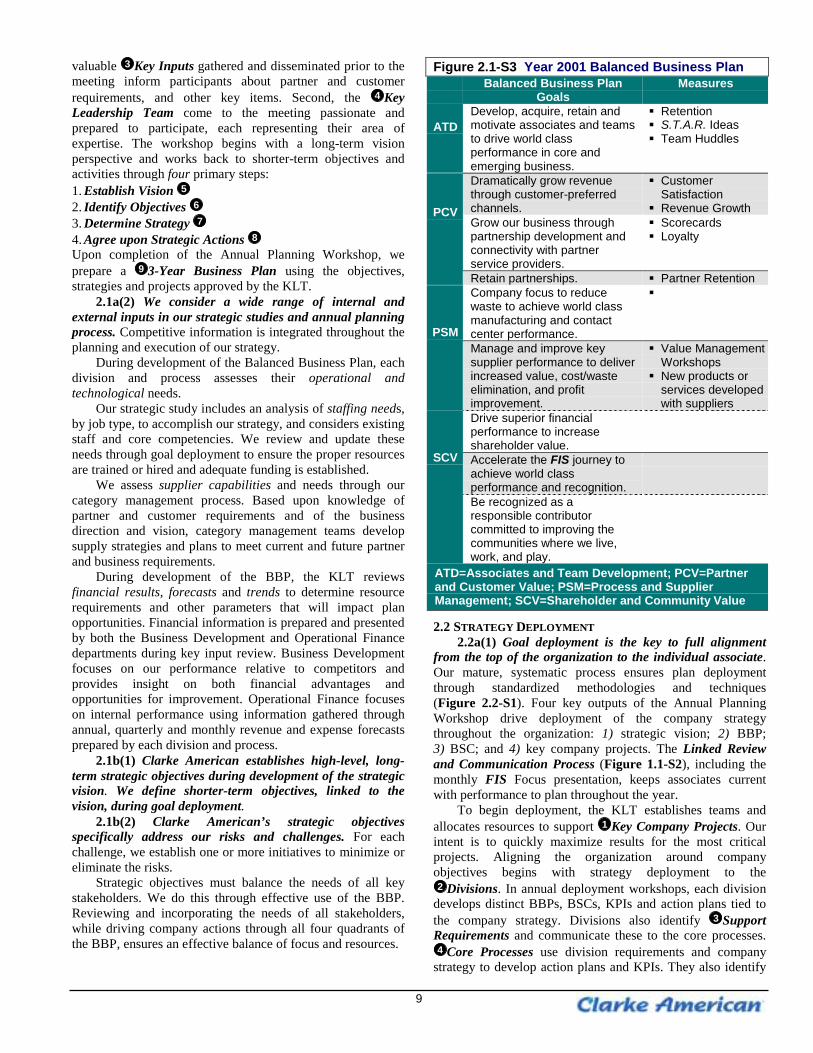
Figure 2.1-S3 Year 2001 Balanced Business PlanBalanced Business Plan
GoalsMeasures
ATDDevelop, acquire, retain andmotivate associates and teamsto drive world classperformance in core andemerging business.
� Retention� S.T.A.R. Ideas� Team Huddles
Dramatically grow revenuethrough customer-preferredchannels.
� CustomerSatisfaction
� Revenue GrowthGrow our business throughpartnership development andconnectivity with partnerservice providers.
� Scorecards� Loyalty
PCV
Retain partnerships. � Partner RetentionCompany focus to reducewaste to achieve world classmanufacturing and contactcenter performance.
�
PSMManage and improve keysupplier performance to deliverincreased value, cost/wasteelimination, and profitimprovement.
� Value ManagementWorkshops
� New products orservices developedwith suppliers
Drive superior financialperformance to increaseshareholder value.Accelerate the FIS journey toachieve world classperformance and recognition.
SCV
Be recognized as aresponsible contributorcommitted to improving thecommunities where we live,work, and play.
ATD=Associates and Team Development; PCV=Partnerand Customer Value; PSM=Process and SupplierManagement; SCV=Shareholder and Community Value
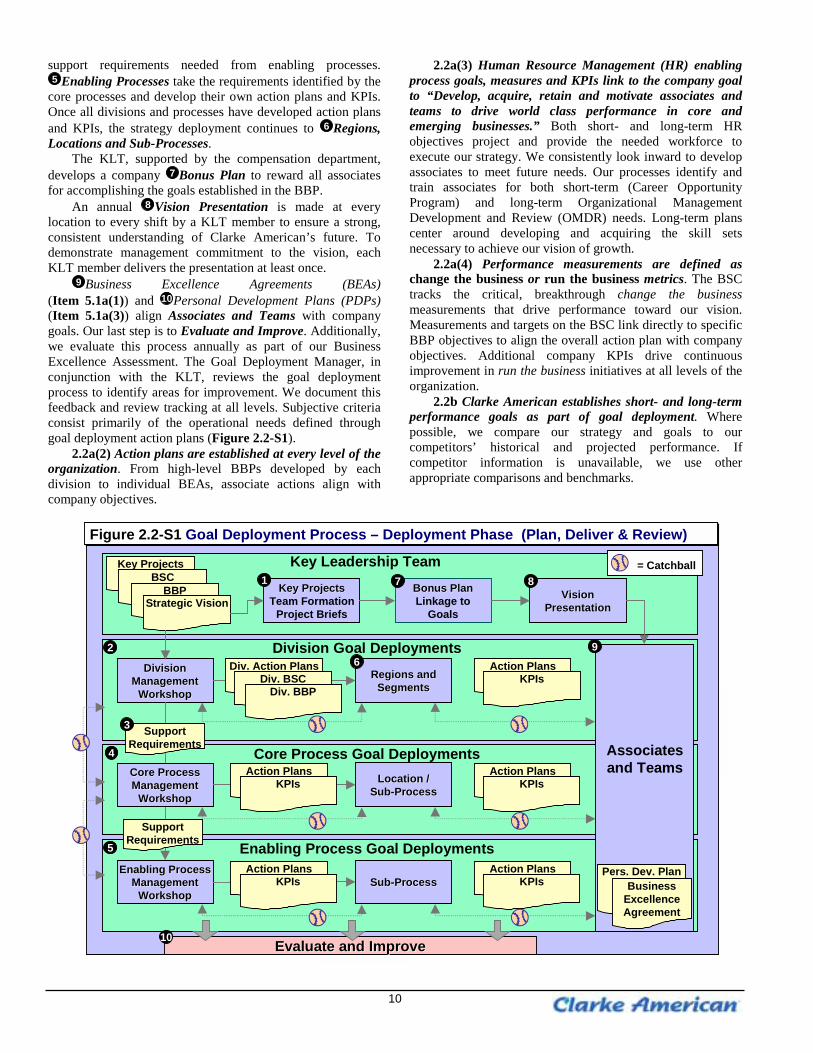
2.2 STRATEGY DEPLOYMENT2.2a(1) Goal deployment is the key to full alignment
from the top of the organization to the individual associate.Our mature, systematic process ensures plan deploymentthrough standardized methodologies and techniques(Figure 2.2-S1). Four key outputs of the Annual PlanningWorkshop drive deployment of the company strategythroughout the organization: 1) strategic vision; 2) BBP;3) BSC; and 4) key company projects. The Linked Reviewand Communication Process (Figure 1.1-S2), including themonthly FIS Focus presentation, keeps associates currentwith performance to plan throughout the year.
To begin deployment, the KLT establishes teams andallocates resources to support 1 Key Company Projects. Ourintent is to quickly maximize results for the most criticalprojects. Aligning the organization around companyobjectives begins with strategy deployment to the2 Divisions. In annual deployment workshops, each division
develops distinct BBPs, BSCs, KPIs and action plans tied tothe company strategy. Divisions also identify 3 SupportRequirements and communicate these to the core processes.4 Core Processes use division requirements and company
strategy to develop action plans and KPIs. They also identify
10
support requirements needed from enabling processes.5 Enabling Processes take the requirements identified by the
core processes and develop their own action plans and KPIs.Once all divisions and processes have developed action plansand KPIs, the strategy deployment continues to 6 Regions,Locations and Sub-Processes.
The KLT, supported by the compensation department,develops a company 7 Bonus Plan to reward all associatesfor accomplishing the goals established in the BBP.
An annual 8 Vision Presentation is made at everylocation to every shift by a KLT member to ensure a strong,consistent understanding of Clarke American’s future. Todemonstrate management commitment to the vision, eachKLT member delivers the presentation at least once.
9 Business Excellence Agreements (BEAs)(Item 5.1a(1)) and 10Personal Development Plans (PDPs)(Item 5.1a(3)) align Associates and Teams with companygoals. Our last step is to Evaluate and Improve. Additionally,we evaluate this process annually as part of our BusinessExcellence Assessment. The Goal Deployment Manager, inconjunction with the KLT, reviews the goal deploymentprocess to identify areas for improvement. We document thisfeedback and review tracking at all levels. Subjective criteriaconsist primarily of the operational needs defined throughgoal deployment action plans (Figure 2.2-S1).
2.2a(2) Action plans are established at every level of theorganization. From high-level BBPs developed by eachdivision to individual BEAs, associate actions align withcompany objectives.
2.2a(3) Human Resource Management (HR) enablingprocess goals, measures and KPIs link to the company goalto “Develop, acquire, retain and motivate associates andteams to drive world class performance in core andemerging businesses.” Both short- and long-term HRobjectives project and provide the needed workforce toexecute our strategy. We consistently look inward to developassociates to meet future needs. Our processes identify andtrain associates for both short-term (Career OpportunityProgram) and long-term Organizational ManagementDevelopment and Review (OMDR) needs. Long-term planscenter around developing and acquiring the skill setsnecessary to achieve our vision of growth.
2.2a(4) Performance measurements are defined aschange the business or run the business metrics. The BSCtracks the critical, breakthrough change the businessmeasurements that drive performance toward our vision.Measurements and targets on the BSC link directly to specificBBP objectives to align the overall action plan with companyobjectives. Additional company KPIs drive continuousimprovement in run the business initiatives at all levels of theorganization.
2.2b Clarke American establishes short- and long-termperformance goals as part of goal deployment. Wherepossible, we compare our strategy and goals to ourcompetitors’ historical and projected performance. Ifcompetitor information is unavailable, we use otherappropriate comparisons and benchmarks.
Figure 2.2-S1 Goal Deployment Process – Deployment Phase (Plan, Deliver & Review)Figure 2.2-S1 Goal Deployment Process – Deployment Phase (Plan, Deliver & Review)
DivisionDivisionManagementManagement
WorkshopWorkshopRegions andRegions and
SegmentsSegments
Division Goal Deployments
Core ProcessCore ProcessManagementManagement
WorkshopWorkshopLocation /Location /
Sub-ProcessSub-Process
Core Process Goal Deployments
Enabling ProcessEnabling ProcessManagementManagement
WorkshopWorkshopSub-ProcessSub-Process
Enabling Process Goal Deployments
Evaluate and ImproveEvaluate and Improve
Action PlansKPIs
Action PlansKPIs
Action PlansKPIs
Div. Action PlansDiv. BSC
Div. BBP
Action PlansKPIs
Action PlansKPIs
SupportRequirements
SupportRequirements
3
4
69
10
5
2
Key ProjectsKey ProjectsTeam Formation
Project Briefs
Bonus PlanBonus PlanLinkage to
GoalsVisionVision
PresentationPresentation
Key ProjectsBSC
BBPStrategic Vision
Key Leadership Team1 7 8
Pers. Dev. PlanBusiness
ExcellenceAgreement
Associatesand Teams
= Catchball
11
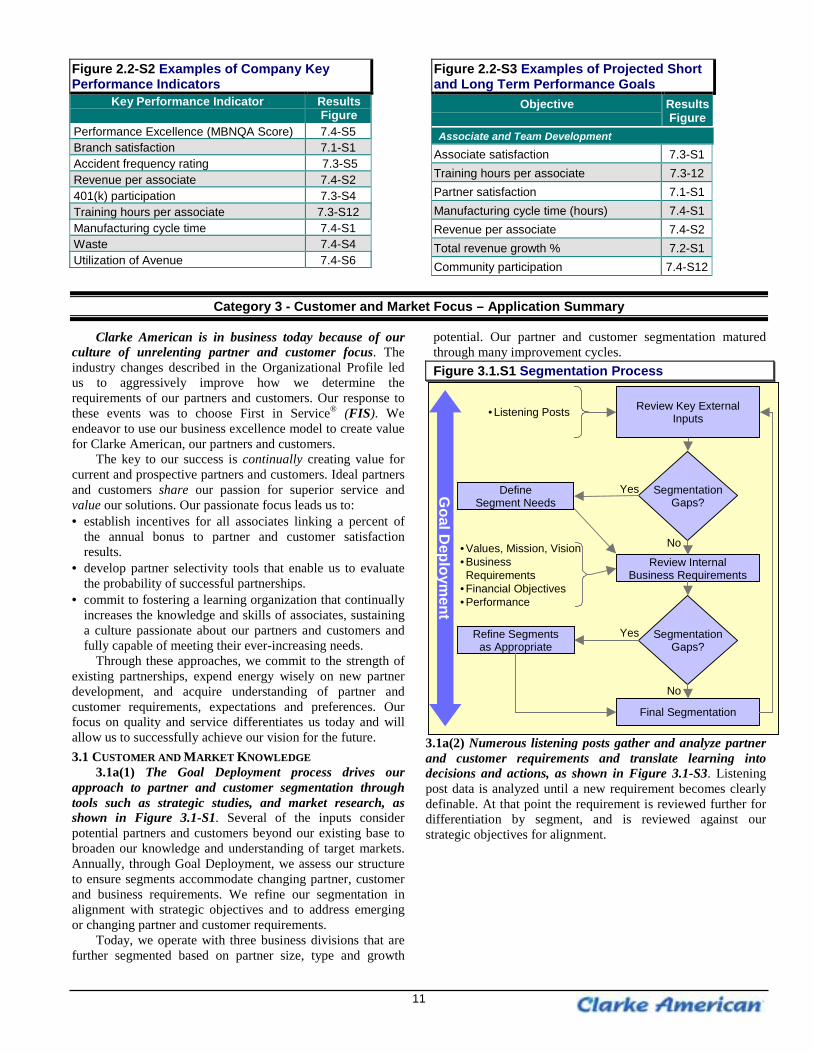
Figure 2.2-S2 Examples of Company KeyPerformance Indicators
Key Performance Indicator ResultsFigure
Performance Excellence (MBNQA Score) 7.4-S5Branch satisfaction 7.1-S1Accident frequency rating 7.3-S5Revenue per associate 7.4-S2401(k) participation 7.3-S4Training hours per associate 7.3-S12Manufacturing cycle time 7.4-S1Waste 7.4-S4Utilization of Avenue 7.4-S6
Figure 2.2-S3 Examples of Projected Shortand Long Term Performance Goals
Objective ResultsFigure
Associate and Team DevelopmentAssociate satisfaction 7.3-S1Training hours per associate 7.3-12Partner satisfaction 7.1-S1Manufacturing cycle time (hours) 7.4-S1Revenue per associate 7.4-S2Total revenue growth % 7.2-S1Community participation 7.4-S12
Category 3 - Customer and Market Focus – Application Summary
Clarke American is in business today because of ourculture of unrelenting partner and customer focus. Theindustry changes described in the Organizational Profile ledus to aggressively improve how we determine therequirements of our partners and customers. Our response tothese events was to choose First in Service® (FIS). Weendeavor to use our business excellence model to create valuefor Clarke American, our partners and customers.
The key to our success is continually creating value forcurrent and prospective partners and customers. Ideal partnersand customers share our passion for superior service andvalue our solutions. Our passionate focus leads us to:• establish incentives for all associates linking a percent of
the annual bonus to partner and customer satisfactionresults.
• develop partner selectivity tools that enable us to evaluatethe probability of successful partnerships.
• commit to fostering a learning organization that continuallyincreases the knowledge and skills of associates, sustaininga culture passionate about our partners and customers andfully capable of meeting their ever-increasing needs.
Through these approaches, we commit to the strength ofexisting partnerships, expend energy wisely on new partnerdevelopment, and acquire understanding of partner andcustomer requirements, expectations and preferences. Ourfocus on quality and service differentiates us today and willallow us to successfully achieve our vision for the future.3.1 CUSTOMER AND MARKET KNOWLEDGE
3.1a(1) The Goal Deployment process drives ourapproach to partner and customer segmentation throughtools such as strategic studies, and market research, asshown in Figure 3.1-S1. Several of the inputs considerpotential partners and customers beyond our existing base tobroaden our knowledge and understanding of target markets.Annually, through Goal Deployment, we assess our structureto ensure segments accommodate changing partner, customerand business requirements. We refine our segmentation inalignment with strategic objectives and to address emergingor changing partner and customer requirements.
Today, we operate with three business divisions that arefurther segmented based on partner size, type and growth
potential. Our partner and customer segmentation maturedthrough many improvement cycles.Figure 3.1.S1 Segmentation Process
Review InternalBusiness Requirements
Refine Segmentsas Appropriate
Final Segmentation
SegmentationGaps?
SegmentationGaps?
No
No
Yes
Yes
• Listening Posts Review Key ExternalInputs
• Values, Mission, Vision• BusinessRequirements
• Financial Objectives• Performance
DefineSegment Needs
Goal D
eployment
3.1a(2) Numerous listening posts gather and analyze partnerand customer requirements and translate learning intodecisions and actions, as shown in Figure 3.1-S3. Listeningpost data is analyzed until a new requirement becomes clearlydefinable. At that point the requirement is reviewed further fordifferentiation by segment, and is reviewed against ourstrategic objectives for alignment.
12
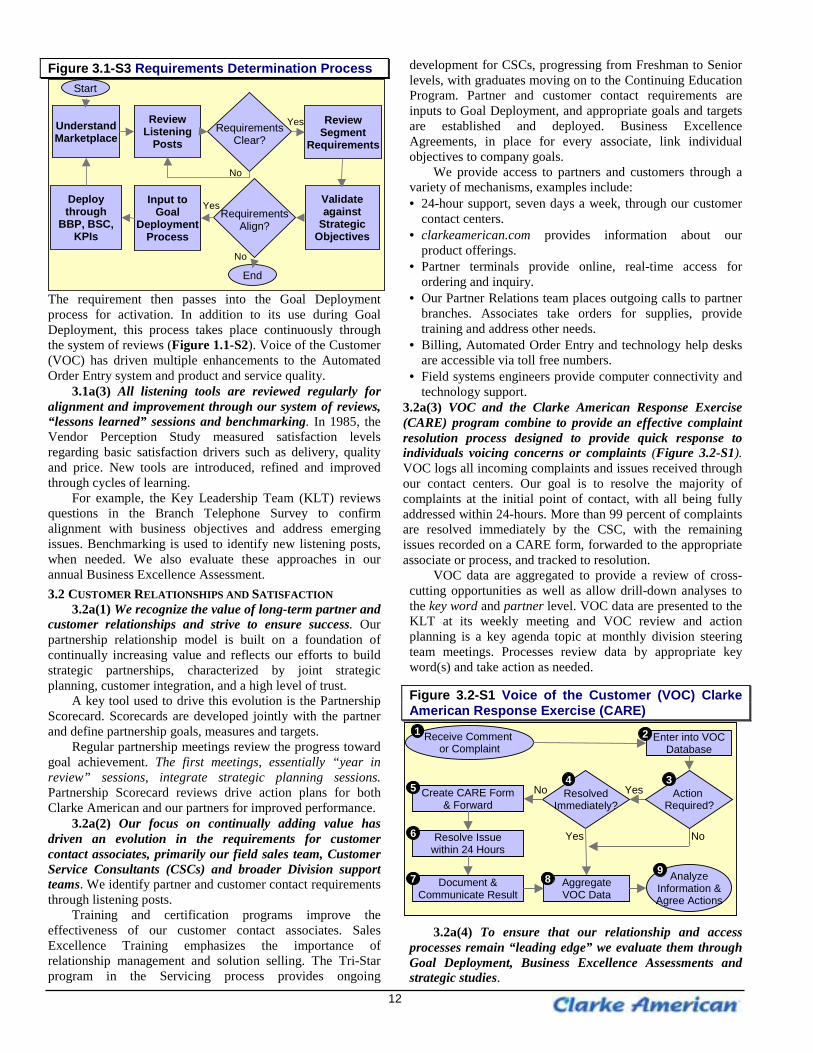
Figure 3.1-S3 Requirements Determination Process
UnderstandMarketplace
No
YesReviewListening
Posts
ReviewSegment
RequirementsRequirements
Clear?
Validateagainst
StrategicObjectives
RequirementsAlign?
Input toGoal
DeploymentProcess
Deploythrough
BBP, BSC,KPIs
End
Yes
No
Start
The requirement then passes into the Goal Deploymentprocess for activation. In addition to its use during GoalDeployment, this process takes place continuously throughthe system of reviews (Figure 1.1-S2). Voice of the Customer(VOC) has driven multiple enhancements to the AutomatedOrder Entry system and product and service quality.
3.1a(3) All listening tools are reviewed regularly foralignment and improvement through our system of reviews,“lessons learned” sessions and benchmarking. In 1985, theVendor Perception Study measured satisfaction levelsregarding basic satisfaction drivers such as delivery, qualityand price. New tools are introduced, refined and improvedthrough cycles of learning.
For example, the Key Leadership Team (KLT) reviewsquestions in the Branch Telephone Survey to confirmalignment with business objectives and address emergingissues. Benchmarking is used to identify new listening posts,when needed. We also evaluate these approaches in ourannual Business Excellence Assessment.3.2 CUSTOMER RELATIONSHIPS AND SATISFACTION
3.2a(1) We recognize the value of long-term partner andcustomer relationships and strive to ensure success. Ourpartnership relationship model is built on a foundation ofcontinually increasing value and reflects our efforts to buildstrategic partnerships, characterized by joint strategicplanning, customer integration, and a high level of trust.
A key tool used to drive this evolution is the PartnershipScorecard. Scorecards are developed jointly with the partnerand define partnership goals, measures and targets.
Regular partnership meetings review the progress towardgoal achievement. The first meetings, essentially “year inreview” sessions, integrate strategic planning sessions.Partnership Scorecard reviews drive action plans for bothClarke American and our partners for improved performance.
3.2a(2) Our focus on continually adding value hasdriven an evolution in the requirements for customercontact associates, primarily our field sales team, CustomerService Consultants (CSCs) and broader Division supportteams. We identify partner and customer contact requirementsthrough listening posts.
Training and certification programs improve theeffectiveness of our customer contact associates. SalesExcellence Training emphasizes the importance ofrelationship management and solution selling. The Tri-Starprogram in the Servicing process provides ongoing
development for CSCs, progressing from Freshman to Seniorlevels, with graduates moving on to the Continuing EducationProgram. Partner and customer contact requirements areinputs to Goal Deployment, and appropriate goals and targetsare established and deployed. Business ExcellenceAgreements, in place for every associate, link individualobjectives to company goals.
We provide access to partners and customers through avariety of mechanisms, examples include:• 24-hour support, seven days a week, through our customer
contact centers.• clarkeamerican.com provides information about our
product offerings.• Partner terminals provide online, real-time access for
ordering and inquiry.• Our Partner Relations team places outgoing calls to partner
branches. Associates take orders for supplies, providetraining and address other needs.
• Billing, Automated Order Entry and technology help desksare accessible via toll free numbers.
• Field systems engineers provide computer connectivity andtechnology support.
3.2a(3) VOC and the Clarke American Response Exercise(CARE) program combine to provide an effective complaintresolution process designed to provide quick response toindividuals voicing concerns or complaints (Figure 3.2-S1).VOC logs all incoming complaints and issues received throughour contact centers. Our goal is to resolve the majority ofcomplaints at the initial point of contact, with all being fullyaddressed within 24-hours. More than 99 percent of complaintsare resolved immediately by the CSC, with the remainingissues recorded on a CARE form, forwarded to the appropriateassociate or process, and tracked to resolution.
VOC data are aggregated to provide a review of cross-cutting opportunities as well as allow drill-down analyses tothe key word and partner level. VOC data are presented to theKLT at its weekly meeting and VOC review and actionplanning is a key agenda topic at monthly division steeringteam meetings. Processes review data by appropriate keyword(s) and take action as needed.
Figure 3.2-S1 Voice of the Customer (VOC) ClarkeAmerican Response Exercise (CARE)
Enter into VOCDatabase
Receive Comment or Complaint
Create CARE Form& Forward
Resolve Issuewithin 24 Hours
AggregateVOC Data
Document &Communicate Result
Analyze Information & Agree Actions
No
No YesResolvedImmediately?
Yes
1
4
6
7
5
2
89
Action Required?
3
3.2a(4) To ensure that our relationship and accessprocesses remain “leading edge” we evaluate them throughGoal Deployment, Business Excellence Assessments andstrategic studies.
13
We consistently monitor approaches to improving ourpartner and customer access to align technology andinfrastructure with the access requirements addressed in3.2a(2). Contact center access is kept up-to-date throughconstantly tracking call volumes, benchmarking other contactcenters and technology partnerships with suppliers.Information systems access is kept up-to-date with partnerand customer requirements through trade shows, technologypartnerships with suppliers and by responding to directpartner requests.
3.2b(1) Partner and customer satisfaction is measuredin a variety of ways and is consistently used to driveimprovement in processes, product and service quality,reliability and cycle time. All satisfaction tools are comprisedof actionable questions addressing areas of importance for theappropriate target group and include a numerical satisfactionrating, loyalty rating and open-ended comment section toencourage additional feedback. These quantitative ratings andqualitative comments allow the company to capture actionableinformation that is then prioritized and assigned to a specificdivision or process.
To demonstrate our commitment to satisfaction, allassociates have a large percent of their annual bonus tiedto partner and customer satisfaction results. VOC isavailable weekly to all associates through the VOC database,and Branch Telephone Survey (BTS) results arecommunicated each month to all associates during FISmeetings. Review of satisfaction information, including VOCand BTS, is a key agenda item at division steering teammeetings. The KLT focuses on the top drivers ofdissatisfaction and receives weekly updates from the
appropriate division or process owner until the issue isresolved.
3.2b(2) We have multiple access mechanisms in place toprovide formal and informal follow up with partners andcustomers. Examples include survey cards, customer service,and sales and executive calls. The CARE process shown inFigure 3.2-S1 ensures immediate follow-through andresponse to complaints. When our listening tools indicate aproblem, the issue is prioritized, the process responsible isnotified and corrective action is taken through our QualityImprovement Cycle shown in Figure P-S4 to prevent theproblem from reoccurring.
3.2b(3) Clarke American uses both quantitative andqualitative tools to gather information regarding satisfactionrelative to competitors. We use advanced survey mechanismsto gather satisfaction drivers and to assess performanceagainst these drivers. Whether we get new business or retainexisting business, we learn of areas for improvement. If ourproposal is not accepted, we probe further to see whatrequirements were not met. If a partner chooses not to re-signwith us, we conduct a formal interview to identify areas ofimprovement.
3.2b(4) Our customer satisfaction measurementprocesses have evolved since the early 1990s and continue toimprove. We evaluate and improve our approaches through 1)supplier partnerships with research firms; 2) participation incustomer satisfaction measurement conferences; and 3)benchmarking studies with companies outside of the checkprinting industry; as well as 4) through our annual BusinessExcellence Assessment.
Category 4 – Information Analysis – Application Summary
1.1 MEASUREMENT AND ANALYSIS OFORGANIZATIONAL PERFORMANCE
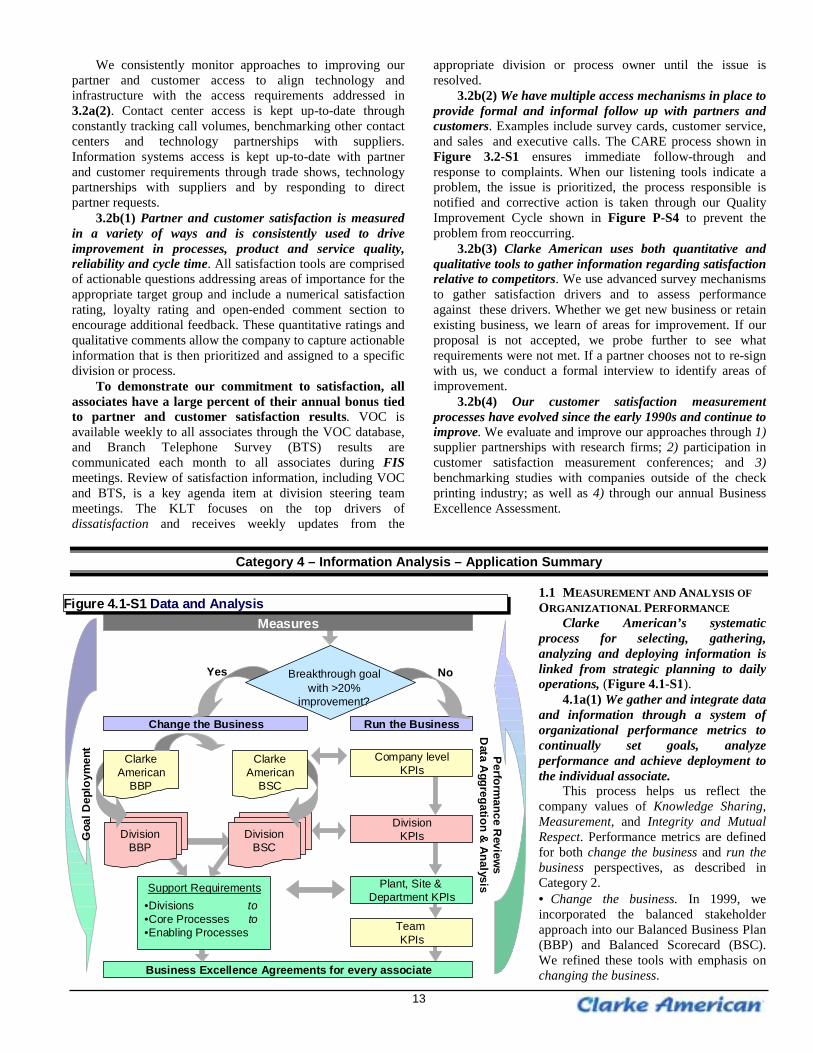
Clarke American’s systematicprocess for selecting, gathering,analyzing and deploying information islinked from strategic planning to dailyoperations, (Figure 4.1-S1).
4.1a(1) We gather and integrate dataand information through a system oforganizational performance metrics tocontinually set goals, analyzeperformance and achieve deployment tothe individual associate.
This process helps us reflect thecompany values of Knowledge Sharing,Measurement, and Integrity and MutualRespect. Performance metrics are definedfor both change the business and run thebusiness perspectives, as described inCategory 2.• Change the business. In 1999, weincorporated the balanced stakeholderapproach into our Balanced Business Plan(BBP) and Balanced Scorecard (BSC).We refined these tools with emphasis onchanging the business.
DivisionBBP
DivisionBSC
Change the Business Run the Business
ClarkeAmerican
BBP
ClarkeAmerican
BSC
Business Excellence Agreements for every associate
DivisionKPIs
Team KPIs
Plant, Site & Department KPIs
Company levelKPIs
Measures
Breakthrough goalwith >20%
improvement?
Yes No
Support Requirements•Divisions to•Core Processes to•Enabling Processes
Goa
l Dep
loym
ent Perform
ance Review
sD
ata Aggregation & Analysis
Figure 4.1-S1 Data and AnalysisFigure 4.1-S1 Data and Analysis
14
• Run the business. Our Key Process Indicators (KPIs) reflectour process view of the business and are used to constantlytrack the efficiency and effectiveness of our processes relativeto our customer requirements, based upon their targets.
A Key Leadership Team (KLT) member owns eachmetric. The leader is responsible for formally andsystematically insuring the relevance of the metric, as well asevaluating and improving the processes for gathering andreporting the information. These metrics are defined anddeployed through all levels of the organization, providing forconsistent and reliable analysis and decision making.
The KLT reviews all key metrics for continued relevanceand integrity during goal deployment. New targets areestablished to achieve the increasing performance levels.
Metrics are further reviewed for change the business andrun the business items. Using both predictive and diagnosticindicators provides the continual ability to test and understandthe correlation between the various metrics (Figure 4.1-S2).Figure 4.1-S2 Examples of Leading and LaggingIndicatorsChange the Business Run the Business
Predictive Indicators (Leading)• Customer satisfaction• Implemented S.T.A.R. ideas• Total order cycle time
• Plant cycle time• 401(K) participation
Diagnostic Indicators (Lagging)• Retention of 2-year associates• Operating profit growth
• Branch Telephone Survey• Waste
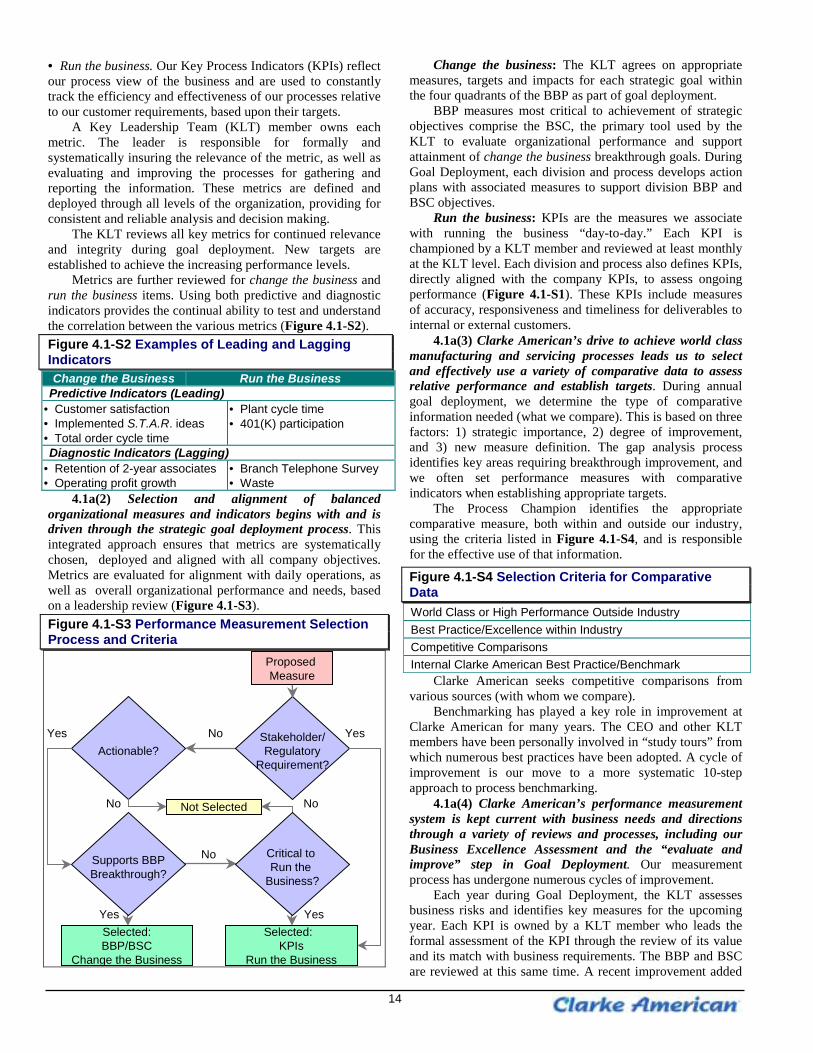
4.1a(2) Selection and alignment of balancedorganizational measures and indicators begins with and isdriven through the strategic goal deployment process. Thisintegrated approach ensures that metrics are systematicallychosen, deployed and aligned with all company objectives.Metrics are evaluated for alignment with daily operations, aswell as overall organizational performance and needs, basedon a leadership review (Figure 4.1-S3).Figure 4.1-S3 Performance Measurement SelectionProcess and Criteria
Selected:BBP/BSC
Change the Business
YesYes No
No
No
Yes
Not Selected
Yes
No
Selected: KPIs
Run the Business
Supports BBPBreakthrough?
Actionable?Stakeholder/Regulatory
Requirement?
Critical to Run the
Business?
Proposed Measure
Change the business: The KLT agrees on appropriatemeasures, targets and impacts for each strategic goal withinthe four quadrants of the BBP as part of goal deployment.
BBP measures most critical to achievement of strategicobjectives comprise the BSC, the primary tool used by theKLT to evaluate organizational performance and supportattainment of change the business breakthrough goals. DuringGoal Deployment, each division and process develops actionplans with associated measures to support division BBP andBSC objectives.
Run the business: KPIs are the measures we associatewith running the business “day-to-day.” Each KPI ischampioned by a KLT member and reviewed at least monthlyat the KLT level. Each division and process also defines KPIs,directly aligned with the company KPIs, to assess ongoingperformance (Figure 4.1-S1). These KPIs include measuresof accuracy, responsiveness and timeliness for deliverables tointernal or external customers.
4.1a(3) Clarke American’s drive to achieve world classmanufacturing and servicing processes leads us to selectand effectively use a variety of comparative data to assessrelative performance and establish targets. During annualgoal deployment, we determine the type of comparativeinformation needed (what we compare). This is based on threefactors: 1) strategic importance, 2) degree of improvement,and 3) new measure definition. The gap analysis processidentifies key areas requiring breakthrough improvement, andwe often set performance measures with comparativeindicators when establishing appropriate targets.
The Process Champion identifies the appropriatecomparative measure, both within and outside our industry,using the criteria listed in Figure 4.1-S4, and is responsiblefor the effective use of that information.
Figure 4.1-S4 Selection Criteria for ComparativeDataWorld Class or High Performance Outside IndustryBest Practice/Excellence within IndustryCompetitive ComparisonsInternal Clarke American Best Practice/Benchmark
Clarke American seeks competitive comparisons fromvarious sources (with whom we compare).
Benchmarking has played a key role in improvement atClarke American for many years. The CEO and other KLTmembers have been personally involved in “study tours” fromwhich numerous best practices have been adopted. A cycle ofimprovement is our move to a more systematic 10-stepapproach to process benchmarking.
4.1a(4) Clarke American’s performance measurementsystem is kept current with business needs and directionsthrough a variety of reviews and processes, including ourBusiness Excellence Assessment and the “evaluate andimprove” step in Goal Deployment. Our measurementprocess has undergone numerous cycles of improvement.
Each year during Goal Deployment, the KLT assessesbusiness risks and identifies key measures for the upcomingyear. Each KPI is owned by a KLT member who leads theformal assessment of the KPI through the review of its valueand its match with business requirements. The BBP and BSCare reviewed at this same time. A recent improvement added
15
an “impact” element to the BBP to better understand theimplications of goal achievement. The number of measuresincluded on the BSC and tracked as company KPIs has beenreduced over time to ensure focus on the critical few.
Measurement systems in each division and process areevaluated during the Business Excellence Assessment. Weuse the strengths and opportunities identified in theassessment to create action plans for improving ourmeasurement system.
A wide range of incremental improvements to theperformance measurement system also come from S.T.A.R.ideas submitted by associates or teams.
4.1b(1) The KLT relies upon extensive performanceanalyses, developed throughout the organization and linkedto the KPIs, BBP and BSC, to make well-informed decisionson how to both change and run the business. Following aresamples of analyses senior management uses in organizationalperformance review and decision-making:
• Market Analyses • Product Analyses• Production Analyses • Service Analyses• Human Resources Analyses
These analyses link to key metrics supporting theBSC/BBP and company KPIs. They are routinely discussed inKLT meetings and provide very useful input in theorganizational performance review meetings (Figure 1.1-S2).
Financial and performance analysts, deployed throughoutthe divisions and processes, provide assistance for these andother analyses. They also help senior and line managersanalyze their area’s financial, human resources, andoperational performance.
First in Service� (FIS) tools provided to every associateinclude the TQM Toolbox (our Fundamental ProcessImprovement Tools), which describes 18 analytical toolsassociated with the 13 steps of the extended PDCA cycle.Introductory tools and analytical skills are taught in FIScourses and are supported by trainers and facilitators aftertraining is complete. A seven-step PDCA cycle is availablefor use with short duration or narrowly focused teamactivities.
4.1b(2) Two-way communication of organizationalresults and analyses among leaders, associates, teamsand work groups enables effective decision making atall levels.
Goal deployment and our system of regular reviewsand huddles (Figure 1.1-S2) assure ongoingcommunication of organizational-level analysis to workgroup and functional-level operations. Linkage ofoperations is assured annually through goal deployment,and the review process provides the linkage on a dailybasis. We translate action items from the reviews intodepartment and work group action plans. Work groupleaders provide frequent status reports that allow thedivision and process leaders—sometimes the teamleaders themselves—to respond to follow-up items on thereview agendas. Our annual Associate Opinion Survey,S.T.A.R. ideas and team updates provide upward analysis.
Performance results are consistently and rapidlydeployed to each associate by senior leaders and throughdivisions and processes, using tools such as the FISFocus and vision updates, e-mail, voicemail, newsletters
and bulletin boards.4.1b(3) BSC and KPIs are the primary change the
business and run the business indicators used to measureoverall organizational performance. These are effectivelylinked to the key business results, the strategic objectives andto the detailed action plans. Movement of any of thesemeasures can be clarified through drill-down to lower level orprocess measures. The KLT reviews performance monthlyand, if a key measure is not at the desired performance level,the team reviews the performance enablers as well as theeffectiveness of the metric itself.4.2 INFORMATION MANAGEMENTClarke American uses both internal and external resourcesand strategic alliances with key suppliers to assure thecontinued integrity and efficient availability of data to allstakeholders. Data integrity and availability are thefoundation of our fact-based management system.
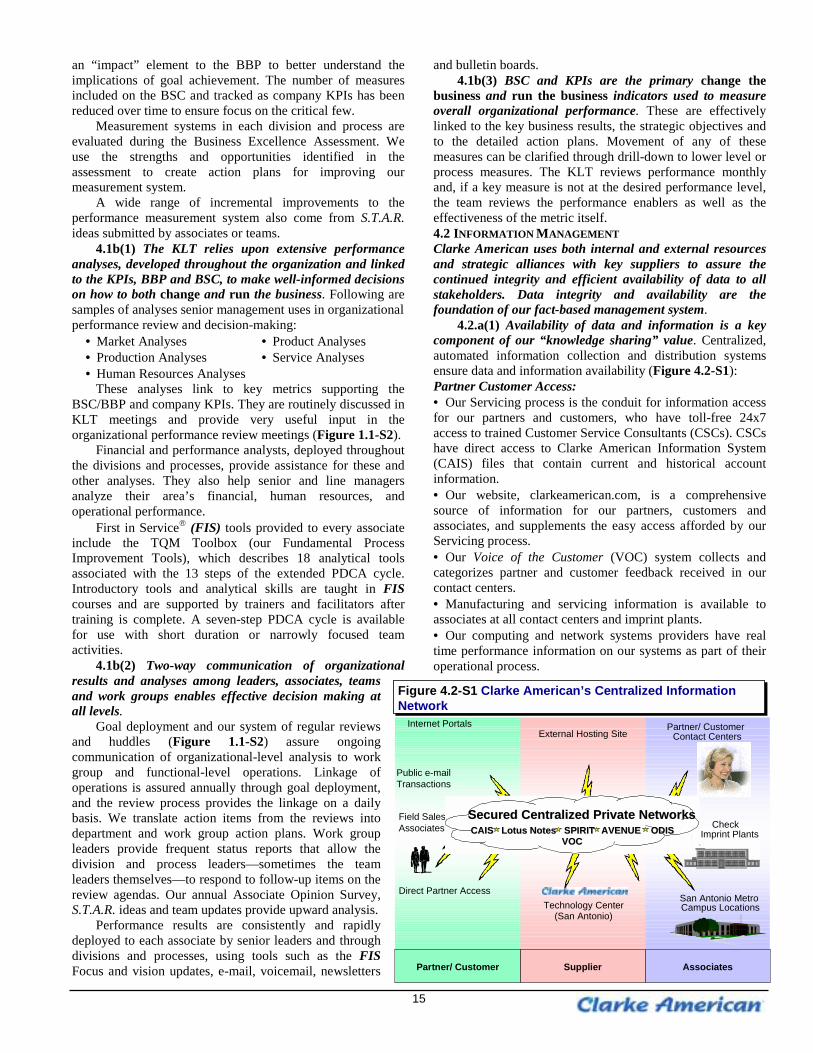
4.2.a(1) Availability of data and information is a keycomponent of our “knowledge sharing” value. Centralized,automated information collection and distribution systemsensure data and information availability (Figure 4.2-S1):Partner Customer Access:• Our Servicing process is the conduit for information accessfor our partners and customers, who have toll-free 24x7access to trained Customer Service Consultants (CSCs). CSCshave direct access to Clarke American Information System(CAIS) files that contain current and historical accountinformation.• Our website, clarkeamerican.com, is a comprehensivesource of information for our partners, customers andassociates, and supplements the easy access afforded by ourServicing process.• Our Voice of the Customer (VOC) system collects andcategorizes partner and customer feedback received in ourcontact centers.• Manufacturing and servicing information is available toassociates at all contact centers and imprint plants.• Our computing and network systems providers have realtime performance information on our systems as part of theiroperational process.
Figure 4.2-S1 Clarke American’s Centralized InformationNetworkFigure 4.2-S1 Clarke American’s Centralized InformationNetwork
Partner/ CustomerContact Centers
San Antonio MetroCampus Locations
AssociatesSupplierPartner/ Customer
Technology Center(San Antonio)
External Hosting SiteInternet Portals
Public e-mailTransactions
Field SalesAssociates
Direct Partner Access
Secured Centralized Private NetworksSecured Centralized Private NetworksCAIS Lotus Notes SPIRIT CAIS Lotus Notes SPIRIT AVENUE AVENUE ODIS ODIS
VOCVOC
CheckImprint Plants
16
Associate Access:• The Streamlined Processes, Integrated ResourcesInformation Technology (SPIRIT) system is directlyaccessible to all processes and sites. SPIRIT provides real-time access to financial, accounts payable, asset management,inventory and other materials management data.• Our voice mail system is integrated across all locations andour parent company.• All corporate associates, and plant and service siteassociates to the supervisory level, have logon IDs to theLotus Notes system. With its broad routing capabilities,automated forms, databases and e-mail, it is our prime tool toefficiently share general information, including, but notlimited to, newsletters, general interest announcements, TeamExcellence and S.T.A.R. Idea best practices, schedules,calendars and meetings. We also develop applications tostreamline and automate certain administrative processes(e.g., salary planning and S.T.A.R. suggestion evaluation),significantly reducing their cycle time.• For associates in plants and servicing sites who do not yethave Lotus Notes logon IDs, we provide general informationthrough daily huddles, weekly team meetings and monthlyFIS Focus, supplemented with informal discussions, specialpresentations, bulletin boards and newsletters.
4.2a(2) Data integrity, reliability, accuracy andtimeliness are assured through direct, real-time data capturewhere possible in the CAIS system.
Where manual data capture is necessary, automated andmanual quality control processes are in place to assure dataaccuracy and timeliness. These steps are reinforced throughthe cycles of systematic analysis and reviews described in 1.1and 4.1, which assure that any faults and their root causes arequickly identified and eliminated.
Our Systems Assurance group controls access to allClarke American systems by password and user IDassignment. When an associate leaves the company, theTermination Identification Process System (TIPS)
automatically notifies Systems Assurance to remove access toall facilities and systems.
4.2a(3) Data and information availability mechanismsare kept current by continuously tracking the technologyindustry, through strong relationships with industry leadingsuppliers, and through our focus on partner and customerneeds. As a part of the strategic planning process, weincorporate stakeholder information and data needs into theanalysis and resulting action plans. Input on needs is providedby the Business Excellence Assessment and AssociateOpinion Survey for internal stakeholders, the VP ofProcurement for Suppliers, the GMs for partners andcustomers, and the CEO and CFO for shareholders. The SVPof Information Technologies provides technology solutionsinput derived from our partnerships with industry-leadingsuppliers or through the strategic planning and deploymentprocess.
4.2b(1) We regularly upgrade software and hardware toensure data reliability and improve ease of use. Partnershipswith key suppliers assure hardware reliability and networkconnectivity for CAIS.
Using its supplier partnerships, the IT process researches,evaluates and pilots hardware and software, then trains theuser communities before rollout, to help assure userfriendliness and reliability.
The IT process uses the Standard Design Methodology,together with a system of IT User Requests, to enhance theintegrity, reliability and performance of changes to ourinformation systems.
4.2b(2) The same process referred to in 4.2a(3) anddescribed in 2.1, provides the analysis, action plans andbudgets necessary to keep our hardware and softwaresystems current with business needs and directions. Moreimmediate, non-strategic upgrades to hardware and softwaresystems are identified and initiated through the system ofregular reviews.
Category 5 – Human Resources Focus – Application Summary
Clarke American’s culture, based upon First inService� (FIS) principles, engages, empowers and motivatesour associates. We know that success is dependent upon ourpeople, and we value the strength and diversity of ourassociates. We provide common language, tools, approaches,and flexible deployment methods to meet the requirements ofgeographically and organizationally distinct groups.Associates demonstrate initiative, innovation and teamwork inan energized, fun environment resulting in stellarperformance.5.1 WORK SYSTEMSOur goal deployment process aligns all associate efforts withcompany strategies and goals.
5.1a(1) Clarke American organizes and managesactivities through a matrix structure of divisions andprocesses that addresses differing partner and customerneeds to provide focus, flexibility and responsiveness.
We systematically match the work to be done with adefined job to accomplish the work. We build a jobdescription that articulates duties to be accomplished,
decision-making required, levels of authority, knowledge andexperience, and physical requirements required to accomplishthe job. For manufacturing and servicing jobs, engineeringstandards define expected performance levels.
Through our High Performance Work System(Figure 5.1-S1) we perform work defined by the divisionsand processes. All activities are led through our 1 FISLeadership System, aligned with our vision, mission, corepurpose and goal deployment objectives. Aggressivecompany goals are established and deployed throughdivisions and processes to every associate. We ensurecooperation among associates and encourage innovation andinitiative through 2 Teamwork. Deeply ingrained at ClarkeAmerican, teamwork is a value that “allows each of us toparticipate in Clarke American’s success and shape ourcompany’s future.”
We use both natural work teams and project teams toaccomplish goals. All teams use established FIS disciplinesand trained facilitators to maximize success. Natural workteams and improvement teams perform run the business
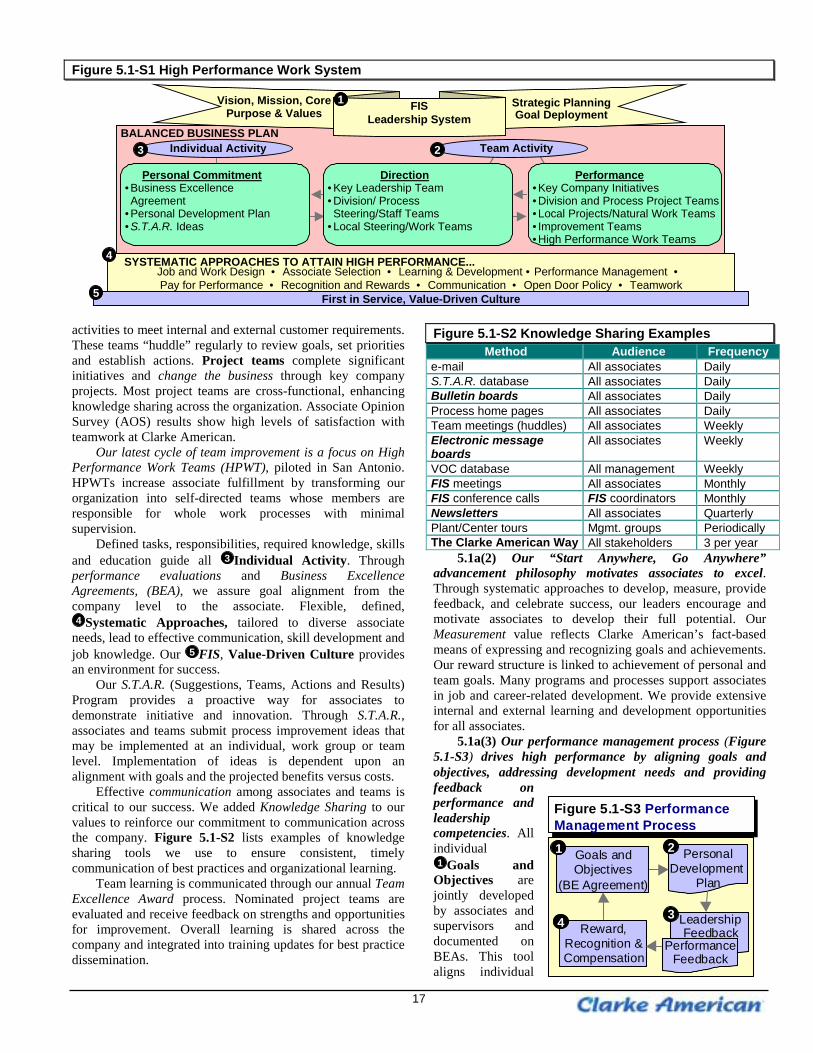
17
Figure 5.1-S1 High Performance Work System
Job and Work Design • Associate Selection • Learning & Development • Performance Management • Pay for Performance • Recognition and Rewards • Communication • Open Door Policy • Teamwork
First in Service, Value-Driven Culture
4
5
Performance• Key Company Initiatives• Division and Process Project Teams• Local Projects/Natural Work Teams• Improvement Teams• High Performance Work Teams
Direction• Key Leadership Team• Division/ Process Steering/Staff Teams
• Local Steering/Work Teams
2BALANCED BUSINESS PLAN
SYSTEMATIC APPROACHES TO ATTAIN HIGH PERFORMANCE...
Personal Commitment• Business Excellence Agreement
• Personal Development Plan• S.T.A.R. Ideas
3
FISLeadership System
Vision, Mission, CorePurpose & Values
Strategic PlanningGoal Deployment
1
Team ActivityIndividual Activity
activities to meet internal and external customer requirements.These teams “huddle” regularly to review goals, set prioritiesand establish actions. Project teams complete significantinitiatives and change the business through key companyprojects. Most project teams are cross-functional, enhancingknowledge sharing across the organization. Associate OpinionSurvey (AOS) results show high levels of satisfaction withteamwork at Clarke American.
Our latest cycle of team improvement is a focus on HighPerformance Work Teams (HPWT), piloted in San Antonio.HPWTs increase associate fulfillment by transforming ourorganization into self-directed teams whose members areresponsible for whole work processes with minimalsupervision.
Defined tasks, responsibilities, required knowledge, skillsand education guide all 3 Individual Activity. Throughperformance evaluations and Business ExcellenceAgreements, (BEA), we assure goal alignment from thecompany level to the associate. Flexible, defined,4 Systematic Approaches, tailored to diverse associate
needs, lead to effective communication, skill development andjob knowledge. Our 5 FIS, Value-Driven Culture providesan environment for success.
Our S.T.A.R. (Suggestions, Teams, Actions and Results)Program provides a proactive way for associates todemonstrate initiative and innovation. Through S.T.A.R.,associates and teams submit process improvement ideas thatmay be implemented at an individual, work group or teamlevel. Implementation of ideas is dependent upon analignment with goals and the projected benefits versus costs.
Effective communication among associates and teams iscritical to our success. We added Knowledge Sharing to ourvalues to reinforce our commitment to communication acrossthe company. Figure 5.1-S2 lists examples of knowledgesharing tools we use to ensure consistent, timelycommunication of best practices and organizational learning.
Team learning is communicated through our annual TeamExcellence Award process. Nominated project teams areevaluated and receive feedback on strengths and opportunitiesfor improvement. Overall learning is shared across thecompany and integrated into training updates for best practicedissemination.
Figure 5.1-S2 Knowledge Sharing ExamplesMethod Audience Frequency
e-mail All associates DailyS.T.A.R. database All associates DailyBulletin boards All associates DailyProcess home pages All associates DailyTeam meetings (huddles) All associates WeeklyElectronic messageboards
All associates Weekly
VOC database All management WeeklyFIS meetings All associates MonthlyFIS conference calls FIS coordinators MonthlyNewsletters All associates QuarterlyPlant/Center tours Mgmt. groups PeriodicallyThe Clarke American Way All stakeholders 3 per year
5.1a(2) Our “Start Anywhere, Go Anywhere”advancement philosophy motivates associates to excel.Through systematic approaches to develop, measure, providefeedback, and celebrate success, our leaders encourage andmotivate associates to develop their full potential. OurMeasurement value reflects Clarke American’s fact-basedmeans of expressing and recognizing goals and achievements.Our reward structure is linked to achievement of personal andteam goals. Many programs and processes support associatesin job and career-related development. We provide extensiveinternal and external learning and development opportunitiesfor all associates.
5.1a(3) Our performance management process (Figure5.1-S3) drives high performance by aligning goals andobjectives, addressing development needs and providingfeedback onperformance andleadershipcompetencies. Allindividual1 Goals and
Objectives arejointly developedby associates andsupervisors anddocumented onBEAs. This toolaligns individual
Goals andObjectives
(BE Agreement)
1
Reward,Recognition &Compensation
4
PersonalDevelopment
Plan
2
LeadershipFeedback
PerformanceFeedback
3
Figure 5.1-S3 PerformanceManagement ProcessFigure 5.1-S3 PerformanceManagement Process
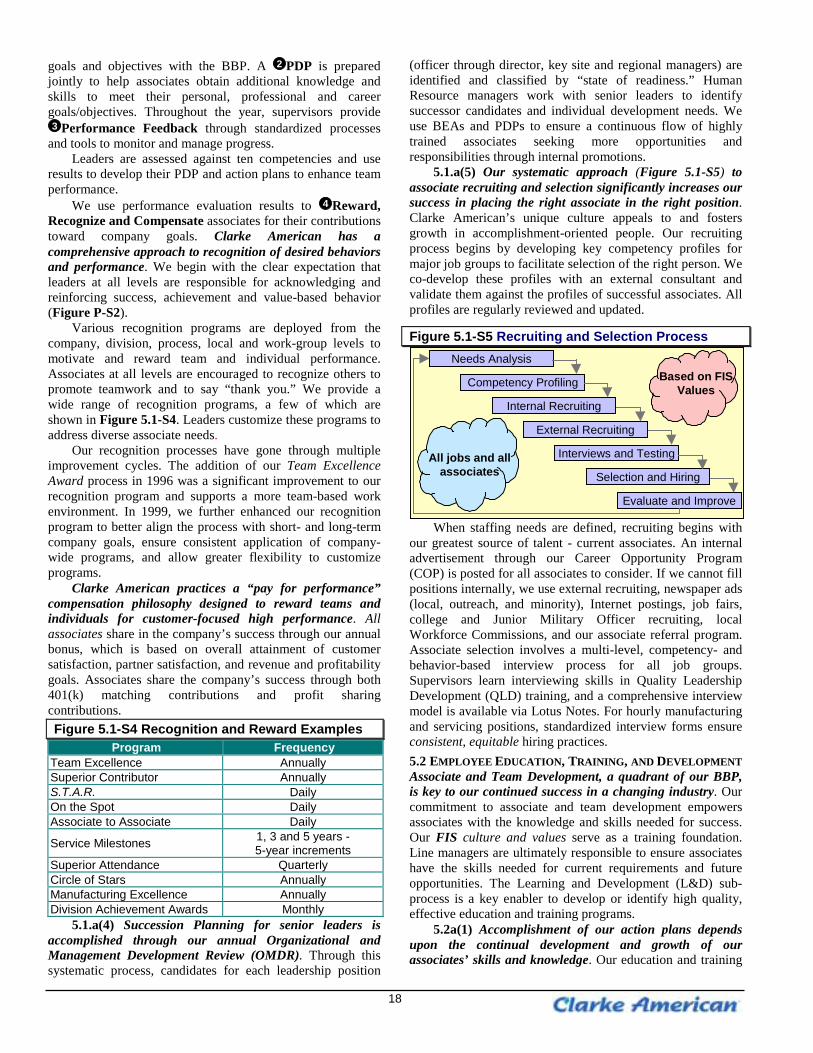
18
goals and objectives with the BBP. A 2 PDP is preparedjointly to help associates obtain additional knowledge andskills to meet their personal, professional and careergoals/objectives. Throughout the year, supervisors provide3 Performance Feedback through standardized processes
and tools to monitor and manage progress.Leaders are assessed against ten competencies and use
results to develop their PDP and action plans to enhance teamperformance.
We use performance evaluation results to 4 Reward,Recognize and Compensate associates for their contributionstoward company goals. Clarke American has acomprehensive approach to recognition of desired behaviorsand performance. We begin with the clear expectation thatleaders at all levels are responsible for acknowledging andreinforcing success, achievement and value-based behavior(Figure P-S2).
Various recognition programs are deployed from thecompany, division, process, local and work-group levels tomotivate and reward team and individual performance.Associates at all levels are encouraged to recognize others topromote teamwork and to say “thank you.” We provide awide range of recognition programs, a few of which areshown in Figure 5.1-S4. Leaders customize these programs toaddress diverse associate needs.
Our recognition processes have gone through multipleimprovement cycles. The addition of our Team ExcellenceAward process in 1996 was a significant improvement to ourrecognition program and supports a more team-based workenvironment. In 1999, we further enhanced our recognitionprogram to better align the process with short- and long-termcompany goals, ensure consistent application of company-wide programs, and allow greater flexibility to customizeprograms.
Clarke American practices a “pay for performance”compensation philosophy designed to reward teams andindividuals for customer-focused high performance. Allassociates share in the company’s success through our annualbonus, which is based on overall attainment of customersatisfaction, partner satisfaction, and revenue and profitabilitygoals. Associates share the company’s success through both401(k) matching contributions and profit sharingcontributions.Figure 5.1-S4 Recognition and Reward Examples
Program FrequencyTeam Excellence AnnuallySuperior Contributor AnnuallyS.T.A.R. DailyOn the Spot DailyAssociate to Associate Daily
Service Milestones 1, 3 and 5 years -5-year increments
Superior Attendance QuarterlyCircle of Stars AnnuallyManufacturing Excellence AnnuallyDivision Achievement Awards Monthly
5.1.a(4) Succession Planning for senior leaders isaccomplished through our annual Organizational andManagement Development Review (OMDR). Through thissystematic process, candidates for each leadership position
(officer through director, key site and regional managers) areidentified and classified by “state of readiness.” HumanResource managers work with senior leaders to identifysuccessor candidates and individual development needs. Weuse BEAs and PDPs to ensure a continuous flow of highlytrained associates seeking more opportunities andresponsibilities through internal promotions.
5.1.a(5) Our systematic approach (Figure 5.1-S5) toassociate recruiting and selection significantly increases oursuccess in placing the right associate in the right position.Clarke American’s unique culture appeals to and fostersgrowth in accomplishment-oriented people. Our recruitingprocess begins by developing key competency profiles formajor job groups to facilitate selection of the right person. Weco-develop these profiles with an external consultant andvalidate them against the profiles of successful associates. Allprofiles are regularly reviewed and updated.
Figure 5.1-S5 Recruiting and Selection Process
Interviews and Testing
Selection and Hiring
Internal Recruiting
External Recruiting
Evaluate and Improve
Needs Analysis
Competency Profiling
All jobs and allassociates
Based on FISValues
When staffing needs are defined, recruiting begins withour greatest source of talent - current associates. An internaladvertisement through our Career Opportunity Program(COP) is posted for all associates to consider. If we cannot fillpositions internally, we use external recruiting, newspaper ads(local, outreach, and minority), Internet postings, job fairs,college and Junior Military Officer recruiting, localWorkforce Commissions, and our associate referral program.Associate selection involves a multi-level, competency- andbehavior-based interview process for all job groups.Supervisors learn interviewing skills in Quality LeadershipDevelopment (QLD) training, and a comprehensive interviewmodel is available via Lotus Notes. For hourly manufacturingand servicing positions, standardized interview forms ensureconsistent, equitable hiring practices.5.2 EMPLOYEE EDUCATION, TRAINING, AND DEVELOPMENTAssociate and Team Development, a quadrant of our BBP,is key to our continued success in a changing industry. Ourcommitment to associate and team development empowersassociates with the knowledge and skills needed for success.Our FIS culture and values serve as a training foundation.Line managers are ultimately responsible to ensure associateshave the skills needed for current requirements and futureopportunities. The Learning and Development (L&D) sub-process is a key enabler to develop or identify high quality,effective education and training programs.
5.2a(1) Accomplishment of our action plans dependsupon the continual development and growth of ourassociates’ skills and knowledge. Our education and training
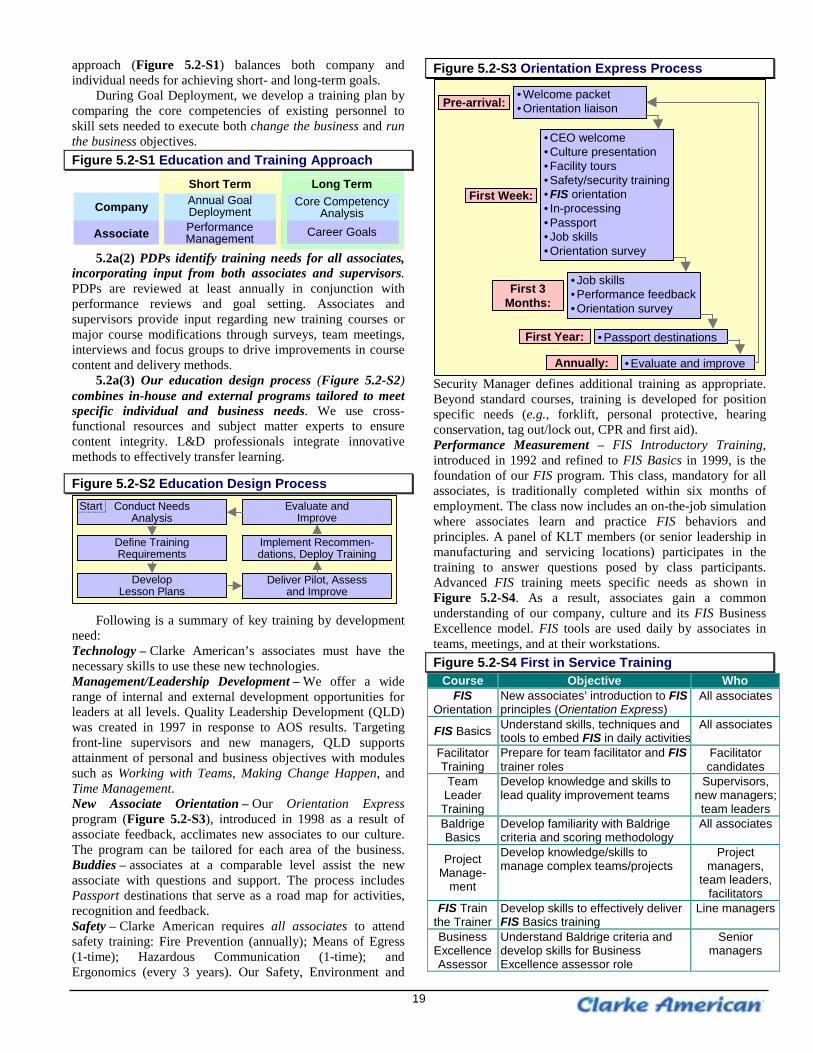
19
approach (Figure 5.2-S1) balances both company andindividual needs for achieving short- and long-term goals.
During Goal Deployment, we develop a training plan bycomparing the core competencies of existing personnel toskill sets needed to execute both change the business and runthe business objectives.Figure 5.2-S1 Education and Training Approach
Core CompetencyAnalysis
Short Term Long Term
Company
Associate
Annual GoalDeployment
Career GoalsPerformanceManagement
5.2a(2) PDPs identify training needs for all associates,incorporating input from both associates and supervisors.PDPs are reviewed at least annually in conjunction withperformance reviews and goal setting. Associates andsupervisors provide input regarding new training courses ormajor course modifications through surveys, team meetings,interviews and focus groups to drive improvements in coursecontent and delivery methods.
5.2a(3) Our education design process (Figure 5.2-S2)combines in-house and external programs tailored to meetspecific individual and business needs. We use cross-functional resources and subject matter experts to ensurecontent integrity. L&D professionals integrate innovativemethods to effectively transfer learning.
Figure 5.2-S2 Education Design ProcessConduct Needs
Analysis
Deliver Pilot, Assessand Improve
Implement Recommen-dations, Deploy Training
Define TrainingRequirements
Evaluate andImprove
DevelopLesson Plans
Start
Following is a summary of key training by developmentneed:Technology – Clarke American’s associates must have thenecessary skills to use these new technologies.Management/Leadership Development – We offer a widerange of internal and external development opportunities forleaders at all levels. Quality Leadership Development (QLD)was created in 1997 in response to AOS results. Targetingfront-line supervisors and new managers, QLD supportsattainment of personal and business objectives with modulessuch as Working with Teams, Making Change Happen, andTime Management.New Associate Orientation – Our Orientation Expressprogram (Figure 5.2-S3), introduced in 1998 as a result ofassociate feedback, acclimates new associates to our culture.The program can be tailored for each area of the business.Buddies – associates at a comparable level assist the newassociate with questions and support. The process includesPassport destinations that serve as a road map for activities,recognition and feedback.Safety – Clarke American requires all associates to attendsafety training: Fire Prevention (annually); Means of Egress(1-time); Hazardous Communication (1-time); andErgonomics (every 3 years). Our Safety, Environment and
Figure 5.2-S3 Orientation Express Process
• Welcome packet• Orientation liaisonPre-arrival:
Annually: • Evaluate and improve
First Week:
• CEO welcome• Culture presentation• Facility tours• Safety/security training• FIS orientation• In-processing• Passport• Job skills• Orientation survey
First 3Months:
• Job skills• Performance feedback• Orientation survey
First Year: • Passport destinations
Security Manager defines additional training as appropriate.Beyond standard courses, training is developed for positionspecific needs (e.g., forklift, personal protective, hearingconservation, tag out/lock out, CPR and first aid).Performance Measurement – FIS Introductory Training,introduced in 1992 and refined to FIS Basics in 1999, is thefoundation of our FIS program. This class, mandatory for allassociates, is traditionally completed within six months ofemployment. The class now includes an on-the-job simulationwhere associates learn and practice FIS behaviors andprinciples. A panel of KLT members (or senior leadership inmanufacturing and servicing locations) participates in thetraining to answer questions posed by class participants.Advanced FIS training meets specific needs as shown inFigure 5.2-S4. As a result, associates gain a commonunderstanding of our company, culture and its FIS BusinessExcellence model. FIS tools are used daily by associates inteams, meetings, and at their workstations.Figure 5.2-S4 First in Service Training
Course Objective WhoFIS
OrientationNew associates’ introduction to FISprinciples (Orientation Express)
All associates
FIS Basics Understand skills, techniques andtools to embed FIS in daily activities
All associates
FacilitatorTraining
Prepare for team facilitator and FIStrainer roles
Facilitatorcandidates
TeamLeaderTraining
Develop knowledge and skills tolead quality improvement teams
Supervisors,new managers;team leaders
BaldrigeBasics
Develop familiarity with Baldrigecriteria and scoring methodology
All associates
ProjectManage-
ment
Develop knowledge/skills tomanage complex teams/projects
Projectmanagers,
team leaders,facilitators
FIS Trainthe Trainer
Develop skills to effectively deliverFIS Basics training
Line managers
BusinessExcellenceAssessor
Understand Baldrige criteria anddevelop skills for BusinessExcellence assessor role
Seniormanagers
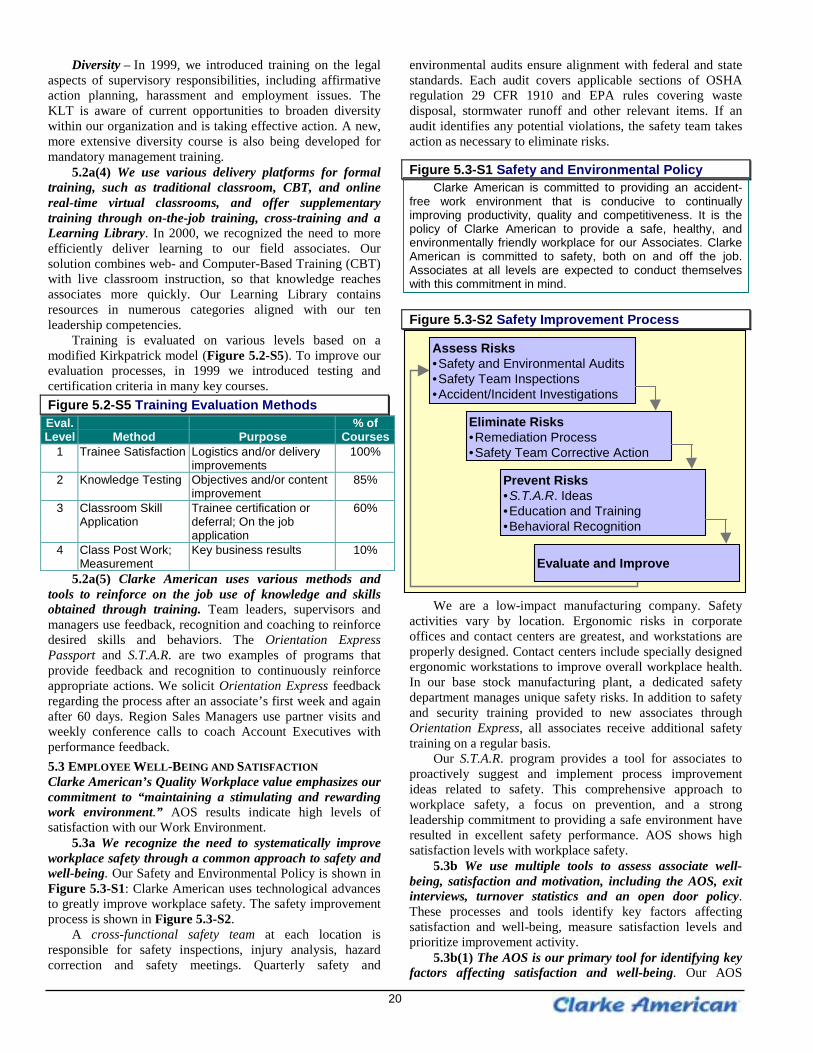
20
Diversity – In 1999, we introduced training on the legalaspects of supervisory responsibilities, including affirmativeaction planning, harassment and employment issues. TheKLT is aware of current opportunities to broaden diversitywithin our organization and is taking effective action. A new,more extensive diversity course is also being developed formandatory management training.
5.2a(4) We use various delivery platforms for formaltraining, such as traditional classroom, CBT, and onlinereal-time virtual classrooms, and offer supplementarytraining through on-the-job training, cross-training and aLearning Library. In 2000, we recognized the need to moreefficiently deliver learning to our field associates. Oursolution combines web- and Computer-Based Training (CBT)with live classroom instruction, so that knowledge reachesassociates more quickly. Our Learning Library containsresources in numerous categories aligned with our tenleadership competencies.
Training is evaluated on various levels based on amodified Kirkpatrick model (Figure 5.2-S5). To improve ourevaluation processes, in 1999 we introduced testing andcertification criteria in many key courses.Figure 5.2-S5 Training Evaluation MethodsEval.Level Method Purpose
% ofCourses
1 Trainee Satisfaction Logistics and/or deliveryimprovements
100%
2 Knowledge Testing Objectives and/or contentimprovement
85%
3 Classroom SkillApplication
Trainee certification ordeferral; On the jobapplication
60%
4 Class Post Work;Measurement
Key business results 10%
5.2a(5) Clarke American uses various methods andtools to reinforce on the job use of knowledge and skillsobtained through training. Team leaders, supervisors andmanagers use feedback, recognition and coaching to reinforcedesired skills and behaviors. The Orientation ExpressPassport and S.T.A.R. are two examples of programs thatprovide feedback and recognition to continuously reinforceappropriate actions. We solicit Orientation Express feedbackregarding the process after an associate’s first week and againafter 60 days. Region Sales Managers use partner visits andweekly conference calls to coach Account Executives withperformance feedback.5.3 EMPLOYEE WELL-BEING AND SATISFACTIONClarke American’s Quality Workplace value emphasizes ourcommitment to “maintaining a stimulating and rewardingwork environment.” AOS results indicate high levels ofsatisfaction with our Work Environment.
5.3a We recognize the need to systematically improveworkplace safety through a common approach to safety andwell-being. Our Safety and Environmental Policy is shown inFigure 5.3-S1: Clarke American uses technological advancesto greatly improve workplace safety. The safety improvementprocess is shown in Figure 5.3-S2.
A cross-functional safety team at each location isresponsible for safety inspections, injury analysis, hazardcorrection and safety meetings. Quarterly safety and
environmental audits ensure alignment with federal and statestandards. Each audit covers applicable sections of OSHAregulation 29 CFR 1910 and EPA rules covering wastedisposal, stormwater runoff and other relevant items. If anaudit identifies any potential violations, the safety team takesaction as necessary to eliminate risks.
Figure 5.3-S1 Safety and Environmental PolicyClarke American is committed to providing an accident-
free work environment that is conducive to continuallyimproving productivity, quality and competitiveness. It is thepolicy of Clarke American to provide a safe, healthy, andenvironmentally friendly workplace for our Associates. ClarkeAmerican is committed to safety, both on and off the job.Associates at all levels are expected to conduct themselveswith this commitment in mind.
Figure 5.3-S2 Safety Improvement Process
Assess Risks•Safety and Environmental Audits•Safety Team Inspections•Accident/Incident Investigations
Eliminate Risks•Remediation Process•Safety Team Corrective Action
Prevent Risks•S.T.A.R. Ideas•Education and Training•Behavioral Recognition
Evaluate and Improve
We are a low-impact manufacturing company. Safetyactivities vary by location. Ergonomic risks in corporateoffices and contact centers are greatest, and workstations areproperly designed. Contact centers include specially designedergonomic workstations to improve overall workplace health.In our base stock manufacturing plant, a dedicated safetydepartment manages unique safety risks. In addition to safetyand security training provided to new associates throughOrientation Express, all associates receive additional safetytraining on a regular basis.
Our S.T.A.R. program provides a tool for associates toproactively suggest and implement process improvementideas related to safety. This comprehensive approach toworkplace safety, a focus on prevention, and a strongleadership commitment to providing a safe environment haveresulted in excellent safety performance. AOS shows highsatisfaction levels with workplace safety.
5.3b We use multiple tools to assess associate well-being, satisfaction and motivation, including the AOS, exitinterviews, turnover statistics and an open door policy.These processes and tools identify key factors affectingsatisfaction and well-being, measure satisfaction levels andprioritize improvement activity.
5.3b(1) The AOS is our primary tool for identifying keyfactors affecting satisfaction and well-being. Our AOS
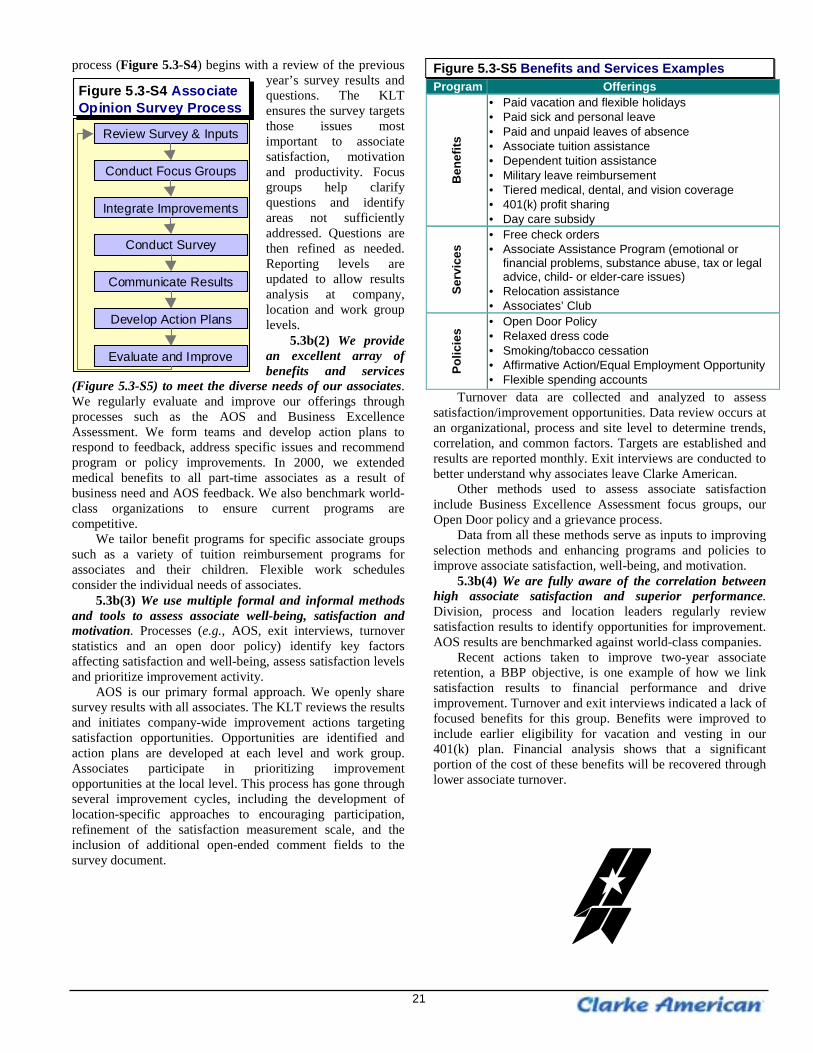
21
process (Figure 5.3-S4) begins with a review of the previousyear’s survey results andquestions. The KLTensures the survey targetsthose issues mostimportant to associatesatisfaction, motivationand productivity. Focusgroups help clarifyquestions and identifyareas not sufficientlyaddressed. Questions arethen refined as needed.Reporting levels areupdated to allow resultsanalysis at company,location and work grouplevels.
5.3b(2) We providean excellent array ofbenefits and services
(Figure 5.3-S5) to meet the diverse needs of our associates.We regularly evaluate and improve our offerings throughprocesses such as the AOS and Business ExcellenceAssessment. We form teams and develop action plans torespond to feedback, address specific issues and recommendprogram or policy improvements. In 2000, we extendedmedical benefits to all part-time associates as a result ofbusiness need and AOS feedback. We also benchmark world-class organizations to ensure current programs arecompetitive.
We tailor benefit programs for specific associate groupssuch as a variety of tuition reimbursement programs forassociates and their children. Flexible work schedulesconsider the individual needs of associates.
5.3b(3) We use multiple formal and informal methodsand tools to assess associate well-being, satisfaction andmotivation. Processes (e.g., AOS, exit interviews, turnoverstatistics and an open door policy) identify key factorsaffecting satisfaction and well-being, assess satisfaction levelsand prioritize improvement activity.
AOS is our primary formal approach. We openly sharesurvey results with all associates. The KLT reviews the resultsand initiates company-wide improvement actions targetingsatisfaction opportunities. Opportunities are identified andaction plans are developed at each level and work group.Associates participate in prioritizing improvementopportunities at the local level. This process has gone throughseveral improvement cycles, including the development oflocation-specific approaches to encouraging participation,refinement of the satisfaction measurement scale, and theinclusion of additional open-ended comment fields to thesurvey document.
Figure 5.3-S5 Benefits and Services ExamplesProgram Offerings
Ben
efits
• Paid vacation and flexible holidays• Paid sick and personal leave• Paid and unpaid leaves of absence• Associate tuition assistance• Dependent tuition assistance• Military leave reimbursement• Tiered medical, dental, and vision coverage• 401(k) profit sharing• Day care subsidy
Serv
ices
• Free check orders• Associate Assistance Program (emotional or
financial problems, substance abuse, tax or legaladvice, child- or elder-care issues)
• Relocation assistance• Associates’ Club
Polic
ies
• Open Door Policy• Relaxed dress code• Smoking/tobacco cessation• Affirmative Action/Equal Employment Opportunity• Flexible spending accounts
Turnover data are collected and analyzed to assesssatisfaction/improvement opportunities. Data review occurs atan organizational, process and site level to determine trends,correlation, and common factors. Targets are established andresults are reported monthly. Exit interviews are conducted tobetter understand why associates leave Clarke American.
Other methods used to assess associate satisfactioninclude Business Excellence Assessment focus groups, ourOpen Door policy and a grievance process.
Data from all these methods serve as inputs to improvingselection methods and enhancing programs and policies toimprove associate satisfaction, well-being, and motivation.
5.3b(4) We are fully aware of the correlation betweenhigh associate satisfaction and superior performance.Division, process and location leaders regularly reviewsatisfaction results to identify opportunities for improvement.AOS results are benchmarked against world-class companies.
Recent actions taken to improve two-year associateretention, a BBP objective, is one example of how we linksatisfaction results to financial performance and driveimprovement. Turnover and exit interviews indicated a lack offocused benefits for this group. Benefits were improved toinclude earlier eligibility for vacation and vesting in our401(k) plan. Financial analysis shows that a significantportion of the cost of these benefits will be recovered throughlower associate turnover.
Review Survey & Inputs
Develop Action Plans
Evaluate and Improve
Conduct Survey
Integrate Improvements
Conduct Focus Groups
Communicate Results
Figure 5.3-S4 AssociateOpinion Survey ProcessFigure 5.3-S4 AssociateOpinion Survey Process
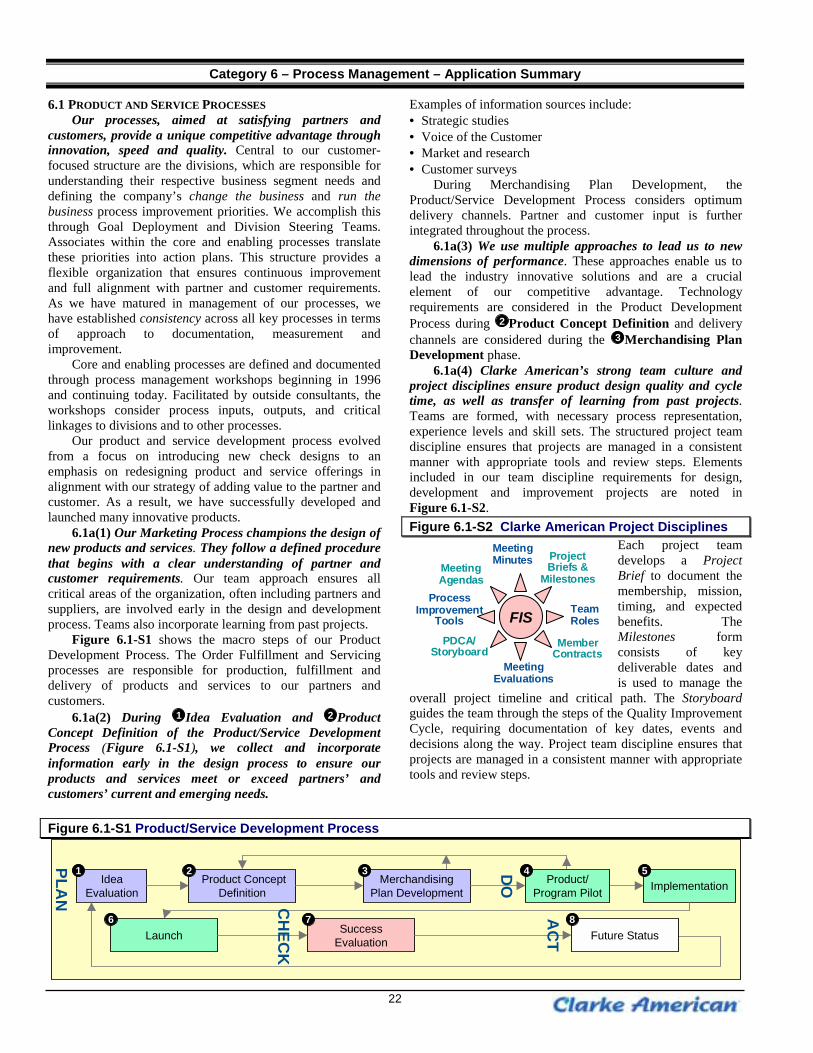
22
Category 6 – Process Management – Application Summary
6.1 PRODUCT AND SERVICE PROCESSESOur processes, aimed at satisfying partners and
customers, provide a unique competitive advantage throughinnovation, speed and quality. Central to our customer-focused structure are the divisions, which are responsible forunderstanding their respective business segment needs anddefining the company’s change the business and run thebusiness process improvement priorities. We accomplish thisthrough Goal Deployment and Division Steering Teams.Associates within the core and enabling processes translatethese priorities into action plans. This structure provides aflexible organization that ensures continuous improvementand full alignment with partner and customer requirements.As we have matured in management of our processes, wehave established consistency across all key processes in termsof approach to documentation, measurement andimprovement.
Core and enabling processes are defined and documentedthrough process management workshops beginning in 1996and continuing today. Facilitated by outside consultants, theworkshops consider process inputs, outputs, and criticallinkages to divisions and to other processes.
Our product and service development process evolvedfrom a focus on introducing new check designs to anemphasis on redesigning product and service offerings inalignment with our strategy of adding value to the partner andcustomer. As a result, we have successfully developed andlaunched many innovative products.
6.1a(1) Our Marketing Process champions the design ofnew products and services. They follow a defined procedurethat begins with a clear understanding of partner andcustomer requirements. Our team approach ensures allcritical areas of the organization, often including partners andsuppliers, are involved early in the design and developmentprocess. Teams also incorporate learning from past projects.
Figure 6.1-S1 shows the macro steps of our ProductDevelopment Process. The Order Fulfillment and Servicingprocesses are responsible for production, fulfillment anddelivery of products and services to our partners andcustomers.
6.1a(2) During 1 Idea Evaluation and 2 ProductConcept Definition of the Product/Service DevelopmentProcess (Figure 6.1-S1), we collect and incorporateinformation early in the design process to ensure ourproducts and services meet or exceed partners’ andcustomers’ current and emerging needs.
Examples of information sources include:• Strategic studies• Voice of the Customer• Market and research• Customer surveys
During Merchandising Plan Development, theProduct/Service Development Process considers optimumdelivery channels. Partner and customer input is furtherintegrated throughout the process.
6.1a(3) We use multiple approaches to lead us to newdimensions of performance. These approaches enable us tolead the industry innovative solutions and are a crucialelement of our competitive advantage. Technologyrequirements are considered in the Product DevelopmentProcess during 2 Product Concept Definition and deliverychannels are considered during the 3 Merchandising PlanDevelopment phase.
6.1a(4) Clarke American’s strong team culture andproject disciplines ensure product design quality and cycletime, as well as transfer of learning from past projects.Teams are formed, with necessary process representation,experience levels and skill sets. The structured project teamdiscipline ensures that projects are managed in a consistentmanner with appropriate tools and review steps. Elementsincluded in our team discipline requirements for design,development and improvement projects are noted inFigure 6.1-S2.Figure 6.1-S2 Clarke American Project Disciplines
Each project teamdevelops a ProjectBrief to document themembership, mission,timing, and expectedbenefits. TheMilestones formconsists of keydeliverable dates andis used to manage the
overall project timeline and critical path. The Storyboardguides the team through the steps of the Quality ImprovementCycle, requiring documentation of key dates, events anddecisions along the way. Project team discipline ensures thatprojects are managed in a consistent manner with appropriatetools and review steps.
Figure 6.1-S1 Product/Service Development Process
PLAN
IdeaEvaluation
Product Concept Definition
DO Implementation
Launch SuccessEvaluation
MerchandisingPlan Development
1 3
6 7
52
CH
ECK
AC
T
Product/Program Pilot
4
Future Status8
FIS
ProjectBriefs &
Milestones
TeamRoles
ProcessImprovement
Tools
MemberContracts
MeetingMinutes
MeetingAgendas
MeetingEvaluations
PDCA/Storyboard
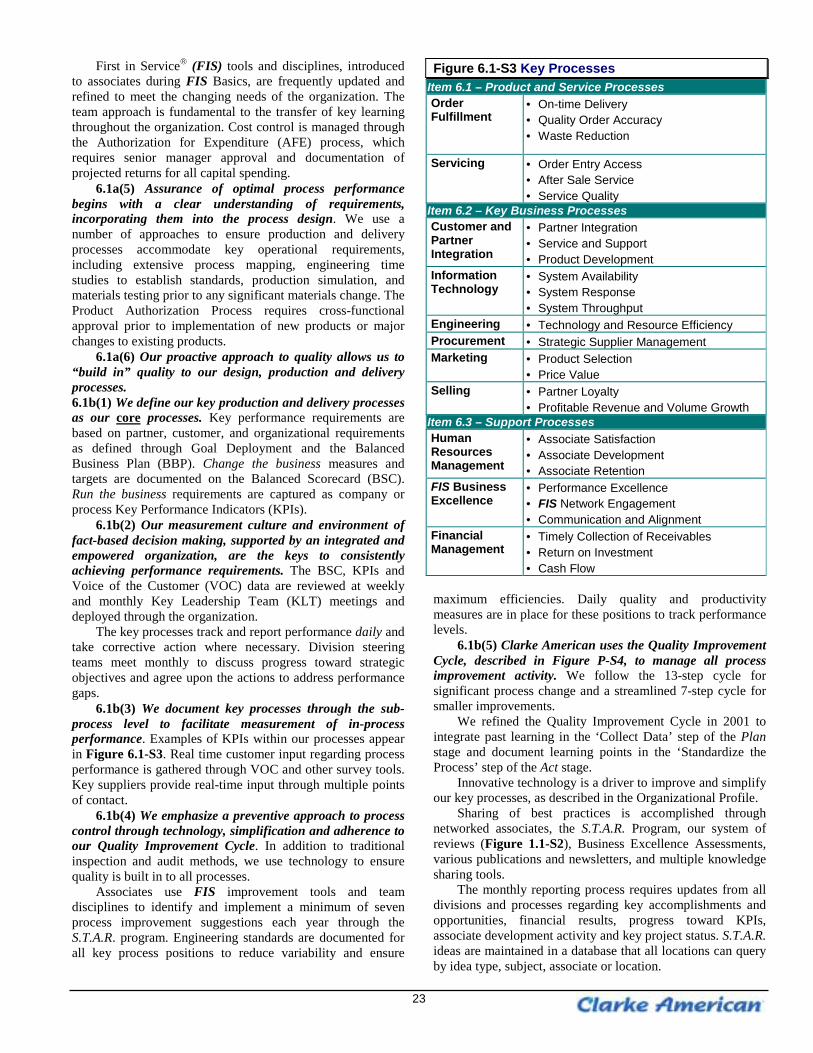
23
First in Service� (FIS) tools and disciplines, introducedto associates during FIS Basics, are frequently updated andrefined to meet the changing needs of the organization. Theteam approach is fundamental to the transfer of key learningthroughout the organization. Cost control is managed throughthe Authorization for Expenditure (AFE) process, whichrequires senior manager approval and documentation ofprojected returns for all capital spending.
6.1a(5) Assurance of optimal process performancebegins with a clear understanding of requirements,incorporating them into the process design. We use anumber of approaches to ensure production and deliveryprocesses accommodate key operational requirements,including extensive process mapping, engineering timestudies to establish standards, production simulation, andmaterials testing prior to any significant materials change. TheProduct Authorization Process requires cross-functionalapproval prior to implementation of new products or majorchanges to existing products.
6.1a(6) Our proactive approach to quality allows us to“build in” quality to our design, production and deliveryprocesses.6.1b(1) We define our key production and delivery processesas our core processes. Key performance requirements arebased on partner, customer, and organizational requirementsas defined through Goal Deployment and the BalancedBusiness Plan (BBP). Change the business measures andtargets are documented on the Balanced Scorecard (BSC).Run the business requirements are captured as company orprocess Key Performance Indicators (KPIs).
6.1b(2) Our measurement culture and environment offact-based decision making, supported by an integrated andempowered organization, are the keys to consistentlyachieving performance requirements. The BSC, KPIs andVoice of the Customer (VOC) data are reviewed at weeklyand monthly Key Leadership Team (KLT) meetings anddeployed through the organization.
The key processes track and report performance daily andtake corrective action where necessary. Division steeringteams meet monthly to discuss progress toward strategicobjectives and agree upon the actions to address performancegaps.
6.1b(3) We document key processes through the sub-process level to facilitate measurement of in-processperformance. Examples of KPIs within our processes appearin Figure 6.1-S3. Real time customer input regarding processperformance is gathered through VOC and other survey tools.Key suppliers provide real-time input through multiple pointsof contact.
6.1b(4) We emphasize a preventive approach to processcontrol through technology, simplification and adherence toour Quality Improvement Cycle. In addition to traditionalinspection and audit methods, we use technology to ensurequality is built in to all processes.
Associates use FIS improvement tools and teamdisciplines to identify and implement a minimum of sevenprocess improvement suggestions each year through theS.T.A.R. program. Engineering standards are documented forall key process positions to reduce variability and ensure
Figure 6.1-S3 Key ProcessesItem 6.1 – Product and Service ProcessesOrderFulfillment
• On-time Delivery• Quality Order Accuracy• Waste Reduction
Servicing • Order Entry Access• After Sale Service• Service Quality
Item 6.2 – Key Business ProcessesCustomer andPartnerIntegration
• Partner Integration• Service and Support• Product Development
InformationTechnology
• System Availability• System Response• System Throughput
Engineering • Technology and Resource EfficiencyProcurement • Strategic Supplier ManagementMarketing • Product Selection
• Price ValueSelling • Partner Loyalty
• Profitable Revenue and Volume GrowthItem 6.3 – Support ProcessesHumanResourcesManagement
• Associate Satisfaction• Associate Development• Associate Retention
FIS BusinessExcellence
• Performance Excellence• FIS Network Engagement• Communication and Alignment
FinancialManagement
• Timely Collection of Receivables• Return on Investment• Cash Flow
maximum efficiencies. Daily quality and productivitymeasures are in place for these positions to track performancelevels.
6.1b(5) Clarke American uses the Quality ImprovementCycle, described in Figure P-S4, to manage all processimprovement activity. We follow the 13-step cycle forsignificant process change and a streamlined 7-step cycle forsmaller improvements.
We refined the Quality Improvement Cycle in 2001 tointegrate past learning in the ‘Collect Data’ step of the Planstage and document learning points in the ‘Standardize theProcess’ step of the Act stage.
Innovative technology is a driver to improve and simplifyour key processes, as described in the Organizational Profile.
Sharing of best practices is accomplished throughnetworked associates, the S.T.A.R. Program, our system ofreviews (Figure 1.1-S2), Business Excellence Assessments,various publications and newsletters, and multiple knowledgesharing tools.
The monthly reporting process requires updates from alldivisions and processes regarding key accomplishments andopportunities, financial results, progress toward KPIs,associate development activity and key project status. S.T.A.R.ideas are maintained in a database that all locations can queryby idea type, subject, associate or location.
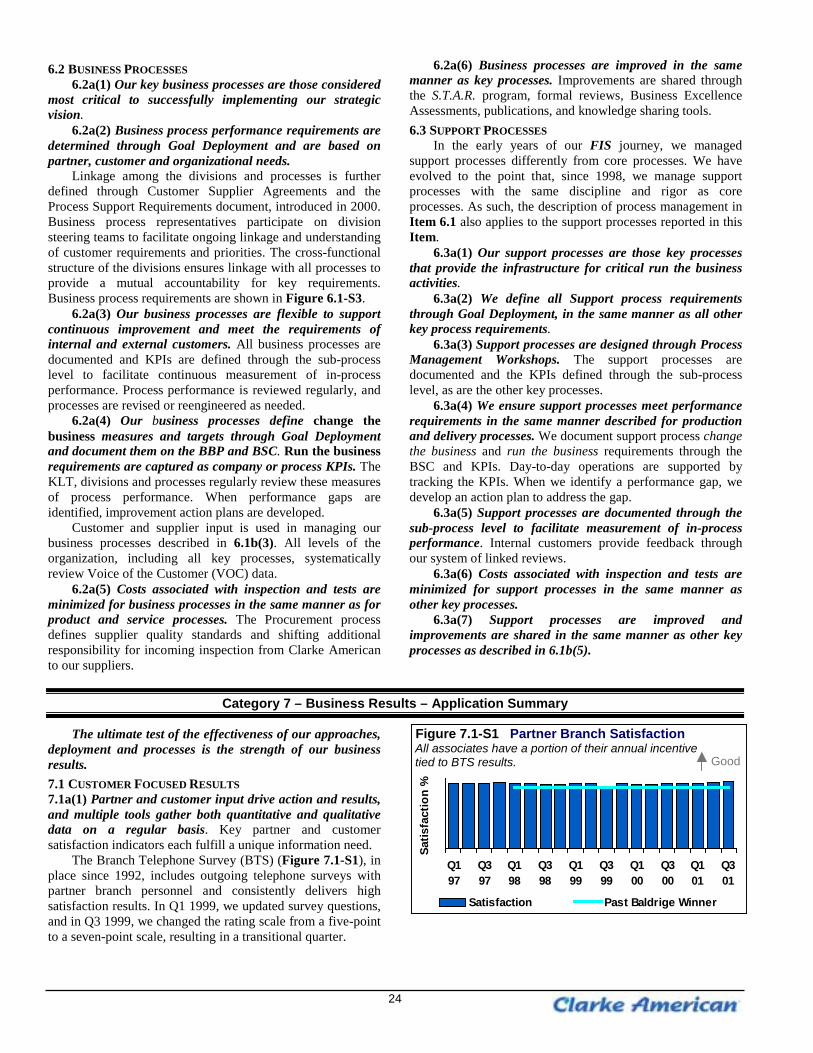
24
6.2 BUSINESS PROCESSES6.2a(1) Our key business processes are those considered
most critical to successfully implementing our strategicvision.
6.2a(2) Business process performance requirements aredetermined through Goal Deployment and are based onpartner, customer and organizational needs.
Linkage among the divisions and processes is furtherdefined through Customer Supplier Agreements and theProcess Support Requirements document, introduced in 2000.Business process representatives participate on divisionsteering teams to facilitate ongoing linkage and understandingof customer requirements and priorities. The cross-functionalstructure of the divisions ensures linkage with all processes toprovide a mutual accountability for key requirements.Business process requirements are shown in Figure 6.1-S3.
6.2a(3) Our business processes are flexible to supportcontinuous improvement and meet the requirements ofinternal and external customers. All business processes aredocumented and KPIs are defined through the sub-processlevel to facilitate continuous measurement of in-processperformance. Process performance is reviewed regularly, andprocesses are revised or reengineered as needed.
6.2a(4) Our business processes define change thebusiness measures and targets through Goal Deploymentand document them on the BBP and BSC. Run the businessrequirements are captured as company or process KPIs. TheKLT, divisions and processes regularly review these measuresof process performance. When performance gaps areidentified, improvement action plans are developed.
Customer and supplier input is used in managing ourbusiness processes described in 6.1b(3). All levels of theorganization, including all key processes, systematicallyreview Voice of the Customer (VOC) data.
6.2a(5) Costs associated with inspection and tests areminimized for business processes in the same manner as forproduct and service processes. The Procurement processdefines supplier quality standards and shifting additionalresponsibility for incoming inspection from Clarke Americanto our suppliers.
6.2a(6) Business processes are improved in the samemanner as key processes. Improvements are shared throughthe S.T.A.R. program, formal reviews, Business ExcellenceAssessments, publications, and knowledge sharing tools.6.3 SUPPORT PROCESSES
In the early years of our FIS journey, we managedsupport processes differently from core processes. We haveevolved to the point that, since 1998, we manage supportprocesses with the same discipline and rigor as coreprocesses. As such, the description of process management inItem 6.1 also applies to the support processes reported in thisItem.
6.3a(1) Our support processes are those key processesthat provide the infrastructure for critical run the businessactivities.
6.3a(2) We define all Support process requirementsthrough Goal Deployment, in the same manner as all otherkey process requirements.
6.3a(3) Support processes are designed through ProcessManagement Workshops. The support processes aredocumented and the KPIs defined through the sub-processlevel, as are the other key processes.
6.3a(4) We ensure support processes meet performancerequirements in the same manner described for productionand delivery processes. We document support process changethe business and run the business requirements through theBSC and KPIs. Day-to-day operations are supported bytracking the KPIs. When we identify a performance gap, wedevelop an action plan to address the gap.
6.3a(5) Support processes are documented through thesub-process level to facilitate measurement of in-processperformance. Internal customers provide feedback throughour system of linked reviews.
6.3a(6) Costs associated with inspection and tests areminimized for support processes in the same manner asother key processes.
6.3a(7) Support processes are improved andimprovements are shared in the same manner as other keyprocesses as described in 6.1b(5).
Category 7 – Business Results – Application Summary
The ultimate test of the effectiveness of our approaches,deployment and processes is the strength of our businessresults.7.1 CUSTOMER FOCUSED RESULTS7.1a(1) Partner and customer input drive action and results,and multiple tools gather both quantitative and qualitativedata on a regular basis. Key partner and customersatisfaction indicators each fulfill a unique information need.
The Branch Telephone Survey (BTS) (Figure 7.1-S1), inplace since 1992, includes outgoing telephone surveys withpartner branch personnel and consistently delivers highsatisfaction results. In Q1 1999, we updated survey questions,and in Q3 1999, we changed the rating scale from a five-pointto a seven-point scale, resulting in a transitional quarter.
Figure 7.1-S1 Partner Branch SatisfactionAll associates have a portion of their annual incentivetied to BTS results.
4 0%
6 0%
8 0%
1 0 0%
Q197
Q397
Q198
Q398
Q199
Q399
Q100
Q300
Q101
Q301
Satis
fact
ion
%
Satisfaction Past Baldrige Winner
Good
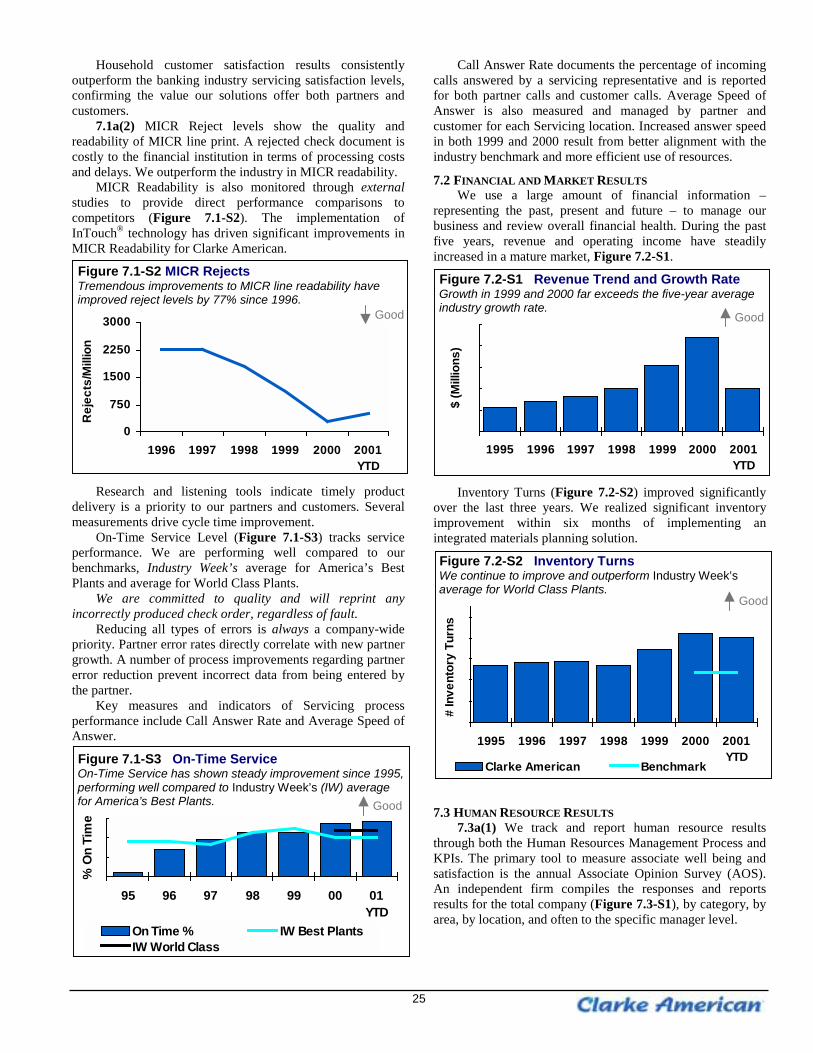
25
Household customer satisfaction results consistentlyoutperform the banking industry servicing satisfaction levels,confirming the value our solutions offer both partners andcustomers.
7.1a(2) MICR Reject levels show the quality andreadability of MICR line print. A rejected check document iscostly to the financial institution in terms of processing costsand delays. We outperform the industry in MICR readability.
MICR Readability is also monitored through externalstudies to provide direct performance comparisons tocompetitors (Figure 7.1-S2). The implementation ofInTouch® technology has driven significant improvements inMICR Readability for Clarke American.
Figure 7.1-S2 MICR RejectsTremendous improvements to MICR line readability haveimproved reject levels by 77% since 1996.
0
750
1500
2250
3000
1996 1997 1998 1999 2000 2001YTD
Rej
ects
/Mill
ion
Research and listening tools indicate timely productdelivery is a priority to our partners and customers. Severalmeasurements drive cycle time improvement.
On-Time Service Level (Figure 7.1-S3) tracks serviceperformance. We are performing well compared to ourbenchmarks, Industry Week’s average for America’s BestPlants and average for World Class Plants.
We are committed to quality and will reprint anyincorrectly produced check order, regardless of fault.
Reducing all types of errors is always a company-widepriority. Partner error rates directly correlate with new partnergrowth. A number of process improvements regarding partnererror reduction prevent incorrect data from being entered bythe partner.
Key measures and indicators of Servicing processperformance include Call Answer Rate and Average Speed ofAnswer.
Figure 7.1-S3 On-Time ServiceOn-Time Service has shown steady improvement since 1995,performing well compared to Industry Week’s (IW) averagefor America’s Best Plants.
8 5
9 0
9 5
1 0 0
95 96 97 98 99 00 01YTD
% O
n Ti
me
On Time % IW Best PlantsIW World Class
Call Answer Rate documents the percentage of incomingcalls answered by a servicing representative and is reportedfor both partner calls and customer calls. Average Speed ofAnswer is also measured and managed by partner andcustomer for each Servicing location. Increased answer speedin both 1999 and 2000 result from better alignment with theindustry benchmark and more efficient use of resources.
7.2 FINANCIAL AND MARKET RESULTSWe use a large amount of financial information –
representing the past, present and future – to manage ourbusiness and review overall financial health. During the pastfive years, revenue and operating income have steadilyincreased in a mature market, Figure 7.2-S1.
Figure 7.2-S1 Revenue Trend and Growth RateGrowth in 1999 and 2000 far exceeds the five-year averageindustry growth rate.
2 5 0
3 0 0
3 5 0
4 0 0
4 5 0
5 0 0
1995 1996 1997 1998 1999 2000 2001YTD
$ (M
illio
ns)
Inventory Turns (Figure 7.2-S2) improved significantlyover the last three years. We realized significant inventoryimprovement within six months of implementing anintegrated materials planning solution.
Figure 7.2-S2 Inventory TurnsWe continue to improve and outperform Industry Week’saverage for World Class Plants.
5
7
9
1 1
1 3
1 5
1995 1996 1997 1998 1999 2000 2001YTD
# In
vent
ory
Turn
s
Clarke American Benchmark
7.3 HUMAN RESOURCE RESULTS7.3a(1) We track and report human resource results
through both the Human Resources Management Process andKPIs. The primary tool to measure associate well being andsatisfaction is the annual Associate Opinion Survey (AOS).An independent firm compiles the responses and reportsresults for the total company (Figure 7.3-S1), by category, byarea, by location, and often to the specific manager level.
Good
Good
GoodGood
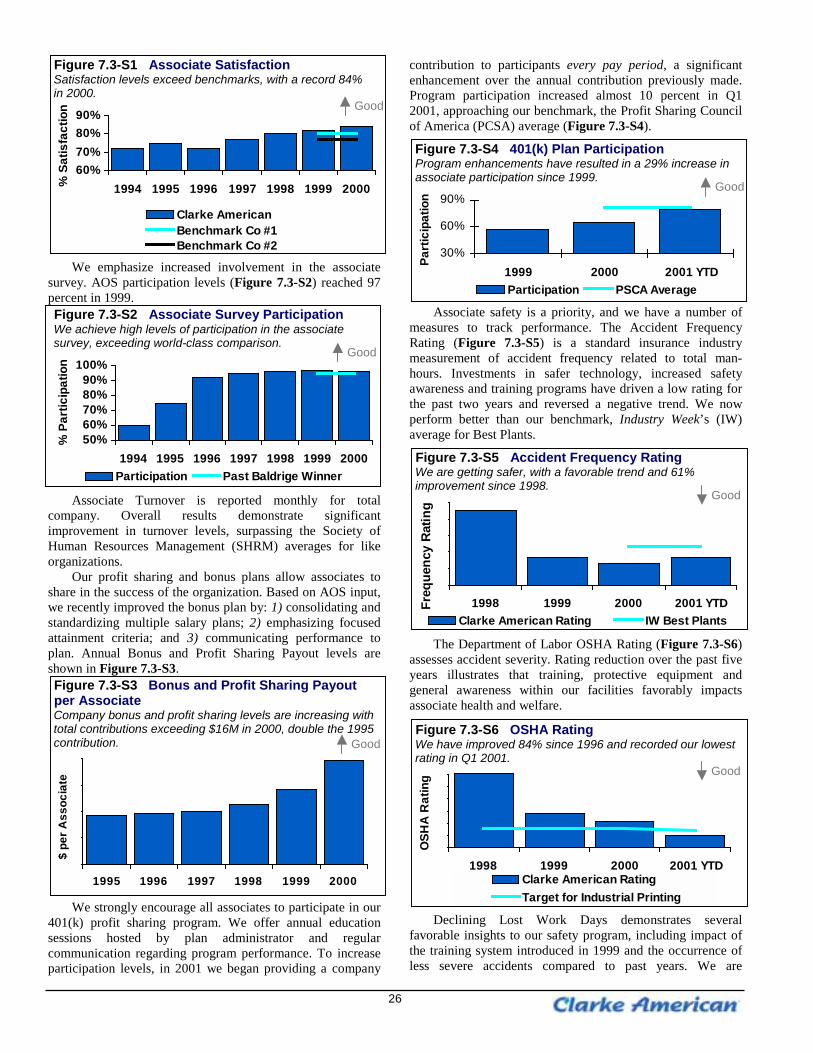
26
Figure 7.3-S1 Associate SatisfactionSatisfaction levels exceed benchmarks, with a record 84%in 2000.
60%70%80%90%
1994 1995 1996 1997 1998 1999 2000% S
atis
fact
ion
Clarke AmericanBenchmark Co #1Benchmark Co #2
We emphasize increased involvement in the associatesurvey. AOS participation levels (Figure 7.3-S2) reached 97percent in 1999.Figure 7.3-S2 Associate Survey ParticipationWe achieve high levels of participation in the associatesurvey, exceeding world-class comparison.
50%60%70%80%90%
100%
1994 1995 1996 1997 1998 1999 2000
% P
artic
ipat
ion
Participation Past Baldrige Winner
Associate Turnover is reported monthly for totalcompany. Overall results demonstrate significantimprovement in turnover levels, surpassing the Society ofHuman Resources Management (SHRM) averages for likeorganizations.
Our profit sharing and bonus plans allow associates toshare in the success of the organization. Based on AOS input,we recently improved the bonus plan by: 1) consolidating andstandardizing multiple salary plans; 2) emphasizing focusedattainment criteria; and 3) communicating performance toplan. Annual Bonus and Profit Sharing Payout levels areshown in Figure 7.3-S3.Figure 7.3-S3 Bonus and Profit Sharing Payoutper AssociateCompany bonus and profit sharing levels are increasing withtotal contributions exceeding $16M in 2000, double the 1995contribution.
$ 1 ,000
$ 2 ,000
$ 3 ,000
$ 4 ,000
$ 5 ,000
1995 1996 1997 1998 1999 2000
$ pe
r Ass
ocia
te
We strongly encourage all associates to participate in our401(k) profit sharing program. We offer annual educationsessions hosted by plan administrator and regularcommunication regarding program performance. To increaseparticipation levels, in 2001 we began providing a company
contribution to participants every pay period, a significantenhancement over the annual contribution previously made.Program participation increased almost 10 percent in Q12001, approaching our benchmark, the Profit Sharing Councilof America (PCSA) average (Figure 7.3-S4).
Figure 7.3-S4 401(k) Plan ParticipationProgram enhancements have resulted in a 29% increase inassociate participation since 1999.
30%
60%
90%
1999 2000 2001 YTD
Part
icip
atio
n
Participation PSCA Average
Associate safety is a priority, and we have a number ofmeasures to track performance. The Accident FrequencyRating (Figure 7.3-S5) is a standard insurance industrymeasurement of accident frequency related to total man-hours. Investments in safer technology, increased safetyawareness and training programs have driven a low rating forthe past two years and reversed a negative trend. We nowperform better than our benchmark, Industry Week’s (IW)average for Best Plants.
Figure 7.3-S5 Accident Frequency RatingWe are getting safer, with a favorable trend and 61%improvement since 1998.
0
4
8
1 2
1 6
2 0
1998 1999 2000 2001 YTDFreq
uenc
y Ra
ting
Clarke American Rating IW Best Plants
The Department of Labor OSHA Rating (Figure 7.3-S6)assesses accident severity. Rating reduction over the past fiveyears illustrates that training, protective equipment andgeneral awareness within our facilities favorably impactsassociate health and welfare.
Figure 7.3-S6 OSHA RatingWe have improved 84% since 1996 and recorded our lowestrating in Q1 2001.
0
1 0
2 0
3 0
4 0
5 0
6 0
1998 1999 2000 2001 YTD
OSH
A R
atin
g
Clarke American RatingTarget for Industrial Printing
Declining Lost Work Days demonstrates severalfavorable insights to our safety program, including impact ofthe training system introduced in 1999 and the occurrence ofless severe accidents compared to past years. We are
Good
Good
Good
Good
Good
Good
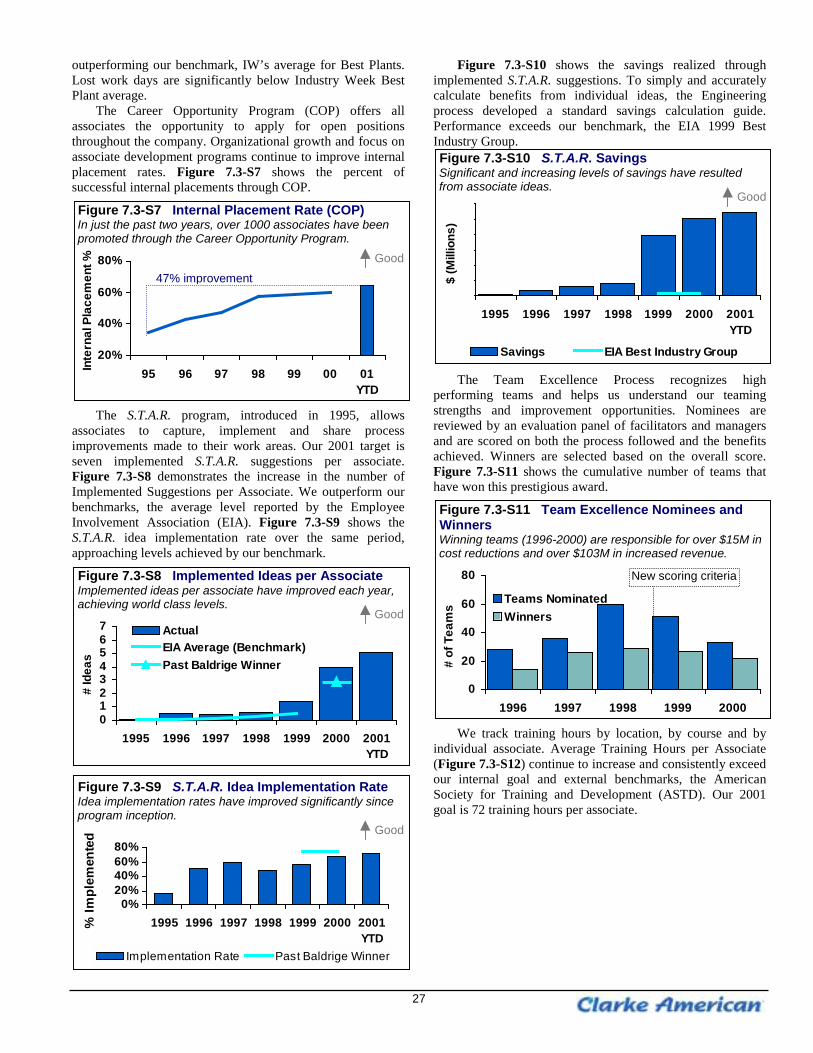
27
outperforming our benchmark, IW’s average for Best Plants.Lost work days are significantly below Industry Week BestPlant average.
The Career Opportunity Program (COP) offers allassociates the opportunity to apply for open positionsthroughout the company. Organizational growth and focus onassociate development programs continue to improve internalplacement rates. Figure 7.3-S7 shows the percent ofsuccessful internal placements through COP.
Figure 7.3-S7 Internal Placement Rate (COP)In just the past two years, over 1000 associates have beenpromoted through the Career Opportunity Program.
20%
40%
60%
80%
95 96 97 98 99 00 01YTD
Inte
rnal
Pla
cem
ent %
The S.T.A.R. program, introduced in 1995, allowsassociates to capture, implement and share processimprovements made to their work areas. Our 2001 target isseven implemented S.T.A.R. suggestions per associate.Figure 7.3-S8 demonstrates the increase in the number ofImplemented Suggestions per Associate. We outperform ourbenchmarks, the average level reported by the EmployeeInvolvement Association (EIA). Figure 7.3-S9 shows theS.T.A.R. idea implementation rate over the same period,approaching levels achieved by our benchmark.
Figure 7.3-S8 Implemented Ideas per AssociateImplemented ideas per associate have improved each year,achieving world class levels.
01234567
1995 1996 1997 1998 1999 2000 2001YTD
# Id
eas
ActualEIA Average (Benchmark)Past Baldrige Winner
Figure 7.3-S9 S.T.A.R. Idea Implementation RateIdea implementation rates have improved significantly sinceprogram inception.
0%20%40%60%80%
1995 1996 1997 1998 1999 2000 2001YTD
% Im
plem
ente
d
Implementation Rate Past Baldrige Winner
Figure 7.3-S10 shows the savings realized throughimplemented S.T.A.R. suggestions. To simply and accuratelycalculate benefits from individual ideas, the Engineeringprocess developed a standard savings calculation guide.Performance exceeds our benchmark, the EIA 1999 BestIndustry Group.Figure 7.3-S10 S.T.A.R. SavingsSignificant and increasing levels of savings have resultedfrom associate ideas.
$ 0
$ 2
$ 4
$ 6
$ 8
$ 1 0
$ 1 2
1995 1996 1997 1998 1999 2000 2001YTD
$ (M
illio
ns)
Savings EIA Best Industry Group
The Team Excellence Process recognizes highperforming teams and helps us understand our teamingstrengths and improvement opportunities. Nominees arereviewed by an evaluation panel of facilitators and managersand are scored on both the process followed and the benefitsachieved. Winners are selected based on the overall score.Figure 7.3-S11 shows the cumulative number of teams thathave won this prestigious award.
Figure 7.3-S11 Team Excellence Nominees andWinnersWinning teams (1996-2000) are responsible for over $15M incost reductions and over $103M in increased revenue.
0
20
40
60
80
1996 1997 1998 1999 2000
# of
Tea
ms
Teams NominatedWinners
We track training hours by location, by course and byindividual associate. Average Training Hours per Associate(Figure 7.3-S12) continue to increase and consistently exceedour internal goal and external benchmarks, the AmericanSociety for Training and Development (ASTD). Our 2001goal is 72 training hours per associate.
New scoring criteria
Good
Good
Good
Good
47% improvement
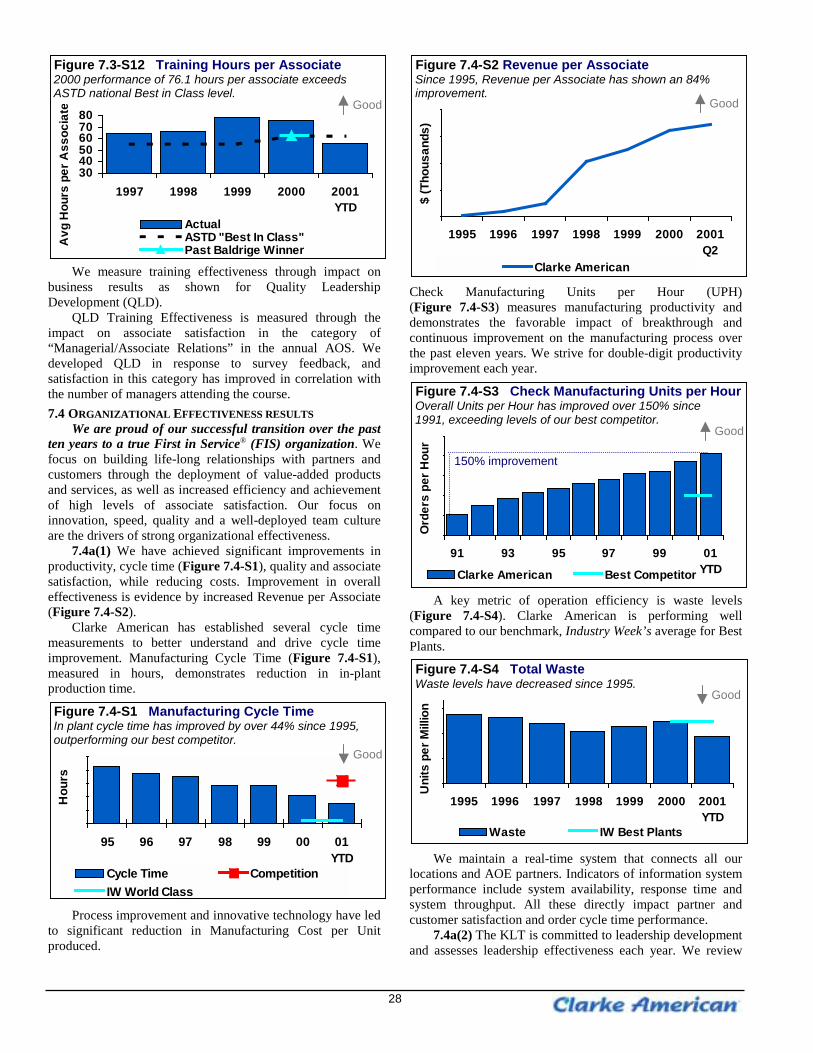
28
Figure 7.3-S12 Training Hours per Associate2000 performance of 76.1 hours per associate exceedsASTD national Best in Class level.
304050607080
1997 1998 1999 2000 2001YTD
Avg
Hou
rs p
er A
ssoc
iate
ActualASTD "Best In Class"Past Baldrige Winner
We measure training effectiveness through impact onbusiness results as shown for Quality LeadershipDevelopment (QLD).
QLD Training Effectiveness is measured through theimpact on associate satisfaction in the category of“Managerial/Associate Relations” in the annual AOS. Wedeveloped QLD in response to survey feedback, andsatisfaction in this category has improved in correlation withthe number of managers attending the course.7.4 ORGANIZATIONAL EFFECTIVENESS RESULTS
We are proud of our successful transition over the pastten years to a true First in Service® (FIS) organization. Wefocus on building life-long relationships with partners andcustomers through the deployment of value-added productsand services, as well as increased efficiency and achievementof high levels of associate satisfaction. Our focus oninnovation, speed, quality and a well-deployed team cultureare the drivers of strong organizational effectiveness.
7.4a(1) We have achieved significant improvements inproductivity, cycle time (Figure 7.4-S1), quality and associatesatisfaction, while reducing costs. Improvement in overalleffectiveness is evidence by increased Revenue per Associate(Figure 7.4-S2).
Clarke American has established several cycle timemeasurements to better understand and drive cycle timeimprovement. Manufacturing Cycle Time (Figure 7.4-S1),measured in hours, demonstrates reduction in in-plantproduction time.
Figure 7.4-S1 Manufacturing Cycle TimeIn plant cycle time has improved by over 44% since 1995,outperforming our best competitor.
1 0
1 5
2 0
2 5
3 0
3 5
95 96 97 98 99 00 01YTD
Hou
rs
Cycle Time CompetitionIW World Class
Process improvement and innovative technology have ledto significant reduction in Manufacturing Cost per Unitproduced.
Figure 7.4-S2 Revenue per AssociateSince 1995, Revenue per Associate has shown an 84%improvement.
80
100
120
140
160
1995 1996 1997 1998 1999 2000 2001Q2
$ (T
hous
ands
)
Clarke American
Check Manufacturing Units per Hour (UPH)(Figure 7.4-S3) measures manufacturing productivity anddemonstrates the favorable impact of breakthrough andcontinuous improvement on the manufacturing process overthe past eleven years. We strive for double-digit productivityimprovement each year.
Figure 7.4-S3 Check Manufacturing Units per HourOverall Units per Hour has improved over 150% since1991, exceeding levels of our best competitor.
5
1 0
1 5
2 0
2 5
3 0
91 93 95 97 99 01YTD
Ord
ers
per H
our
Clarke American Best Competitor
A key metric of operation efficiency is waste levels(Figure 7.4-S4). Clarke American is performing wellcompared to our benchmark, Industry Week’s average for BestPlants.
Figure 7.4-S4 Total WasteWaste levels have decreased since 1995.
0
7 5 00
1 5 000
2 2 5 00
1995 1996 1997 1998 1999 2000 2001YTD
Uni
ts p
er M
illio
n
Waste IW Best Plants
We maintain a real-time system that connects all ourlocations and AOE partners. Indicators of information systemperformance include system availability, response time andsystem throughput. All these directly impact partner andcustomer satisfaction and order cycle time performance.
7.4a(2) The KLT is committed to leadership developmentand assesses leadership effectiveness each year. We review
150% improvement
Good
Good
Good
Good
Good
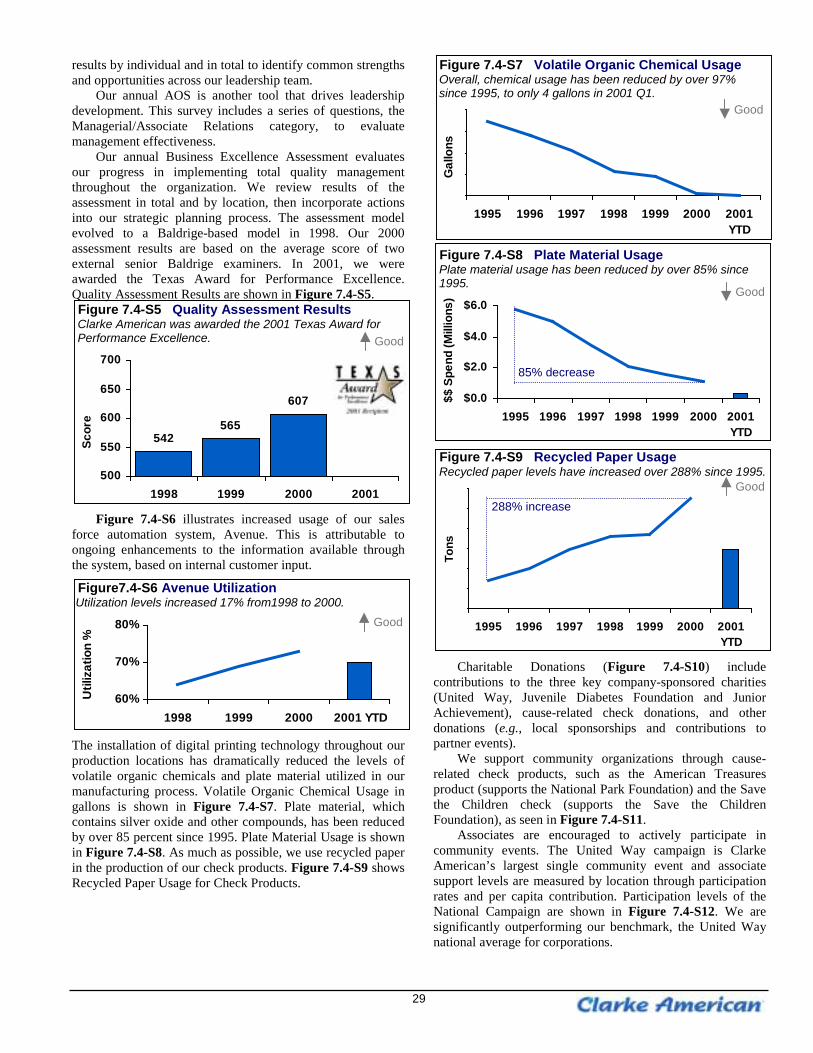
29
results by individual and in total to identify common strengthsand opportunities across our leadership team.
Our annual AOS is another tool that drives leadershipdevelopment. This survey includes a series of questions, theManagerial/Associate Relations category, to evaluatemanagement effectiveness.
Our annual Business Excellence Assessment evaluatesour progress in implementing total quality managementthroughout the organization. We review results of theassessment in total and by location, then incorporate actionsinto our strategic planning process. The assessment modelevolved to a Baldrige-based model in 1998. Our 2000assessment results are based on the average score of twoexternal senior Baldrige examiners. In 2001, we wereawarded the Texas Award for Performance Excellence.Quality Assessment Results are shown in Figure 7.4-S5.Figure 7.4-S5 Quality Assessment ResultsClarke American was awarded the 2001 Texas Award forPerformance Excellence.
542565
607
500
550
600
650
700
1998 1999 2000 2001
Scor
e
Figure 7.4-S6 illustrates increased usage of our salesforce automation system, Avenue. This is attributable toongoing enhancements to the information available throughthe system, based on internal customer input.
Figure7.4-S6 Avenue UtilizationUtilization levels increased 17% from1998 to 2000.
60%
70%
80%
1998 1999 2000 2001 YTD
Util
izat
ion
%
The installation of digital printing technology throughout ourproduction locations has dramatically reduced the levels ofvolatile organic chemicals and plate material utilized in ourmanufacturing process. Volatile Organic Chemical Usage ingallons is shown in Figure 7.4-S7. Plate material, whichcontains silver oxide and other compounds, has been reducedby over 85 percent since 1995. Plate Material Usage is shownin Figure 7.4-S8. As much as possible, we use recycled paperin the production of our check products. Figure 7.4-S9 showsRecycled Paper Usage for Check Products.
Figure 7.4-S7 Volatile Organic Chemical UsageOverall, chemical usage has been reduced by over 97%since 1995, to only 4 gallons in 2001 Q1.
0
1 ,000
2 ,000
3 ,000
4 ,000
1995 1996 1997 1998 1999 2000 2001YTD
Gal
lons
Figure 7.4-S8 Plate Material UsagePlate material usage has been reduced by over 85% since1995.
$0.0
$2.0
$4.0
$6.0
1995 1996 1997 1998 1999 2000 2001YTD
$$ S
pend
(Mill
ions
)Figure 7.4-S9 Recycled Paper UsageRecycled paper levels have increased over 288% since 1995.
0
200
400
600
800
1000
1200
1995 1996 1997 1998 1999 2000 2001YTD
Tons
Charitable Donations (Figure 7.4-S10) includecontributions to the three key company-sponsored charities(United Way, Juvenile Diabetes Foundation and JuniorAchievement), cause-related check donations, and otherdonations (e.g., local sponsorships and contributions topartner events).
We support community organizations through cause-related check products, such as the American Treasuresproduct (supports the National Park Foundation) and the Savethe Children check (supports the Save the ChildrenFoundation), as seen in Figure 7.4-S11.
Associates are encouraged to actively participate incommunity events. The United Way campaign is ClarkeAmerican’s largest single community event and associatesupport levels are measured by location through participationrates and per capita contribution. Participation levels of theNational Campaign are shown in Figure 7.4-S12. We aresignificantly outperforming our benchmark, the United Waynational average for corporations.
Good
Good
Good
Good
85% decrease
288% increase
Good
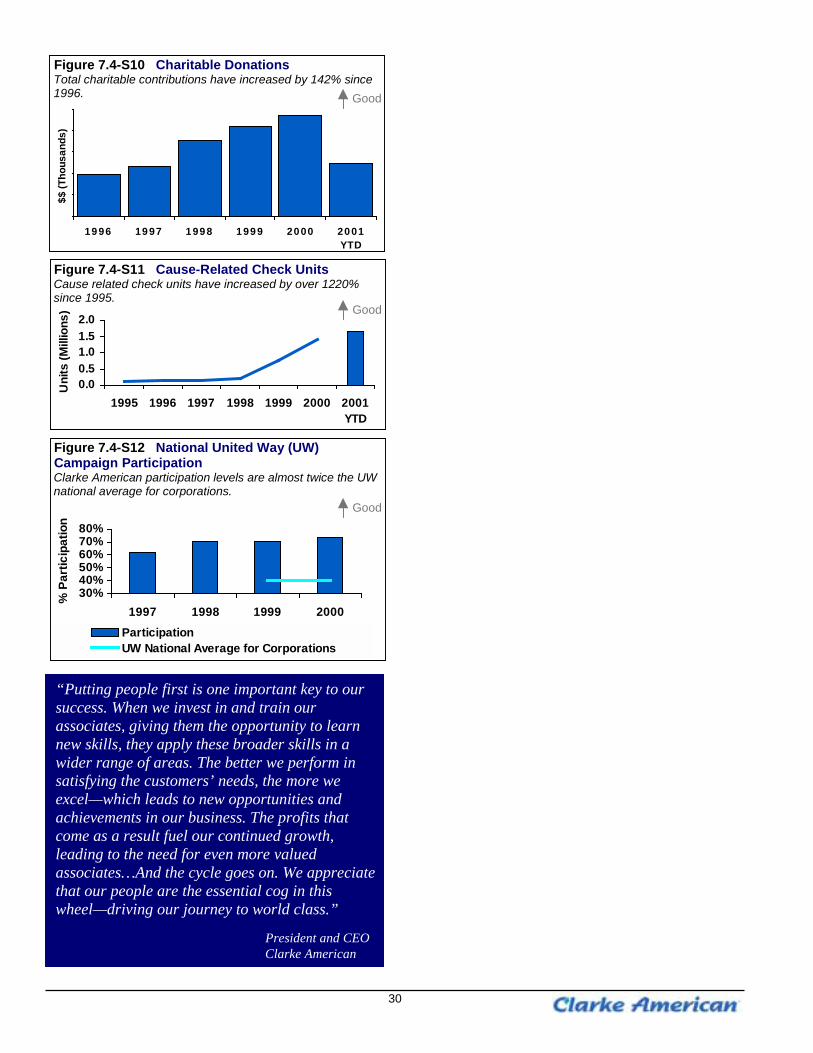
30
Figure 7.4-S10 Charitable DonationsTotal charitable contributions have increased by 142% since1996.
$ 0
$ 2 00
$ 4 00
$ 6 00
$ 8 00
$ 1 , 000
1996 1997 1998 1999 2000 2001YTD
$$ (T
hous
ands
)
Figure 7.4-S11 Cause-Related Check UnitsCause related check units have increased by over 1220%since 1995.
0.00.51.01.52.0
1995 1996 1997 1998 1999 2000 2001YTD
Uni
ts (M
illio
ns)
Figure 7.4-S12 National United Way (UW)Campaign ParticipationClarke American participation levels are almost twice the UWnational average for corporations.
30%40%50%60%70%80%
1997 1998 1999 2000
% P
artic
ipat
ion
ParticipationUW National Average for Corporations
Good
Good
Good
“Putting people first is one important key to oursuccess. When we invest in and train ourassociates, giving them the opportunity to learnnew skills, they apply these broader skills in awider range of areas. The better we perform insatisfying the customers’ needs, the more weexcel—which leads to new opportunities andachievements in our business. The profits thatcome as a result fuel our continued growth,leading to the need for even more valuedassociates…And the cycle goes on. We appreciatethat our people are the essential cog in thiswheel—driving our journey to world class.”
President and CEOClarke American