on the use of numerical weather models to predict neutral-atmosphere delays
DESCRIPTION
On the use of Numerical Weather Models to Predict Neutral-Atmosphere Delays. Felipe G. Nievinski. The curse of tropospheric delay in GPS positioning. One of main error sources in medium- to long-range kinematic applications. Estimation more challenging than in static app. - PowerPoint PPT PresentationTRANSCRIPT

1
On the use of Numerical Weather Models
to Predict Neutral-Atmosphere Delays
Felipe G. Nievinski

2
The curse of tropospheric delay in GPS positioning
• One of main error sources in medium- to long-range kinematic applications.
• Estimation more challenging than in static app. – Due to, e.g., time-varying height.
• A better a priori prediction would be valuable.– Whether estimating or only correcting for
tropospheric delay.

3
Numerical Weather Models: a better picture of today’s weather?
• Typical tropospheric delay prediction models:(i) Climatological models
(ii) Surface-measured pressure, temperature, humidity
• NWM aims at representing(i) The daily weather
(ii) The entire 3-dimensional
weather field.Northern half of 3D refractivity (unitless) field on
Aug 16, 2004, 22:45 UTC (vertical scale 100x)

4
Methods
• 1. How to predict delays with NWM
• 2. How to test if the delays are not wrong
• 3. How to assess whether the delays improve GPS applications

5
• Numerical integration:
• Coordinate conversion:
• Interpolation:
• Refractivity calculation:
C
dN )(10 6
1232
11
wd
d ZT
eK
T
eKZ
T
PKN
},,{}{ GHyx
qpTYYHH
HHYY iG
iGi
Gi
G
i ,ln,,1
1
1
0 1 2 3 4 5 6 7 8
x 104
0
50
100
150
200
250
300
350
Slant distance (m)
Refr
activity
Predicting delays with NWM

6
Tropospheric corrections: NWM–radiosonde discrepancy
30 40 50 60 70 80 90
-2
0
2
30 40 50 60 70 80 90
-2
0
2
30 40 50 60 70 80 90
-2
0
2
Latitude (degrees)
Total(cm)
Hydro-static(cm)
Non-hydro-static(cm)
mean (cm) rms (cm) std (cm)
Total Delay 1.05 1.29 0.75
Hydrostatic Delay 1.15 1.18 0.25
Non-Hydrostatic Delay -0.1 0.69 0.69
Easting (km)
Nor
thin
g (k
m)
-2000 -1000 0 1000 2000 3000 4000
-5000
-4000
-3000
-2000
-1000
0

7
GPS positioning
• Two scenarios for kinematic processing:– Moving rover: on board ferry boat
– Stationary rover: one of two base stations
• In each scenario, test and reference solutions:
Moving rover Stationary rover
Test
Solutions
Individual baselines from each base station
to ferry boat
Baselines from one fixed base station to another base
acting as rover
Reference Solution
Multi-base station to ferry boat
5 day-long static PPP at each base station

8
Impact assessment
• 3 tropospheric prediction models assessed:– NWM
– UNB3m
– Saastamoinen with standard weather parameters
– uncorrected observations (no model)
• Criteria:– Discrepancy in rover position between test and
reference solutions
– RMS of observation residuals

9
Stationary rover:test–reference discrepancy
Height (cm) Latitude (cm) Longitude (cm) mean rms std mean rms std mean rms std
no model -7.8 25.2 23.9 8.2 13.7 11 2.6 17.2 17.0 Saastamoinen -2.6 6.7 6.2 0.2 3.7 3.7 1.2 4.1 4.0
UNB3m -2.5 6.0 5.4 0.2 3.2 3.2 1.2 2.7 2.4 NWM -0.9 5.0 4.9 0.0 3.2 3.2 1.1 2.5 2.3
-15 -10 -5 0 5 10 15-15
-10
-5
0
5
10
15
Longitude (cm)
Latit
ude
(cm
)
0 6 12 18 24
-20
-10
0
10
20
Time of the day (hours, GPST)
Hei
ght
(cm
)
Saastamoinen
UNB3m
NWM

10
Moving rover: discarding unreliable epochs
Saint John
Digby0 6 12 18 24
0
20
40
60
80
0 6 12 18 240
20
40
60
80
Dis
tanc
e to
nea
rest
ba
se s
tatio
n (k
m)
0 6 12 18 240
20
40
60
80
Time of the day (hours, GPST)
St. John
Digby
Multi-base

11
Moving rover (1): test–reference discrepancy
-15 -10 -5 0 5 10 15-15
-10
-5
0
5
10
15
Longitude (cm)
Latit
ude
(cm
)
0 6 12 18 24-30
-20
-10
0
10
20
30
Time of the day (hours, GPST)
Hei
ght
(cm
)
Saastamoinen
UNB3m
NWM
Height (cm) Latitude (cm) Longitude (cm) mean rms std mean rms std mean rms std
no model 10.2 16.1 12.5 -8.1 10.2 6.2 -0.8 6.4 6.3 Saastamoinen 2.4 10.5 10.2 -1.6 5.2 4.9 -2.8 5.1 4.3
UNB3m 4.3 8.0 6.8 -1.9 4.8 4.4 -1.3 3.1 2.8 NWM 1.5 5.8 5.6 -0.9 3.3 3.2 -0.8 2.8 2.6

12
Moving rover (2): test–reference discrepancy
Height (cm) Latitude (cm) Longitude (cm) mean rms std mean rms std mean rms std
no model 10.0 21.5 19.1 4.9 11.7 10.6 -5.6 11 9.4 Saastamoinen -1.9 5.9 5.5 0.3 4.1 4.1 1.0 2.3 2.0
UNB3m -0.5 8.4 8.4 -0.8 4.6 4.5 -1.5 4.0 3.7 NWM 0.9 9.2 9.1 -0.6 4.3 4.2 -1.5 3.8 3.5
-15 -10 -5 0 5 10 15-15
-10
-5
0
5
10
15
Longitude (cm)
Latit
ude
(cm
)
0 6 12 18 24-30
-20
-10
0
10
20
30
Time of the day (hours, GPST)
Hei
ght
(cm
)
Saastamoinen
UNB3m
NWM

13
Conclusions and future work
• NWM has only marginal improvement on
that particular 70 km baseline.• Validation: vertical coordinates in NWM
• Study how it is handled in data assimilation• Test it with GPS-equipped radiosondes
• Impact assessment: varying-length baselines• Kinematic processing at stationary rover• From 100 to 1,000 km

14
Publications
• Paper at ION AM 2005 in Boston, MA
• Poster at AGU Joint Assembly in Washington, DC
• Paper at ION GNSS 2006 in Fort Worth, TX

15
Thanks!
Questions?
Felipe G. Nievinski
16
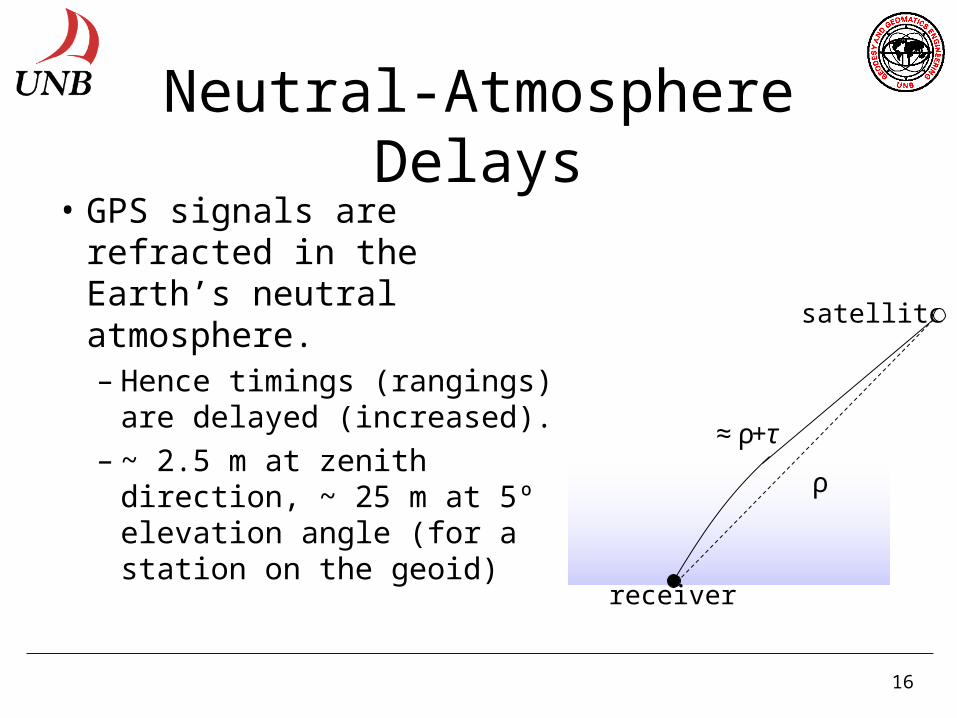
• GPS signals are refracted in the Earth’s neutral atmosphere.– Hence timings (rangings)
are delayed (increased).– ~ 2.5 m at zenith direction,
~ 25 m at 5º elevation angle (for a station on the geoid)
satellite
receiver
≈ ρ+τ
ρ
Neutral-Atmosphere Delays
17
30 40 50 60 70 80 90
-2
0
2
30 40 50 60 70 80 90
-2
0
2
30 40 50 60 70 80 90
-2
0
2
Latitude (degrees)
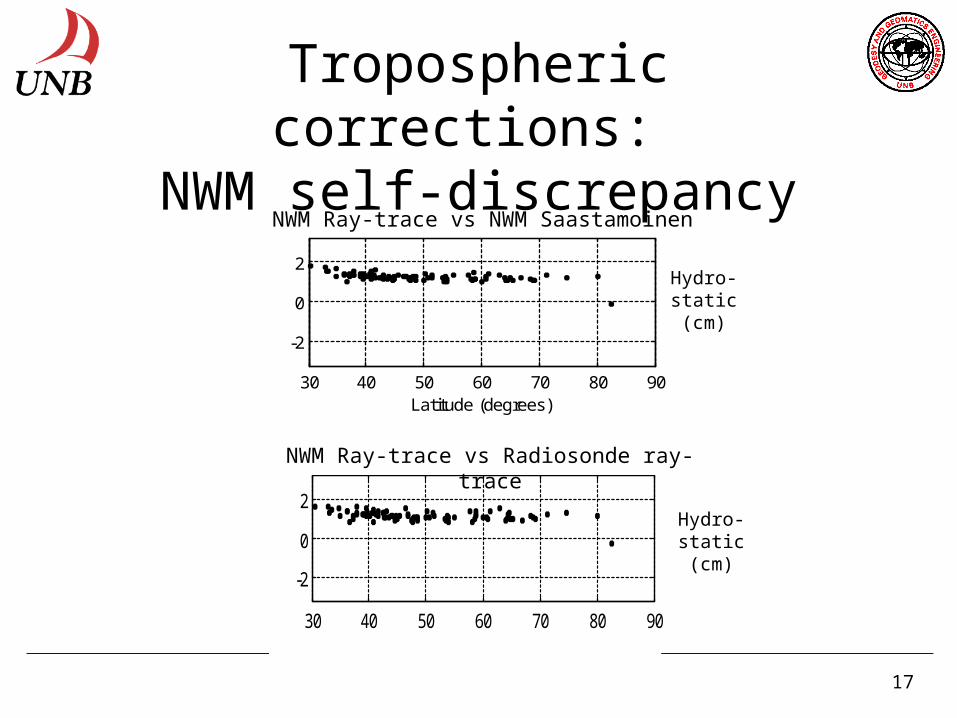
Tropospheric corrections: NWM self-discrepancy
30 40 50 60 70 80 90
-2
0
2
Latitude (degrees)
NWM Ray-trace vs Radiosonde ray-trace
NWM Ray-trace vs NWM Saastamoinen
Hydro-static(cm)
Hydro-static(cm)