factors influencing flight delays of a … · factors influencing flight delays of a european...
TRANSCRIPT
1799
ACTA UNIVERSITATIS AGRICULTURAE ET SILVICULTURAE MENDELIANAE BRUNENSIS
Volume 65 185 Number 5, 2017
https://doi.org/10.11118/actaun201765051799
FACTORS INFLUENCING FLIGHT DELAYS OF A EUROPEAN AIRLINE
Martina Zámková1, Martin Prokop1, Radek Stolín1
1 Department of Mathematics, College of Polytechnics Jihlava, Tolstého 16, 586 01 Jihlava, Czech Republic
Abstract
ZÁMKOVÁ MARTINA, PROKOP MARTIN, STOLÍN RADEK. 2017. Factors Influencing Flight Delays of a European Airline. Acta Universitatis Agriculturae et Silviculturae Mendelianae Brunensis, 65(5): 1799 – 1807.
The main aim of the paper was to investigate factors influencing flight delays of a European airline. Besides the identification and analysis of those factors the paper offers possible suggestions on how to eliminate the delays. The research is based on data acquired over the period of time spanning from June to September in 2008 – 2014. Analysis of contingency tables, including Pearson’s chi‑squared test, has been used for data processing. The dependencies have been presented in graphical form by using correspondence maps.The proportion of delayed flights reaches approx. 50 % during nearly the entire monitored period only in September the proportion drops to 45 %. Flight delays are most frequently caused by delays of previous flights of the same plane. These previous delayed flights are the main culprit of long delays and the frequency of delay occurrence caused by this reason increases significantly during the day. Longer delays of flights appear also due to technical maintenance or aircraft defects. On the contrary other factors such as operational control and crew duty norms, air traffic control and airport limitations tend to cause rather shorter delays of flights with the air traffic control encountering more problems with coordination of flights in the early morning. The supply and service companies also manage to eliminate long delays.
Keywords: flight delays, delay causes, European region, correspondence analysis, contingency tables, chi‑squared test, airline
INTRODUCTIONFor all airlines, flight delays represent the source
of financial and technical difficulties. This article aims both to identify and analyse the factors causing delays and to suggest some possibilities on how to eliminate these delays. We have chosen an airline operating in the European region and used its data from the period 2008 – 2014. The database includes information on departures from most major European airports. The so called IATA1 Airlines delay codes, see Tab. I, have been used for the primary classification of delays. The differentiation of flights goes as follows: regular (J), charter (C), and empty (P). The causes of delays obtained directly from the airline were confronted
with further factors derived from the data (the time of day, the months selected, the length of the delay, the type of flight and type of aircraft).
The article by Campanelli et al. (2014) provides an analysis of the chain effect of flight delays. The article is dealing with an air transport system behaving in nonlinear manner which is difficult to anticipate. Similarly, the paper by Rebollo, Balakrishnan (2014) introduces models for predicting air traffic delays. The work of Ionescu et al. (2016) suggests that flight plans often fail to respond to the possibility of delays associated with unforeseen events, late reporting following a technical malfunction, or congestion of airports or air space. The proposed models improve the chance to predict the potential delays. A similar analysis of factors causing flight delays at
1 The International Air Transport Association (IATA) is a trade association of the world’s airlines.
1800 Martina Zámková, Martin Prokop, Radek Stolín
the Czech international airports was performed in the article by Zámková, Prokop (2015b). The paper by Zámková, Prokop (2015a) focused on financial impacts of delayed flights on airlines. Zámková, Prokop (2016) later focused on factors influencing flight delays, but their analysis was limited to the airports located near Czech tourists’ favourite destinations only.
MATERIALS AND METHODSPrimary data were extrapolated from the database
of the airline in question for the aforementioned period. The categorical data cover information about each flight, including the date and time of departure, the type of flight, the aircraft type, the length of the delay and the reasons for the delay according to the IATA codes.
Contingency tables present an easy way of displaying relations among categorical data. Depending on the character of the data we then used applicable tests of independence. According to Řezanková (1997), for the case of a contingency Tab. of the r x c type (r is the number of rows, c is the number of columns) we most often use the test statistic:
χ2
2
=−( )∑∑
n e
eij ij
ijji,
where eij is the expected frequency and nij the observed frequency. We use the statistic χ² in Pearson’s chi‑square test with asymptotically χ2(r − 1)(c − 1) distribution. The null hypothesis of the test assumes independence. For further details see
Hindls (2003). The condition that maximum 20 % of the expected frequencies are less than five must be met in order to use the Pearson’s chi‑square test, see Hendl (2006) and Agresti (1990). We use Fisher’s exact test in other cases or we calculate the simulated p‑value of χ² statistic, see Anděl (2005).
Correspondence analysis that was used for this study is a multivariate statistical technique, which allows the display and summary of a set of data in two‑dimensional graphic form. It is traditionally applied to contingency tables – correspondence analysis decomposes the chi‑squared statistic associated with this Tab. into orthogonal factors. The distance between single points is defined as a chi‑squared distance. The distance between ith and i’th row is given by the formula
D i ir r
cij i j
jj
c
, ′′( ) =
−( )=∑
2
1,
where rij are the elements of row profiles matrix R and weights cj are corresponding to the elements of column loadings vector cT, which is equal to mean column profile (centroid) of column profiles in multidimensional space. The distance between columns j and j’ is defined similarly. The aim of this analysis is to reduce the multidimensional space of row and column profiles and to save maximally original data information, see Hebák et al. (2007). The total variance of the data matrix is measured by the inertia, see e.g. Greenacre (1984), which resembles a chi‑square statistic but is calculated based on relative observed and expected frequencies. Unistat and Statistica software was used for primary data processing.
I: Airlines delay codes
Codes Explanation
AIC Operational reasons of airline
PB Delay because of passengers and their baggage
ARH Delay caused during the aircraft handling by suppliers – handling, fuel, catering
TAE Delay caused by technical maintenance or aircraft defect
FOC Delay caused by operational control and crew duty norms
ATFMR Delay caused by air traffic control
AGA Delay caused by airport limitation
R Reaction codes – Delay caused by delay of previous flight
MISC Specific delay, can’t be included to categories
Source: Eurocontrol (2016)
II: Relative frequencies: Numbers of delayed flights by the months considered
Delayed Total Proportion
June 13073 25495 0.51 %
July 15688 29921 0.52 %
August 14814 30114 0.49 %
September 11503 25699 0.45 %
Source: own calculation
Factors Influencing Flight Delays of a European Airline 1801
RESULTSIt is obvious (see Tab. II) that over the entire
monitored period (2008 – 2014) the proportion of delayed flights makes about 50 % in the summer months, only in September it drops to 45 %.
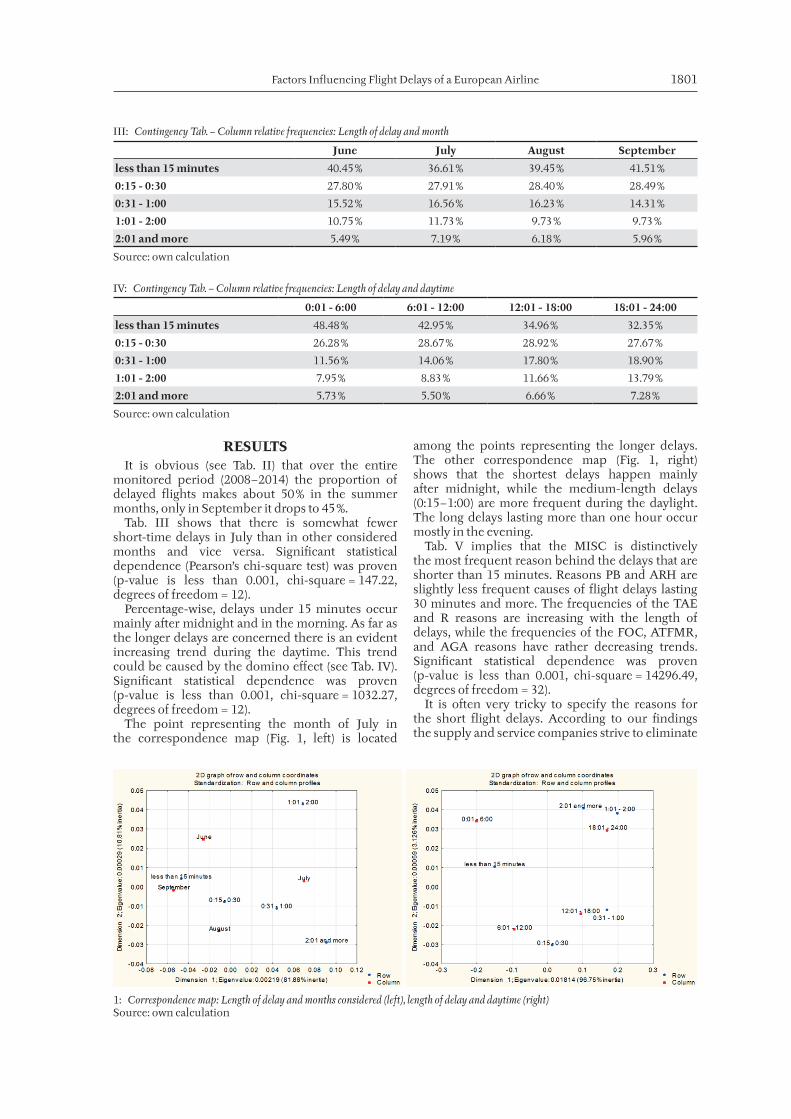
Tab. III shows that there is somewhat fewer short‑time delays in July than in other considered months and vice versa. Significant statistical dependence (Pearson’s chi‑square test) was proven (p‑value is less than 0.001, chi‑square = 147.22, degrees of freedom = 12).
Percentage‑wise, delays under 15 minutes occur mainly after midnight and in the morning. As far as the longer delays are concerned there is an evident increasing trend during the daytime. This trend could be caused by the domino effect (see Tab. IV). Significant statistical dependence was proven (p‑value is less than 0.001, chi‑square = 1032.27, degrees of freedom = 12).
The point representing the month of July in the correspondence map (Fig. 1, left) is located
among the points representing the longer delays. The other correspondence map (Fig. 1, right) shows that the shortest delays happen mainly after midnight, while the medium‑length delays (0:15 – 1:00) are more frequent during the daylight. The long delays lasting more than one hour occur mostly in the evening.
Tab. V implies that the MISC is distinctively the most frequent reason behind the delays that are shorter than 15 minutes. Reasons PB and ARH are slightly less frequent causes of flight delays lasting 30 minutes and more. The frequencies of the TAE and R reasons are increasing with the length of delays, while the frequencies of the FOC, ATFMR, and AGA reasons have rather decreasing trends. Significant statistical dependence was proven (p‑value is less than 0.001, chi‑square = 14296.49, degrees of freedom = 32).
It is often very tricky to specify the reasons for the short flight delays. According to our findings the supply and service companies strive to eliminate
III: Contingency Tab. – Column relative frequencies: Length of delay and month
June July August September
less than 15 minutes 40.45 % 36.61 % 39.45 % 41.51 %
0:15 - 0:30 27.80 % 27.91 % 28.40 % 28.49 %
0:31 - 1:00 15.52 % 16.56 % 16.23 % 14.31 %
1:01 - 2:00 10.75 % 11.73 % 9.73 % 9.73 %
2:01 and more 5.49 % 7.19 % 6.18 % 5.96 %
Source: own calculation
IV: Contingency Tab. – Column relative frequencies: Length of delay and daytime
0:01 - 6:00 6:01 - 12:00 12:01 - 18:00 18:01 - 24:00
less than 15 minutes 48.48 % 42.95 % 34.96 % 32.35 %
0:15 - 0:30 26.28 % 28.67 % 28.92 % 27.67 %
0:31 - 1:00 11.56 % 14.06 % 17.80 % 18.90 %
1:01 - 2:00 7.95 % 8.83 % 11.66 % 13.79 %
2:01 and more 5.73 % 5.50 % 6.66 % 7.28 %
Source: own calculation
1 1: Correspondence map: Length of delay and months considered (left), length of delay and daytime (right)Source: own calculation
1802 Martina Zámková, Martin Prokop, Radek Stolín
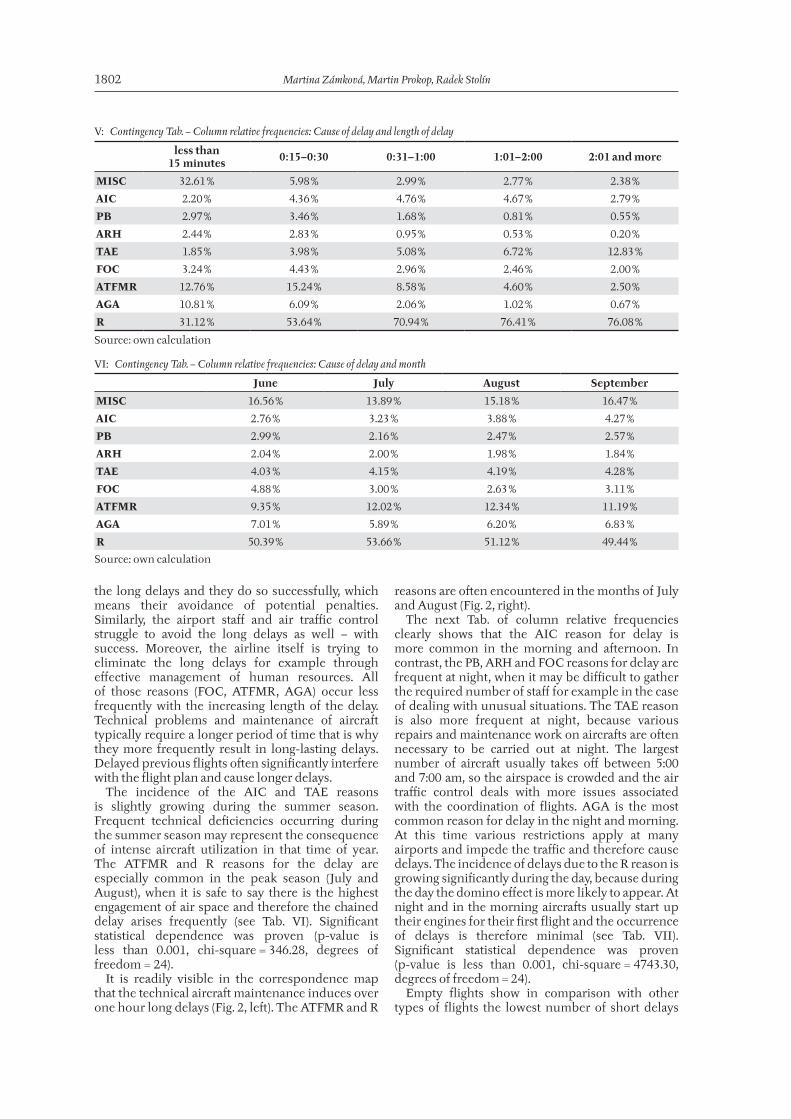
the long delays and they do so successfully, which means their avoidance of potential penalties. Similarly, the airport staff and air traffic control struggle to avoid the long delays as well – with success. Moreover, the airline itself is trying to eliminate the long delays for example through effective management of human resources. All of those reasons (FOC, ATFMR, AGA) occur less frequently with the increasing length of the delay. Technical problems and maintenance of aircraft typically require a longer period of time that is why they more frequently result in long‑lasting delays. Delayed previous flights often significantly interfere with the flight plan and cause longer delays.
The incidence of the AIC and TAE reasons is slightly growing during the summer season. Frequent technical deficiencies occurring during the summer season may represent the consequence of intense aircraft utilization in that time of year. The ATFMR and R reasons for the delay are especially common in the peak season (July and August), when it is safe to say there is the highest engagement of air space and therefore the chained delay arises frequently (see Tab. VI). Significant statistical dependence was proven (p‑value is less than 0.001, chi‑square = 346.28, degrees of freedom = 24).
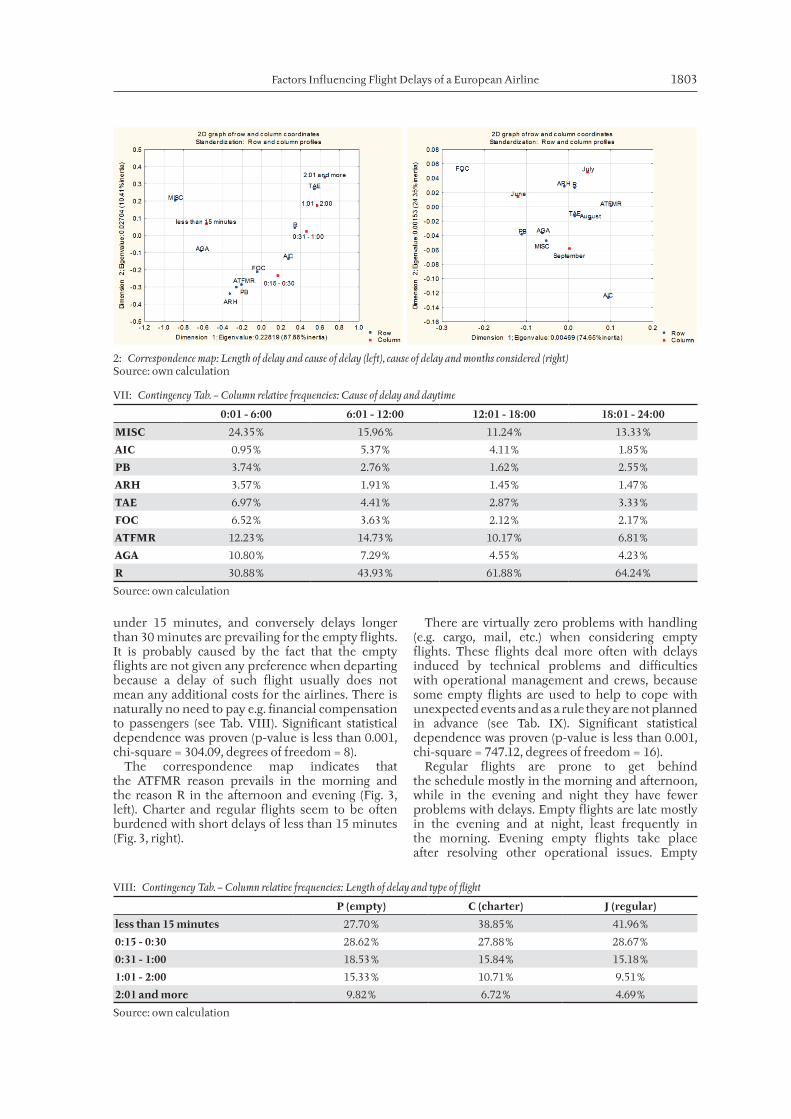
It is readily visible in the correspondence map that the technical aircraft maintenance induces over one hour long delays (Fig. 2, left). The ATFMR and R
reasons are often encountered in the months of July and August (Fig. 2, right).
The next Tab. of column relative frequencies clearly shows that the AIC reason for delay is more common in the morning and afternoon. In contrast, the PB, ARH and FOC reasons for delay are frequent at night, when it may be difficult to gather the required number of staff for example in the case of dealing with unusual situations. The TAE reason is also more frequent at night, because various repairs and maintenance work on aircrafts are often necessary to be carried out at night. The largest number of aircraft usually takes off between 5:00 and 7:00 am, so the airspace is crowded and the air traffic control deals with more issues associated with the coordination of flights. AGA is the most common reason for delay in the night and morning. At this time various restrictions apply at many airports and impede the traffic and therefore cause delays. The incidence of delays due to the R reason is growing significantly during the day, because during the day the domino effect is more likely to appear. At night and in the morning aircrafts usually start up their engines for their first flight and the occurrence of delays is therefore minimal (see Tab. VII). Significant statistical dependence was proven (p‑value is less than 0.001, chi‑square = 4743.30, degrees of freedom = 24).
Empty flights show in comparison with other types of flights the lowest number of short delays
V: Contingency Tab. – Column relative frequencies: Cause of delay and length of delay
less than 15 minutes 0:15–0:30 0:31–1:00 1:01–2:00 2:01 and more
MISC 32.61 % 5.98 % 2.99 % 2.77 % 2.38 %
AIC 2.20 % 4.36 % 4.76 % 4.67 % 2.79 %
PB 2.97 % 3.46 % 1.68 % 0.81 % 0.55 %
ARH 2.44 % 2.83 % 0.95 % 0.53 % 0.20 %
TAE 1.85 % 3.98 % 5.08 % 6.72 % 12.83 %
FOC 3.24 % 4.43 % 2.96 % 2.46 % 2.00 %
ATFMR 12.76 % 15.24 % 8.58 % 4.60 % 2.50 %
AGA 10.81 % 6.09 % 2.06 % 1.02 % 0.67 %
R 31.12 % 53.64 % 70.94 % 76.41 % 76.08 %
Source: own calculation
VI: Contingency Tab. – Column relative frequencies: Cause of delay and month
June July August September
MISC 16.56 % 13.89 % 15.18 % 16.47 %
AIC 2.76 % 3.23 % 3.88 % 4.27 %
PB 2.99 % 2.16 % 2.47 % 2.57 %
ARH 2.04 % 2.00 % 1.98 % 1.84 %
TAE 4.03 % 4.15 % 4.19 % 4.28 %
FOC 4.88 % 3.00 % 2.63 % 3.11 %
ATFMR 9.35 % 12.02 % 12.34 % 11.19 %
AGA 7.01 % 5.89 % 6.20 % 6.83 %
R 50.39 % 53.66 % 51.12 % 49.44 %
Source: own calculation
Factors Influencing Flight Delays of a European Airline 1803
under 15 minutes, and conversely delays longer than 30 minutes are prevailing for the empty flights. It is probably caused by the fact that the empty flights are not given any preference when departing because a delay of such flight usually does not mean any additional costs for the airlines. There is naturally no need to pay e.g. financial compensation to passengers (see Tab. VIII). Significant statistical dependence was proven (p‑value is less than 0.001, chi‑square = 304.09, degrees of freedom = 8).
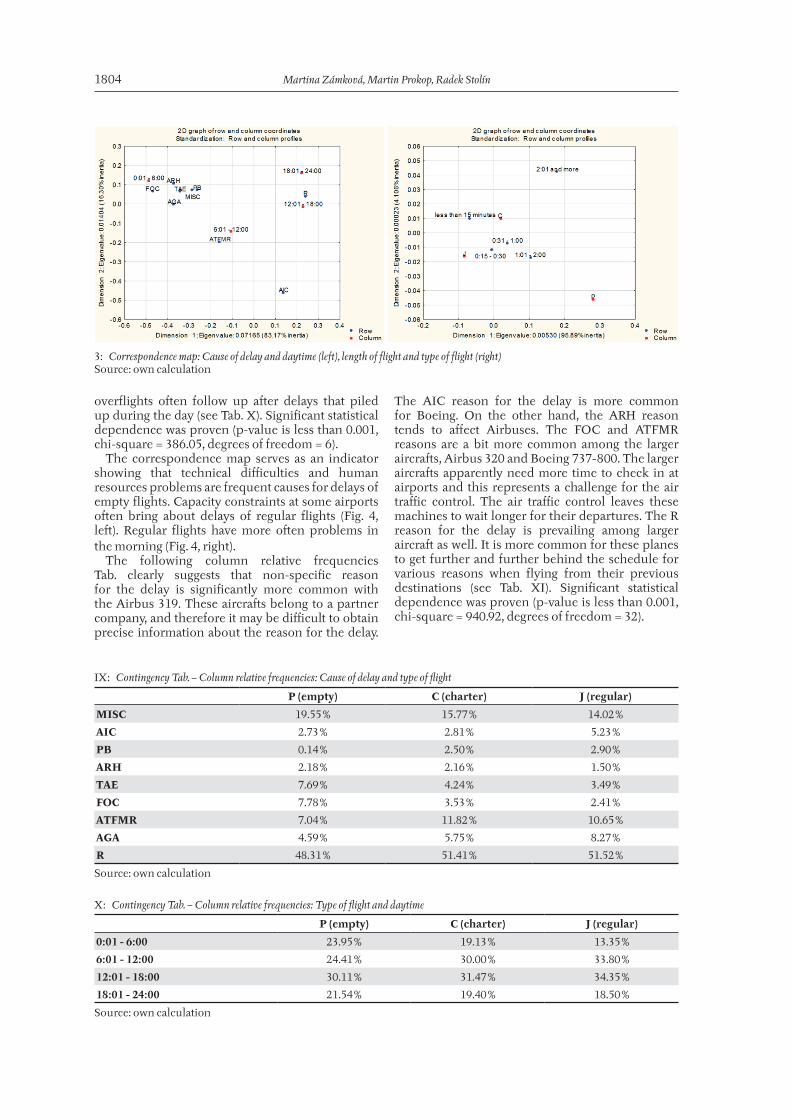
The correspondence map indicates that the ATFMR reason prevails in the morning and the reason R in the afternoon and evening (Fig. 3, left). Charter and regular flights seem to be often burdened with short delays of less than 15 minutes (Fig. 3, right).
There are virtually zero problems with handling (e.g. cargo, mail, etc.) when considering empty flights. These flights deal more often with delays induced by technical problems and difficulties with operational management and crews, because some empty flights are used to help to cope with unexpected events and as a rule they are not planned in advance (see Tab. IX). Significant statistical dependence was proven (p‑value is less than 0.001, chi‑square = 747.12, degrees of freedom = 16).
Regular flights are prone to get behind the schedule mostly in the morning and afternoon, while in the evening and night they have fewer problems with delays. Empty flights are late mostly in the evening and at night, least frequently in the morning. Evening empty flights take place after resolving other operational issues. Empty
1 2: Correspondence map: Length of delay and cause of delay (left), cause of delay and months considered (right)Source: own calculation
VII: Contingency Tab. – Column relative frequencies: Cause of delay and daytime
0:01 - 6:00 6:01 - 12:00 12:01 - 18:00 18:01 - 24:00
MISC 24.35 % 15.96 % 11.24 % 13.33 %
AIC 0.95 % 5.37 % 4.11 % 1.85 %
PB 3.74 % 2.76 % 1.62 % 2.55 %
ARH 3.57 % 1.91 % 1.45 % 1.47 %
TAE 6.97 % 4.41 % 2.87 % 3.33 %
FOC 6.52 % 3.63 % 2.12 % 2.17 %
ATFMR 12.23 % 14.73 % 10.17 % 6.81 %
AGA 10.80 % 7.29 % 4.55 % 4.23 %
R 30.88 % 43.93 % 61.88 % 64.24 %
Source: own calculation
VIII: Contingency Tab. – Column relative frequencies: Length of delay and type of flight
P (empty) C (charter) J (regular)
less than 15 minutes 27.70 % 38.85 % 41.96 %
0:15 - 0:30 28.62 % 27.88 % 28.67 %
0:31 - 1:00 18.53 % 15.84 % 15.18 %
1:01 - 2:00 15.33 % 10.71 % 9.51 %
2:01 and more 9.82 % 6.72 % 4.69 %
Source: own calculation
1804 Martina Zámková, Martin Prokop, Radek Stolín
overflights often follow up after delays that piled up during the day (see Tab. X). Significant statistical dependence was proven (p‑value is less than 0.001, chi‑square = 386.05, degrees of freedom = 6).
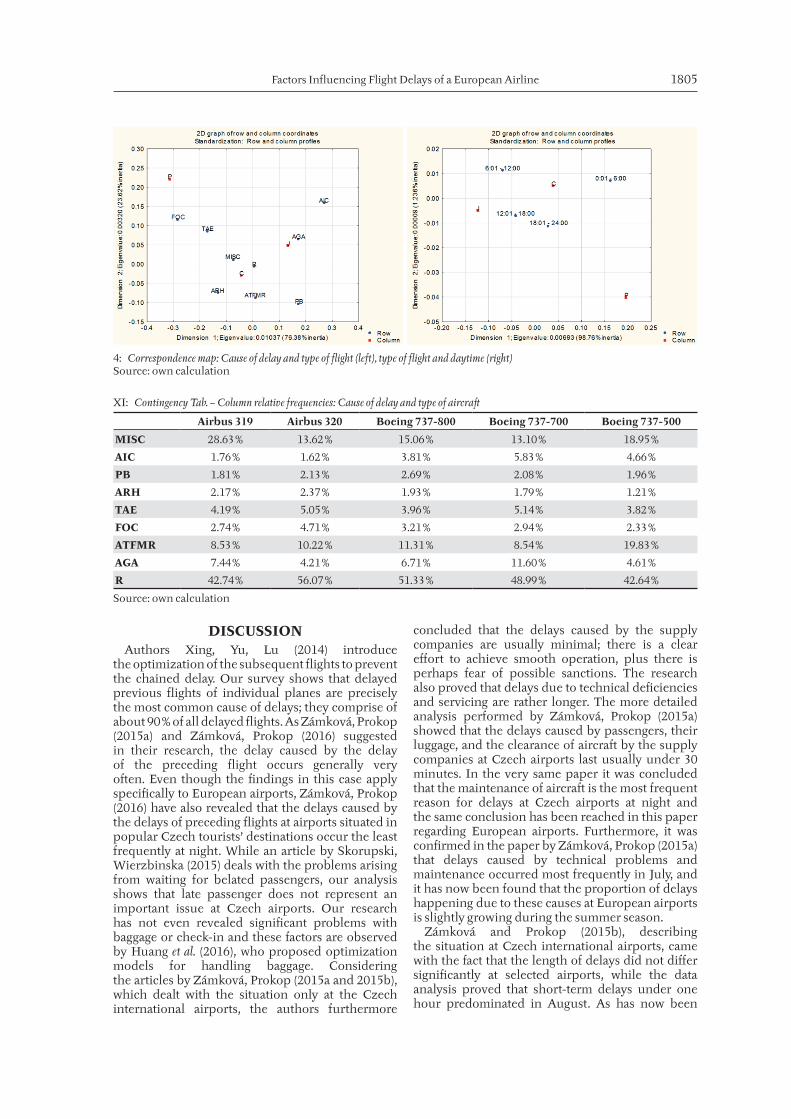
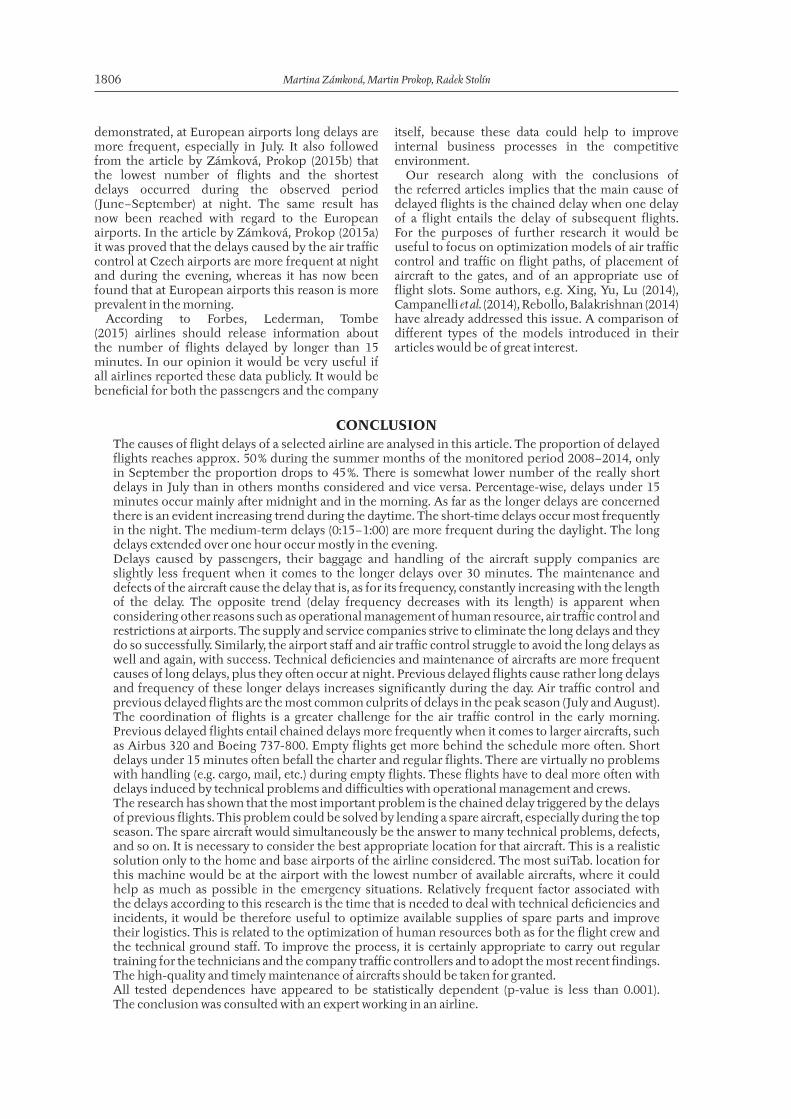
The correspondence map serves as an indicator showing that technical difficulties and human resources problems are frequent causes for delays of empty flights. Capacity constraints at some airports often bring about delays of regular flights (Fig. 4, left). Regular flights have more often problems in the morning (Fig. 4, right).
The following column relative frequencies Tab. clearly suggests that non‑specific reason for the delay is significantly more common with the Airbus 319. These aircrafts belong to a partner company, and therefore it may be difficult to obtain precise information about the reason for the delay.
The AIC reason for the delay is more common for Boeing. On the other hand, the ARH reason tends to affect Airbuses. The FOC and ATFMR reasons are a bit more common among the larger aircrafts, Airbus 320 and Boeing 737‑800. The larger aircrafts apparently need more time to check in at airports and this represents a challenge for the air traffic control. The air traffic control leaves these machines to wait longer for their departures. The R reason for the delay is prevailing among larger aircraft as well. It is more common for these planes to get further and further behind the schedule for various reasons when flying from their previous destinations (see Tab. XI). Significant statistical dependence was proven (p‑value is less than 0.001, chi‑square = 940.92, degrees of freedom = 32).
1 3: Correspondence map: Cause of delay and daytime (left), length of flight and type of flight (right)Source: own calculation
IX: Contingency Tab. – Column relative frequencies: Cause of delay and type of flight
P (empty) C (charter) J (regular)
MISC 19.55 % 15.77 % 14.02 %
AIC 2.73 % 2.81 % 5.23 %
PB 0.14 % 2.50 % 2.90 %
ARH 2.18 % 2.16 % 1.50 %
TAE 7.69 % 4.24 % 3.49 %
FOC 7.78 % 3.53 % 2.41 %
ATFMR 7.04 % 11.82 % 10.65 %
AGA 4.59 % 5.75 % 8.27 %
R 48.31 % 51.41 % 51.52 %
Source: own calculation
X: Contingency Tab. – Column relative frequencies: Type of flight and daytime
P (empty) C (charter) J (regular)
0:01 - 6:00 23.95 % 19.13 % 13.35 %
6:01 - 12:00 24.41 % 30.00 % 33.80 %
12:01 - 18:00 30.11 % 31.47 % 34.35 %
18:01 - 24:00 21.54 % 19.40 % 18.50 %
Source: own calculation
Factors Influencing Flight Delays of a European Airline 1805
DISCUSSIONAuthors Xing, Yu, Lu (2014) introduce
the optimization of the subsequent flights to prevent the chained delay. Our survey shows that delayed previous flights of individual planes are precisely the most common cause of delays; they comprise of about 90 % of all delayed flights. As Zámková, Prokop (2015a) and Zámková, Prokop (2016) suggested in their research, the delay caused by the delay of the preceding flight occurs generally very often. Even though the findings in this case apply specifically to European airports, Zámková, Prokop (2016) have also revealed that the delays caused by the delays of preceding flights at airports situated in popular Czech tourists’ destinations occur the least frequently at night. While an article by Skorupski, Wierzbinska (2015) deals with the problems arising from waiting for belated passengers, our analysis shows that late passenger does not represent an important issue at Czech airports. Our research has not even revealed significant problems with baggage or check‑in and these factors are observed by Huang et al. (2016), who proposed optimization models for handling baggage. Considering the articles by Zámková, Prokop (2015a and 2015b), which dealt with the situation only at the Czech international airports, the authors furthermore
concluded that the delays caused by the supply companies are usually minimal; there is a clear effort to achieve smooth operation, plus there is perhaps fear of possible sanctions. The research also proved that delays due to technical deficiencies and servicing are rather longer. The more detailed analysis performed by Zámková, Prokop (2015a) showed that the delays caused by passengers, their luggage, and the clearance of aircraft by the supply companies at Czech airports last usually under 30 minutes. In the very same paper it was concluded that the maintenance of aircraft is the most frequent reason for delays at Czech airports at night and the same conclusion has been reached in this paper regarding European airports. Furthermore, it was confirmed in the paper by Zámková, Prokop (2015a) that delays caused by technical problems and maintenance occurred most frequently in July, and it has now been found that the proportion of delays happening due to these causes at European airports is slightly growing during the summer season.
Zámková and Prokop (2015b), describing the situation at Czech international airports, came with the fact that the length of delays did not differ significantly at selected airports, while the data analysis proved that short‑term delays under one hour predominated in August. As has now been
1 4: Correspondence map: Cause of delay and type of flight (left), type of flight and daytime (right)Source: own calculation
XI: Contingency Tab. – Column relative frequencies: Cause of delay and type of aircraft
Airbus 319 Airbus 320 Boeing 737-800 Boeing 737-700 Boeing 737-500
MISC 28.63 % 13.62 % 15.06 % 13.10 % 18.95 %
AIC 1.76 % 1.62 % 3.81 % 5.83 % 4.66 %
PB 1.81 % 2.13 % 2.69 % 2.08 % 1.96 %
ARH 2.17 % 2.37 % 1.93 % 1.79 % 1.21 %
TAE 4.19 % 5.05 % 3.96 % 5.14 % 3.82 %
FOC 2.74 % 4.71 % 3.21 % 2.94 % 2.33 %
ATFMR 8.53 % 10.22 % 11.31 % 8.54 % 19.83 %
AGA 7.44 % 4.21 % 6.71 % 11.60 % 4.61 %
R 42.74 % 56.07 % 51.33 % 48.99 % 42.64 %
Source: own calculation
1806 Martina Zámková, Martin Prokop, Radek Stolín
demonstrated, at European airports long delays are more frequent, especially in July. It also followed from the article by Zámková, Prokop (2015b) that the lowest number of flights and the shortest delays occurred during the observed period (June – September) at night. The same result has now been reached with regard to the European airports. In the article by Zámková, Prokop (2015a) it was proved that the delays caused by the air traffic control at Czech airports are more frequent at night and during the evening, whereas it has now been found that at European airports this reason is more prevalent in the morning.
According to Forbes, Lederman, Tombe (2015) airlines should release information about the number of flights delayed by longer than 15 minutes. In our opinion it would be very useful if all airlines reported these data publicly. It would be beneficial for both the passengers and the company
itself, because these data could help to improve internal business processes in the competitive environment.
Our research along with the conclusions of the referred articles implies that the main cause of delayed flights is the chained delay when one delay of a flight entails the delay of subsequent flights. For the purposes of further research it would be useful to focus on optimization models of air traffic control and traffic on flight paths, of placement of aircraft to the gates, and of an appropriate use of flight slots. Some authors, e.g. Xing, Yu, Lu (2014), Campanelli et al. (2014), Rebollo, Balakrishnan (2014) have already addressed this issue. A comparison of different types of the models introduced in their articles would be of great interest.
CONCLUSIONThe causes of flight delays of a selected airline are analysed in this article. The proportion of delayed flights reaches approx. 50 % during the summer months of the monitored period 2008 – 2014, only in September the proportion drops to 45 %. There is somewhat lower number of the really short delays in July than in others months considered and vice versa. Percentage‑wise, delays under 15 minutes occur mainly after midnight and in the morning. As far as the longer delays are concerned there is an evident increasing trend during the daytime. The short‑time delays occur most frequently in the night. The medium‑term delays (0:15 – 1:00) are more frequent during the daylight. The long delays extended over one hour occur mostly in the evening.Delays caused by passengers, their baggage and handling of the aircraft supply companies are slightly less frequent when it comes to the longer delays over 30 minutes. The maintenance and defects of the aircraft cause the delay that is, as for its frequency, constantly increasing with the length of the delay. The opposite trend (delay frequency decreases with its length) is apparent when considering other reasons such as operational management of human resource, air traffic control and restrictions at airports. The supply and service companies strive to eliminate the long delays and they do so successfully. Similarly, the airport staff and air traffic control struggle to avoid the long delays as well and again, with success. Technical deficiencies and maintenance of aircrafts are more frequent causes of long delays, plus they often occur at night. Previous delayed flights cause rather long delays and frequency of these longer delays increases significantly during the day. Air traffic control and previous delayed flights are the most common culprits of delays in the peak season (July and August). The coordination of flights is a greater challenge for the air traffic control in the early morning. Previous delayed flights entail chained delays more frequently when it comes to larger aircrafts, such as Airbus 320 and Boeing 737‑800. Empty flights get more behind the schedule more often. Short delays under 15 minutes often befall the charter and regular flights. There are virtually no problems with handling (e.g. cargo, mail, etc.) during empty flights. These flights have to deal more often with delays induced by technical problems and difficulties with operational management and crews.The research has shown that the most important problem is the chained delay triggered by the delays of previous flights. This problem could be solved by lending a spare aircraft, especially during the top season. The spare aircraft would simultaneously be the answer to many technical problems, defects, and so on. It is necessary to consider the best appropriate location for that aircraft. This is a realistic solution only to the home and base airports of the airline considered. The most suiTab. location for this machine would be at the airport with the lowest number of available aircrafts, where it could help as much as possible in the emergency situations. Relatively frequent factor associated with the delays according to this research is the time that is needed to deal with technical deficiencies and incidents, it would be therefore useful to optimize available supplies of spare parts and improve their logistics. This is related to the optimization of human resources both as for the flight crew and the technical ground staff. To improve the process, it is certainly appropriate to carry out regular training for the technicians and the company traffic controllers and to adopt the most recent findings. The high‑quality and timely maintenance of aircrafts should be taken for granted.All tested dependences have appeared to be statistically dependent (p‑value is less than 0.001). The conclusion was consulted with an expert working in an airline.
Factors Influencing Flight Delays of a European Airline 1807
REFERENCESAGRESTI, A. 1990. Categorical Data Analysis. New York: John Wiley a Sons.ANDĚL, J. 2005. Mathematical statistics [in Czech: Základy matematické statistiky]. Praha: Matfyzpress.CAMPANELLI, B., FLEURQUIN, P., EGUÍLUZ, V. M. et al. 2014. Modeling reactionary delays in the
European air transport network. In Proceedings of the 4th SESAR Innovation Days. 25 – 27 November, Madrid, Spain: Eurocontrol, pp. 1 – 6.
EUROCONTROL. ©2016. Central Office for Delay Analysis. [Online]. Available at: http://www.eurocontrol.int/articles/central‑office‑delay‑analysis‑coda [Accessed: 2016, December 12].
FORBES, S. J., LEDERMAN, M. and TOMBE, T. 2015. Quality Disclosure Programs and Internal Organizational Practices: Evidence from Airline Flight Delays. American economic journal – microeconomics, 7(2): 1 – 26.
GREENACRE, M. J. 1984. Theory and Applications of Correspondence Analysis. London: Academic Press.HEBÁK, P. et al. 2007. Multivariate statistical methods 3 [in Czech: Vícerozměrné statistické metody 3].
Praha: Informatorium.HENDL, J. 2006. Summary of statistical methods: analysis and meta‑data [in Czech: Přehled statistických metod: analýza
a metaanalýza dat]. Praha: Portal.HINDLS, R. 2003. Statistics for Economists [in Czech: Statistika pro ekonomy]. 3rd compl. edition.
Praha: Professional Publishing.HUANG, E., MITAL, P. and GOETSCHALCKX, M. et al. 2016. Optimal assignment of airport baggage
unloading zones to outgoing flights. Transportation Research Part E: Logistics and Transportation Review, 94(C): 110 – 122.
IONESCU, L., GWIGGNER, C. and KLIEWER, N. 2016. Data Analysis of Delays in Airline Networks. Bussiness & Information Systems Engineering, 58(2): 119 – 133.
REBOLLO, J. J. and BALAKRISHNAN, H. 2014. Characterization and prediction of air traffic delays. Transportation Research Part C: Emerging Technologies, 44: 231 – 241.
ŘEZANKOVÁ, H. 1997. Categorical data analysis using SPSS [in Czech: Analýza kategoriálních dat pomocí SPSS]. Praha: VŠE.
SKORUPSKI, J. and WIERZBINSKA, M. 2015. A method to evaluate the time of waiting for a late passenger. Journal of air transport management, 47: 79 – 89.
XING, Z., YU, J. and LU, H. 2014. Optimal Control of Flight Delays Allocation at Airport. In: Proceedings of the International Conference on Advances in Materials Science and Information Technologies in Industry. Xian, 11 – 12 January. China: Trans Tech Publications, pp. 513 – 517.
ZÁMKOVÁ, M. and PROKOP, M. 2015a. Causes and financial consequences of flight delays in Czech Republic. [in Czech: Příčiny a finanční důsledky zpoždění letů v České republice]. Acta academica karviniensia, 2015(3): 110 – 120.
ZÁMKOVÁ, M. and PROKOP, M. 2015b. The Evaluation of Factors Influencing Flights Delay at Czech International Airports. Acta Universitatis Agriculturae et Silviculturae Mendelianae Brunensis, 63(6): 2187 – 2196.
ZÁMKOVÁ, M. and PROKOP, M. 2016. The evaluation of factors influencing flight delay at popular destinations of Czech tourists. In: Proceedings of the 34th International Conference Mathematical Methods in Economics. Liberec 6 – 9 September. Czech Republic: Technical University of Liberec, pp. 910 – 915.
Contact information
RNDr. Ing. Martina Zámková, Ph.D.: [email protected]. Martin Prokop: [email protected]. Radek Stolín, Ph.D.: [email protected]