on-line fault diagnostic system for proton exchange...
TRANSCRIPT

A
iveem©
K
1
ilRi
iMcsTnr
ptw
0d
Available online at www.sciencedirect.com
Journal of Power Sources 175 (2008) 419–429
On-line fault diagnostic system for proton exchangemembrane fuel cells
Luis Alberto M. Riascos a,∗, Marcelo G. Simoes b, Paulo E. Miyagi c
a Federal University of ABC, r. Santa Adelia 166, CEP 09210-170, Santo Andre, Sao Paulo, Brazilb Colorado School of Mines, 1500 Illinois St, 80401 Golden, CO, USA
c Escola Politecnica, University of Sao Paulo, Av. Prof. Mello Moraes 2231, CEP 05508-900, Sao Paulo, Brazil
Received 3 July 2007; received in revised form 2 September 2007; accepted 3 September 2007Available online 14 September 2007
bstract
In this paper, a supervisor system, able to diagnose different types of faults during the operation of a proton exchange membrane fuel cells introduced. The diagnosis is developed by applying Bayesian networks, which qualify and quantify the cause–effect relationship among theariables of the process. The fault diagnosis is based on the on-line monitoring of variables easy to measure in the machine such as voltage,
lectric current, and temperature. The equipment is a fuel cell system which can operate even when a fault occurs. The fault effects are based onxperiments on the fault tolerant fuel cell, which are reproduced in a fuel cell model. A database of fault records is constructed from the fuel cellodel, improving the generation time and avoiding permanent damage to the equipment.2007 Elsevier B.V. All rights reserved.teesta
(tceo
eee
eywords: Bayesian network; Fault diagnosis; Fuel cell
. Introduction
Major efforts to reduce greenhouse gas emissions havencreased the demand for pollution-free energy sources, in theast few years. Governmental and private-sector investments in&D, to support a program for clean energy generation includ-
ng hydrogen-based, are under way.Fuel cells are electrochemical devices that generate electric-
ty, similar to batteries but which can be continuously fueled.ost recent developments in proton exchange membrane fuel
ell (PEMFC) technology have made it the most promising fortationary and mobile applications in the range of up to 200 kW.hey are characterized by high efficiency, high power density,o aggression to the environment, no moving parts, and superioreliability and durability.
Under certain pressure, hydrogen (H2) is supplied into a
orous conductive electrode (the anode). The H2 spreads throughhe electrode until it reaches the catalytic layer of the anode,here it reacts, separating protons and electrons. The H+ pro-∗ Corresponding author. Tel.: +55 11 49963166; fax: +55 11 30915471.E-mail address: [email protected] (L.A.M. Riascos).
afpaaMo
378-7753/$ – see front matter © 2007 Elsevier B.V. All rights reserved.oi:10.1016/j.jpowsour.2007.09.010
ons flow through the electrolyte (a solid membrane), and thelectrons pass through an external electrical circuit, producinglectrical energy. On the other side of the cell, the oxygen (O2)preads through the cathode and reaches its catalytic layer; onhis layer, the O2, H+ protons, and electrons produce liquid waternd residual heat as sub-products [1].
Several papers have been published considering the fuel cellFC) operation in normal conditions; but few of them addressedhe FC operation under fault conditions. Faults are events thatannot be ignored in any real machine, and their consideration isssential for improving the operability, flexibility, and autonomyf automatic equipment.
In this paper, a fault diagnostic supervisor was designed toxecute on-line diagnosis, which indicates the cause of an incipi-nt fault. The supervisor uses a Bayesian network arrangement tostablish the cause–effect relationship, and to calculate the prob-bility of the most likely fault cause. An early alert of an incipientault allows making decisions to avoid degradation of other com-onents and catastrophic faults in the equipment. A FC model
ble to reproduce the effects of faults on a fuel cell is gener-ted. The supervisor and the FC model were integrated using theatLab/SimuLink® environment to confirm the characteristicsf this interaction.
4 f Power Sources 175 (2008) 419–429
iSotios
2
ycoaaatrobmLvts
sidm
atst
t(r
20 L.A.M. Riascos et al. / Journal o
This paper is organized as follows. In Section 2, the mon-toring of the fault tolerant fuel cell (FTFC) is presented. Inection 3, the FC model is introduced. In Section 4, four typesf faults in PEMFC are considered: faults in the air fan, faults inhe refrigeration system, growth of the fuel crossover, and faultsn hydrogen pressure. Section 5 presents a short backgroundf Bayesian networks. Section 6 introduces the fault diagnosticupervisor for PEMFC.
. The fault tolerant fuel cell (FTFC)
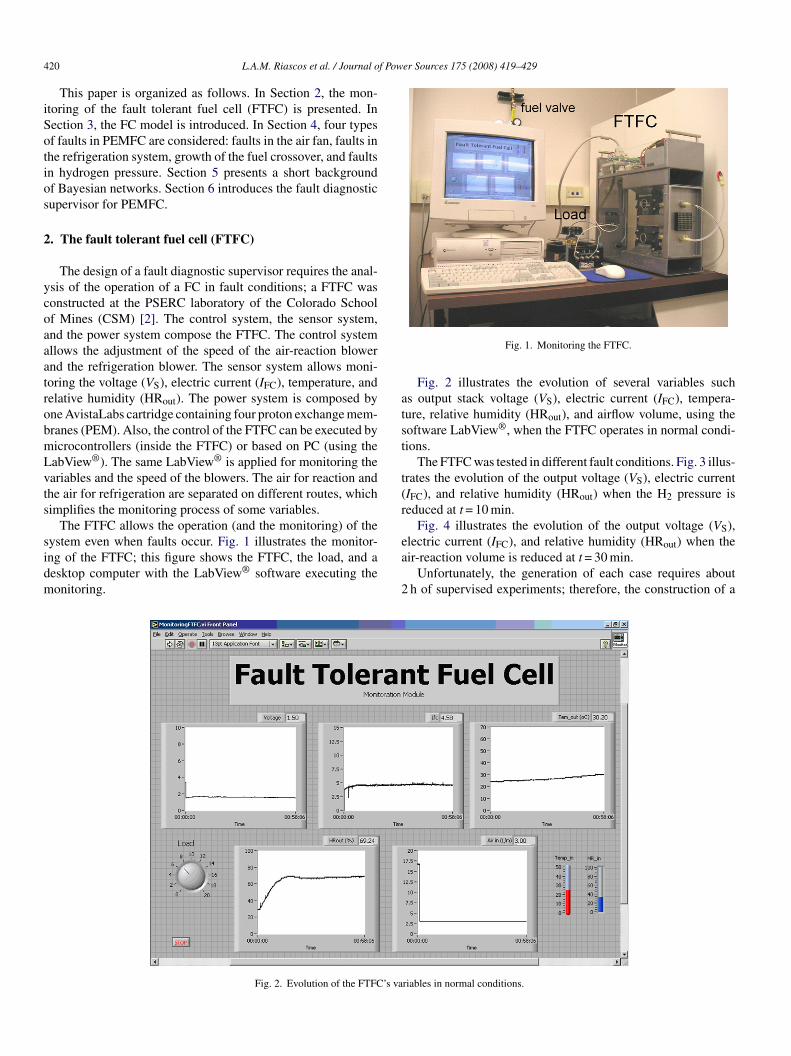
The design of a fault diagnostic supervisor requires the anal-sis of the operation of a FC in fault conditions; a FTFC wasonstructed at the PSERC laboratory of the Colorado Schoolf Mines (CSM) [2]. The control system, the sensor system,nd the power system compose the FTFC. The control systemllows the adjustment of the speed of the air-reaction blowernd the refrigeration blower. The sensor system allows moni-oring the voltage (VS), electric current (IFC), temperature, andelative humidity (HRout). The power system is composed byne AvistaLabs cartridge containing four proton exchange mem-ranes (PEM). Also, the control of the FTFC can be executed byicrocontrollers (inside the FTFC) or based on PC (using theabView®). The same LabView® is applied for monitoring theariables and the speed of the blowers. The air for reaction andhe air for refrigeration are separated on different routes, whichimplifies the monitoring process of some variables.
The FTFC allows the operation (and the monitoring) of the
ystem even when faults occur. Fig. 1 illustrates the monitor-ng of the FTFC; this figure shows the FTFC, the load, and aesktop computer with the LabView® software executing theonitoring.ea
2
Fig. 2. Evolution of the FTFC’s va
Fig. 1. Monitoring the FTFC.
Fig. 2 illustrates the evolution of several variables suchs output stack voltage (VS), electric current (IFC), tempera-ure, relative humidity (HRout), and airflow volume, using theoftware LabView®, when the FTFC operates in normal condi-ions.
The FTFC was tested in different fault conditions. Fig. 3 illus-rates the evolution of the output voltage (VS), electric currentIFC), and relative humidity (HRout) when the H2 pressure iseduced at t = 10 min.
Fig. 4 illustrates the evolution of the output voltage (VS),
lectric current (IFC), and relative humidity (HRout) when their-reaction volume is reduced at t = 30 min.Unfortunately, the generation of each case requires abouth of supervised experiments; therefore, the construction of a
riables in normal conditions.

L.A.M. Riascos et al. / Journal of Power Sources 175 (2008) 419–429 421
dtoTat
F
3
l
Fig. 3. Evolution of FTFC’s variables by reduction of H2 pressure.
atabase with a considerable number of cases became highlyime-consuming. Also, fault effects such as membrane breakingr dying of membrane imply permanent damage to the FTFC.
he effects of different types of faults can be simulated adaptingFC model, avoiding damage to the equipment and improvinghe generating time of fault records.
eit
ig. 4. Evolution of FTFC’s variables by reduction of air-reaction volume.
. The fuel cell model
Several mathematical models of PEMFC can be found in theiterature [1,3–5]. Basically, a model of PEMFC consists of an
lectro-chemical and thermo-dynamical parts. Correa et al. [3]ntroduce an electro-chemical model of a PEMFC; to validatehis model, the polarization curve obtained with this model is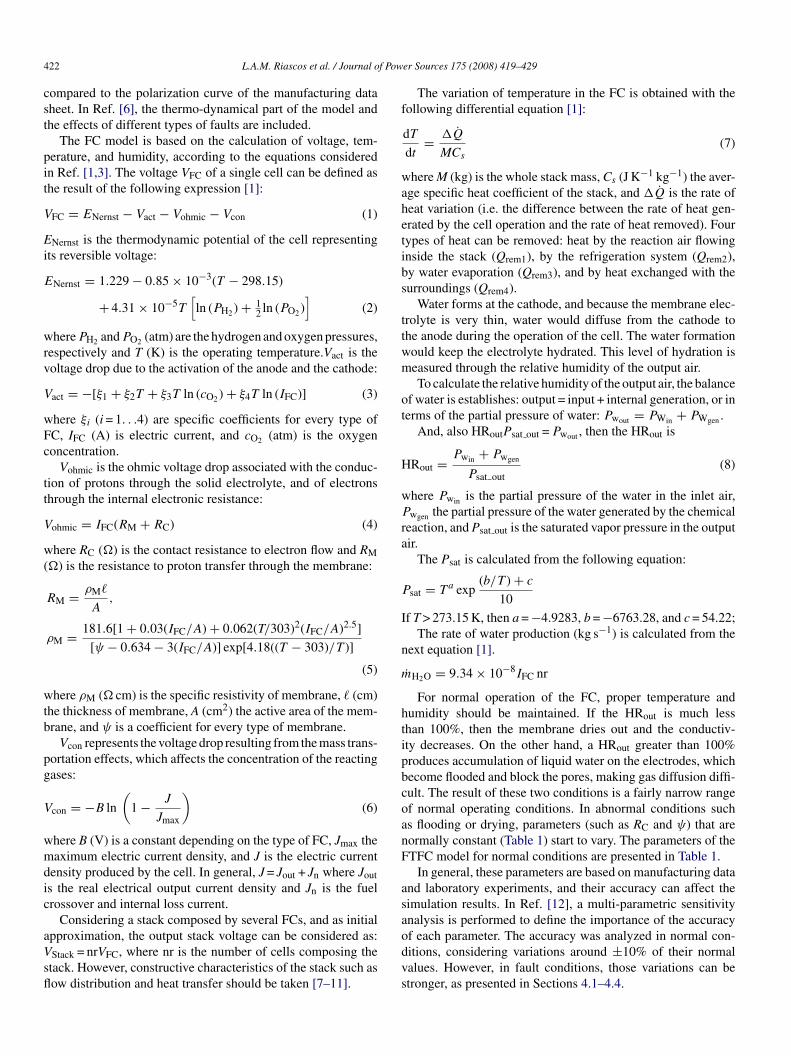
4 f Pow
cst
pit
V
Ei
E
wrv
V
wFc
tt
V
w(
wtb
pg
V
wmdic
aVsfl
f
wahetibs
ttwm
ot
H
wP
ra
P
I
n
m
htipbcoanF
asa
22 L.A.M. Riascos et al. / Journal o
ompared to the polarization curve of the manufacturing dataheet. In Ref. [6], the thermo-dynamical part of the model andhe effects of different types of faults are included.
The FC model is based on the calculation of voltage, tem-erature, and humidity, according to the equations consideredn Ref. [1,3]. The voltage VFC of a single cell can be defined ashe result of the following expression [1]:
FC = ENernst − Vact − Vohmic − Vcon (1)
Nernst is the thermodynamic potential of the cell representingts reversible voltage:
Nernst = 1.229 − 0.85 × 10⁻³(T − 298.15)
+ 4.31 × 10⁻⁵T[ln (PH2 ) + 1
2 ln (PO2 )]
(2)
herePH2 andPO2 (atm) are the hydrogen and oxygen pressures,espectively and T (K) is the operating temperature.Vact is theoltage drop due to the activation of the anode and the cathode:
act = −[ξ1 + ξ2T + ξ3T ln (cO2 ) + ξ4T ln (IFC)] (3)
here ξi (i = 1. . .4) are specific coefficients for every type ofC, IFC (A) is electric current, and cO2 (atm) is the oxygenoncentration.
Vohmic is the ohmic voltage drop associated with the conduc-ion of protons through the solid electrolyte, and of electronshrough the internal electronic resistance:
ohmic = IFC(RM + RC) (4)
here RC (�) is the contact resistance to electron flow and RM�) is the resistance to proton transfer through the membrane:
RM = ρM�
A,
ρM = 181.6[1 + 0.03(IFC/A) + 0.062(T/303)2(IFC/A)2.5]
[ψ − 0.634 − 3(IFC/A)] exp[4.18((T − 303)/T )]
(5)
here ρM (� cm) is the specific resistivity of membrane, � (cm)he thickness of membrane, A (cm2) the active area of the mem-rane, and ψ is a coefficient for every type of membrane.
Vcon represents the voltage drop resulting from the mass trans-ortation effects, which affects the concentration of the reactingases:
con = −B ln
(1 − J
Jmax
)(6)
here B (V) is a constant depending on the type of FC, Jmax theaximum electric current density, and J is the electric current
ensity produced by the cell. In general, J = Jout + Jn where Jouts the real electrical output current density and Jn is the fuelrossover and internal loss current.
Considering a stack composed by several FCs, and as initial
pproximation, the output stack voltage can be considered as:Stack = nrVFC, where nr is the number of cells composing thetack. However, constructive characteristics of the stack such asow distribution and heat transfer should be taken [7–11].odvs
er Sources 175 (2008) 419–429
The variation of temperature in the FC is obtained with theollowing differential equation [1]:
dT
dt= �Q
MCs(7)
here M (kg) is the whole stack mass, Cs (J K−1 kg−1) the aver-ge specific heat coefficient of the stack, and �Q is the rate ofeat variation (i.e. the difference between the rate of heat gen-rated by the cell operation and the rate of heat removed). Fourypes of heat can be removed: heat by the reaction air flowingnside the stack (Qrem1), by the refrigeration system (Qrem2),y water evaporation (Qrem3), and by heat exchanged with theurroundings (Qrem4).
Water forms at the cathode, and because the membrane elec-rolyte is very thin, water would diffuse from the cathode tohe anode during the operation of the cell. The water formationould keep the electrolyte hydrated. This level of hydration iseasured through the relative humidity of the output air.To calculate the relative humidity of the output air, the balance
f water is establishes: output = input + internal generation, or inerms of the partial pressure of water: Pwout = PWin + PWgen .
And, also HRoutPsat out =Pwout , then the HRout is
Rout = Pwin + Pwgen
Psat out(8)
here Pwin is the partial pressure of the water in the inlet air,wgen the partial pressure of the water generated by the chemical
eaction, and Psat out is the saturated vapor pressure in the outputir.
The Psat is calculated from the following equation:
sat = T a exp(b/T ) + c
10
f T > 273.15 K, then a = −4.9283, b = −6763.28, and c = 54.22;The rate of water production (kg s−1) is calculated from the
ext equation [1].
˙ H2O = 9.34 × 10⁻⁸IFC nr
For normal operation of the FC, proper temperature andumidity should be maintained. If the HRout is much lesshan 100%, then the membrane dries out and the conductiv-ty decreases. On the other hand, a HRout greater than 100%roduces accumulation of liquid water on the electrodes, whichecome flooded and block the pores, making gas diffusion diffi-ult. The result of these two conditions is a fairly narrow rangef normal operating conditions. In abnormal conditions suchs flooding or drying, parameters (such as RC and ψ) that areormally constant (Table 1) start to vary. The parameters of theTFC model for normal conditions are presented in Table 1.
In general, these parameters are based on manufacturing datand laboratory experiments, and their accuracy can affect theimulation results. In Ref. [12], a multi-parametric sensitivitynalysis is performed to define the importance of the accuracy
f each parameter. The accuracy was analyzed in normal con-itions, considering variations around ±10% of their normalalues. However, in fault conditions, those variations can betronger, as presented in Sections 4.1–4.4.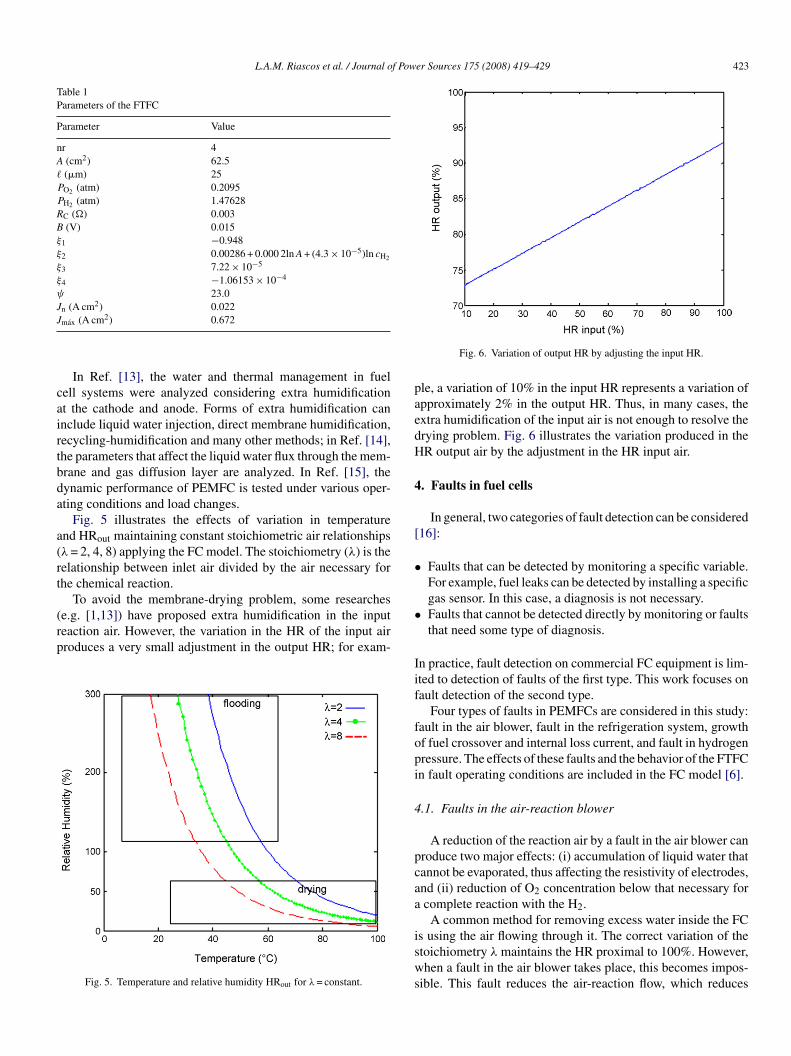
L.A.M. Riascos et al. / Journal of Power Sources 175 (2008) 419–429 423
Table 1Parameters of the FTFC
Parameter Value
nr 4A (cm2) 62.5� (�m) 25PO2 (atm) 0.2095PH2 (atm) 1.47628RC (�) 0.003B (V) 0.015ξ1 −0.948ξ2 0.00286 + 0.000 2ln A + (4.3 × 10⁻⁵)ln cH2
ξ3 7.22 × 10⁻⁵
ξ4 −1.06153 × 10⁻⁴
ψ 23.0J (A cm2) 0.022J
cairtbda
a(rt
(rp
paedH
4
[
•
n
max (A cm2) 0.672
In Ref. [13], the water and thermal management in fuelell systems were analyzed considering extra humidificationt the cathode and anode. Forms of extra humidification cannclude liquid water injection, direct membrane humidification,ecycling-humidification and many other methods; in Ref. [14],he parameters that affect the liquid water flux through the mem-rane and gas diffusion layer are analyzed. In Ref. [15], theynamic performance of PEMFC is tested under various oper-ting conditions and load changes.
Fig. 5 illustrates the effects of variation in temperaturend HRout maintaining constant stoichiometric air relationshipsλ= 2, 4, 8) applying the FC model. The stoichiometry (λ) is theelationship between inlet air divided by the air necessary forhe chemical reaction.
To avoid the membrane-drying problem, some researches
e.g. [1,13]) have proposed extra humidification in the inputeaction air. However, the variation in the HR of the input airroduces a very small adjustment in the output HR; for exam-Fig. 5. Temperature and relative humidity HRout for λ= constant.
•
Iif
fopi
4
pcaa
isws
Fig. 6. Variation of output HR by adjusting the input HR.
le, a variation of 10% in the input HR represents a variation ofpproximately 2% in the output HR. Thus, in many cases, thextra humidification of the input air is not enough to resolve therying problem. Fig. 6 illustrates the variation produced in theR output air by the adjustment in the HR input air.
. Faults in fuel cells
In general, two categories of fault detection can be considered16]:
Faults that can be detected by monitoring a specific variable.For example, fuel leaks can be detected by installing a specificgas sensor. In this case, a diagnosis is not necessary.Faults that cannot be detected directly by monitoring or faultsthat need some type of diagnosis.
n practice, fault detection on commercial FC equipment is lim-ted to detection of faults of the first type. This work focuses onault detection of the second type.
Four types of faults in PEMFCs are considered in this study:ault in the air blower, fault in the refrigeration system, growthf fuel crossover and internal loss current, and fault in hydrogenressure. The effects of these faults and the behavior of the FTFCn fault operating conditions are included in the FC model [6].
.1. Faults in the air-reaction blower
A reduction of the reaction air by a fault in the air blower canroduce two major effects: (i) accumulation of liquid water thatannot be evaporated, thus affecting the resistivity of electrodes,nd (ii) reduction of O2 concentration below that necessary forcomplete reaction with the H2.
A common method for removing excess water inside the FC
s using the air flowing through it. The correct variation of thetoichiometry λ maintains the HR proximal to 100%. However,hen a fault in the air blower takes place, this becomes impos-ible. This fault reduces the air-reaction flow, which reduces

4 f Pow
twtos
R
wckt
wcdnV(ha
4
aaAewi
ro
ψ
wokt
ccr
4
twof
tfaat
24 L.A.M. Riascos et al. / Journal o
he water evaporation volume and permits the accumulation ofater. A great accumulation of water causes the flooding of elec-
rodes making gas diffusion difficult and affecting the resistancef the electrodes and the performance of the FC. This effect isimulated by the following equation [6]:
c(k) = Rc(0)
(waccum(k)
const1
)0.8
(9)
here Rc(0) is the value of the variable at the initial state (normalondition),waccum(k) the volume of water accumulated at instant, and const1 is a constant defining when the electrodes are ledo flooding.
The second effect of a fault in the air-reaction blower occurshen λ is below the practical and recommended value. In this
ase, the O2 concentration is reduced and the exit air completelyepleted of O2. This reduction of O2 concentration produces aegative effect on the ENernst (Eq. (2)) and the increment on theact (Eq. (3)). Fig. 7 illustrates the evolution of output voltage
VS), electric current (IFC), water volume accumulated, relativeumidity (HRout), and stoichiometry, when a partial fault in their blower occurs at t = 30 min.
.2. Fault in the refrigeration system
The refrigeration system maintains temperature within oper-ting conditions. When the temperature increases, the reactionir has a drying effect and reduces the relative humidity (HR).
low HR can produce a catastrophic effect on the polymerlectrolyte membrane, which not only totally relies upon highater content, but is also very thin (and thus prone to rapid dry-
ng out). The drying of the membrane changes the membrane’s
orit
Fig. 7. Evolution of the FC mo
er Sources 175 (2008) 419–429
esistance to proton flow (RM). RM is affected by the adjustmentf ψ, which varies according to the following equation [6]:
(k) = ψ(0)
(const2/HRout)1.12 (10)
here ψ(0) is the value at the saturated condition (around 100%f HR), HRout(k) is the relative humidity of the outlet air at instant, and const2 is a constant defining when the membrane is ledo drying.
Fig. 8 illustrates the evolution of output voltage (VS), electricurrent (IFC), temperature, relative humidity (HRout), and stoi-hiometry produced by a fault in the refrigeration system (i.e. aeduction of Qrem2) at t = 30 min.
.3. Increase of fuel crossover (Jn)
There is a small amount of wasted fuel that migrates throughhe membrane. It is defined as fuel crossover—some hydrogenill diffuse from the anode (through the electrolyte) to the cath-de, reacting directly with the oxygen and producing no currentor the FC.
In normal conditions, the flow of fuel and electrons throughhe membrane (Jn) is very small, typically representing only aew mA cm2. A sudden increase in this parameter can be associ-ted with rupture of the membrane. This variation of Jn producesn increase in the concentration voltage drop (Vcon, Eq. (6)), andherefore a reduction of VFC. Fig. 9 illustrates the evolution of
utput voltage (VS), electric current (IFC), generated heat (Qgen),eal output power (Potreal), and stoichiometry produced by anncrease in the fuel crossover (Jn) from 0.022 to 0.2 A cm2 at= 30 min.del by air-reaction fault.

L.A.M. Riascos et al. / Journal of Power Sources 175 (2008) 419–429 425
odel
4
ipilT
Vtep
Fig. 8. Evolution of the FC m
.4. Fault in hydrogen pressure
In general, for mobile and stationary applications, hydrogens supplied by a high-pressure bottle, which is reduced by aressure regulator. In normal conditions, the hydrogen pressure
s assumed to be constant (generally between 1 and 3 atm). Aower pressure negatively affects the performance of the FC.he reduction of H2 pressure decreases the ENernst, increases theofi
Fig. 9. Evolution of the FC mod
by refrigeration system fault.
act, and has a corresponding effect on VFC. Fig. 10 illustrateshe evolution of output voltage (VS), electric current (IFC), gen-rated heat (Qgen), stoichometry, and relative humidity (HRout)roduced by a reduction of the H2 pressure.
In this section, the effects of four types of faults on the FC
peration were explained simply and directly. However, when aault occurs, an interconnected dependence among the variabless established; in general, all the variables perform some kind ofel by membrane breaking.

426 L.A.M. Riascos et al. / Journal of Power Sources 175 (2008) 419–429
C mo
can
5
dafeBetan“
randGXatt
bmtd
(
(
(
(
(
5
1vat
Fig. 10. Evolution of the F
hanges. That hinders the diagnosis of the fault cause. To qualifynd quantify the dependence among the variables, a Bayesianetwork is constructed to conduct the fault diagnosis.
. Bayesian networks for fault diagnosis
Bayesian networks have been extensively applied to faultiagnosis, e.g. [17,18]; however, in the area of fuel cells, it isnew field. In Ref. [17], a Bayesian network is implemented
or controlling an unsupervised fault tolerant system to gen-rate oxygen from the CO2 on Mars atmosphere. In Ref. [18],ayesian network is applied for fault diagnosis in a power deliv-ry system. One advantage of Bayesian network is that it allowshe combination of expert knowledge of the process and prob-bilistic theory for the construction of a diagnostic procedure;evertheless, both are recommended for the construction of agood” Bayesian network.
A Bayesian network is a structure that graphically modelselationships of probabilistic dependence within a group of vari-bles. A Bayesian network B = (G, CP) is composed of theetwork structure G and the conditional probabilities (CP). Airected acyclic graph (DAG) represents the graphical structure, where each node of the graph is associated to a variablei, and each node has a set of parents pa(Xi). The relationshipmong variables and parents represents the cause–effect rela-ionship. The conditional probabilities, numerically quantifieshis cause–effect relationship [19].
The construction of a Bayesian network for fault diagnosis
egins with the collection of fault records and then probabilisticethods are applied for the generation of the cause–effect struc-ure. This process consists of the following steps, described inetail in Ref. [6]:
o
vi
del by H2 pressure fault.
a) Construction of the database—the records are provided fromthe FC model implemented on MatLab®. Field experimentscould also provide those records; however, two major prob-lems should be considered: (i) large amounts of data arenecessary, where the generation of each case takes around2 h of supervised experiments and (ii) variables such asQgen, flooding, λ, etc., impose additional challenges to bemonitored.
b) Implementation of search-and-score algorithms (e.g. theBayesian-score (K2) [20] and MCMC [21]) to find theinitial structure. The probabilistic approaches were imple-mented using the Bayesian Network Toolbox developed forMatLab® in Ref. [21].
c) Groups of variables are arranged in layers. Fault causes,sensors, and pattern recognition are considered as layers.
d) Constraint-based conditions and knowledge are applied forimproving the structure.
e) Calculation of conditional probabilities on the final struc-ture. In this research, the maximum posteriori likelihoodalgorithm [22] was applied.
.1. Generation of the database
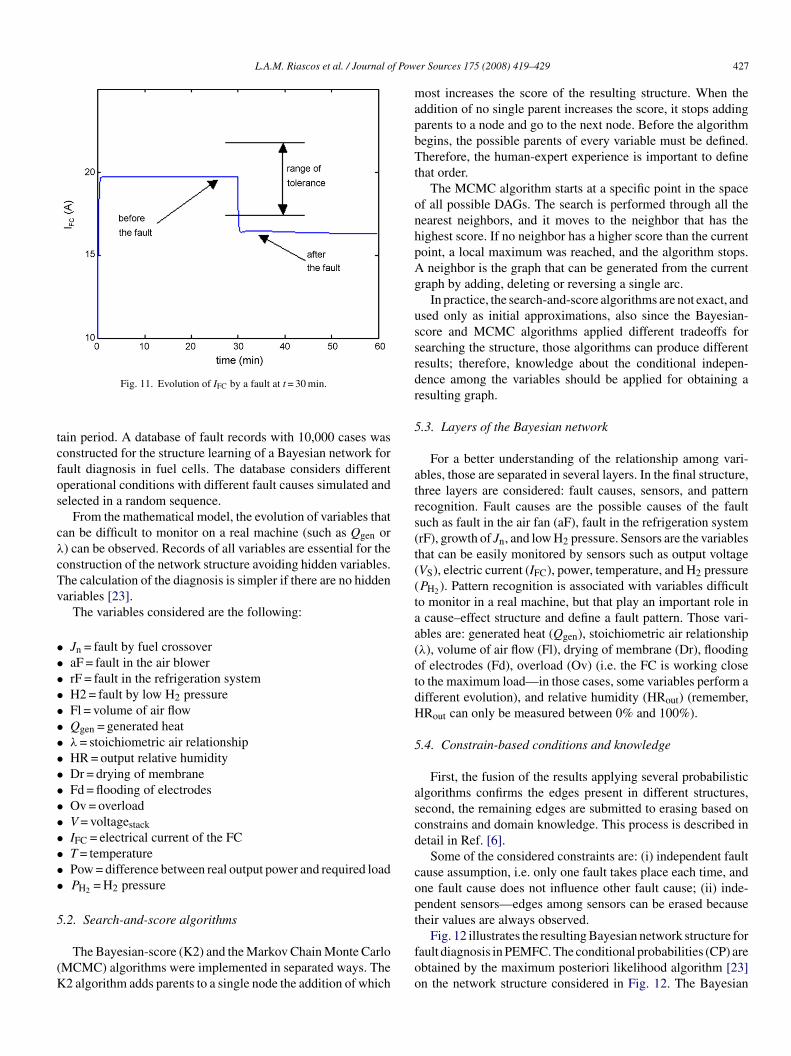
Binary states of the variables are considered (0 = normal,= abnormal). The general procedure is to monitor a specificariable; if after a fault takes place and the value of such vari-ble is off a certain tolerance band, then a flag should be turnedo “1”. Fig. 11 represents the range of tolerance and the evolution
f the IFC after a fault at t = 30 min.The next step is the construction of a vector containing thealue of all variables. This vector corresponds to a single casen the database with values of all variables considered in a cer-
L.A.M. Riascos et al. / Journal of Pow
tcfos
cλ
cTv
••••••••••••••••
5
(K
mapbTt
onhpAg
ussrdr
5
atrs(t((taa(otdH
5
ascd
copt
Fig. 11. Evolution of IFC by a fault at t = 30 min.
ain period. A database of fault records with 10,000 cases wasonstructed for the structure learning of a Bayesian network forault diagnosis in fuel cells. The database considers differentperational conditions with different fault causes simulated andelected in a random sequence.
From the mathematical model, the evolution of variables thatan be difficult to monitor on a real machine (such as Qgen or) can be observed. Records of all variables are essential for theonstruction of the network structure avoiding hidden variables.he calculation of the diagnosis is simpler if there are no hiddenariables [23].
The variables considered are the following:
Jn = fault by fuel crossoveraF = fault in the air blowerrF = fault in the refrigeration systemH2 = fault by low H2 pressureFl = volume of air flowQgen = generated heatλ= stoichiometric air relationshipHR = output relative humidityDr = drying of membraneFd = flooding of electrodesOv = overloadV = voltagestackIFC = electrical current of the FCT = temperaturePow = difference between real output power and required loadPH2 = H2 pressure
.2. Search-and-score algorithms
The Bayesian-score (K2) and the Markov Chain Monte CarloMCMC) algorithms were implemented in separated ways. The2 algorithm adds parents to a single node the addition of which
foo
er Sources 175 (2008) 419–429 427
ost increases the score of the resulting structure. When theddition of no single parent increases the score, it stops addingarents to a node and go to the next node. Before the algorithmegins, the possible parents of every variable must be defined.herefore, the human-expert experience is important to define
hat order.The MCMC algorithm starts at a specific point in the space
f all possible DAGs. The search is performed through all theearest neighbors, and it moves to the neighbor that has theighest score. If no neighbor has a higher score than the currentoint, a local maximum was reached, and the algorithm stops.neighbor is the graph that can be generated from the current
raph by adding, deleting or reversing a single arc.In practice, the search-and-score algorithms are not exact, and
sed only as initial approximations, also since the Bayesian-core and MCMC algorithms applied different tradeoffs forearching the structure, those algorithms can produce differentesults; therefore, knowledge about the conditional indepen-ence among the variables should be applied for obtaining aesulting graph.
.3. Layers of the Bayesian network
For a better understanding of the relationship among vari-bles, those are separated in several layers. In the final structure,hree layers are considered: fault causes, sensors, and patternecognition. Fault causes are the possible causes of the faultuch as fault in the air fan (aF), fault in the refrigeration systemrF), growth of Jn, and low H2 pressure. Sensors are the variableshat can be easily monitored by sensors such as output voltageVS), electric current (IFC), power, temperature, and H2 pressurePH2 ). Pattern recognition is associated with variables difficulto monitor in a real machine, but that play an important role incause–effect structure and define a fault pattern. Those vari-
bles are: generated heat (Qgen), stoichiometric air relationshipλ), volume of air flow (Fl), drying of membrane (Dr), floodingf electrodes (Fd), overload (Ov) (i.e. the FC is working closeo the maximum load—in those cases, some variables perform aifferent evolution), and relative humidity (HRout) (remember,Rout can only be measured between 0% and 100%).
.4. Constrain-based conditions and knowledge
First, the fusion of the results applying several probabilisticlgorithms confirms the edges present in different structures,econd, the remaining edges are submitted to erasing based ononstrains and domain knowledge. This process is described inetail in Ref. [6].
Some of the considered constraints are: (i) independent faultause assumption, i.e. only one fault takes place each time, andne fault cause does not influence other fault cause; (ii) inde-endent sensors—edges among sensors can be erased becauseheir values are always observed.
Fig. 12 illustrates the resulting Bayesian network structure forault diagnosis in PEMFC. The conditional probabilities (CP) arebtained by the maximum posteriori likelihood algorithm [23]n the network structure considered in Fig. 12. The Bayesian

428 L.A.M. Riascos et al. / Journal of Power Sources 175 (2008) 419–429
nt
abtttav
6
wcoi
eblba
satwtttFsstt
stt
strtrba
t
otTttcea
7
dta
vrsl
cw
Fig. 12. Bayesian network structure for fault diagnosis in a PEMFC.
etwork B composed of the network structure G plus CP is readyo be used for fault diagnosis in a PEMFC.
Network structures representing a diagnostic process playfundamental role for fault tolerant machines since they can
e associated with fault treatment processes (i.e. performinghe fault diagnosis to identify the fault cause and executinghe automatic recovery process). In Refs. [24–26] fault detec-ion and fault treatment were integrated; the case studies wereutomatic recovery processes in electric autonomous guidedehicles, machining processes and factories.
. The on-line fault diagnosis
An inference is the computation of a probability p(Xq|XE),here Xq is the variable of interest (e.g. the most probable fault
ause) and XE is the variable or set of variables that have beenbserved (i.e. the effects observed by sensors and transformednto logic outputs).
There are many different algorithms for calculating the infer-nce in Bayesian networks, which apply different tradeoffsetween speed, complexity, generality, and accuracy. The on-ine fault supervisor executes the fault diagnostic inferencey applying the variable elimination algorithm, which can bepplied to any type of Bayesian network structure [27].
The fault diagnostic fuel cell system is composed of severalubsystems: the fuel cell stack and controller, the supervisor,nd the peripheryc subsystems. The fuel cell stack containshe electro-chemical and thermo-dynamical parts of the modelhich calculate voltage, temperature, and humidity. The con-
roller calculates the volume of air-reaction and turns on/offhe refrigeration subsystem according to the performance ofhe process. The supervisor verifies the correct operation of theC. If monitored variables perform abnormal changes, then theupervisor executes the diagnostic process. The peripheryc sub-ystems provide the air for the chemical reaction, the hydrogen,he refrigeration, and the load. The environmental conditions areemperature 25 ◦C and relative humidity 40%.
Fig. 13 illustrates the execution of an on-line fault diagno-is. This test was performed forcing externally the output ofhe refrigeration subsystem to zero (this simulates a fault condi-ion). In this case, the supervisor detects abnormal variations in
Ta
i
Fig. 13. On-line fault diagnosis execution.
ome variables during the operation of the FC. Then, the condi-ional probabilities were calculated for all fault causes (Jn, aF,F, and H2) and shown at the supervisor’s display. According tohe supervisor, the most probable fault cause is rF (fault in theefrigeration system) with 94% probability. The second proba-le cause is an increase of Jn with 44% probability. And causesF and H2 have 0% probability.
In all tests performed, the supervisor always indicated therue cause as the most probable cause.
In general, the variation of electrical variables (such asutput voltage (VS), and electric current (IFC)) is faster thanhe variation of thermo-dynamical variables (e.g. temperature).herefore, the diagnosis of faults such as rF takes more time (in
his case, around 20 s); actually, this speed depends entirely onhe accuracy of the sensors. According to our experience, a worsease scenario still allows fault detection in less than 1 min. But,ven 1 min is a good speed for detecting incipient faults beforecatastrophic effect takes place in the fuel cell system.
. Conclusions
The design of a supervisor system to perform on-line faultiagnosis in PEM fuel cells was implemented. The execution ofhe diagnosis was based on a Bayesian network, which qualifiesnd quantifies the cause–effect relationship within the variables.
Fault records of some variables were constructed includingariables difficult to monitor in a real machine. The record of allelevant variables is essential for the construction of the networktructure avoiding hidden variables, especially in intermediaryayers.
After the construction of the Bayesian network, the inferencealculation is based on observations of variables easy to monitorith sensors such as voltage, electric current, temperature, etc.
his allows the implementation of fault diagnostic processes inreal machine.The fault diagnostic tests have shown agreement between thenference results and the original fault causes.

f Pow
ic
ccu
A
R
[
[
[
[
[
[
[
[
[
[[[[
[
[
[Conference on Systems, Man and Cybernetics Tucson, 2001, pp.
L.A.M. Riascos et al. / Journal o
In general, the fault diagnostic tests were fast enough to detectncipient faults before a catastrophic effect took place in the fuelell system.
Topics such as the study of fault effects in fuel cells, theonstruction of network structures for fault diagnosis in fuelells, and their association to fault treatment processes are stillnder study, and are still open to research contributions.
cknowledgments
The authors thank CNPq and FAPESP for financial support.
eferences
[1] J. Larminie, A. Dicks, Fuel Cell Systems Explained, John Wiley & SonsLtd., 2003.
[2] L.A.M. Riascos, M.G. Simoes, F.G. Cozman, E. Miyagi, Proceedings ofthe 41st IEEE-IAS (Ind. Appl. Soc.), Tampa, FL, USA, 2006.
[3] J.M. Correa, F.A. Farret, L.N. Canha, M.G. Simoes, IEEE Trans. Ind.Electron. 51 (5) (2004) 1103–1112.
[4] N. Fouquet, C. Doulet, C. Nouillant, G. Dauphin-Tanguy, B. Ould-Bouamama, J. Power Sources 159 (2) (2006) 905–913.
[5] K. Promislow, B. Wetton, J. Power Sources 150 (4) (2005) 129–135.[6] L.A.M. Riascos, M.G. Simoes, P.E. Miyagi, J. Power Sources 165 (1)
(2007) 267–278.[7] P.A.C. Chang, J. St-Pierre, J. Stumper, B. Wetton, J. Power Sources 162
(1) (2006) 340–355.[8] S.A. Freunberger, M. Santis, I.A. Schneider, A. Wokaun, F.N. Buchi, J.
Electrochem. Soc. 153 (3) (2006) A396–A405.[9] S.A. Freunberger, A. Wokaun, F.N. Buchi, J. Electrochem. Soc. 153 (3)
(2006) A909–A913.
[
[
er Sources 175 (2008) 419–429 429
10] G.-S. Kim, J. St-Pierre, K. Promislow, B. Wetton, J. Power Sources 152 (1)(2005) 210–217.
11] M. Santis, S.A. Freunberger, M. Papra, A. Wokaun, F.N. Buchi, J. PowerSources 161 (2) (2006) 1076–1083.
12] J.M. Correa, F.A. Farret, L.N. Canha, M.G. Simoes, V.A. Popov, IEEETrans. Energy Conver. 20 (1) (2005) 211–218.
13] C. Bao, M. Ouyanga, B. Yib, Int. J. Hydrogen Energy 31 (2006) 1040–1057.
14] Z. Zhan, J. Xiao, D. Li, M. Pan, R. Yuan, J. Power Sources 160 (2) (2006)1041–1048.
15] Q. Yan, H. Toghianib, H. Causeya, J. Power Sources 161 (1) (2006)492–502.
16] P.M. Frank, Proceedings of International Symposium on AI in Real-timeControl, Delft, 1992, pp. 363–370.
17] U. Lerner, B. Moses, M. Scott, S. McIlraith, D. Koller, Proceedings of 18thConference on Uncertainty in AI, 2002, pp. 301–310.
18] C.F. Chien, S.L. Chen, Y.S. Lin, IEEE Trans. Power Delivery 17 (3) (2002)785–793.
19] D.M. Chickering, J. Mach. Learn. Res. 3 (2002) 507–554.20] G.F. Cooper, E. Herskovits, Mach. Learn. 9 (4) (1992) 309–347.21] K. Murphy (2005). http://bnt.sourceforge.net/.22] J. Pearl, Causality: Models Reasoning and Inference, Cambridge University
Press, 2000.23] J. Pearl, Probabilistic Reasoning in Intelligent Systems: Networks of Plau-
sible Inference, Morgan Kaufmann Publ., 1988.24] L.A.M. Riascos, F.G. Cozman, P.E. Miyagi, Proceedings of IEEE-ISIE (Int.
Symp. Ind. Electron.), Rio de Janeiro, Brazil, 2003.25] L.A.M. Riascos, P.E. Miyagi, Proceedings of IEEE-SMC International
2528–2533.26] P.E. Miyagi, L.A.M. Riascos, Control Eng. Pract. 14 (4) (2006) 397–
408.27] F.G. Cozman (2001). http://www-2.cs.cmu.edu/∼javabayes/.