oil markets and company valuation: the pemex case
TRANSCRIPT
FACULTAD DE CIENCIAS ECONÓMICAS Y EMPRESARIALES
OIL MARKETS AND COMPANY VALUATION:
THE PEMEX CASE
Autor: Bernardo Sánchez Revilla
Director: Rocío Saénz-Diez Rojas
Madrid
Junio 2017
2
Bernardo Sánchez Revilla
O
IL M
AR
KE
TS
AN
D C
OM
PA
NY
VA
LU
AT
ION
: T
HE
PE
ME
X C
AS
E
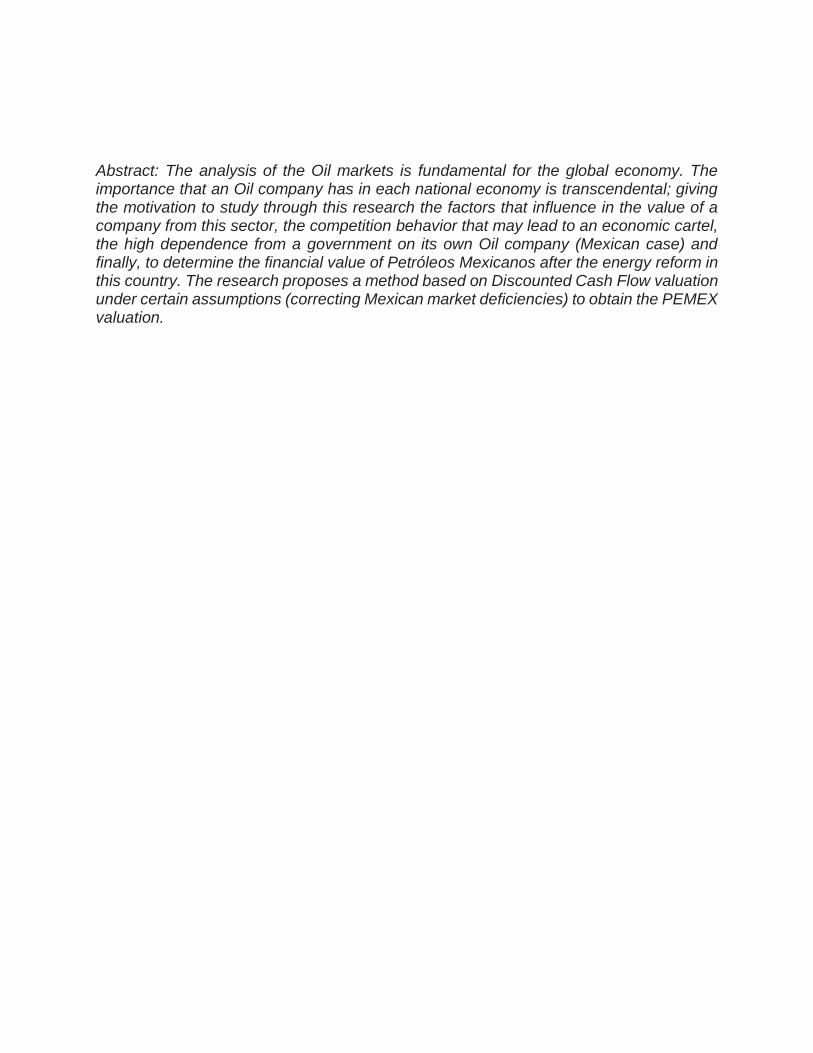
Abstract: The analysis of the Oil markets is fundamental for the global economy. The importance that an Oil company has in each national economy is transcendental; giving the motivation to study through this research the factors that influence in the value of a company from this sector, the competition behavior that may lead to an economic cartel, the high dependence from a government on its own Oil company (Mexican case) and finally, to determine the financial value of Petróleos Mexicanos after the energy reform in this country. The research proposes a method based on Discounted Cash Flow valuation under certain assumptions (correcting Mexican market deficiencies) to obtain the PEMEX valuation.

4
INDEX Introduction ................................................................................................................... 7
Chapter 1: CONCEPTS ABOUT VALUATION ............................................................ 10
Discounted-Cash Flow Method .................................................................................. 10
Multiples Valuation ..................................................................................................... 13
Chapter 2: VALUE OF AN OIL COMPANY ................................................................. 15
Effects of Oil Price Volatility ....................................................................................... 15
Chapter 3: FUTURE EXPECTATIONS OF THE OIL MARKET: The Cobweb Model
and Stackelberg Oligopoly ......................................................................................... 19
The Cobweb Model .................................................................................................... 19
Stackelberg Oligopoly ................................................................................................ 19
Chapter 4: OIL IN MEXICO .......................................................................................... 24
Government Dependence from PEMEX .................................................................... 24
PEMEX Debt Situation ............................................................................................... 27
Mexican Energy Reform ............................................................................................. 30
Effects of the Mexican Energy Reform to Foreign Oil Companies ............................. 31
Chapter 5: PEMEX OIL VALUATION .......................................................................... 35
PEMEX Valuation by Discounted-Cash Flow Method ................................................ 35
PEMEX Valuation by Alternative Discounted-Cash Flow Method .............................. 38
PEMEX Valuation by Multiples Method ...................................................................... 41
Conclusions ................................................................................................................. 43

5
TABLE INDEX Table 2.1: Increase in national income of exporter oil countries provoked by an
increase of 1% in oil price (during 1998-2015) .......................................................... 16
Table 2.2: Increase in exports in oil producing countries provoked by an increase of
1%in oil price (during 1998-2015) .............................................................................. 16
Table 3.1: Crude Oil Reserves of OPEC members for the year 2015 (in percentage) 21
Table 3.2: Crude Oil Production by country (1,000 b/d) ............................................. 21
Table 3.3: Proven Crude Oil Reserves (mb) .............................................................. 22
Table 3.4: Selected spot crude oil prices ($/b) ........................................................... 23
Table 4.1: PEMEX Debt Structure until June 2, 2017 (figures in USD) ...................... 28
Table 4.2: Official ratings for Petróleos Mexicanos June2, 2017 ............................... 29
Table 4.3: Price behavior of oil companies in the Mexican energy reform process
(data in USD) ............................................................................................................. 33
Table 5: Assumptions used for the Valuation process ............................................... 35
Table 5.1: PEMEX Cost of equity calculations ........................................................... 36
Table 5.2: PEMEX Cost of debt calculations (data in million USD) ............................ 36
Table 5.3: PEMEX Equity (data in million USD) ......................................................... 37
Table 5.4: PEMEX Equity and Debt (data in million USD) ......................................... 37
Table 5.5: PEMEX Valuation by Discounted-Cash flows methodology (figures in
million USD) ............................................................................................................... 38
Table 5.6: Assumptions used for the Valuation process ............................................ 39
Table 5.7: PEMEX Valuation by Alternative Discounted-Cash flows methodology
(figures in million USD) .............................................................................................. 40
Table 5.8: Peer group for PEMEX valuation ............................................................... 41
Table 5.9: PEMEX Multiples valuation (million USD) ................................................. 41
GRAPH INDEX Graph 4: Bonds Debt Structure categorized by maturity from 2017 to 2041 and
beyond (figures in billion USD) ................................................................................... 28
Graph 4.1: Historical Close price for TOTAL S.A. Oil Company (TOT) Share. From
April 2012 to April 2015, with a daily frequency (data shown in USD) ...................... 31
Graph 4.2: Historical Close price for Petróleo Brasileiro S.A. Oil Company (PBR-A)
Share. From April 2012 to April 2015, with a daily frequency (data shown in USD) ... 32
Graph 4.3: Historical Close price for Royal Dutch Shell Company (RDS-B) Share.
From April 2012 to April 2015, with a daily frequency (data shown in USD) .............. 32
6
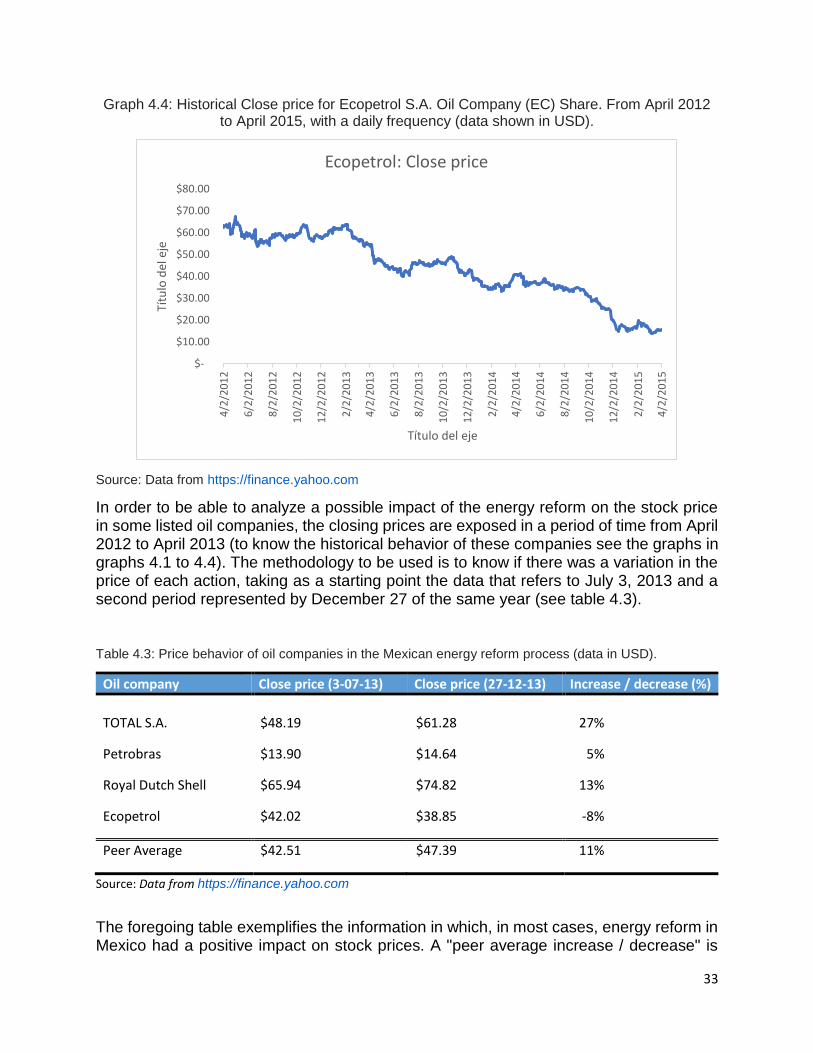
Graph 4.3: Historical Close price for for Ecopetrol S.A. Oil Company (E) Share. From
April 2012 to April 2015, with a daily frequency (data shown in USD) ....................... 33
IMAGE INDEX Image 4.1: Model Implied Rating by Thomson Reuters Eikon: Model Summary for
Petróleos Mexicanos at June 2, 2017 ........................................................................ 29
Image 5: Free Cash Flows for Petróleos Mexicanos from 2016 to 2027 .................... 38
Image 5.1: Free Cash Flows for Petróleos Mexicanos from 2016 to 2027 by
alternative methodology ............................................................................................. 40
Image 5.2: Football Field Valuation Chart for PEMEX (thousand million USD) .......... 42

7
Introduction The main objective of this research work is to analyze an industry that is fundamental for the development and growth of nations and economies, the oil market. This analysis leads to the study of the factors that influence the value of a company belonging to the oil industry, to explain the importance and impact that a state monopoly company in this sector (such as Petróleos Mexicanos) can have on the national economy and their public policy, determine and study the financial value of Petróleos Mexicanos (PEMEX) using the case method and evaluate the long-term vision of PEMEX. According to the new energy reform in Mexico, it will be studied from the national and international approach: the first one will take into consideration all the advantages that Petróleos Mexicanos will have, while the second one will consider the effects on foreign oil companies, mainly in the price of the share in stock markets.
Objectives
The main goals of this study are represented on the following questions:
- Which are the factors that influence in the value of an Oil company?
- What are the competitive dynamics in the Oil market?
- How healthy is the Mexican Oil industry?
- What are the advantages that the law energy reform will provide?
- What is the financial value of PEMEX?
Methodology
The methodology to meet the objectives of this research will have an empirical deductive approach through the use of the case method. The use of academic, professional and specialized bibliography will serve as a support for the general study of the petroleum industry, while the case analysis, accompanied by financial information of the company, will be the way to determine and analyze the financial valuation of PEMEX.
The case study methodology is an empirical enquiry that investigates a contemporary phenomenon in-depth and within its real-life context. In addition, this tool measures and records the behavior of agents directly involved in the subject of research, in contrast with quantitative methods that focus on information obtained through surveys (Yin,2009). Other authors, such as Gog (2015) mention that the importance of the case study emanates in that it is reflected directly in the theory oriented to the practice, in spite of the preoccupation by the study of cases like empirical methodology.
In order to carry out the study of a case in an efficient way, it is proposed to follow the methodology of Yin (2009). It focuses on four pillars: the first refers to the design of the case under study, the second refers to the preparation of available information, while the

8
third reflects a strategy of analysis and finally the fourth develops the conclusions and implications.
Structure
In order to reach the objectives, the research will be structured in the five parts: theoretical framework of valuation, analysis of factors that affect the value of an Oil company, study of the kind of competition in Oil industry, research of Mexican Oil market in hand with the energy reform, and finally, the valuation of PEMEX.
Firstly, the reader will find a theory framework of valuation elements that will be used to obtain PEMEX value. The financial valuation will be determined and studied through two approaches: Discounted Cash-Flow (DCF) and Multiples. The DCF method uses the present-day value of all distributable cash flows among the company's investors, in other words the financial creditors and shareholders. Revello (2013) defines this method in two fundamentals: the first refers to the flows that occur between the company and its environment are transferred to investors, in other words the company and its environment are identified with investors and their investment. While the second base reflects the value of a company composed of the value of the assets and liabilities of use, linked to the daily business activity, and the value of all those extra-functional assets or liabilities that can be separated and sold at market value without harming the ordinary course. The second approach, valuation by multiples, is based on the comparison between the company to be valued with similar companies of the same industry. Fernández (2008) establishes that once the valuation was done by DCF, the comparison with multiples allows to calibrate the valuation made by identifying the differences between the companies mentioned.
The second part studies the possible factors that could improve or decrease the value of the company. Oil volatility will be studied as a crucial factor that could affect the company’s value. Additionally, this movements of prices affect some macroeconomic variables, the reader will be introduced in a methodology that shows the effects that the commodity volatility could have in exports and national income.
The third chapter proposes to the reader different two different models to exemplify the competition in the Oil industry: the Cobweb Model and Stackelberg Oligopoly. The first one explains the strategies that Oil companies may use to increase Oil prices, while the second one shows competition through quantities and the power that leader Oil producers have on the volatility of the prices. This power leads to a possible economic cartel situation, which mainly the biggest producer countries set a level of prices to gain more market share.
The fourth section is highly important for accomplishing the main objectives of the research. It analyses the situation of the Mexican market. This leads to the main motivation of doing this research: PEMEX is a company that has the ability to create considerable cash flows, but special situations like government dependence, high taxes, Labor Union and organized crime are very harmful to the profitability of the company. Additionally, in the search of healing some of these deficiencies, the government propose
9
an energy reform, which positive factors to PEMEX will be studied as well. These factors are centered in an open market, in which Petróleos Mexicanos will combine efforts with other companies to do projects, that due to the national firm’s situation, they could not achieve before. These joint ventures will lead to reach projects in exploration and exploitation that will boost the profitability of PEMEX.
Last section will search for the financial value of Petróleos Mexicanos through DCF and multiples method. One of the biggest challenges of this research is to obtain the value of a company, that is the biggest and most important in its country, the 8th producer in the world, but with negative cash flows and profitability due to high taxes and exposure to organized crime. An alternative DCF method is introduced based on optimistic, but realistic assumptions thanks to the energy law reform. This last method will show the financial value of PEMEX. Finally, multiples model will act as a support of the DCF valuation.

10
1. CONCEPTS ABOUT VALUATION In this chapter, the reader is presented with the basic concepts that explain the valuation of companies. With the goal of meeting the proposed objectives of the research, firstly, the Discounted-Cash Flow method will be explained (DCF), then the valuation by multiples is going to be studied. In order to carry out research on the valuation of a company of nature such as that of Pemex, it is necessary to include an empirical deductive study. This kind of analysis has the main objective to determine the following variables: Discounted Cash Flows, growth, residual or terminal value, WACC, Debt, Equity, Cost of Debt, Cost of Equity, Working Capital, Working Capital Requirements, EBIT, Net Income, Net Present Value and the Multiple of EBITDA.
1.1 Discounted-Cash Flow Method: This methodology is considered as one of the most efficient and technical to perform the valuation of a company, because as it provides information about the capacity of the company to generate cash flows during the period of the project, at the value of today. This way, the DCF method allows us to study the fundamentals of the business, that is what the operation of the business actually can generate in terms of value and profitability. The Discounted Cash Flow method (DCF) finds its foundation in two pillars: the flows produced and the composition of the Enterprise Value (EV). The first refers to the identification of the company with the investors and their investments, through the transfer of the flows created by the enterprise to the stockholder1. The second pillar is equivalent to the sum between assets (liabilities) related to the ordinary business activity and assets (liabilities) that could be settled at market value without harming company’s daily activity (Revello, 2013). Birgham and Ehrhardt (2015) mention that this methodology is identified with the valuation of a business, which life is unlimited or it trends to infinity, by calculating the Free Cash Flows (FCF) and bring them to a present state. With this premise, in order not to maintain an infinite rhythm of discounting flows, a time horizon is established to be able to obtain a residual value (equation 1.1) that will capitalize perpetual income with constant "g" growth. The aforementioned ideas lead to the direct relation that DCF method has with the way a typical investment project is valued.
𝑅𝑒𝑠𝑖𝑑𝑢𝑎𝑙 𝑣𝑎𝑙𝑢𝑒 = 𝐶𝐹𝑛 ∗1+𝑔
𝑊𝐴𝐶𝐶−𝑔 (1.1)2
1 Other way to represent the first pillar is the fact that the shareholder has all the cash flow minus the net financial burden of taxes and the changes (positive or negative) of the principal of the debt. 2 In order to valuate a company, a discount rate may be used instead of WACC.
11
Where 𝐶𝐹𝑛 represents the Cash Flow at last period of established time horizon. Variable "𝑔" is equal to the expected growth the company will have thanks to an investment or an improvement in comparative or competitive advantages. Variable 𝑊𝐴𝐶𝐶 refers to the Weighted Average Cost of Capital, which is the Weighted average cost of the resources related with financial debt and equity resources (Sabal, 2009). Other authors like Stubelj, Dolenc and Jerman (2012) define WACC as a rate of return for investors that invest in debt or capital, besides it is identified with the risk incurred by the organization and market situations.
In accordance with Koller, Goedhart and Wessels (2015) the Weighted Average Cost of Capital founds its bases in the following equation:
𝑊𝐴𝐶𝐶 = 𝑘𝑑 (1 − 𝑡𝑥)𝐷
𝐷+𝐸+ 𝑘𝑒 ∗
𝐸
𝐷+𝐸 (1.2)
Where variable “𝐷” is the long-term debt and short-term debt as a whole. "𝐸" found its origins in the product between the number of shares the company has and the price per share, while 𝑡𝑥 is the corporate tax rate. 𝑘𝑑 and 𝑘𝑒 are referred to cost of debt and cost of equity (or return required by shareholders), respectively (see equations 1.3 and 1.4).
𝑘𝑑 =𝑓𝑖𝑛𝑎𝑛𝑐𝑖𝑎𝑙 𝑒𝑥𝑝𝑒𝑛𝑠𝑒𝑠
𝐷 (1.3)
𝑘𝑒 = 𝑟𝑓 + (𝑟𝑚 − 𝑟𝑓)𝛽 (1.4)
Breaking down the 𝑘𝑑 equation, it is shown that when the firm acquires current debt in order to search for more profitability (or in some cases to heal the financial situation, like being near bankruptcy), it should pay an effective rate, this is the case for the cost of debt. Mascareñas (2008) approaches the cost of equity as the minimum performance rate that allows the company to face the cost of the financial resources, which are basically to carry out the investment. In that way, is the minimum point in which the company, investors or shareholders should receive in order to get a certain level of profitability. Regarding the cost of equity, it is built up by the risk-free interest rate (𝑟𝑓), the market
premium (𝑟𝑚 − 𝑟𝑓) and the company risk compared with the market (𝛽)3. It is important
to mention the lector that if the company is quoted in the financial markets, the valuator should use the 𝛽 provided by the enterprise, but if it is not listed in any stock exchange, then a 𝛽 of a peer or similar company may be used with the objective of valuate the firm. For research purposes, the Discounted Cash Flow valuation that the document will follow is the methodology proposed by Damodaran (2012). A first step is related to the determination of the working capital (equation 1.5) and working capital requirement (which start in the first forecasted year, and it is represented by the equation 1.8).
3 The 𝑟𝑓 is the rate that an investor may obtain if he invests in high investment grade instruments, such as
government bonds.

12
𝑊. 𝐶. = 𝐼𝑛𝑣𝑒𝑛𝑡𝑜𝑟𝑖𝑒𝑠 + 𝐴𝑐𝑐𝑜𝑢𝑛𝑡𝑠 𝑅𝑒𝑐𝑒𝑖𝑣𝑎𝑏𝑙𝑒𝑠 + 𝐶𝑎𝑠ℎ − 𝐴𝑐𝑐𝑜𝑢𝑛𝑡𝑠 𝑃𝑎𝑦𝑎𝑏𝑙𝑒𝑠 (1.5) To estimate the working capital for the forecasted periods, it is necessary to calculate the proportion that it has from the revenues of the present year, as a starting point (see equation 1.6). The following step, is to take in consideration this calculated proportion (which will remain constant for all the periods) and multiply it by the forecasted revenues from each of the forecasted periods (equation 1.7).
𝑊𝑜𝑟𝑘𝑖𝑛𝑔 𝐶𝑎𝑝𝑖𝑡𝑎𝑙 𝑡
𝑅𝑒𝑣𝑒𝑛𝑢𝑒𝑠𝑡 (1.6)
𝑊. 𝐶.𝑡+1 =𝑊𝑜𝑟𝑘𝑖𝑛𝑔 𝐶𝑎𝑝𝑖𝑡𝑎𝑙 𝑡
𝑅𝑒𝑣𝑒𝑛𝑢𝑒𝑠𝑡∗ 𝑅𝑒𝑣𝑒𝑛𝑢𝑒𝑠𝑡+1 (1.7)
𝑊𝑜𝑟𝑘𝑖𝑛𝑔 𝐶𝑎𝑝𝑖𝑡𝑎𝑙 𝑅𝑒𝑞𝑢𝑖𝑟𝑒𝑚𝑒𝑛𝑡𝑡+1 = 𝑊. 𝐶.𝑡− 𝑊. 𝐶.𝑡+1 (1.8)4
The next step is related to the Profit and Losses account, which calculating the proportions that Cost of Sales, Personnel Expenses and Other costs have among the revenues. Then each forecasted figure will be multiplied by the revenues forecasted. After forecasting the previous accounts, and considering the constant depreciation, the EBIT (and forecasted figure) that is produced by the firm may be obtained through the next equation5.
𝐸𝐵𝐼𝑇 = 𝑅𝑒𝑣𝑒𝑛𝑢𝑒𝑠 − 𝐶. 𝑜𝑓 𝑆𝑎𝑙𝑒𝑠 − 𝑃. 𝑎𝑛𝑑 𝑜𝑡ℎ𝑒𝑟 𝑂𝑝. 𝑒𝑥𝑝𝑒𝑛𝑠𝑒𝑠 − 𝐷𝑒𝑝𝑟𝑒𝑐𝑖𝑎𝑡𝑖𝑜𝑛 (1.9)6 Having calculated the EBIT, the next phase in the process is to obtain the Net Income, which is calculated by taking off the financial expenses (that will lead to gross profit) and taxes (see equation 1.10). The taxation figure will depend on the corporate rate applied con each country and / or industry.
𝑁𝑒𝑡 𝐼𝑛𝑐𝑜𝑚𝑒 = 𝐸𝐵𝐼𝑇 − 𝐹𝑖𝑛𝑎𝑛𝑐𝑖𝑎𝑙 𝐸𝑥𝑝𝑒𝑛𝑠𝑒𝑠 − 𝑡𝑥 (1.10)
To be able to continue with the valuation process, the following main stage is to determine the cash flows, in order to proceed with the calculation of the residual or terminal value (recently commented). The cash flow figures come from EBIT less a set of variables, these are: 𝑡𝑥 ∗ 𝐸𝐵𝐼𝑇, Depreciation, Capital Expenditure and Working Capital Requirement7.
4 Where 𝑡 + 1 is the first forecasted period. The Working Capital Requirements for the following periods will
use the same formula applied for the corresponding years. 5 Where EBIT refers to Earnings Before Interests and Tax. 6 C. of sales equals to Cost of Sales, P. refers to Personnel Expenses and Op. has the meaning of Operating expenses. 7 Capital Expenditure is also known as CAPEX, it refers to the expenses that the firm has related to improve assets in the company. For example: properties and equipment.

13
After the cash flows are determined, then it is possible to obtain the residual value through the use of the equation 1.1, with the objective of calculate the Free Cash Flows. These cash flows will remain the same as the obtained in the recent step, with the exception of the last one, which will be calculated as follows:
𝐹𝐶𝐹𝑛 = 𝐶𝐹𝑛 + 𝑅𝑒𝑠𝑖𝑑𝑢𝑎𝑙 𝑣𝑎𝑙𝑢𝑒 (1.11)
As a final stage, the Net Present Value (NPV) is calculated using the whole Free Cash Flows, with the goal of resting the debt of it and having as a result the firm’s valuation. This last section is explained mathematically through the next two equations:
𝑁𝑃𝑉 = 𝐹𝐶𝐹0 +𝐹𝐶𝐹1
(1+𝑊𝐴𝐶𝐶)+
𝐹𝐶𝐹2
(1+𝑊𝐴𝐶𝐶)2 + ⋯ +𝐹𝐶𝐹𝑛
(1+𝑊𝐴𝐶𝐶)𝑛 (1.12)
𝑉𝑎𝑙𝑢𝑎𝑡𝑖𝑜𝑛 = 𝑁𝑃𝑉 − 𝐷𝑒𝑏𝑡 (1.13)8
NPV is accompanied by an interest rate, which is the opportunity cost of an investor who decides to carry out the project. Therefore, the interest rate represents the rate that would be obtained through an alternative investment, such as a risk-free asset (Marín and Rubio, 2011). Ross, Westerfield and Jordan (2015) establish that the Corporate Finance theory counts with some other methods of valuating a business. The firm may be valued through two main pillars: based on assets and based on profitability. The first one has three methodologies: by Book Value, Substantial Value and Liquidation value. The second one has two main structures: Discounted Cash Flows (recently explained) and Multiples. For purposes of reaching the main goals of the research, the profitability measures are analyzed, studied and applied.
1.2 Multiples Valuation This methodology is not considered so technical as difference like de Discounted Cash Flow valuation. Although through this methodology, the operation of the business that will generate cash in the future may not be taken into account, it is important to comment the reader that it is a way to value based on a comparison of peers, which may be used as a complement and support for the Discounted Cash Flow valuation. It is true that it is difficult to found exactly the same comparable peer, all firms have different competitive and comparative advantage, but analyzing the company with competitors of the same size, same industry or same regulation circumstances. According to Schreiner (2007) there are several ways to compare the company with its peers in general terms, those are the following: by diverse multiples (of sales, of EBITDA and EBIT), income through PER ratio and Cash flow using PCF ratio.
8 When the firm has an excess of cash, then it should be added as positive in the equation. If the valuator
wants to figure out the price per share, then he only needs to multiply the figure obtained in the valuation by the number of shares the company has.
14
Other authors like Revello (2013) consider that the company could be valued through two different channels of multiples: of equity and enterprise value. The first one has a wide range of calculation opportunities: Price Per Earnings ratio (PER), Adjusted Price Per Earnings Ratio, Relative PER, Price to Cash Flow ratio for the shareholder, Price to Book Value, Price to Sales ratio, Dividend Yield and Price Earnings to growth ratio. While the second channel utilizes the following options: Enterprise Value (EV) to Sales, EV / EBIT, EV / EBITDA, EV/ Free Cash Flow and EV / Operative Indicator. In order to collaborate to achieve the objectives proposed in the work, a valuation by multiples will be added, in order to give greater support to the valuation carried out by the DCF method. In this way, it is considered a valuation of peers using a multiple of EBITDA. The reason of not considering the option of comparing by Price Per Earnings Ratio (PER), is that the structure, nature and specific problems that Petróleos Mexicanos (PEMEX) are seen reflected in its earnings, therefore it is difficult to compare an oil company that destines all the profits to the State than others that do not9. The valuation process proposed for PEMEX is reflected in the following equations:
𝑀𝑢𝑙𝑡𝑖𝑝𝑙𝑒 𝑜𝑓 𝐸𝐵𝐼𝑇𝐷𝐴 = 𝑀𝑎𝑟𝑘𝑒𝑡 𝐶𝑎𝑝𝑖𝑡𝑎𝑙𝑖𝑧𝑎𝑡𝑖𝑜𝑛+𝐷𝑒𝑏𝑡
𝐸𝐵𝐼𝑇𝐷𝐴 (1.14)10
𝑉𝑎𝑙𝑢𝑎𝑡𝑖𝑜𝑛 = (𝑀𝑢𝑙𝑡𝑖𝑝𝑙𝑒 𝑜𝑓 𝐸𝐵𝐼𝑇𝐷𝐴 ∗ 𝐸𝐵𝐼𝑇𝐷𝐴) − 𝐷𝑒𝑏𝑡 (1.15)
9 The special situations that results on a difficulty to compare PEMEX with its pears through the earnings,
will be presented on the next chapters. 10 The Multiple of EBITDA will reflect data from the peers group.
15
2. VALUE OF AN OIL COMPANY After analyzing the basic valuation theory that will work as a base for doing the valuation of PEMEX, the reader will be introduced in this chapter to compilation of theories that have a direct effect on the value of an Oil Company. Another aspect that will be dealt with in this section is the effects that the price volatility of this commodity has and its repercussions on macroeconomic theory; mainly in national income, exports and monetary policy.
Bhaskaran and Sukumaran (2016) analyze the financial value of oil companies in which, liquidity, a policy of higher dividends paid, Price to Sales ratio, higher cash flows and efficient management of the company are procyclical variables in relation to the creation of the value of the company and the stock. The NPV is fundamental for making financial decisions in a project, as it reflects the current value that can be generated over the years. This measure is basic to be able to carry out the valuation of a company through the Discounted Cash Flow approach (DCF). Although in the practice of the valuation of oil companies, it is essential to obtain the NPV, it is important to mention that due to the price volatility, a focus must be placed on the future price that affects the cash flows. The oil being an inelastic good, at a higher price will have greater cash flows, and vice versa. Baumeister and Kilian (2016) add to the aforementioned that the magnitudes in changes in the price during the present do not impact as the variability of the future price will impact in the valuation, in addition this increase in prices can cause the abandonment of projects. This is the case when the price is not greater than the marginal cost.
The reserves have a direct relationship with the price of oil, the volatility of this commodity, among other factors such as production, explain the changes in these reserves by the oil companies. Authors like McCormack and Vytheeswaran (1998), mention that there are discrepancies in the measures of the reserves, since they do not represent the price cycle, but they are recorded in actual prices. Despite these possible mistakes, reputation is influenced by reserves, as large companies are more traditional and cautious in their measures.
Another element of great importance is reflected in the price of the raw material of this business, the oil. One of the main features is that it has great volatility and can affect financial ratios, the financial markets, economic growth, macroeconomic variables (such as exports) and political stability in certain countries and / or regions.
2.1 Effects of Oil Price Volatility
A factor of transcendence is studied by Osmundsen, Asche, Misund and Mohn (2006), although the production of oil and gas can be moderate over time, is an approximate parameter to measure the size of company studied. Under the assumption that
enterprises are priced at middle cycle prices, the 𝐸𝑉
𝐷𝐴𝐶𝐹 has a countercyclical movement
16
according to the price of the oil11. The reason is that a positive movement in the price of crude has as a consequence, 𝐷𝐴𝐶𝐹 will be inflated, therefore the EV will have an adjustment so that the valuation multiple can remain constant, while expectations will concentrate on that this price change will be of seasonal nature. The reserve also has a positive effect directly on the stock market valuation.
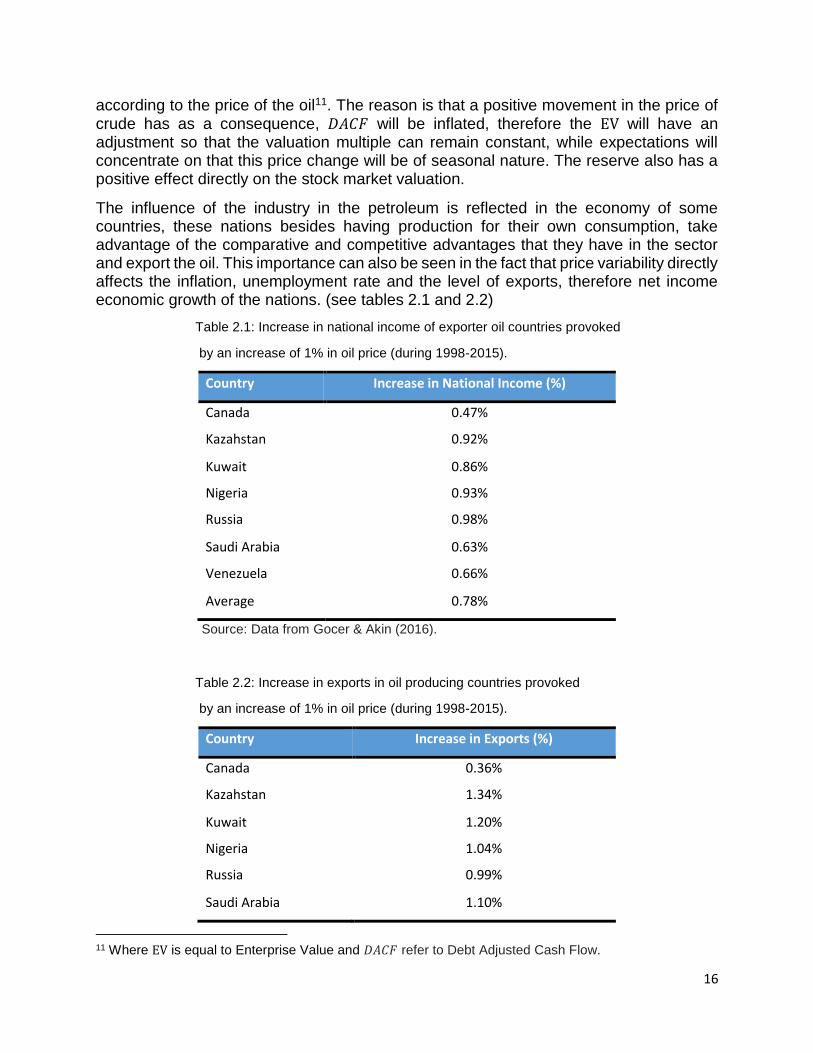
The influence of the industry in the petroleum is reflected in the economy of some countries, these nations besides having production for their own consumption, take advantage of the comparative and competitive advantages that they have in the sector and export the oil. This importance can also be seen in the fact that price variability directly affects the inflation, unemployment rate and the level of exports, therefore net income economic growth of the nations. (see tables 2.1 and 2.2)
Table 2.1: Increase in national income of exporter oil countries provoked
by an increase of 1% in oil price (during 1998-2015).
Country Increase in National Income (%)
Canada 0.47%
Kazahstan 0.92%
Kuwait 0.86%
Nigeria 0.93%
Russia 0.98%
Saudi Arabia 0.63%
Venezuela 0.66%
Average 0.78%
Source: Data from Gocer & Akin (2016).
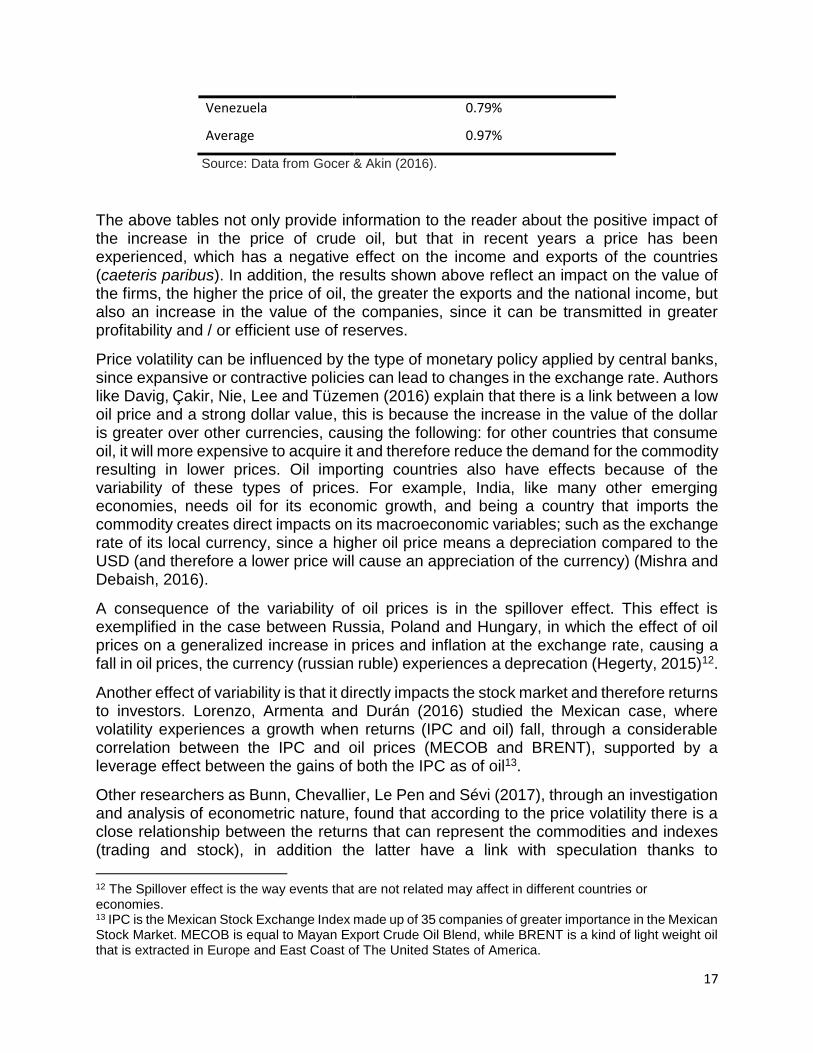
Table 2.2: Increase in exports in oil producing countries provoked
by an increase of 1% in oil price (during 1998-2015).
Country Increase in Exports (%)
Canada 0.36%
Kazahstan 1.34%
Kuwait 1.20%
Nigeria 1.04%
Russia 0.99%
Saudi Arabia 1.10%
11 Where EV is equal to Enterprise Value and 𝐷𝐴𝐶𝐹 refer to Debt Adjusted Cash Flow.
17
Venezuela 0.79%
Average 0.97%
Source: Data from Gocer & Akin (2016).
The above tables not only provide information to the reader about the positive impact of the increase in the price of crude oil, but that in recent years a price has been experienced, which has a negative effect on the income and exports of the countries (caeteris paribus). In addition, the results shown above reflect an impact on the value of the firms, the higher the price of oil, the greater the exports and the national income, but also an increase in the value of the companies, since it can be transmitted in greater profitability and / or efficient use of reserves.
Price volatility can be influenced by the type of monetary policy applied by central banks, since expansive or contractive policies can lead to changes in the exchange rate. Authors like Davig, Çakir, Nie, Lee and Tüzemen (2016) explain that there is a link between a low oil price and a strong dollar value, this is because the increase in the value of the dollar is greater over other currencies, causing the following: for other countries that consume oil, it will more expensive to acquire it and therefore reduce the demand for the commodity resulting in lower prices. Oil importing countries also have effects because of the variability of these types of prices. For example, India, like many other emerging economies, needs oil for its economic growth, and being a country that imports the commodity creates direct impacts on its macroeconomic variables; such as the exchange rate of its local currency, since a higher oil price means a depreciation compared to the USD (and therefore a lower price will cause an appreciation of the currency) (Mishra and Debaish, 2016).
A consequence of the variability of oil prices is in the spillover effect. This effect is exemplified in the case between Russia, Poland and Hungary, in which the effect of oil prices on a generalized increase in prices and inflation at the exchange rate, causing a fall in oil prices, the currency (russian ruble) experiences a deprecation (Hegerty, 2015)12.
Another effect of variability is that it directly impacts the stock market and therefore returns to investors. Lorenzo, Armenta and Durán (2016) studied the Mexican case, where volatility experiences a growth when returns (IPC and oil) fall, through a considerable correlation between the IPC and oil prices (MECOB and BRENT), supported by a leverage effect between the gains of both the IPC as of oil13.
Other researchers as Bunn, Chevallier, Le Pen and Sévi (2017), through an investigation and analysis of econometric nature, found that according to the price volatility there is a close relationship between the returns that can represent the commodities and indexes (trading and stock), in addition the latter have a link with speculation thanks to
12 The Spillover effect is the way events that are not related may affect in different countries or economies. 13 IPC is the Mexican Stock Exchange Index made up of 35 companies of greater importance in the Mexican Stock Market. MECOB is equal to Mayan Export Crude Oil Blend, while BRENT is a kind of light weight oil that is extracted in Europe and East Coast of The United States of America.
18
considerations of "financialization" (represented by a conjecture of oil prices are leaders in the commodity market).
The importance of the sector and price uncertainty, especially in recent years, means that this industry is analyzed through competition through quantities of the main producers (which in turn reflect price consequences), as is done in the next chapter.
19
3. FUTURE EXPECTATIONS OF THE OIL MARKET: The Cobweb Model and Stackelberg Oligopoly
This section of the research proposes to the reader the different ways in which the Oil Market could behave due to the following factors: volatility in the commodity price, market share, market power, differences in competitive and comparative advantage. The previous variables are connected to the Industrial Organization and Economic theory, where the kind of competition experimented in the Oil market is the Stackelberg Oligoply, this kind of oligopoly may lead to collusion among the economic agents and give as a result an economic cartel.
Given the uncertainties and decreases in oil prices over the last few years, market expectations can be exemplified by two economic theories: The Cobweb Model and a competition represented by a Stackelberg Oligopoly (UBS Asset management research, 2015).
3.1 The Cobweb Model
According to Hommes (1994) this model “studies the equilibrium of prices in a market with one lag in supply, it is also known as a bench-mark model, and happens when the supply and demand have a monotonic nature accompanied by price expectations”.
This theory is explained by the activities of the energy firms, which first have to explore, then drill wells to be able to produce oil. If the companies stop harvesting wells thanks to low prices, the following years will be accompanied by a depleted number of wells, resulting in a lower production and supply, therefore an increase in prices (UBS Asset management research, 2015).
The proposed analysis by the UBS Management Research, in which the Oil industry will decrease the commodity wells may be reflected to Petróleos Mexicanos. According to Pemex profile (operating metrics section) in Thomson Reuters Eikon, the number of wells from 2014 to 2015 have shown a fall from the value registered in the balance sheet from $9,077 million of MXN pesos to $8,826 million of MXN pesos, respectively.
Although the Oil markets may have a behavior represented by the Cobweb model, it is highly important to add that the previous figure of wells do not show an increase mainly because of the inefficiencies that the Mexican Oil industry has. For example: the high dependence of Mexican Public Finances on Pemex (that will be mentioned in the chapter number 4) lead to high tax rates, as well the inability to reinvest profits (if they exist), which go directly to the government, provoke a null access to invest in exploration and new wells
3.2 Stackelberg Oligopoly Model
The fundamentals of the Stackelberg model lie under the scenario in which two or more companies compete for quantities rather than prices, assuming that there are leading companies in the market and others of a follower nature.

20
The role of a leading company can come from factors such as market concentration, legal framework and market power. A company with these characteristics is considered as "first mover", since it is the first competitor of the market in deciding the level of production in the industry, giving opportunity to the followers to choose an own optimum level of production (Carlton and Perloff, 2000).
Under the Stackelberg scheme, the leading firm has the advantage of knowing the cost function of the follower companies, so that the reaction function of the latter companies can be intuited and, in this way, an optimum production level can be determined in order to reach the goal of having a profit maximization. In addition to the above, the companies will reach a Nash Equilibrium, assuming rationality (Varian, 2010)14.
The theory of the industrial organization mentions that the companies can realize competitions by means of prices or quantities. According to Sánchez (2015), the Stackelberg model can have three possible scenarios. In the first one each competitor agrees to be leader or follower, reaching Stackelberg equilibrium. In the second scenario, firms want to be followers. Finally, in the third scenario, the two companies want to be leaders. The importance of the third scenario is that companies can form a cooperative oligopolistic structure, in which they can create collusive agreements to fix prices and / or quantities, with the aim of a desired market share or greater profits of their own.
This model reflects competition in various areas of the economy, such as international relations, negotiations, financial industries such as pensions, analysis of benefits for society and companies from mergers and acquisitions, the oil market, among others.
The oil market has a direct effect on the public finances of the oil exporting countries exporting countries of this product. For example: the leader in oil production is Saudi Arabia. "A price of USD $85 / bbl (barrel) is expected to balance the Saudi government budget and therefore it is indicated the medium-term price." Although oil prices are lower than $85 / bbl, several analysts suggest that Saudi Arabia wants to keep or increase its market share and therefore will let prices go down. This downward in prices may give as a result that some competitors, like Canada, will reduce their market share and even could exit the industry. In addition, this market has barriers to entry, such as some high-cost entrants, for example: Brazilian deep water will not enter the market given that demand is expected to grow at a moderate pace " (UBS Asset management research, 2015).
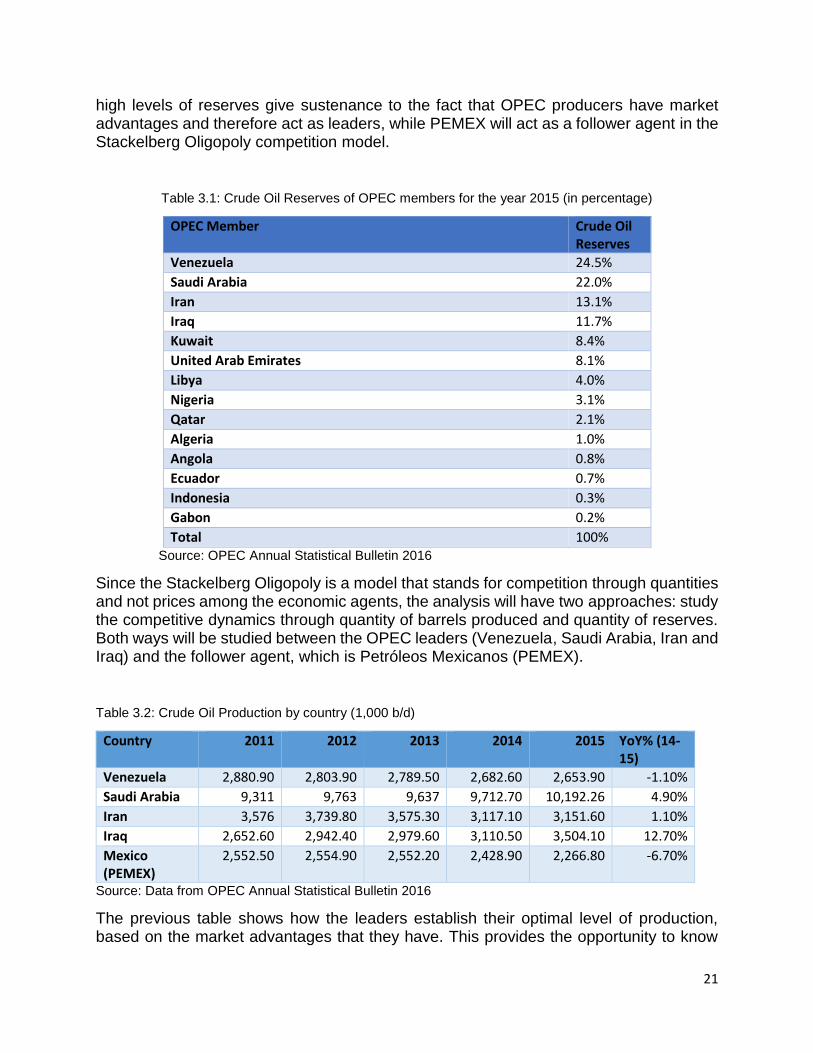
To exemplify this kind of competition, the research proposes to analyze and study the level of production that the leader oil producers (Venezuela, Saudi Arabia, Iran and Iraq) set from year 2011 to 2015 and compare them to the quantity of barrels produces by Petróleos Mexicanos (only oil producer in México during this years).
The reason of choosing the leader oil producers previously mentioned remains on the fact that for year 2015 the Organization of the Petroleum Exporting Countries (OPEC) control the 81% of the share of world crude oil reserves. While Non - OPEC countries only 19% of the market share (OPEC, 2016). Venezuela, Saudi Arabia, Iran and Iraq are the oil exporting countries that lead the market share from the OPEC (see table 3.1). The
14 Nash Equilibrium: When there is a situation in which the whole participants optimized their outcome, based on each participant expected decision.
21
high levels of reserves give sustenance to the fact that OPEC producers have market advantages and therefore act as leaders, while PEMEX will act as a follower agent in the Stackelberg Oligopoly competition model.
Table 3.1: Crude Oil Reserves of OPEC members for the year 2015 (in percentage)
OPEC Member Crude Oil Reserves
Venezuela 24.5%
Saudi Arabia 22.0%
Iran 13.1%
Iraq 11.7%
Kuwait 8.4%
United Arab Emirates 8.1%
Libya 4.0%
Nigeria 3.1%
Qatar 2.1%
Algeria 1.0%
Angola 0.8%
Ecuador 0.7%
Indonesia 0.3%
Gabon 0.2%
Total 100% Source: OPEC Annual Statistical Bulletin 2016
Since the Stackelberg Oligopoly is a model that stands for competition through quantities and not prices among the economic agents, the analysis will have two approaches: study the competitive dynamics through quantity of barrels produced and quantity of reserves. Both ways will be studied between the OPEC leaders (Venezuela, Saudi Arabia, Iran and Iraq) and the follower agent, which is Petróleos Mexicanos (PEMEX).
Table 3.2: Crude Oil Production by country (1,000 b/d)
Country 2011 2012 2013 2014 2015 YoY% (14-15)
Venezuela 2,880.90 2,803.90 2,789.50 2,682.60 2,653.90 -1.10%
Saudi Arabia 9,311 9,763 9,637 9,712.70 10,192.26 4.90%
Iran 3,576 3,739.80 3,575.30 3,117.10 3,151.60 1.10%
Iraq 2,652.60 2,942.40 2,979.60 3,110.50 3,504.10 12.70%
Mexico (PEMEX)
2,552.50 2,554.90 2,552.20 2,428.90 2,266.80 -6.70%
Source: Data from OPEC Annual Statistical Bulletin 2016
The previous table shows how the leaders establish their optimal level of production, based on the market advantages that they have. This provides the opportunity to know

22
the cost function of PEMEX (follower), and then provide a higher production of oil barrels. The only exception of the increasing in production behavior regarding the OPEC countries is Venezuela. In fact, this Latin American country set its production in a decreasing level for the production, but it is important to comment the lector that its oil reserves increased for the same time horizon (see table 3.2). Regarding the follower country, Mexico (represented by PEMEX), show an important decrease of -6.70% from 2014 to 2015. This considerable fall of PEMEX Oil production in production is mainly due to the high costs caused by inefficiencies in the Mexican oil industry, the search to increase the price of the commodity, as well as the low level of reserves (see table 3.2). This effect proves that during this period the Mexican production level depends in a certain way of the quantity of Oil that the leaders (OPEC) will set.
Table 3.3: Proven Crude Oil Reserves (mb)
Country 2011 2012 2013 2014 2015 YoY% (14-15)
Venezuela 297,571 297,735 398,350 299,953 300,878 0.30%
Saudi Arabia 265,405 265,850 265,789 266,578 266,455 0%
Iran 154,580 157,300 157,800 157,530 158,400 0.60%
Iraq 141,350 140,300 144,211 143,069 142,503 -0.40%
Mexico (PEMEX)
11,362 11,424 11,079 9,711 9,711 0%
Source: Data from OPEC Annual Statistical Bulletin 2016
On the other hand, the Crude Oil Reserves for the leader countries show a constant and similar behavior, while México has the same pattern 2014 to 2015, it is important to add that from 2013 to 2014 Venezuela, Iran and Iraq reduce their reserves. The aforementioned action provokes a decrease in Mexican reserves, due to its follower nature (see table 3.3).
There is a great importance in adding to this analysis the behavior of prices (see table 3.4). Since it is a reflection of the effect that the decisions have on the part of the leading countries, being these the levels of production and reserves.
Although this levels in short-term may not be optimal in terms of profitability for OPEC countries, due to lower prices and lower quantities will reflect less profitability. It is important to say that they could be optimal in long-term, in order to keep their market share and even increase it, and therefore the value of this oil companies will increase.
The similar behavior between the OPEC producers and its total dominion on the industry leads to a situation in which they are all leaders. This may provoke an economic situation of a Cartel, in which they could collude to set a level of prices (thanks to all the market advantages and high market share in terms of reserves) that will result positive for them, but not for the whole industry.
This low level of prices could result in a decrease of market share for all the oil producers that do not have the market power of OPEC producers, neither level of reserves. This

23
loss of market can be given by the high costs of the industry and that they do not count with the advantages that OPEC has after behaving like a cartel.
Other way to understand a cartel is by quoting the definition provided by OECD (2000)15: “are anticompetitive agreements by competitors to fix prices, restrict output, submit collusive tenders, or divide or share markets”. Table 3.4: Selected spot crude oil prices ($/b)16
Crude Stream 2011 2012 2013 2014 2015 YoY% (14-15)
WTI 94.99 94.1 97.96 93.26 48.73 -65%
Maya 98.64 99.65 97.31 85.8 44.11 -67%
Brent 11.36 111.62 108.62 99.08 52.41 -64% Source: Data from OPEC Annual Statistical Bulletin 2016
For the Mexican case it is even more difficult, because the system has inefficiencies that the Mexican market has. These special situations, such as the dependence of the Mexican government on PEMEX and the impossibility of the company to reinvest in order to grow through the exploration of new oil fields. The importance of the oil industry to developing economies is fundamental, whether they are exporters or importers. The Mexican case represents great challenges for the country, since before a poor petroleum system and the great dependence of the government towards PEMEX have generated an energy reform, same as before the variations in the price of petroleum (downward in the most recent years) may affect the expected results, this case will be studied in the next chapter.
15 OECD is the Organization for Economic Cooperation and Development. 16 WTI is the selected spot crude oil price for the United States market, while Maya makes reference to Mexican market and Brent to United Kingdom Market. WTI and Brent are the most used prices regarding Oil industry.

24
4. OIL IN MEXICO In this chapter, the reader is introduced to the Oil market situation in Mexico. It begins with a general idea of the history of Petróleos Mexicanos in hand with how it works. Main opportunity areas or deficiencies are developed; like the labor union effects, government dependence to PEMEX and organized crime. In order to heal the Mexican Oil market, the government approved a change in energy laws, this reform and possible consequences will be explained to the reader, as well.
Oil is a determining factor for Mexico, in terms of exports and imports, technological and industrial development, financial markets (as explained in the chapter) and the economy in general. At the beginning of the 20th century, Mexico had an open oil industry, in which there were about one hundred companies dedicated to this market. It was until 1938 that Petróleos Mexicanos (PEMEX) was founded as a result of a confrontation between the Oil Workers' Union and foreign companies, which unleashed a chapter of great importance for Mexican history and economy, the decree of the oil expropriation.
Nowadays PEMEX has an organization to be able to fulfill the national and international energy satisfactions through the trade. The company is made up of four subsidiaries: Refining, Gas and Basic Petrochemicals, Exploration and Production, and finally Petrochemical. The first subsidiary is fully dedicated to the industrial processes of refining, elaboration of petroleum products and petroleum products, distribution, storage and sale first hand, including the contracts related to private investors (by franchise), which search for the establishment and operation of service stations. PEMEX Gas and Basic Petrochemicals is the subsidiary in charge of processing, transporting and the commercialization of gas, hydrocarbons and ethane. The third subsidiary functions as the main actor in the search for an increase of reserves, through the exploration, exploitation, storage and commercialization. Lastly, PEMEX Petrochemical stands as a supplier of enterprises fully dedicated to the plastic, synthetics and refrigerants production. The synergy of the sectors just mentioned result in the route used by PEMEX to carry out its economic activities and business, which is based on the following seven stages:
a) Exploration, drilling, extraction and treatment.
b) Transportation to refineries or ports of embarkation.
c) Refining of crude oil.
d) Storage and transportation.
e) First-hand sales.
f) Distribution.
g) Commercialization (franchises).
4.1 Government dependence from Pemex
Article 27 of the Constitution of the United Mexican States represents that PEMEX, besides being a state-owned enterprise (owned by the government), is also owned by all
25
Mexicans. The main way to repay this property to the population is through the public services provided by the Mexican government (although the taxpayers already make their contributions for this purpose). The principal problem with public finances is the deficit in which they are, and thanks to this situation, the state seeks various forms of financing, such as public debt (most of the Mexican debt is domestic) and through taxes. PEMEX being the largest Mexican company, the State uses a tax burden to obtain resources, it is important to mention that it not only taxes the company, but also obtains the profits it can generate. This tax burden reflects the high importance that Oil income represents to the Mexican budgetary revenue, being 30% of it (Secretaria de Hacienda y Crédito Público, 2013).
In reference to PEMEX, its tax base is exempt from certain taxes such as the tax on assets (IMPAC) and income tax (ISR) and is made up of the following taxes: income tax (IRP), which is equivalent to Income tax since it is calculated using the same methodology; the right to the extraction of oil (DEP) refers to the objective of generating a return to the population thanks to the benefit that the company can obtain thanks to the extraction of crude oil; Law on Hydrocarbons (DSH) was established with the purpose of not altering the tax burden; Use of surplus yields, applied when the price of the barrel of oil estimated in the Income Law is lower than the price experienced in the export; and excise tax on production and services (IEPS), which is a consumption tax based on the difference between public prices and the WTI oil price (Ley de Petróleos Mexicanos, 2014)17.
Another important situation is reflected in the study of Vargas (2013), who studies and analyzes the indebtedness of PEMEX and its origins, mentioning that a possible privatization of the oil industry is not related to efficiency and greater competition, but that it is well-known to have political character. The author also adds that the fact that individuals can finance the electric infrastructure and hydrocarbon exploration, production and refining works, means that the government has to cover the cost of investment with its own revenues when the project's sale of goods and services if the cash flow is not sufficient to cover the liabilities or obligations acquired for such development of the project.
Authors like Hernández and Leidenz (2014) support the fact of the high existence of dependence from the Government related to PEMEX. From this point of view the authors focus this influence from the Mexican Tax authorities, this situation guides to the Oil company to center objectives on projects (that are financed) in the short term and not in the long term. For example: Petróleos Mexicanos center the investments in order to take advantage of existing Oil wells, instead of developing new reserves and, explore and research for new Oilfields.
These problems have a direct negative impact on performance, profitability and inability to make investments to improve the company. This situation leads PEMEX to have to resort to large debt levels, which fluctuate around 100 billion USD. The great importance and relationship that the oil sector (and therefore PEMEX) has in the Mexican economy
17 IMPAC, ISR, IRP, DEP, DHS and IEPS are equivalent to the acronyms used for each tax in the
Mexican Tax System, which is composed by “Servicio de Administración Tributaria” (SAT) and SHCP (Secretaria de Hacienda y Crédito Público).

26
is reflected in the research of (Ruíz, 2015), in which he mentions that during 2006 the had a fiscal contribution that surpassed the levels of 70 billion dollars, while in the same year this contribution accounted for 8% of the Mexican Gross Domestic Product (GDP), which is equivalent to 40% of the Mexican government's tax revenues. This strong fiscal burden reflects the impediment to PEMEX to make investments with the objective of being able to create improvements of production, mainly in the petroleum; therefore, it is created a need to export the crude, mainly to the United States of America so that it is treated there to be able to import it to Mexico for final sale. Together with the inability to restore reserves to compensate for the production extracted, the inefficient refining infrastructure is added to make gasolines; and a depletion of the producing fields resulted in a decrease from the year 2000, the company exported USD 3.4 per import USD, while the ratio in 2013 was USD 1.7, showing as result a high import percentage (40%) of gasoline and lubricants to meet the Mexican demand.
Belisario Domínguez Institute (2015) supports some facts previously commented, where the Oil acted as 7% of the GDP during 2015, but in some other years it reached levels of 10%. The importance of Oil industry is also shown in consumption of the primary energy in Mexico, because 88% comes from petroleum.
Low levels of investment for long-term growth, like having more refineries, contribute to the inefficiencies of PEMEX. Huerta (2014) exemplifies with the last constructed refinery in 1979, having only six refineries. Few facilities of this characteristics result in the need to sell cheap Oil and buy expensive petroleum. For example: during the year 2012 exports of crude Oil were the 90% of total Mexican exports, with a value of $ 46,788 million USD dollars. While the imports of petroleum and petrochemical products were of 46,788 million USD dollars18.
Another factor that influences the deficiencies Mexican Oil market is the collective agreement and existing power of the PEMEX Labor Union, managed by Carlos Romero Deschamps. The great magnitude of importance that has de Mexican Oil Union has resulted in excessive expenses for Petróleos Mexicanos. The previous exposed idea is reflected on the high spending the company has on pensions and the excess of labor force working in the firm.
The Mexican pension system experienced a specific evolution in 1995. Pensions for the workers were in charge of the state, but since the Law of Savings for retirement was introduced, pensions are based on individual capitalization accounts. The new system has its foundations in which the worker should do the own contributions from his salary to the account. This account is managed by a figure called AFORE, which are mainly banks or financial institutions, and will invest the money in low risk instruments in order to provide a long-term return for the retirement of the worker (Sánchez, 2015)19.
The new Mexican pension system help to decrease the high government spending. The Pemex Labor Union influenced in a certain way that pensions for Petróleos Mexicanos
18 Although the exports figure is higher than the imported one, it is important to add that the quantity received is less. Therefore, as it is treated petroleum Mexico pays high prices for this product. 19 AFORE (Administradoras de Fondos para el Retiro, in Spanish) makes reference to private companies
that manage the retirement funds.

27
workers is responsibility for Pemex. Therefore, the new system does not apply for the Mexican Oil industry. In this way, according to Thomson Reuters Eikon Pemex Profile (Income Statement) the total pension expenditures are the following: $24,929 million MXN pesos (year 2014); $34,628 million MXN pesos (year 2015) and $23,112 million MXN pesos (year 2016).
Other authors like Victor, Hults and Thruber (2012) take into consideration the negative impact that the Mexican Oil Union has on PEMEX. They justify that the excess of personnel is highly reflected in the inefficiency of the firm. It is calculated that in Petróleos Mexicanos there is five times more employees per refined barrel, than in other oil companies.
Romo (2016) approaches the special labor situation as well. The author mentions that the proportion between PEMEX and “Oil majors” firms is highly disproportionate. This difference is analyzed in terms of income, value and labor force, in other words, Petróleos Mexicanos has more workers but less income than the big Oil companies. The aforementioned situation is exemplified by the comparison between PEMEX and Exxon, the Mexican enterprise has negative income (in certain years) and the double quantity of workers than the United States company has20.
A factor of great importance to consider is the clandestine petrol robbery. In recent years Mexico has suffered a wave and an increase in violence and corruption. This increases also hurt the Mexican Oil industry. The aforementioned is translated to the fact that the clandestine petrol robbery exists, and it is increasing. According to the Mexican Senate (2015) only from 2010 to 2014 the clandestine Oil extraction locations increase in 179%, being these 691 (for the first year) and 4,127 (for the last year). During 2013 the robbery caused economic losses that represented a figure higher than the budget for the Energy Government Departmant. The Mexican Senate research also mentions that the stolen petroleum rose to 5,000 million USD21.
4.2 PEMEX Debt Situation
The situations analyzed through this chapter reflect a difficult vision for PEMEX. The firm not only suffers from deficiencies, but if it may generate gains, then the Tax authorities approach those utilities by taxes. As previously commented the lack of Petróleos Mexicanos autonomy and being the sustenance of the Public Finances, forces the firm to incur in debt. This debt is mainly through bonds and loans (see table 4.1).
The following table shows how the debt of the firm is structured. The PEMEX characteristics of being a state-owned firm and do not list in any stock exchange, translates into two ways of financing: bonds and loans. The first debt alternative represents 91% of total debt, while the second one only 9%.
20 Exxon is the largest Oil company from the publicly traded firms. 21 The Senate research concludes that each two hours the organized crime perforates Oil ducts and extracts the commodity.

28
Table 4.1: PEMEX Debt Structure until June 2, 2017 (figures in USD)22
Debt structure
Number of Issues
Amount Issued Amount Outstanding
Bonds 159 136,620,948,872 91,689,556,622
Loans 15 13,997,291,195 -
Total 174 150,618,240,067 91,689,556,622 Source: Data from Thomson Reuters Eikon tool, PEMEX profile (Debt & Credit).
Graph 4: Bonds Debt Structure categorized by maturity from 2017 to 2041 and beyond (figures in billions USD)23
Source: Obtained directly from Thomson Reuters Eikon tool, PEMEX profile (Debt & Credit).
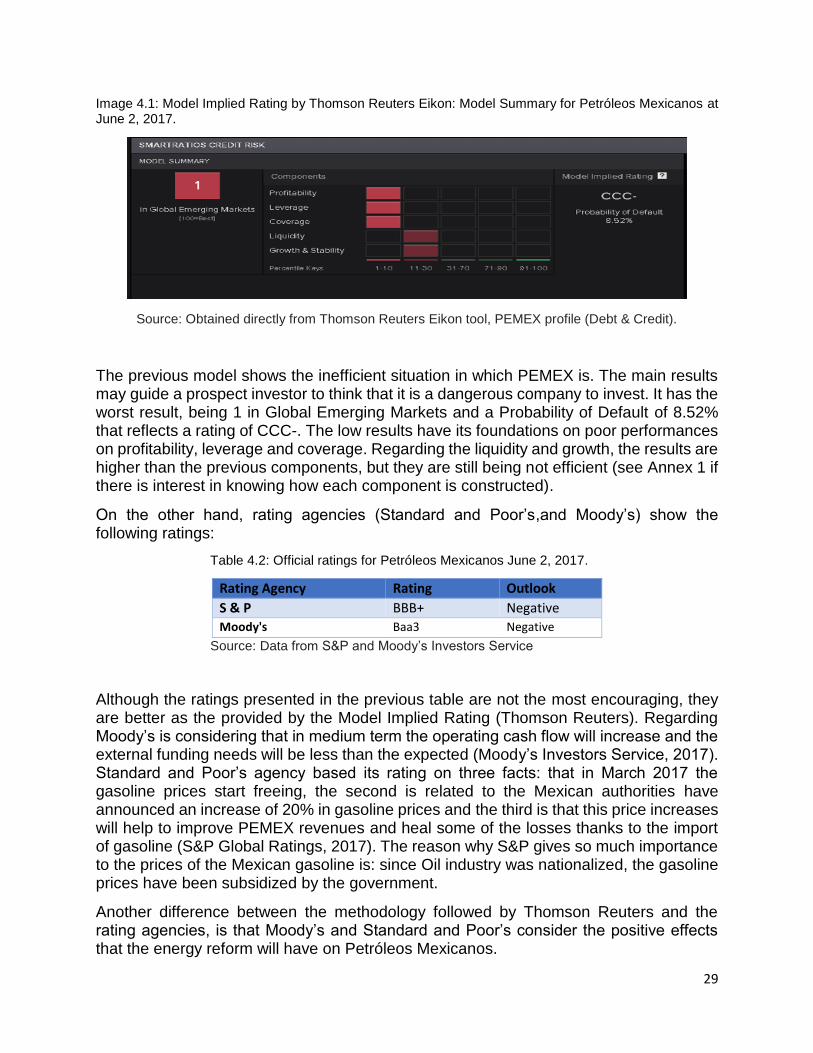
The main topics analyzed previously in this chapter plus the financial status have entangled Petróleos Mexicanos to a special credit situation. This will be analyzed by two different ways: The Model Implied Rating (provided by Thomson Reuters Eikon tool) and the credit ratings that Moody’s and S&P give to the Oil company.
The Model Implied Rating has its foundations on analyzing five components by percentile keys. These are: profitability, leverage, coverage, liquidity and growth – stability. The scale goes from 1 to 100, being 100 the best rating. This methodology also provides the probability of default that PEMEX has.
22 Besides the table information, there are 243 bond issues that are inactive. 23 The Bonds Debt Structure includes subsidiaries.
29
Image 4.1: Model Implied Rating by Thomson Reuters Eikon: Model Summary for Petróleos Mexicanos at June 2, 2017.
Source: Obtained directly from Thomson Reuters Eikon tool, PEMEX profile (Debt & Credit).
The previous model shows the inefficient situation in which PEMEX is. The main results may guide a prospect investor to think that it is a dangerous company to invest. It has the worst result, being 1 in Global Emerging Markets and a Probability of Default of 8.52% that reflects a rating of CCC-. The low results have its foundations on poor performances on profitability, leverage and coverage. Regarding the liquidity and growth, the results are higher than the previous components, but they are still being not efficient (see Annex 1 if there is interest in knowing how each component is constructed).
On the other hand, rating agencies (Standard and Poor’s,and Moody’s) show the following ratings:
Table 4.2: Official ratings for Petróleos Mexicanos June 2, 2017.
Rating Agency Rating Outlook
S & P BBB+ Negative
Moody's Baa3 Negative
Source: Data from S&P and Moody’s Investors Service
Although the ratings presented in the previous table are not the most encouraging, they are better as the provided by the Model Implied Rating (Thomson Reuters). Regarding Moody’s is considering that in medium term the operating cash flow will increase and the external funding needs will be less than the expected (Moody’s Investors Service, 2017). Standard and Poor’s agency based its rating on three facts: that in March 2017 the gasoline prices start freeing, the second is related to the Mexican authorities have announced an increase of 20% in gasoline prices and the third is that this price increases will help to improve PEMEX revenues and heal some of the losses thanks to the import of gasoline (S&P Global Ratings, 2017). The reason why S&P gives so much importance to the prices of the Mexican gasoline is: since Oil industry was nationalized, the gasoline prices have been subsidized by the government.
Another difference between the methodology followed by Thomson Reuters and the rating agencies, is that Moody’s and Standard and Poor’s consider the positive effects that the energy reform will have on Petróleos Mexicanos.
30
4.3 Mexican Energy Reform
The specific characteristics that have been presented to the reader through this chapter, lead to the main reasons of the inefficiencies of the market. Adding the fact that PEMEX, could not take advantage on the nature of the competition (monopoly), to these characteristics result in a poor performance of the company. As been presented, there are too many external factors that affect the value of the Oil company, if there is a high dependence in terms on public finances it will exist a low likelihood to reduce the corporate tax rates applied to the firm. The aforementioned factors have provoked the need to search for new strategies to heal the company’s situation.
These strategies have relapsed in several attempts to reform the Mexican Oil sector. Throughout the last 20 years different federal government administrations try to set the change to energy laws, but it become possible until year December of 201324.
This reform is applied specially for hydrocarbons market, the production and distribution of energy25. For research purposes the reader will only be introduced to the regulation from the Oil industry point of view.
The most important aspect of the reform is that the market and competition are no more based on a monopoly. New companies (national and foreigners) may enter to public contest in order to win a concession. These projects are mainly for Oil exploration and exploitation, in which the Mexican government (through PEMEX) should have at least 20% of participation, by law. Other business lines for the firm are hydrocarbons, petrochemical sector, transportation, storage and distribution, these sectors will be freely opened for new competitors, in which the interested agents will only need the Federal allowance to enter. One of the main advantage that the reform will give to PEMEX is the following: “private companies with the efficient means and experience will explore and produce Oil, this will happen in territories that Petróleos Mexicanos have never been able to do it thanks to all the special factors exposed in the present chapter”. In this way with the minimum state participation requirement, PEMEX will increase their cash flows and therefore its value (Romo, 2016).
The main pillars, in which the regulation is based, are the following: energy content, environmental content and technological content. The first one refers to achieve an efficiency in the market through more accessible exploration and exploitation areas at a low cost. The second pillar tries to improve the environment by transforming the energy sector (increase in renewable energies). Finally, the technological improvement will provoke positive impacts in industries. In this way, competitiveness among all kind of companies will be boosted through lower costs in energy prices. The objective of improve the profitability of all kind of firms may be reflected on the next example: there is a high difference in the energy costs between Mexico and United States, for Mexican companies
24 High different proportion of participation that the Senate and the Chamber of deputies regarding the party represented provoked that the energy reform was not accepted until 2013. During this year the majority of senators and deputies were affiliates to the same party that was ruling in the federal government 25 Energy sector worked as Monopoly until the reform. The government company in charge of providing electricity is CFE (Comisión Federal de Electricidad). Nowadays the industry works as an open market.

31
is 25% higher than the ones for the American firms (Martínez, Santillán and de la Vega, 2016).
Energy reform may be approached from the Government point of view, as well. Some of the main objectives shown in this law are: to boost employment in half million until 2018, and in 2025 two and a half millions of new jobs. In hand with the previous goal, is to have an economic growth of more 1% than the actual digit for 2018, while in 2025 is expected to be nearly 2% more than the actual (Presidencia de la República, 2013).
4.3.1 Effects of the Mexican Energy Reform to Foreign Oil Companies
The oil industry throughout the world can be characterized by having a monopolistic, Stackelberg Oligopoly or Cartel market structure, in which all the related businesses are borne by the state; can have free competition (although barriers to entry because of the high economic and political costs); and a mixed competition in which the industry is open but the national oil company remains state-owned, this is the case of the recent Mexican energy reform. The market opening in industries of this nature influences the value of the companies that comprise it, for example: PEMEX will have bigger partners to achieve projects that require large investments and therefore large flows, such as exploration. Foreign companies can also benefit, as these reforms directly impact the price of the stock and therefore the value of the company. The initiative of this constitutional reform was proposed during August of the year 2013, whereas the approval took place the 11th of December of the same year.
For the purposes of this research, the fluctuations in the share price of four oil companies will be studied: TOTALS.A., Petrobras, Royal Dutch Shell and Ecopetrol, as seen in the following graphs.
Graph 4.1: Historical Close price for TOTAL S.A. Oil Company (TOT) Share. From April 2012 to April 2015, with a daily frequency (data shown in USD)
Source: Data from https://finance.yahoo.com
$-
$10.00
$20.00
$30.00
$40.00
$50.00
$60.00
$70.00
$80.00
TOTAL: Close price

32
Graph 4.2: Historical Close price for Petróleo Brasileiro S.A. Oil Company (PBR-A) Share. From April 2012 to April 2015, with a daily frequency (data shown in USD).
Source: Data from https://finance.yahoo.com
Graph 4.3: Historical Close price for Royal Dutch Shell Oil Company (RDS-B) Share. From April 2012 to April 2015, with a daily frequency (data shown in USD).
Source: Data from https://finance.yahoo.com
$-
$5.00
$10.00
$15.00
$20.00
$25.00
$30.00
Petrobras: Close price
$-
$10.00
$20.00
$30.00
$40.00
$50.00
$60.00
$70.00
$80.00
$90.00
$100.00
Royal Dutch Shell: Close price
33
Graph 4.4: Historical Close price for Ecopetrol S.A. Oil Company (EC) Share. From April 2012 to April 2015, with a daily frequency (data shown in USD).
Source: Data from https://finance.yahoo.com
In order to be able to analyze a possible impact of the energy reform on the stock price in some listed oil companies, the closing prices are exposed in a period of time from April 2012 to April 2013 (to know the historical behavior of these companies see the graphs in graphs 4.1 to 4.4). The methodology to be used is to know if there was a variation in the price of each action, taking as a starting point the data that refers to July 3, 2013 and a second period represented by December 27 of the same year (see table 4.3).
Table 4.3: Price behavior of oil companies in the Mexican energy reform process (data in USD).
Oil company Close price (3-07-13) Close price (27-12-13) Increase / decrease (%)
TOTAL S.A. $48.19 $61.28 27%
Petrobras $13.90 $14.64 5%
Royal Dutch Shell $65.94 $74.82 13%
Ecopetrol $42.02 $38.85 -8%
Peer Average $42.51 $47.39 11%
Source: Data from https://finance.yahoo.com
The foregoing table exemplifies the information in which, in most cases, energy reform in Mexico had a positive impact on stock prices. A "peer average increase / decrease" is
$-
$10.00
$20.00
$30.00
$40.00
$50.00
$60.00
$70.00
$80.00
4/2
/20
12
6/2
/20
12
8/2
/20
12
10
/2/2
01
2
12
/2/2
01
2
2/2
/20
13
4/2
/20
13
6/2
/20
13
8/2
/20
13
10
/2/2
01
3
12
/2/2
01
3
2/2
/20
14
4/2
/20
14
6/2
/20
14
8/2
/20
14
10
/2/2
01
4
12
/2/2
01
4
2/2
/20
15
4/2
/20
15
Títu
lo d
el e
je
Título del eje
Ecopetrol: Close price

34
also proposed, which comes from the average prices of the proposed comparable group, which reflects an increase in prices of 11%. There is a clear difference between TOTAL S.A. - Royal Dutch Shell and Petrobras-Ecopetrol, this one emanates that although they are companies of the same branch, they are of different size and the penetration expectations that they can have in the Mexican market are greater on the part of TOTAL S.A. And Royal Dutch Shell. It is important to mention to the reader that the value of a share in the stock market may respond to other economic and market shocks, such as the economic situation of a country or, in this case, the price of oil and gas26.
26 In the case of Petrobras, during the end of 2015 the corruption scandals and macroeconomic situation in Brazil affected the price of the share. It is important to mention that the positive returns can be effects of market movements, efficient management of the company, the price of oil or the supply and demand of crude oil.
35
5. PEMEX Valuation
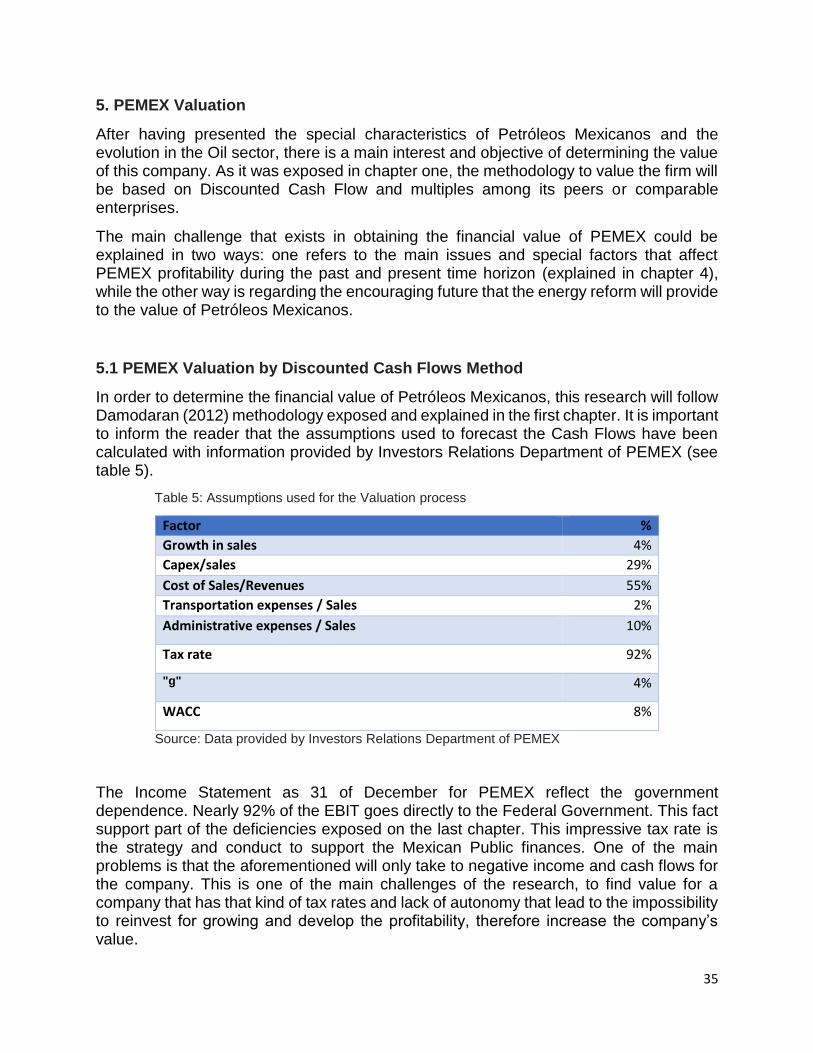
After having presented the special characteristics of Petróleos Mexicanos and the evolution in the Oil sector, there is a main interest and objective of determining the value of this company. As it was exposed in chapter one, the methodology to value the firm will be based on Discounted Cash Flow and multiples among its peers or comparable enterprises.
The main challenge that exists in obtaining the financial value of PEMEX could be explained in two ways: one refers to the main issues and special factors that affect PEMEX profitability during the past and present time horizon (explained in chapter 4), while the other way is regarding the encouraging future that the energy reform will provide to the value of Petróleos Mexicanos.
5.1 PEMEX Valuation by Discounted Cash Flows Method
In order to determine the financial value of Petróleos Mexicanos, this research will follow Damodaran (2012) methodology exposed and explained in the first chapter. It is important to inform the reader that the assumptions used to forecast the Cash Flows have been calculated with information provided by Investors Relations Department of PEMEX (see table 5).
Table 5: Assumptions used for the Valuation process
Factor %
Growth in sales 4%
Capex/sales 29%
Cost of Sales/Revenues 55%
Transportation expenses / Sales 2%
Administrative expenses / Sales 10%
Tax rate 92%
"g" 4%
WACC 8%
Source: Data provided by Investors Relations Department of PEMEX
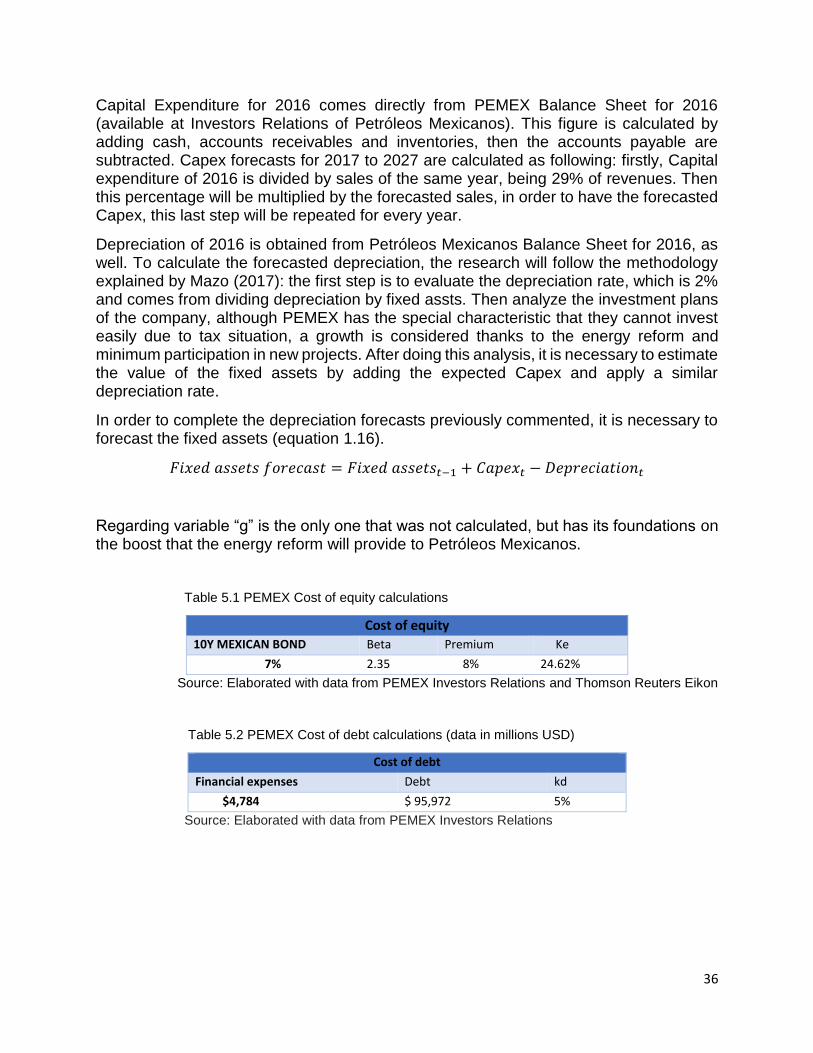
The Income Statement as 31 of December for PEMEX reflect the government dependence. Nearly 92% of the EBIT goes directly to the Federal Government. This fact support part of the deficiencies exposed on the last chapter. This impressive tax rate is the strategy and conduct to support the Mexican Public finances. One of the main problems is that the aforementioned will only take to negative income and cash flows for the company. This is one of the main challenges of the research, to find value for a company that has that kind of tax rates and lack of autonomy that lead to the impossibility to reinvest for growing and develop the profitability, therefore increase the company’s value.
36
Capital Expenditure for 2016 comes directly from PEMEX Balance Sheet for 2016 (available at Investors Relations of Petróleos Mexicanos). This figure is calculated by adding cash, accounts receivables and inventories, then the accounts payable are subtracted. Capex forecasts for 2017 to 2027 are calculated as following: firstly, Capital expenditure of 2016 is divided by sales of the same year, being 29% of revenues. Then this percentage will be multiplied by the forecasted sales, in order to have the forecasted Capex, this last step will be repeated for every year.
Depreciation of 2016 is obtained from Petróleos Mexicanos Balance Sheet for 2016, as well. To calculate the forecasted depreciation, the research will follow the methodology explained by Mazo (2017): the first step is to evaluate the depreciation rate, which is 2% and comes from dividing depreciation by fixed assts. Then analyze the investment plans of the company, although PEMEX has the special characteristic that they cannot invest easily due to tax situation, a growth is considered thanks to the energy reform and minimum participation in new projects. After doing this analysis, it is necessary to estimate the value of the fixed assets by adding the expected Capex and apply a similar depreciation rate.
In order to complete the depreciation forecasts previously commented, it is necessary to forecast the fixed assets (equation 1.16).
𝐹𝑖𝑥𝑒𝑑 𝑎𝑠𝑠𝑒𝑡𝑠 𝑓𝑜𝑟𝑒𝑐𝑎𝑠𝑡 = 𝐹𝑖𝑥𝑒𝑑 𝑎𝑠𝑠𝑒𝑡𝑠𝑡−1 + 𝐶𝑎𝑝𝑒𝑥𝑡 − 𝐷𝑒𝑝𝑟𝑒𝑐𝑖𝑎𝑡𝑖𝑜𝑛𝑡
Regarding variable “g” is the only one that was not calculated, but has its foundations on the boost that the energy reform will provide to Petróleos Mexicanos.
Table 5.1 PEMEX Cost of equity calculations
Cost of equity
10Y MEXICAN BOND Beta Premium Ke
7% 2.35 8% 24.62%
Source: Elaborated with data from PEMEX Investors Relations and Thomson Reuters Eikon
Table 5.2 PEMEX Cost of debt calculations (data in millions USD)
Cost of debt
Financial expenses Debt kd
$4,784 $ 95,972 5%
Source: Elaborated with data from PEMEX Investors Relations

37
Table 5.3 PEMEX Equity (data in millions USD)
Number of shares Price Equity
1,000.00 25 $25,000.00 Source: Elaborated with data from PEMEX Investors Relations
Table 5.4 PEMEX Equity and Debt (data in millions USD)
Debt
D+E
$ 95,972
$120,972.26 Source: Elaborated with data from PEMEX Investors Relations
WACC of 8% is the result obtained when the equation number 1.2 (using the data calculated in the tables 5.1 to 5.4) is applied. Petróleos Mexicanos is a state company that do not lists on any Stock exchange, this fact leads to propose a certain figure for Beta. This variable is of 2.35 and in certain ways measures how risky the company could be; although it is a high value the main assumption to consider this figure is to use the one that represents a peer, Petroleo Brasileiro (PETROBRAS). The reason to choose this comparable is that the Brazilian company was a State-owned company and is fundamental for the economic growth for Brazil, just like the case for Mexico.
Having calculated the WACC; the next step is to forecast the gross income, EBIT, capital expenditure, working capital requirement, terminal value and free cash flows27. These two last variables, are fundamental to know the capacity that PEMEX has to generate value through time.
An important aspect in this section of the process to obtain the financial value of the firm, is that PEMEX reflects high negative cash flows and therefore a negative residual value. By theory a company that generates negative cash flows during the time horizon analyzed will lead to the fact that the company does not have any value.
27 To study how the variables are calculated, the reader must see equations and process explained in
chapter 1.
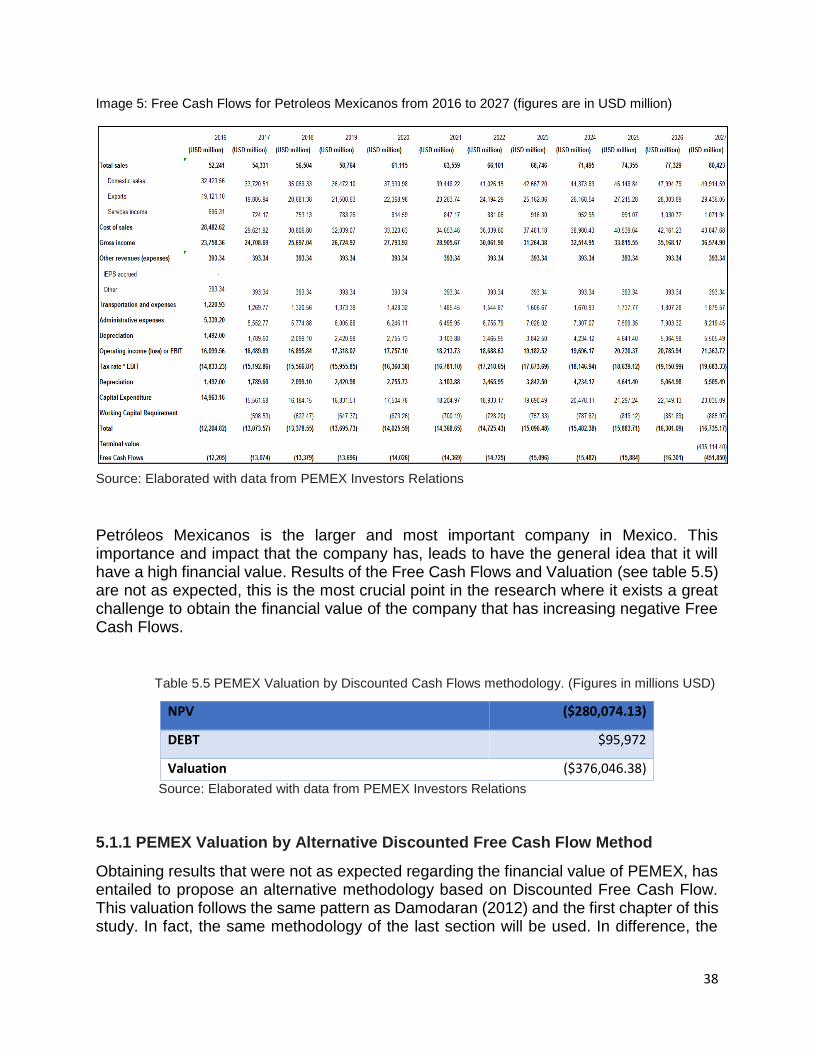
38
Image 5: Free Cash Flows for Petroleos Mexicanos from 2016 to 2027 (figures are in USD million)
Source: Elaborated with data from PEMEX Investors Relations
Petróleos Mexicanos is the larger and most important company in Mexico. This importance and impact that the company has, leads to have the general idea that it will have a high financial value. Results of the Free Cash Flows and Valuation (see table 5.5) are not as expected, this is the most crucial point in the research where it exists a great challenge to obtain the financial value of the company that has increasing negative Free Cash Flows.
Table 5.5 PEMEX Valuation by Discounted Cash Flows methodology. (Figures in millions USD)
NPV ($280,074.13)
DEBT $95,972
Valuation ($376,046.38)
Source: Elaborated with data from PEMEX Investors Relations
5.1.1 PEMEX Valuation by Alternative Discounted Free Cash Flow Method
Obtaining results that were not as expected regarding the financial value of PEMEX, has entailed to propose an alternative methodology based on Discounted Free Cash Flow. This valuation follows the same pattern as Damodaran (2012) and the first chapter of this study. In fact, the same methodology of the last section will be used. In difference, the

39
figures and assumptions will change based on an optimistic scenario and actual situation of the company.
The main issue that provoked the negative results is the great Federal Government dependence and high taxes that tax authorities obtain from Petróleos Mexicanos. The optimistic scenario is based on the assumption that the company will pay only 25% of tax rate for the following ten years28. This tax reduction will allow PEMEX to generate cash and increase the value through time.
Other assumption lies in the fact that Petróleos Mexicanos reduced the transportation and administrative expenses in 14% during the last year (PEMEX Investors Relations, 2017). This fact serves as a support to fix these expenses in a negative rate of 2% for the forecasted figures.
The situation of organized crime studied on the last chapter affect directly to the value of the company. According to PEMEX Investors Relations (2017), this robbery affects in losses of $5,000 million USD. The optimistic scenario will consider that this organized crime situation will decrease and therefore sales will be increasing in 5%. This sales increase is based not only in the assumption of lower levels of robbery, but also in the fact that PEMEX will have more projects in exploration and exploitation of Oil, due to the energy reform.
Variable “g” is considered at 4%, same as the previous valuation, and based on the same foundations of the economic boost Petróleos Mexicanos will face thanks to the energy reform. WACC, as well is calculated with the same methodology of last section, results are the same for this variable (see tables from 5.1 to 5.4).
Table 5.6: Assumptions used for the Valuation process
Assumptions
Factor %
Growth in sales 5%
Capex/sales 29%
Cost of Sales/Revenues 55%
Transportation/ Administrative expenses -2%
Tax rate 25%
"g" 4%
WACC 8%
Source: Elaborated with data provided by Investors Relations Department of PEMEX
28 The limit of the corporate tax rate is 35%, in the optimistic scenario a rate of 25% is proposed due to the
fact that there are Mexican companies that pay that level of rate.
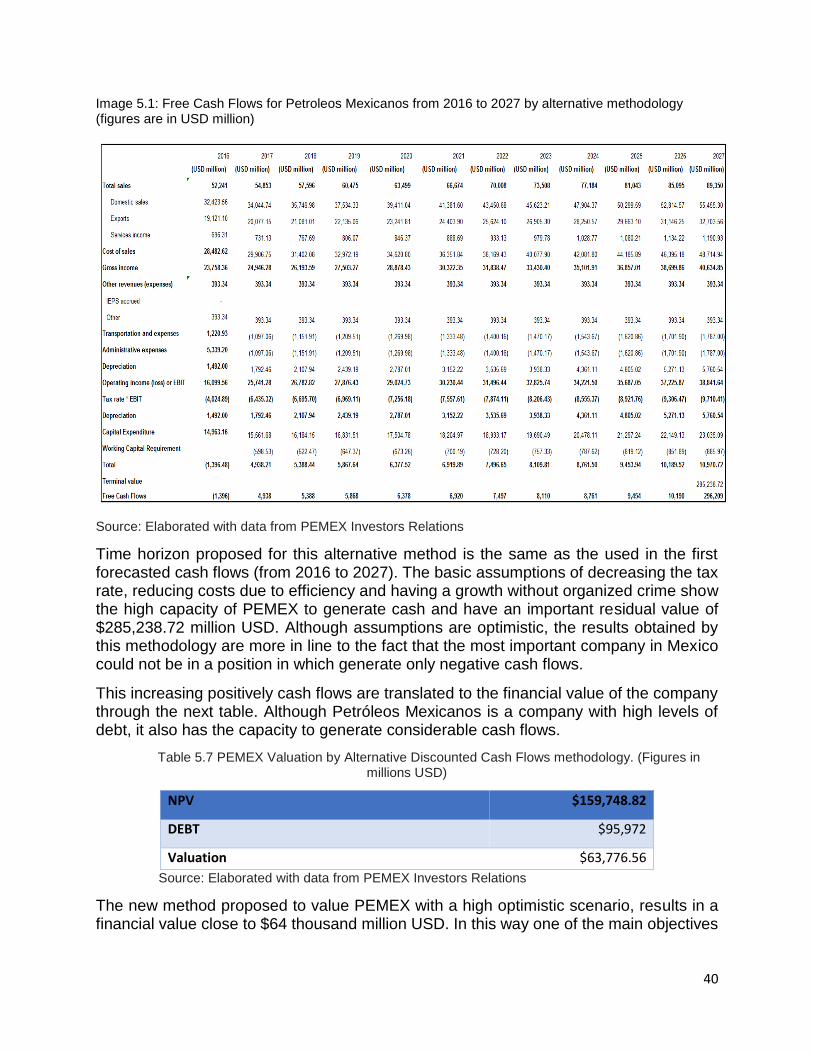
40
Image 5.1: Free Cash Flows for Petroleos Mexicanos from 2016 to 2027 by alternative methodology (figures are in USD million)
Source: Elaborated with data from PEMEX Investors Relations
Time horizon proposed for this alternative method is the same as the used in the first forecasted cash flows (from 2016 to 2027). The basic assumptions of decreasing the tax rate, reducing costs due to efficiency and having a growth without organized crime show the high capacity of PEMEX to generate cash and have an important residual value of $285,238.72 million USD. Although assumptions are optimistic, the results obtained by this methodology are more in line to the fact that the most important company in Mexico could not be in a position in which generate only negative cash flows.
This increasing positively cash flows are translated to the financial value of the company through the next table. Although Petróleos Mexicanos is a company with high levels of debt, it also has the capacity to generate considerable cash flows.
Table 5.7 PEMEX Valuation by Alternative Discounted Cash Flows methodology. (Figures in millions USD)
NPV $159,748.82
DEBT $95,972
Valuation $63,776.56
Source: Elaborated with data from PEMEX Investors Relations
The new method proposed to value PEMEX with a high optimistic scenario, results in a financial value close to $64 thousand million USD. In this way one of the main objectives

41
of the research is accomplished. On the following section, the reader will be introduced to a different approach to value a company, by multiples method.
5.2 PEMEX Valuation by Multiples Method
This approach centers the strategy of valuation in similar companies to Petróleos Mexicanos. The methodology to follow is the one explained in the first chapter of the research and reflected in two main equations (1.14 and 1.15). Special situations of PEMEX explained through all the work, like the high taxes that the firm pays, conduct to the strategy on doing the multiples valuation based on the multiple of EBITDA.
Table 5.8 Peer group for Pemex valuation
Company Name Country of Headquarters
EV/EBITDA
Petroleo Brasileiro SA Petrobras
Brazil 4.91
Marathon Oil Corp United States of America
9.24
Anadarko Petroleum Corp United States of America
11.07
Chevron Corp United States of America
12.48
ConocoPhillips United States of America
13.24
Devon Energy Corp United States of America
10.18
Exxon Mobil Corp United States of America
14.53
Occidental Petroleum Corp United States of America
13.54
Peer Average Brazil and United States
11.15
Source: Thomson Reuters Eikon tool.
Table 5.9: PEMEX Multiples valuation (million USD)
EV/EBITDA
Petróleos Mexicanos 6.46
Valuation 93,810 Source: Elaborated with data from Thomson Reuters Eikon
In terms of the multiples, Petróleos Mexicanos has a lower figure than the average of the peer group. The fact that through this methodology the taxes are not taken into account,

42
valuation results propose a value close to $94 thousand million USD. Valuation between alternative Discounted Cash Flow model is lower than this one, the reason lies in the following: multiples model does not consider the inefficiency of tax situation in PEMEX, while DCF method consider the government dependence in Petróleos Mexicanos.
The “football field valuation chart” technique reflects a range of PEMEX value that goes from 64,000 million USD to 94,000 million USD, according to the alternative DCF and multiples valuation shown in the chapter.
Image 5.2: Football Field Valuation Chart for PEMEX
Source: Elaborated with data from PEMEX Investors Relations and Thomson Reuters

43
Conclusions
Oil companies reflect a procyclical pattern regarding the economic growth, mainly by variables like: liquidity, higher dividends paid, Price to Sales ratio, and cash flows. The influence of the industry in the petroleum is reflected in the economy of some countries, an increase of 1% in Oil price will be traduced in an increase of 0.78% of National income for the average of Canada, Kazahstan, Kuwait, Nigeria, Russia, Saudi Arabia and Venezuela. In the case of exports, for the same countries an increase of 1% in oil prices will increase the exports in 0.97%. The aforementioned concludes that higher prices will improve national income and exports for selected countries.
Oil market is exemplified by two models: The Cobweb Model, in which energy companies center their main business to reduce number of wells and Stackelberg Oligopoly. PEMEX show a decrease in Oil wells in terms of the value in USD from its balance sheet, from $9,077 million of MXN (year 2014) pesos to $8,826 million of MXN pesos (year 2015), but these lower values are related to the fact that PEMEX can’t reinvest and have negative profitability and cash flows, as well. Stackelberg Oligopoly represents the influence the leaders of the market have on the reserves of Oil and quantity produced, in this way they set prices to gain more market share, acting as an economic cartel.
Oil is highly important for the Mexican economy, it acts as 7% of GDP. Low levels of efficiency lead to the need to export cheap Oil, but then import gasoline at higher prices. Labor Union in PEMEX is one of the pillars that provoke high expenses and an expensive pension system, having many more workers than other oil companies (whose profits and cash flows are positive). There are two more facts that affect importantly the financial situation and value of Petróleos Mexicanos, one is the high government and public finances dependence, for example: Oil income represents to the Mexican budgetary revenue a 30% of it. The second one is the $5,000 million USD that are lost yearly thanks to oil robbery by the organized crime.
The government dependence provokes that PEMEX increase the debt structure by bonds and loans, principally to fund short term activities and not long-term projects that will lead to a higher value of the company.
Energy reform opens the market and entail PEMEX to have more projects of exploration and exploitation in hand with other companies that have the means and experience to do it. Other objectives of the law are to boost Mexican economic growth and a decrease in energy costs. Some effects of the reform appear in international markets, where TOTAL S.A. experienced an increase in the stock of 27% only in 5 months, while Royal Dutch shell 13%. This growth in the stock value reflect that these companies have the means to invest hand in hand with PEMEX.
The research reflects that the value of an Oil company, in this case PEMEX, does not only depend on revenues, costs, price volatility of the commodity, debt and cash flows, but also on political and external factors like: public finances dependence, labor union situation, regulation advantages and organized crime.
High tax rates applied to PEMEX result in negative cash flows and therefore in a null value of the firm. Using an alternative DCF method with optimistic assumptions, where
44
tax rates are similar to the ones that are applied to other companies shows a value close to $64,000.00 million USD.
The future research can lead to the study of how Oil companies improve their value through time at an imminent fact that the commodity is a limited resource. Other possible path to study is to determine the sale price of Petróleos Mexicanos, the advantage that regulations may show could not be reflected in the financial statements, therefore the value is different than the price. Other factor that could be studied is the effect to the final consumer caused by mergers and acquisitions of Oil companies. Finally, to study the competition structure, including Oil Companies and through a Generalized Nash-Cournot Stackelberg Equilibirum determine the optimal quantity and price, where the producer maximize the value of the company and the consumer improve its benefit.

45
ANNEX 1: Composition of Model Implied Rating by Thomson Reuters Eikon: Model Summary for Petróleos Mexicanos at June 2, 2017.
Source: Obtained directly from Thomson Reuters Eikon

46
Bibliography: Baskaran, R, & Sukumaran, S. (2016) “An empirical study on the valuation of oil companies”. OPEC & Institute of Management Technology, Dubai International Academic City. John Wiley & Sons. Baumeister, C., & Kilian, L. (2016) “Forty Years of Oil Price Fluctuations: Why the Price of Oil May Still Surprise Us” Journal of Economic Perspectives. Vol (30). Pages: 139-160 Birmingham,E. & Ehrhardt, M. (2015). “Financial Management: Theory and Practice”. 15th edition. Cengage Learning. Carlton, D., & Perloff, J. (2000). Modern Industrial Organization. Addison Wesley Longman. Damodaran, A. (2012) “Investment Valuation: Tools and Techniques for Determining the Value of Any Asset”. 3rd edition. Wiley Finance. Davig, T., Çakir, N., Nie, J., Smith, L., & Tüzemen, D. (2016) “Evaluating a Year of Oil Price Volatility”. FEDERAL RESERVE BANK OF KANSAS CITY. Fernández, P. (2008) 201 errores en la valoración de empresas: Diagnóstico para conocerlos y prevenirlos. Barcelona, España. Deusto. Gocer, I. & Akin, T. (2016). “THE EFFECTS OF FALLING CRUDE OIL PRICES ON MACROECONOMIC PERFORMANCE AND POLITICAL STABILITIES IN THE FIRST SEVEN NET OIL EXPORTERS’ COUNTRIES”. CEA Journal of Economics. Gog, M. (2015). CASE STUDY RESEACH. International Journal of Sales, Retailing and Marketing. Vol. 4 No.9. Hegerty, S. (2015). “Oil-Price Volatility and Macroeconomic Spillovers in Central and Eastern Europe: Evidence from a Multivariate GARCH Model”. Zagreb International Review of Economics & Business. Vol 18, No. 2. Pages: 31-44. Hernández, I., Leidenz,J. (2014). “Pdvsa, Pemex y Petrobras: La tensión entre política y gerencia.” Vol. XIX. Debates IESA. Hommes, C. (1994). “Dynamics of the cobweb model with adaptive expectations and nonlinear supply and demand”. Journal of Economic Behavior and Organization. Vol. 24. P. 315-335. Department of Economic Statistics, University of Amsterdam, Netherlands. Huerta, M.,G. (2014). “PEMEX Y PETROBRAS: HISTORIAS DE GESTIÓN PETROLERA CON RUMBOS DIFERENTES”. Gestión Estratégica. Vol.45. Universidad Autónoma de México.

47
Koller, Goedhart and Wessels (2015). “Valuation: Measuring and Managing the Value of Companies” 6th edition. McKinsey & Company. LEY ORGÁNICA DE PETRÓLEOS MEXICANOS (2014). Diario Oficial de la Federación. Ciudad de México, México. Lorenzo, A., Armenta, L., & Durán, R. (2016). “A COPULA-TGARCH APPROACH OF CONDITIONAL DEPENDENCE BETWEEN OIL PRICE AND STOCK MARKET INDEX: THE CASE OF MEXICO”. Estudios Económicos, vol. 31, Pages: 47-65. Martínez, F., Santillán, M., & de la Vega, A. (2016). “La reforma energética de 2013 /2014 y el desarrollo industrial en México: contenidos, implicaciones y propuestas”. Análisis Económico. Vol. 31 Mazo, M. (2017). “Financial statements estimate” Lecture from Financial Analysis course of Master in Finance. Universidad Pontificia de Comillas. McCormack, J. & Vytheeswaran, J. (1998). “How to use EVA in the Oil and Gas Industry”, Journal of Applied Corporate Finance 11 (3): 109-131. Moody’s Investors Service (2017). “Rating Action: Moody’s affirms PEMEX’S Aa3.mx/Baa3 national and global scale ratings; maintains BCA at b3 and negative outlook”. Available at: http://www.pemex.com/en/investors/debt/Calificacin%20crediticia/Moodys_RA_201704.pdf OPEC (2016). “Annual Statistical Bulletin 2016”. Available at: http://www.opec.org/opec_web/static_files_project/media/downloads/publications/ASB2016.pdf Osmundsen, P., Asche, F., Misund, B., & Mohn, K. (2006). Valuation of International Oil Companies. Energy Journal, Vol. 27. University of Stavanger. PEMEX Investors Relations (2017). “Encuentro con el mercado mexicano”. Available at: http://www.pemex.com/ri/herramientas/Presentaciones%20Archivos/Encuentro%20con%20el%20mercado%20mexicano.pdf PEMEX Investors Relations (2017). “Investor Presentation, May 2017”. Available at: http://www.pemex.com/ri/herramientas/Presentaciones%20Archivos/Investor%20presentation_170523.pdf Petróleos Mexicanos profile at Thomson Reuters Eikon tool. Presidencia de la República (2013). “Iniciativa de la Ley de Hidrocarburos”. Gobierno Federal Mexicano.

48
Ramírez-Cendero, J.M., & Paz, M.J. (2016). Oil fiscal regimes and national oil companies: A comparison between Pemex and Petrobras. Madrid, Spain. Universidad Complutense de Madrid. Revello, J.M. (2013) “Manual de Corporate Finance y Banca de Inversión”. Madrid, Spain. Delta & Instituto de Estudios Bursátiles. Ross, S., Westerfield, R., & Jordan, B. (2015). “Fundamentals of Corporate Finance” 11th edition. Mc Graw Hill. Romo, D. (2016). La situación de Pemex ante el contexto de la apertura de la industria petrolera en México. Análisis Económico, Vol.31. México City, México. Universidad Autónoma Metropolitana. Ruíz, E. (2015). “LAS FLUCTUACIONES EN LOS PRECIOS DEL PETRÓLEO Y SU IMPACTO EN EL CRECIMIENTO ECONÓMICO DE MÉXICO EN EL PERIODO 1995-2014”. Universidad Anáhuac. Facultad de Economía y Negocios. Estado de México, México. S&P Global Ratings (2017). “Liberalization Of Mexico´s Gasoline Prices Will Have A Neutral Credit Impact on Petróleos Mexicanos”. Available at: http://www.pemex.com/en/investors/debt/Calificacin%20crediticia/Liberalization%20of%20prices.pdf Salas-Fumás, V., Rosell-Martínez, J., & Delgado-Gómez, J.M. (2016). Capacity, investment and market power in the economic value of energy firms. Zaragoza, Spain. Universidad de Zaragoza. Sabal, J. (2009). “On the Applicability of WACC for Investment Decisions”. Journal of Globalization, Competitiveness and Governability. Vol. 3. Georgetown University, United States. Sánchez, B. (2015). “COMPETENCIA Y EQUILIBRIO DE MERCADO EN LA INDUSTRIA DE LAS AFORE A PARTIR DE LAS FUSIONES Y ADQUISICIONES”. Universidad Anáhuac. Facultad de Economía y Negocios. Estado de México, México. Secretaria de Hacienda y Crédito Público (2013). “Reportes para el Proyecto de Presupuesto”. Available at: www.shcp.gob.mx Senado de la República (2015). “Robo de hidrocarburos en México”. Dirección General de Análisis Legislativo, Instituto Belisario Domínguez, Senado de la República. LXII Legislatura. Available at: http://www.senado.gob.mx/ibd/content/productos/ml/ML81.pdf Stubelj,I., Dolenc,P., and Jerman,M. (2014). “Estimating WACC for regulated industries on Developing Financial Markets and in Times of Market Uncertainty”. International Research Journal. Vol. 12. P.55-77. University of Primorska, Slovenia.

49
UBS Asset Management Research (2015). “Oil market Dynamics”. Global Asset View Thematic Edition Vargas, J. (2013). “El endeudamiento de Pemex y su rol en las transformaciones mundiales”. Revista de la Realidad Mexicana, Universidad Autónoma Metropolitana. Pages: 69-78. Varian, H. R. (2010). Microeconomía Intermedia: Un enfoque actual. España. Antoni Bosch. Victor, D., Hults,R., and Thurberm,C. (2012). “Oil and governance: state owned enterprises and the world energy supply. Cambridge University Press. Yin, R. K. (2009). Case study research: Design and methods (4th ed.). Thousand Oaks, CA: Sage.