management 183 financial markets equity valuation
TRANSCRIPT

Management 183Financial Markets
Equity Valuation
The Valuation Model
• Approach
a) Cost
b) Income
c) Market
• Method
a) De Novo or M&A
b) Revenues, Earnings, Cash flows
c) Comparables
Concepts of Value
• Book Value
• Market value
• Liquidation Value
• Fair Market Value, Intrinsic Value
a) Market Value - given a thorough appreciation of the Company, its prospects, and the market
b) Look for mispricing
c) Alpha = E(HPR) less Market RRR
The Valuation Process
Some similarities w/ Bond Valuation but several challenging differences
•Similarity: Intrinsic value - the PV of its expected CFs discounted at the appropriate RADR•Differences:Market value – a comparables approach.
Intrinsic Valuation
• Forecast Earnings and Cash Flowsa) Growth ratesb) Dividend payout rate• Model Selection• Discount Ratea) Exogenous or endogenous considerations• Conclusion & Recommendationa) Under or over Valued: Buy, Sell, Hold
Intrinsic Valuation Models
• Intrinsic Value:Intrinsic Value: the present value of a the future cash flows that will accrue to the owner of the asset.
– Return on a stock investment is comprised of cash dividends and capital gains or losses.
– Factors in valuing equities• Magnitude of the cash flows• Timing of those future cash flows• Proper discount rate
Intrinsic Valuation Methods
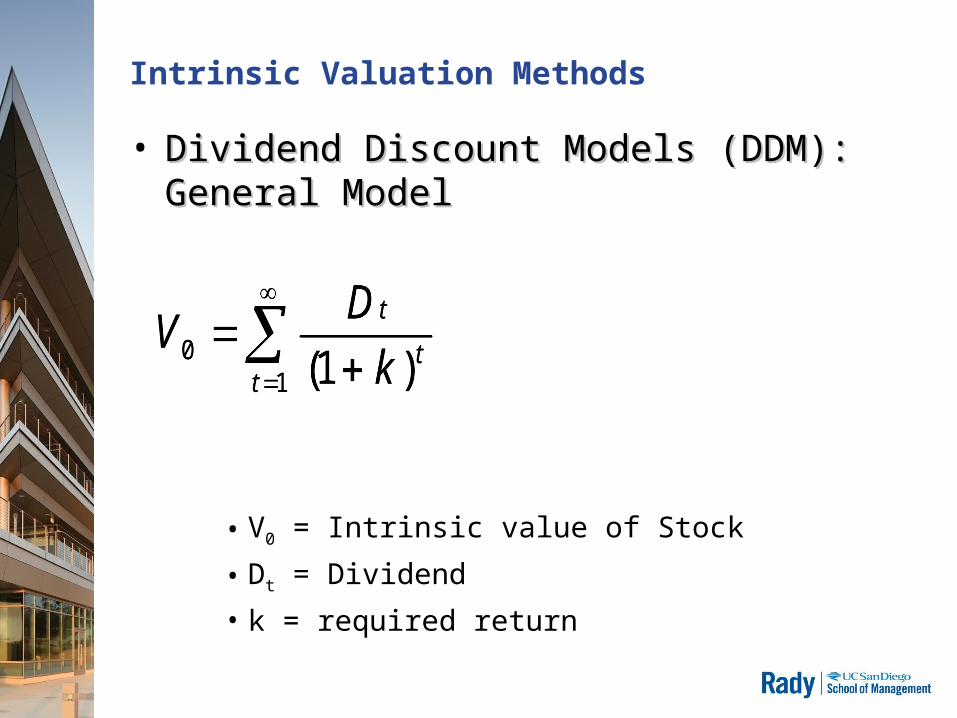
• Dividend Discount Models (DDM): General Dividend Discount Models (DDM): General Model Model
• V0 = Intrinsic value of Stock
• Dt = Dividend• k = required return
10 )1(t
t
t
k
DV
10 )1(t
t
t
k
DV
Intrinsic Valuation Methods
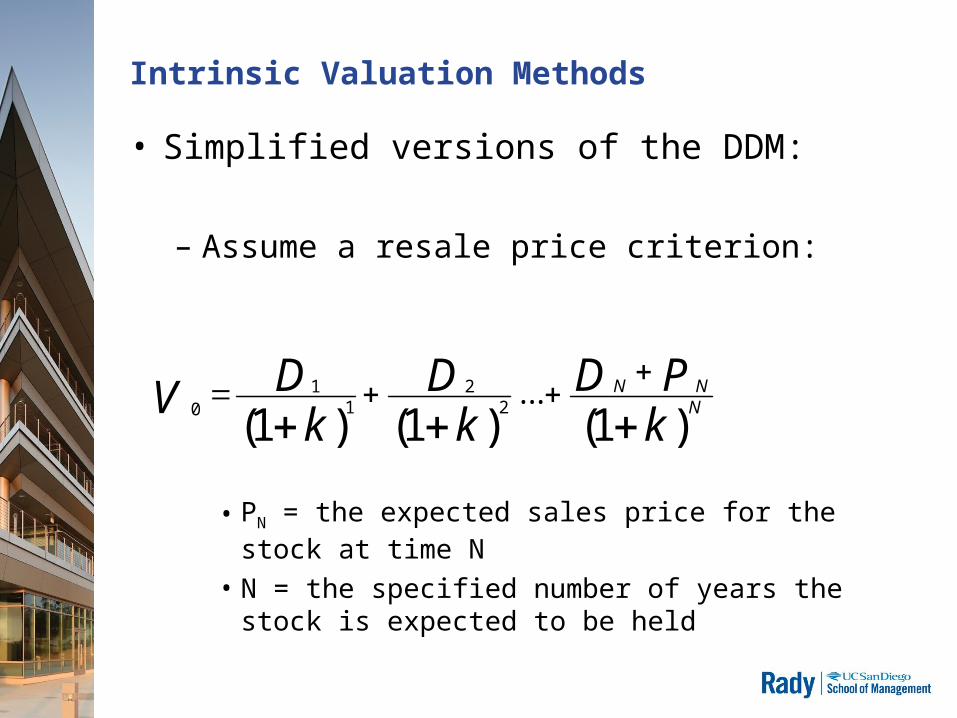
• Simplified versions of the DDM:
– Assume a resale price criterion:
• PN = the expected sales price for the stock at time N• N = the specified number of years the stock is
expected to be held
)1()1()1(...2
21
10
kPD
kD
kDV N
NN
Intrinsic Valuation Methods
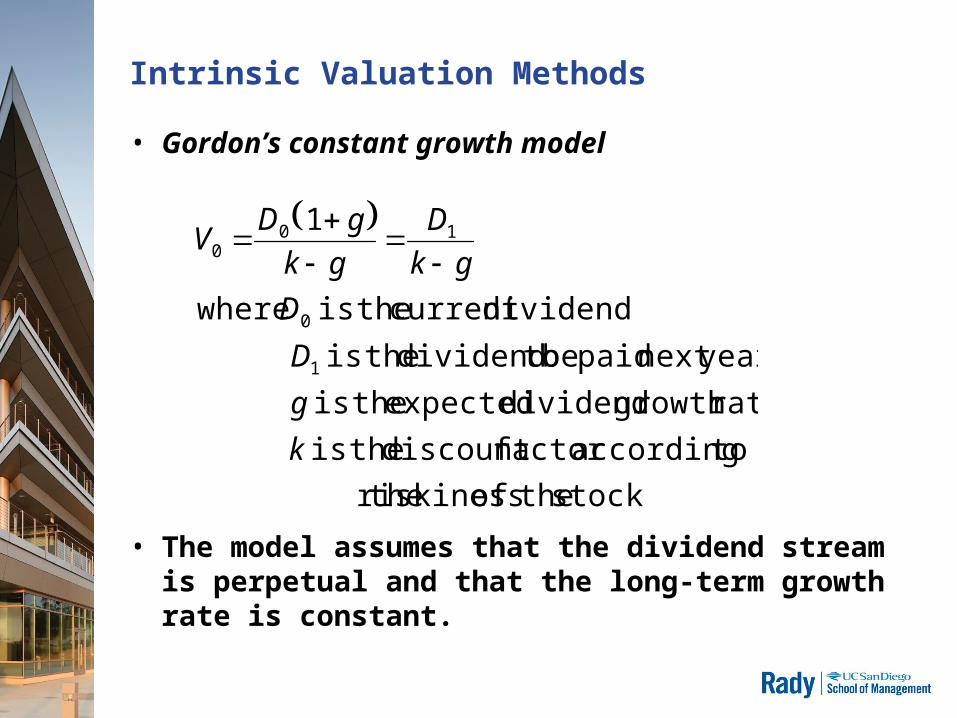
• Gordon’s constant growth model
• The model assumes that the dividend stream is perpetual and that the long-term growth rate is constant.
stock theof riskiness the
toaccordingfactor discount theis
rategrowth dividend expected theis
yearnext paid be todividend theis
dividendcurrent theis where
1
1
0
100
k
g
D
D
gk
D
gk
gDV
Intrinsic Valuation Methods
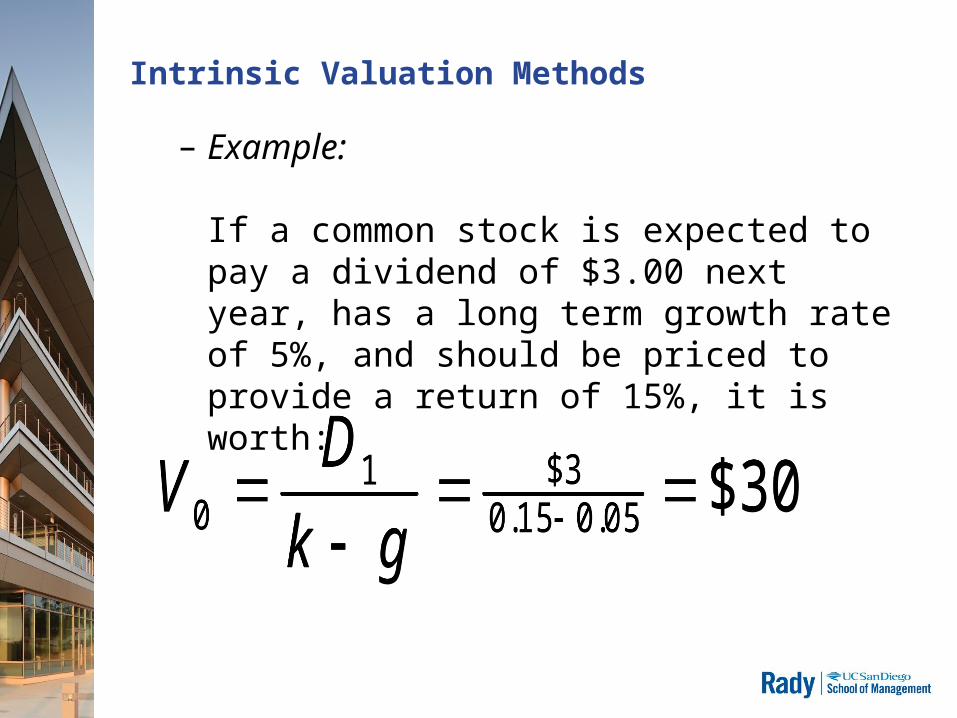
– Example:
If a common stock is expected to pay a dividend of $3.00 next year, has a long term growth rate of 5%, and should be priced to provide a return of 15%, it is worth:
30$0 5.01 5.03$1
0
gk
DV 30$0 5.01 5.0
3$10
gk
DV
Intrinsic Valuation Methods
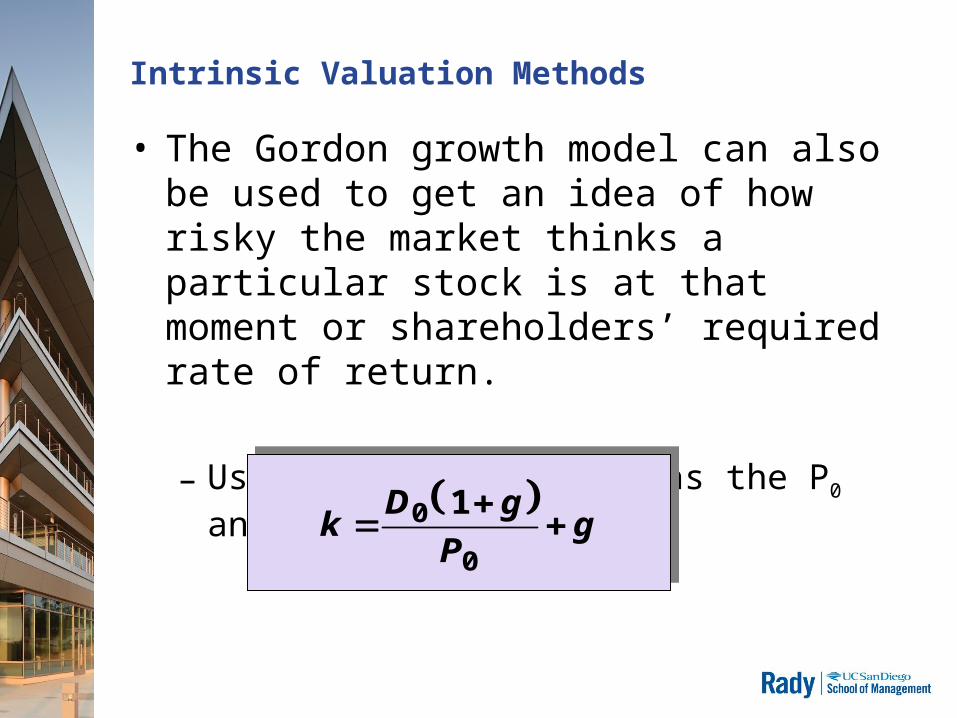
• The Gordon growth model can also be used to get an idea of how risky the market thinks a particular stock is at that moment or shareholders’ required rate of return.
– Use the current price as the P0 and solve for k.
g
P
gDk
0
0 1
Intrinsic Valuation Methods
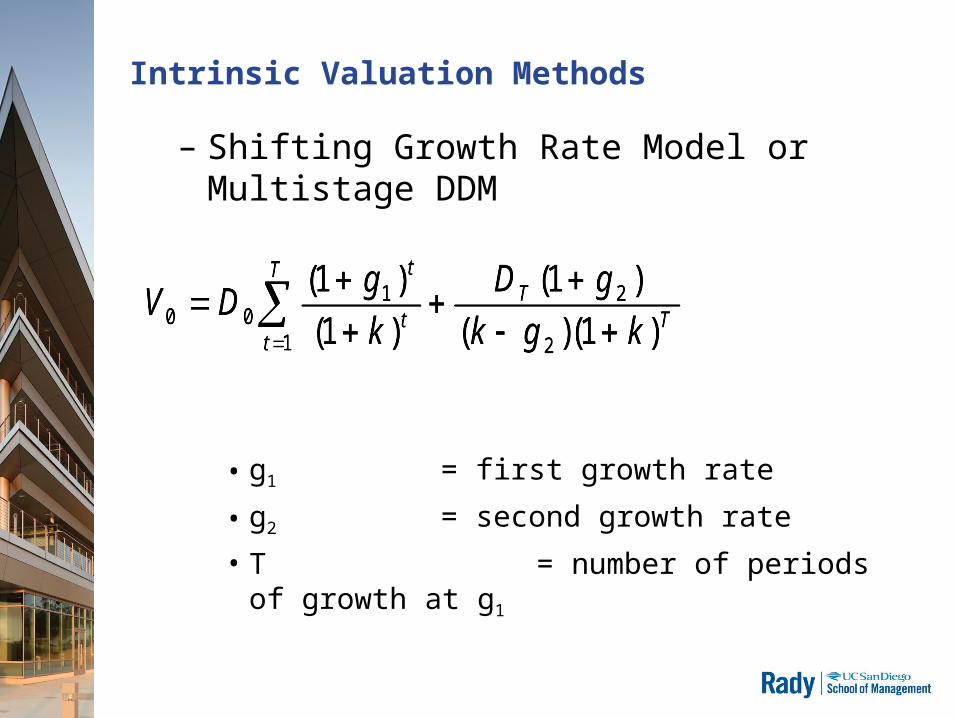
– Shifting Growth Rate Model or Multistage DDM
• g1 = first growth rate
• g2 = second growth rate• T = number of periods of
growth at g1
TT
T
tt
t
kgk
gD
k
gDV
)1)((
)1(
)1(
)1(
2
2
1
100
TT
T
tt
t
kgk
gD
k
gDV
)1)((
)1(
)1(
)1(
2
2
1
100
Intrinsic Valuation Methods
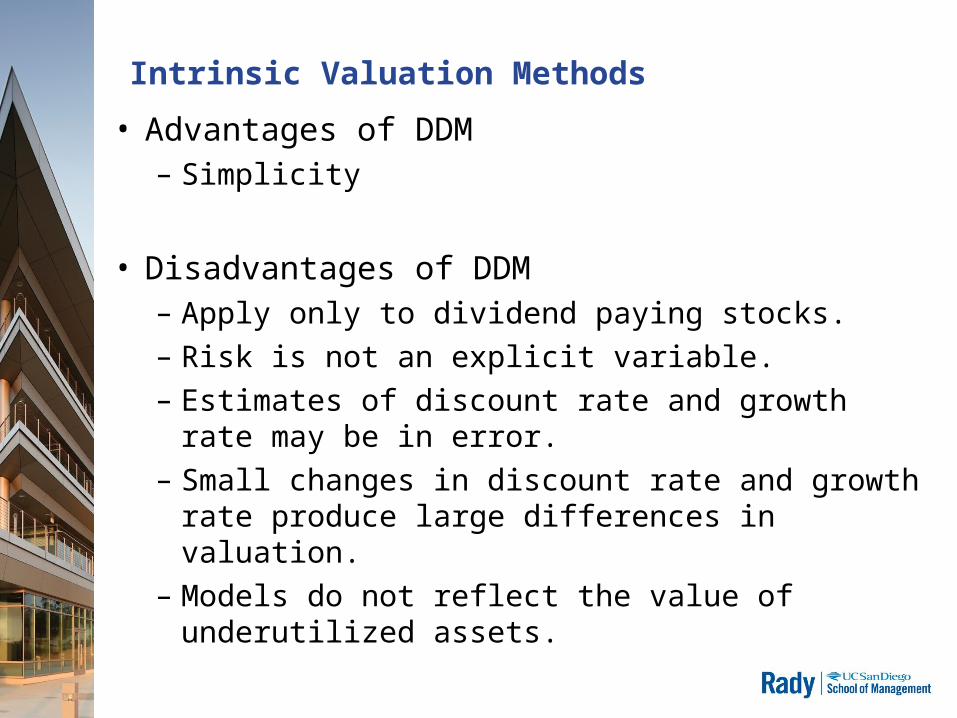
• Advantages of DDM– Simplicity
• Disadvantages of DDM– Apply only to dividend paying stocks.– Risk is not an explicit variable.– Estimates of discount rate and growth rate may be in
error.– Small changes in discount rate and growth rate
produce large differences in valuation.– Models do not reflect the value of underutilized
assets.
Models
• Dividend Discount Model
• D.C.F.
• C.A.P.M.
Discount Rates
• Build-up Method
a) Risk-free Rate +
b) Equity risk premium +
c) Company risk premium
• P/E implied
• C.A.P.M.
a) Risk-free Rate +
b) Non-systematic risk premium
Market Value
• TOP DOWN: Economy, Sector, Industry
• Inherent sector and industry profitability
• Industry structure:
a) Market share, Cost leadership, Pricing power
b) Product differentiation versus product focus• Ratio Analysis and Valuation Multiples• Conclusion & Recommendationa) Under or over Valued: Buy, Sell, Hold

Economy, Sector, Market, Company
• Inherent sector and industry profitability
• Industry structure
• Company’s relative competitive position
a) Market share
b) Cost leadership
c) Pricing power
d) Product differentiation versus product focus

DJIA annual Returns since 2003
2003 8341.63 10453.92 2112.29 25.32%
2004 10453.92 10783.01 329.09 3.15%
2005 10783.01 10717.50 -65.51 -0.61%
2006 10717.50 12463.15 1745.65 16.29%
2007 12463.15 13264.82 801.67 6.43%
2008 13264.82 8776.39 -4488.43 -33.84%
2009 8776.39 10428.05 1651.66 18.82%
2010 10428.05 11577.51 1149.46 11.02%
2011 11577.51 12217.56 640.05 5.53%
2012 12217.56 13104.14 886.58 7.26%
Average 5.95% Standard Deviation 16.02%
Forecasting
• Top-down forecast
a) Economy-Sector-Industry-Company
b) Financial forecast
c) Financial Statement Analysis: revenues & expenses
d) From profits to cash flows, esp. Free Cash Flows
e) Costs, prices, and the Product life cycle
• Value Stocks and Growth Stocks: How to Tell by Looking.
– No precise definition exists.– Low Price-to-Book for Value– High Price-to-Earnings for Growth
Price to Book Ratio
• The price-to-book ratio is computed by dividing the current stock price by the firm’s book value per share.
– Book value per share is an accounting concept synonymous with equity per share or net asset value.
– Share price is not normally equal to book value because of
• depreciation, uncollectible debts, goodwill, etc.• economic obsolescence• intangible assets

Price to Earning Ratio
• The price-earnings ratio (PE) is computed by dividing the current stock price by the firm’s earnings per share.– Trailing PE– Forward PE
– Growth stocks tend to have higher PE ratios than average
Price to Earning Ratio
• The price-earnings ratio (PE) is computed by dividing the current stock price by the firm’s earnings per share.– Trailing PE– Forward PE
– Growth stocks tend to have higher PE ratios than average
Price to Earning’s Growth
– The P/E ratio divided by the company’s growth rate of its earnings for a specified time period.
P/E ratio ÷ Annual EPS Growth– The PEG ratio brings the earnings growth rate into the
valuation process.– A more complete picture than the P/E ratio because,
while a high P/E ratio may make indicate the attractiveness of a stock, by factoring in the company's growth rate can tell a different story.
– The lower the PEG ratio, the more the stock may be undervalued given its earnings performance.
Price to Earning’s Growth
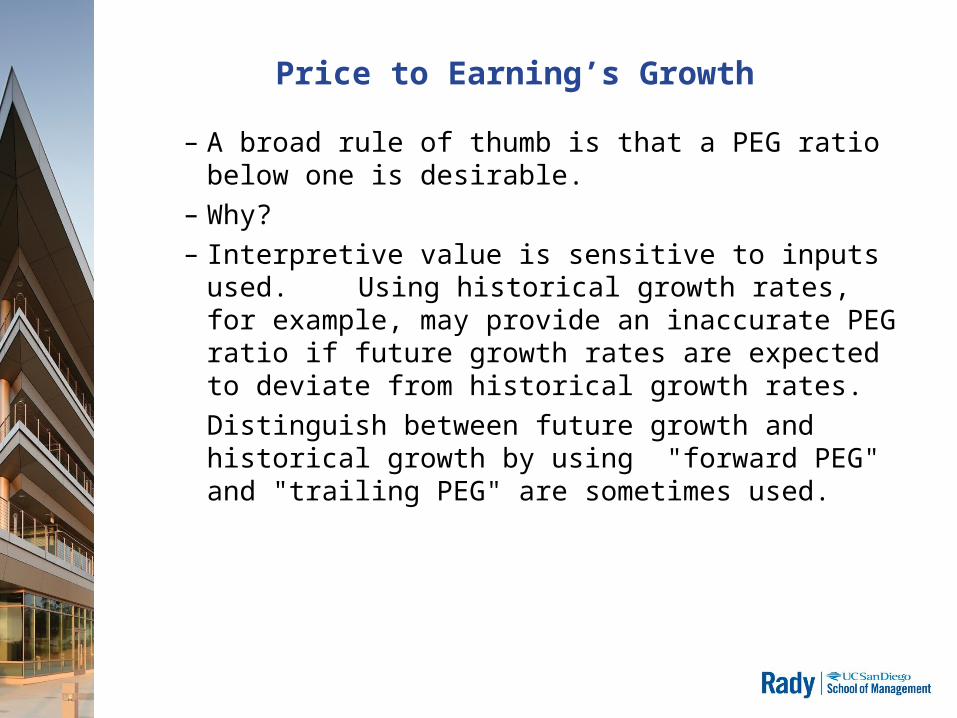
– A broad rule of thumb is that a PEG ratio below one is desirable.
– Why?– Interpretive value is sensitive to inputs used. Using
historical growth rates, for example, may provide an inaccurate PEG ratio if future growth rates are expected to deviate from historical growth rates. Distinguish between future growth and historical growth by using "forward PEG" and "trailing PEG" are sometimes used.
Price to Earning’s Growth
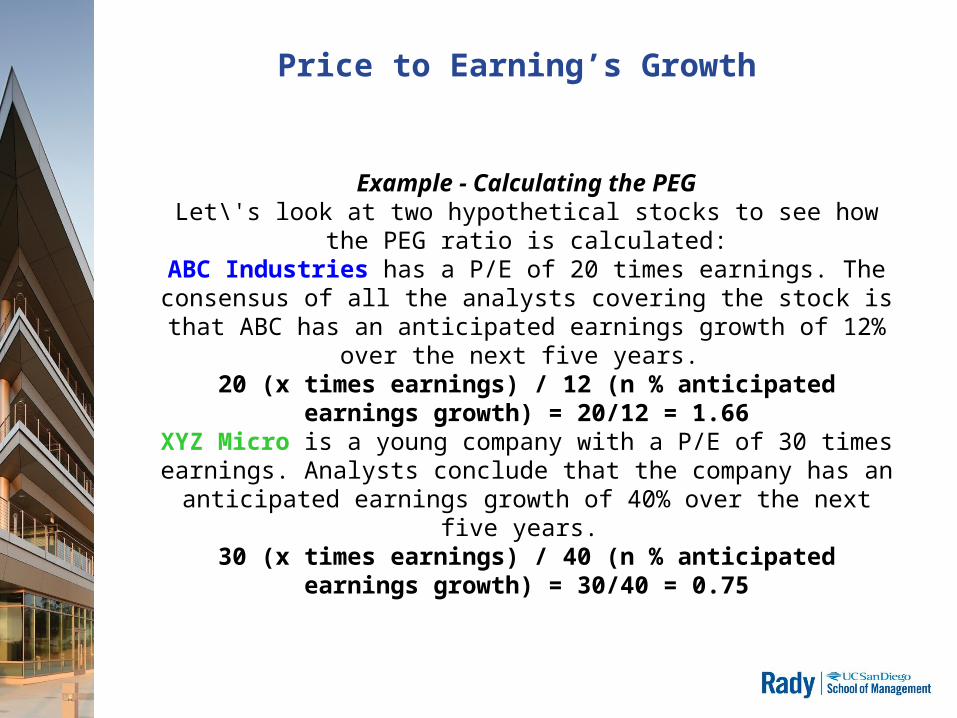
Example - Calculating the PEGLet\'s look at two hypothetical stocks to see how the PEG
ratio is calculated:ABC Industries has a P/E of 20 times earnings. The
consensus of all the analysts covering the stock is that ABC has an anticipated earnings growth of 12% over the next five
years. 20 (x times earnings) / 12 (n % anticipated earnings
growth) = 20/12 = 1.66XYZ Micro is a young company with a P/E of 30 times earnings. Analysts conclude that the company has an
anticipated earnings growth of 40% over the next five years. 30 (x times earnings) / 40 (n % anticipated earnings
growth) = 30/40 = 0.75
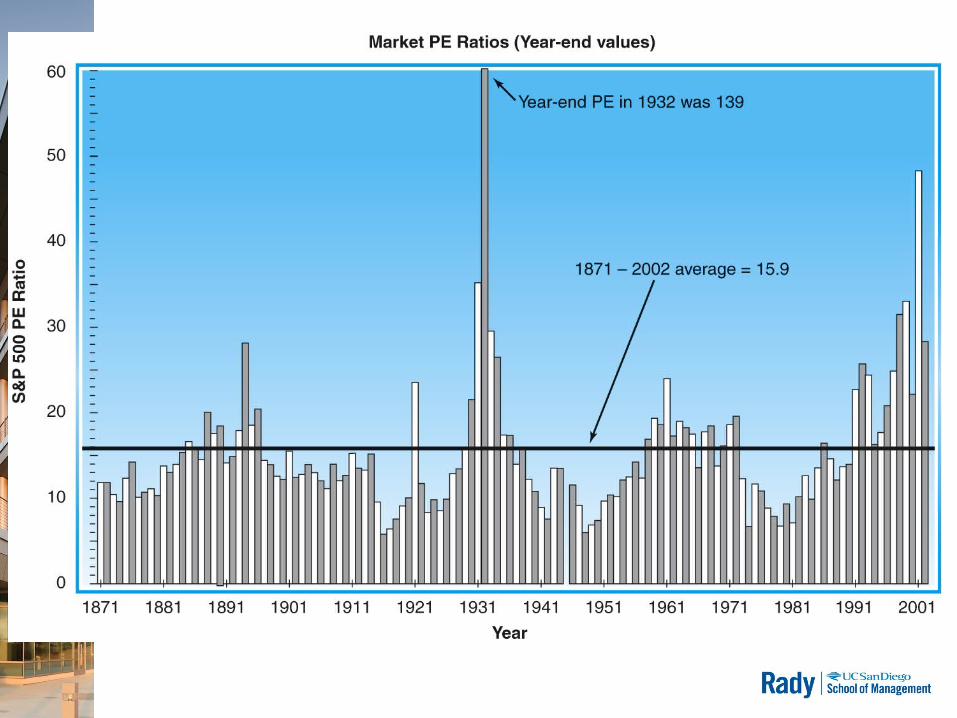
Insert Figure 7-3 here.
Analytical Factors: Growth Rates
• Choosing a Growth Rate
– Financial analysts typically calculate a number of growth rates using different ways to determine a likely range for the statistic.
– Recent data may be more reliable than data from the more distant past.
– Company statements regarding company targets may be considered too.
– Other analysts – Zacks, First Call and I/B/E/S– Whisper Number -- thewhispernumber.com
Other Valuation Methods
• Price Earnings Ratio:Price Earnings Ratio: The ratio of a firm’s stock price to its earnings per share.
• Price-to-book value ratiosPrice-to-book value ratios
• Price-to-Cash Flow RatiosPrice-to-Cash Flow Ratios
• Price-to-SalesPrice-to-Sales

Beta
• BetaBeta is the volatility, or risk, of a particular stock relative to the volatility of the entire stock market.
• Beta is an indicator of how risky a particular stock is and it is used to evaluate its expected rate of return.
• Beta is one of the fundamentals that stock analysts consider when choosing stocks for their portfolios, along with price-to-earnings ratio, shareholder's equity, debt-to-equity ratio, and other factors.
Beta
• The beta of the market is by definition 1.0.• A beta of less than 1 means that the stock is less
volatile than the market as a whole, while• A beta greater than 1 means the stock is more
volatile than the market as a whole. • The beta value can be less than zero, meaning
either that the stock is losing money while the market as a whole is gaining (more likely) or that the stock is gaining while the market as a whole is losing money (less likely).
Beta
• Look at the time frame chosen for calculating beta.
• Provided betas are calculated with time frames unknown to their consumers.
• Long-term investors will certainly want to gauge the risk over a longer time period than a position trader who turns over his or her portfolio every few months.
Beta
• Another problem may be the index used to calculate beta. • Most provided betas use the American standard of the S&P 500 Index. • If your portfolio contains equities that extend beyond U.S. borders, like a company that is based and
operated in China, the S&P 500 may not be the best measure of the market. • By calculating your own beta you can adjust for these differences and create a more encompassing view of
risk.
One distinct advantage of calculating the beta yourself is the ability to gauge the beta's reliability by calculating the coefficient of determination, or as it is better known, the r-squared. This is a powerful tool that can determine how well your beta measures risk. The range of this statistic is zero to one. The closer the r-squared is to one, the more reliable your beta is.
Another unknown factor of pre-made betas is the method used to calculate them. There are two ways to calculate: regression and the capital asset pricing model (CAPM). CAPM is used more commonly in academic finance; investment practitioners more often use the regression technique. This allows for a better explanation of returns pertaining to the market rather than a theoretical explanation of the overall return of an asset, which takes interest rates as well as market returns into account.
• Inevitably, there are also disadvantages to doing it yourself. The main issue is the time involved. Calculating beta yourself takes longer than doing it through a website, but this time can be significantly cut down by using programs such as Microsoft Excel or Open Office Calc.
Adjusted Closing Price
• Adjusted Closing PriceAdjusted Closing Price The adjusted closing price is a useful tool when examining historical returns because it gives analysts an accurate representation of the firm's equity value beyond the simple market price. It accounts for all corporate actions such as stock splits, dividends/distributions and rights