october 2009 - amazon web services · chapter 9: conclusion ..... 25 references ..... 27. page 2...
TRANSCRIPT

October 2009

Table of Contents
About the Report ...................................................................................................................... 2
Using this Report ...................................................................................................................... 2
About the Authors ..................................................................................................................... 2
Introduction ............................................................................................................................... 3
Chapter 1: Background ............................................................................................................. 6
Chapter 2: Expenses ................................................................................................................ 9
Chapter 3: Revenues .............................................................................................................. 13
Chapter 4: Construction in college sports: an arms race? ...................................................... 16
Chapter 5: Title IX and Olympic sports ................................................................................... 18
Chapter 6: Cost containment, then and now .......................................................................... 19
Chapter 7: Commercialism ..................................................................................................... 21
Chapter 8: Myths and intangibles ........................................................................................... 23
Chapter 9: Conclusion ............................................................................................................ 25
References ............................................................................................................................. 27

Page 2 Knight Commission on Intercollegiate Athletics
About the Report
This report offers an overview of the business and economic landscape of intercollegiate athletics, with a particular focus on the Football Bowl Subdivision, the top competitive tier of the National Collegiate Athletic Association. It is designed to help policymakers, academic leaders, and other interested parties understand both the economic forces that shape decision making in athletics and the financial consequences of those decisions for higher education as a whole. It also is intended to provide background and context as the Knight Commission considers solutions to the problems presented here.
Using this Report
The graphs in this report use data reported by institutions directly to the NCAA. Median values are used in some grants to represent the typical experience or value within each grouping. However, in some cases, the figures use the average values in order to accurately represent several expense or revenue subcategories within an overall total. The years noted in the graphs are fiscal years. For example, the reference to 2007 in many graphs represents Fiscal Year 2007, which would be the 2006-7 academic year Unless otherwise noted, the dollar values presented in graphs showing trends over time represent nominal dollars, meaning that they are not adjusted for inflation. Operating expenses are used to separate the 119 FBS institutions in 2007 into 10 groups (deciles), with approximately 12 institutions in each group. Debt service is not considered a part of operating expenses and is noted separately in Figure 4a. In some of the graphs, there are zero values for the medians. This means that the schools in at least the bottom half of the grouping reported zero values for that particular category.
About the Authors
The project was supervised by Amy Perko, Executive Director of the Knight Commission on Intercollegiate Athletics. Jay Weiner (www.jayweiner.com), a journalist based in St. Paul, Minn., who has specialized in sports business and other off-the-field issues for past three decades, is the author. Welch Suggs, consultant to the Knight Commission, served as primary editor of the report. Dennis Kramer II, Graduate Fellow for the Commission, provided editorial assistance. Graphics and the website were designed by Widmeyer Communications. Significant editorial feedback and data review was provided by Andrew Zimbalist, Robert A. Woods Professor of Economics at Smith College. Scott Hirko provided editorial assistance and created special design features. Jeffrey Orleans and Donna Lopiano also provided editorial comments on early drafts. The Knight Commission would like to thank the National Collegiate Athletic Association for its assistance with assembling data for this report. In particular, Todd Petr, Director of Research; Bernard Franklin, Senior Vice President; and Jim Isch, Interim President and Chief Financial Officer, were helpful and supportive of the project throughout its development.

College Sports 101 Page 3
Intercollegiate athletics at the country’s most prominent colleges and universities has become a multi-billion dollar enterprise. It involves not only institutions of higher education, but also television networks, apparel manufacturers, advertisers from all sectors, and above all, millions of fans and donors. Now, almost all state flagship universities, many regional institutions, and some private research universities maintain teams in the Football Bowl Subdivision (FBS) of the National Collegiate Athletic Association (NCAA), formerly Division I-A. At these institutions, athletics are a focal point for universities and their communities. Tens of thousands of fans (and at a few institutions, over a hundred thousand) come to cheer on football teams, with smaller numbers flocking to men’s basketball and other sports. Team logos and nicknames are recognized coast-to-coast, branding their institutions for people who could not find the university on a map. Donors give munificent sums to fund athletic scholarships or construct stadiums. A handful of the most visible athletics programs can afford to spend more than $80 million annually on their operations, thanks to such donations as well as ticket revenue, royalties from championship events, licensing and sponsorship revenue, and broadcast rights. Indeed, most fans and observers of college sports believe that the majority of athletics departments generate large net sums of money for their institutions. A 2006 survey sponsored by the Knight Commission on Intercollegiate Athletics found that 78 percent of Americans polled believed athletics programs were profitable (Knight Commission on Intercollegiate Athletics, 2006).
In fact, the vast majority of athletics programs reap far less money from external sources than they need to function. Virtually all universities subsidize athletics departments
through general fund allocations, student fees, and state appropriations, and the NCAA estimates in a given year that only 20 to 30 athletics programs actually generate enough
external revenue to cover operating expenses. Institutional subsidies to athletics can exceed $11 million, according to data provided by the NCAA. With costs in athletics rising faster than in other areas of university operations, it is not clear how many institutions can continue to underwrite athletics at their current level without allocating significant funds that could be used for teaching, research, service, student services, or other core functions. The economic downturn has exacerbated these financial pressures, but the problems with the economic structure of big-time intercollegiate athletics go much deeper than the current circumstances. Among the primary issues:
l The wide gap between wealthy conferences and struggling conferences is growing wider, deepening a class structure even within the ostensible “big time.” Among the eleven conferences with teams in the bowl subdivision, the richest league’s members generated approximately fourteen times as much revenue as those programs in the poorest conference in 2007, according to data provided by the NCAA.
l No matter the size of an athletic department’s budget, over the past decade
Introduction
“The extraordinary visibility of big-time programs and the pressure applied by all of the agents involved in college sports require a heightened level of vigilance on the part of institutional decisionmakers and policymakers.”

Page 4 Knight Commission on Intercollegiate Athletics
expenditures have been rising dramatically every year and much faster than revenue is growing.
l At many institutions, athletics budgets are rising more quickly than educational budgets, and the subsidies provided by institutions to their athletics budgets are rising more quickly than both.
The finances of intercollegiate athletics always have been one of the core concerns for the Knight Commission on Intercollegiate Athletics. In its 1991 report Keeping Faith with the Student-Athlete, the Commission called for the development of a “one-plus-three” model for the governance of college sports—the “one” being presidential control, and the “three” being academic integrity, fiscal soundness, and a system of accountability (Knight Commission on Intercollegiate Athletics, 1991). In most of these areas, there are notable signs of progress. Presidents now act as directors of the NCAA’s Division I and the organization as a whole. There are metrics for academics designed to hold individuals, teams, and institutions accountable for retention and graduation rates. A detailed certification process for athletics that has served as a quiet accountability mechanism on individual campuses is now in its third cycle of institutional reviews. Obviously, there are problems remaining in each of these areas, but on the whole, the landscape has changed considerably since 1991. However, finances remain an intractable problem, particularly given the growth of athletics expenses in big-time sports. As this report will show, this intractability has many roots. One of the key ones may be a lack of a common understanding or willingness to address the national dynamics that lead to decisions that exacerbate the economic problems in intercollegiate athletics, and the goal of this primer is to provide that common ground in the hopes of engaging academic leaders and policymakers. This report is focused on intercollegiate athletics. However, policymakers must
recognize that the challenges and trends in college sports, particularly at the nation’s top universities, mirror situations across campus. Universities subsidize all manner of programs, both academic and auxiliary, that do not generate revenue. Costs have been rising inexorably at all institutions, to the dismay of state legislators, federal officials, and tuition-paying parents. Observers of higher education have raised concerns about institutional investments in areas such as applied research focused more on technology transfer than on the production of basic knowledge, as well as about programs designed to drive higher margins of tuition revenues, such as executive MBA programs. In such circumstances, the question of what is and isn’t appropriate must be answered by the institution’s administration, faculty, governing board, and to some extent its accrediting agency. With regard to athletics, the extraordinary visibility of big-time programs and the pressure applied by all of the agents involved in college sports require a heightened level of vigilance on the part of institutional decisionmakers and policymakers with an interest in higher education. This report is organized into the following chapters:
l Background: How has the business of college sports evolved over the century and a half since colleges first fielded teams?
l Expenses: Where do big-time athletics programs spend money? How much of a department’s budget does coaches’ compensation represent? Are expenses growing more quickly than revenue?
l Revenue: Where do athletics departments get the funds they need to operate? How do these sources vary from institution to institution, or conference to conference? Which revenue streams are growing most quickly, and at which universities? How much are universities paying to subsidize their athletics programs?
l Construction in college sports: Is there an “arms race” among programs that spend

College Sports 101 Page 5
more on facilities in hopes of increasing revenue and attracting top-flight high school athletes?
l Cost-containment: What are colleges doing to cut costs? Are such cuts window dressing, or do they fundamentally affect the nature of college athletics? What roles do leaders such as college presidents, conference commissioners, and NCAA officials play in this process?
l Title IX and Olympic sports: As budgets get tighter, how will the business model of big-time athletics address gender equity and the maintenance of non-revenue sports?
l Myths and intangibles: How do intercollegiate athletics really affect donations, prospective student applications and the quality of prospective students? Does more spending lead to greater athletics success and increased revenue?
l Commercialism: Where are universities blurring the line between collegiate and professional sports to keep their programs viable?
l Conclusion: What will happen to athletics departments and their universities if the business model of big-time intercollegiate athletics persists in its current form? What are the biggest threats?
To assist in the preparation of this report, the NCAA provided a report on financial data compiled from member institutions. The 119 member institutions in the Bowl Subdivision in 2007 were ranked by total athletic expenditures that year and divided into ten groups of 11 to 12 members. From these deciles, median values for a wide range of revenues and expenses were calculated. The results demonstrate the wide range between the “haves” and the “have-nots.” Intercollegiate athletics arouse the passions of millions of Americans, particularly during the football and basketball seasons. In its consideration of the issues outlined here, the Knight Commission’s goal is to help develop a model of college sports that is sustainable at the top rank of American colleges and universities without compromising their core missions or exploiting the student-athletes who participate in them. This is a complicated and daunting goal, but the intent of this primer is to help those who care about college sports to understand the challenges facing the enterprise, especially at this critical moment.

Page 6 Knight Commission on Intercollegiate Athletics
At present, more than 2,000 colleges and universities field intercollegiate athletic teams. There are a few small collections of institutions, such as the National Small College Athletic Association and the United College Athletic Association, but the three primary organizations are the National Association of Intercollegiate Athletics (287 members), the National Junior College Athletic Association (roughly 527 members), and the NCAA, which has 1,075 active and provisional member institutions. The NCAA is divided into three divisions—I (336 active and provisional members), II (294), and III (445). Each division has its own rules for institutional eligibility and requirements for teams and programs. Division I itself has three subdivisions. The top level, the Football Bowl Subdivision, consists of 120 institutions competing in big-time football, where colleges award up to 85 full grants-in-aid to football players, must have minimum attendance standards, and must field teams in football and at least 15 other sports. This report is primarily concerned with this group. The next level, the Football Championship Subdivision, has 118 members, and is distinguished from the Bowl Subdivision primarily because its members compete in a 16-team football championship playoff, while the Bowl Subdivision members compete for slots in more than 30 bowl games.2 The third group, known simply as Division I, consists of 98 active and provisional members that do not field football teams. In addition to sponsoring championships and maintaining rulebooks for its sports, the NCAA mandates an extensive system of rules and regulations governing ethics and conduct
for athletes, coaches, athletics administrators, and institutions. Enforcement of these rules happens through self-reporting and, in significant situations, an NCAA investigative
group. Additions and changes to the rules must undergo a complex legislative process that differs from division to division.
As will become evident later in this report, even the top level, the
Bowl Subdivision, has its own pecking order, and this has significant implications for its members. This complex hierarchy got its start in 1852 in a race between crews from Harvard and Yale on Lake Winnepesaukee in New Hampshire, and business considerations were present from the start. The event was designed to promote the Boston, Concord, and Montreal railroad and a new resort built on the lake, and it attracted a crowd of spectators from Boston and New York. (Harvard won.) (For more information, please consult Mendhall’s The Harvard-Yale Boat Race, 1852-1924, and the Coming of Sport to the American College [1993]). Baseball, track and field, and, somewhat later, basketball and football got their start as student clubs that were eventually taken over by university administrations desirous of regulating sometimes-dangerous events, promote events that would interest alumni, and, of course, win. The National Collegiate Athletic Association was formed in 1906 and began sponsoring national championships in 1925. College athletic events became massively popular in the last two decades of the 19th century and only continued to grow, particularly in the Northeast, but also in the Midwest and the South. Despite the
Chapter 1. Background
“To the reality of burgeoning budgets and growing deficits, of heightened commercialism and aggressive marketing, add the layer of the global recession of 2008-09 . . . This has put big-time college sports in the eye of a perfect storm of economic challenges.”

College Sports 101 Page 7
enthusiasm of crowds that often equaled the largest of those today, criticisms of the enterprise also came early. What we now know as the Ivy League was the biggest of the big time in those days, and, for example, the University of Pennsylvania’s student-run Athletic Association was $6,600 in debt by 1894, turning to the university’s alumni to bail it out. By 1906, the Athletic Association had an administrative staff that reported to no one and a budget of $141,000. In 1922, in debt from a trip to the Rose Bowl, the university tore down Franklin Field and built a new, 54,000-seat stadium in its place. Four years later, the university added an upper deck. Penn financed the expansion and a new basketball arena with a bond issue that raised $4 million. The salaries of football coaches were seen as a particularly egregious expense; a survey of 96 coaches in 1929 found that the highest paid salary was $14,000 per year while the median salary was $6,000 (taking inflation into account, that $14,000 would be worth about $175,000 in 2009 dollars). Both salary figures then were higher than comparable figures for full professors, and roughly equivalent to those of deans. Additionally, alumni often schemed to pay players under the table for their services, according to a report published by the Carnegie Foundation for the Advancement of Teaching (Savage, 1929). The commercial enterprise of intercollegiate athletics continued to expand over the course of the 20th century. The NCAA began sponsoring championship events in
1925, with the men’s basketball tournament commencing in 1939. By the 1960s, the NCAA controlled regular-season football television broadcasts, doling out proceeds on a broad basis to universities from “Game of the Week” contracts. In the 1980s, however, the football powerhouses challenged the association’s monopoly on televised regular-season football. The Board of Regents of the Universities of Georgia and Oklahoma sued the NCAA and in 1984 won a landmark case that gave colleges control over regular-season television contracts, and by extension other revenue not tied to NCAA-sponsored events.
Live, televised college football, the court ruled, was a unique product that consumers desired, just like professional football on television. The NCAA could pass and enforce some rules that were non-commercial in nature, such as scholarship limits and requirements that athletes were amateurs, but it had no right to restrict its members’ opportunities to make money from televising football games. Since this decision, the financial stakes have grown enormously, both for regular-season contests and for championship events, driven in part by
the growth of the television market for college athletics, both on cable and the major networks. The Southeastern Conference divided $16 million in revenue among its members in 1990; in 2008-09, the league distributed more than $130 million (Southeastern Conference, 2009). In pursuit of similar opportunities, nearly all of the athletics programs and conferences in the top tier have
Figure 1:
Big-time football equalsbigger budgetsBudget differences in the three Division I subdivisions, 2007
$45m
$40m
$35m
$30m
$25m
$20m
$15m
$10m
$5m
$0
Overall FBSMeans
Overall FCSMeans
Overall No Football
Means
This figure shows that FBS institutions support their athletics budgets primarily through external revenues, such as ticket sales, donations and broadcast rights. The other institutions in Division I rely primarily on institutional funds to support their programs.
Data source: NCAA
Internal Revenue
External Revenue
Operating Expenses

Page 8 Knight Commission on Intercollegiate Athletics
The differences between the universities in the conferences with automatic BCS bids and other leagues go far beyond this formulaic distinction. Most of the institutions in the “have” conferences have historically been the most prominent in their states or regions, enjoy deep and wide fan bases, and can command television contracts, bowl-game agreements, and ticket prices to support vast enterprises. Particularly in the Northeast, Midwest, and West, they have maintained large athletics departments with gymnastics, lacrosse, rowing, and soccer teams in addition to more-traditional sports like baseball, basketball, swimming, tennis, track and field, and wrestling. The “have-not” conferences tend to consist of newer, smaller, and more regional institutions that lack these resources and opportunities. Nonetheless, their leaders and constituents desire the visibility and the prestige associated with big-time college sports, and must supplement the revenue they can generate from athletics with substantial internal funds to “keep up with the Joneses” in the elite leagues. To the reality of burgeoning budgets and growing deficits, of heightened commercialism and aggressive marketing, add the layer of the global recession of 2008-09, which has affected state appropriations, private giving, and enrollment at most colleges and universities. This has put big-time college sports in the eye of a perfect storm of economic challenges.
been rearranged over the past two decades as colleges have tried to make the best television deals: The SEC grew from 10 to 12 teams; the Big Eight acquired four members of the Southwest Conference to form the Big 12; the ACC reached far beyond its Tobacco Road roots to create a league stretching from Boston to Miami; and most recently the Big East reached out to acquire the University of Cincinnati, DePaul University, University of Louisville, Marquette University, and the University of South Florida in 2005-6. The NCAA has maintained control over the logistics and revenue for its championship events, and specifically uses money from the Division I men’s basketball tournament to fund the majority of its operations, other championships in all three divisions, and a large payout to its membership based on various formulas. The NCAA has signed contracts that exceeded $16 million a year in 1981 for rights to the tournament, $140 million per year in 1989, $216 million per year in 1994, and $545 million per year on average under the current contract with CBS. In the 2000s, two groups have emerged among Bowl Subdivision institutions. The top group is the true “big time,” and consists of universities belonging to the conferences whose football teams are granted automatic access to the Bowl Championship Series, which consists of the BCS championship game as well as the Fiesta, Orange, Rose, and Sugar Bowls. These conferences are the Atlantic Coast, Big East, Big Ten, Big 12, Southeastern, and Pacific-10 Conferences. The champions of these six leagues are granted automatic and lucrative slots in this top tier of bowl games, and four at-large teams are selected from these conferences as well as the others, Conference USA and the Mid-American, Mountain West, Sun Belt, and Western Athletic Conferences. The conferences with automatic BCS access have guaranteed annual revenue from these games, while the other leagues receive revenue contingent on their teams qualifying according to a complex formula.

College Sports 101 Page 9
As noted above, universities in the Football Bowl Subdivision sponsor football and also must fund at least 15 others sports, and most universities actually sponsor significantly more. Some athletic departments have more than 250 employees, including coaches, administrators, academic advisers, marketing and ticket sales personnel, videographers, and sports medicine staff. Some have as many as 900 student-athletes on their men’s and women’s teams, with an average of 493 per institution. One of the primary ways in which university athletic programs are distinct from professional sports is that the labor cost of the athletes involved is largely fixed. An athlete participating in football, basketball, women’s gymnastics, women’s tennis, or women’s volleyball receives a scholarship equivalent to tuition, room, board, books, and mandatory fees. Athletes in most other sports receive partial scholarships. Universities are not required to award all the scholarships permitted in a given sport, and most do not fully fund grants in all the sports they offer. There are no requirements for facilities, spending, or any other expense category as it relates to a particular sport. Division I athletic programs operate as semiautonomous units within the university enterprise, but they share commonalities with both academic and auxiliary enterprises. Attached to their universities, they report to their central administrations. Some athletic “associations” are separately-incorporated 501(c)(3) not-for-profit corporations. They offer academic services to student-athletes,
much as academic units do to students as a whole. They simultaneously serve student-athletes and also mandate their participation in particular activities without compensation
beyond a grant-in-aid. This is not dissimilar in form to on-campus jobs such as those of residence hall assistants or graduate assistants, but is different enough to prompt debates about whether student-athletes constitute an unpaid labor force. The median budget for athletics
programs in the Football Bowl Subdivision is about $40 million, but that number is deceiving. There is a wide gap in spending
$90m
$80m
$70m
$60m
$50m
$40m
$30m
$20m
$10m
$0
In 2007, the Football Bowl Subdivision consisted of 119 institutions, with athletics budgets ranging from approximately $10 million to over $100 million. To capture the differences in scale and scope of these institutions, they are divided into 10 deciles of approximately 12 institutions each and ranked by total athletics operating expenses. This figure shows the median athletics operating budget for each of those deciles. There are very large gaps between the top two groups and those immediately below, and relatively smaller gaps among the bottom five groups. This shows the “class system” emerging in intercollegiate athletics, separate from conference grouping and institutional philosophy.
Data source: NCAA
Figure 2a:
Breaking down big-time sportsDistribution of operating expense budgets, FBS athletics programs
1 2 3 4 5 6 7 8 9 10
Median Budgets
Chapter 2. Expenses
“The myth of the business model – that football and men’s basketball cover their own expenses and fully support non-revenue sports – is put to rest by an NCAA study finding that 93 [of the then 119 FBS] institutions ran a deficit for the 2007-08 school year, averaging losses of $9.9 million.”
Page 10 Knight Commission on Intercollegiate Athletics
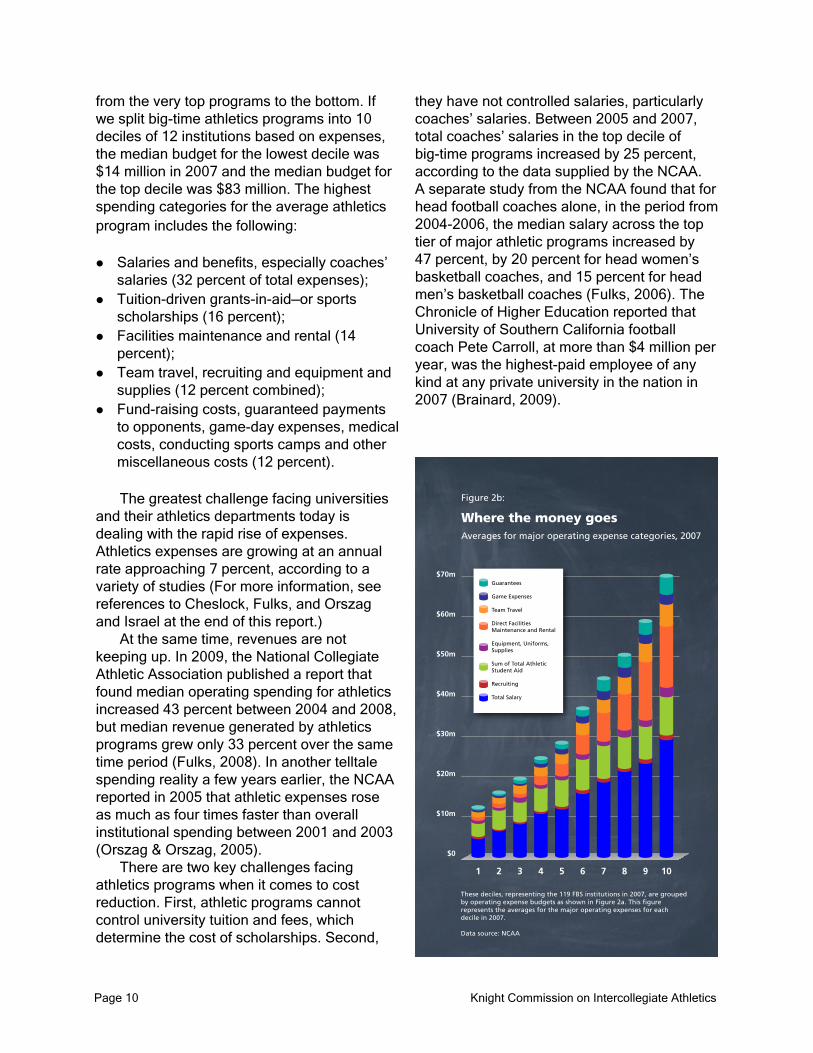
from the very top programs to the bottom. If we split big-time athletics programs into 10 deciles of 12 institutions based on expenses, the median budget for the lowest decile was $14 million in 2007 and the median budget for the top decile was $83 million. The highest spending categories for the average athletics program includes the following:
lSalaries and benefits, especially coaches’ salaries (32 percent of total expenses);
l Tuition-driven grants-in-aid—or sports scholarships (16 percent);
l Facilities maintenance and rental (14 percent);
l Team travel, recruiting and equipment and supplies (12 percent combined);
l Fund-raising costs, guaranteed payments to opponents, game-day expenses, medical costs, conducting sports camps and other miscellaneous costs (12 percent).
The greatest challenge facing universities and their athletics departments today is dealing with the rapid rise of expenses. Athletics expenses are growing at an annual rate approaching 7 percent, according to a variety of studies (For more information, see references to Cheslock, Fulks, and Orszag and Israel at the end of this report.) At the same time, revenues are not keeping up. In 2009, the National Collegiate Athletic Association published a report that found median operating spending for athletics increased 43 percent between 2004 and 2008, but median revenue generated by athletics programs grew only 33 percent over the same time period (Fulks, 2008). In another telltale spending reality a few years earlier, the NCAA reported in 2005 that athletic expenses rose as much as four times faster than overall institutional spending between 2001 and 2003 (Orszag & Orszag, 2005). There are two key challenges facing athletics programs when it comes to cost reduction. First, athletic programs cannot control university tuition and fees, which determine the cost of scholarships. Second,
they have not controlled salaries, particularly coaches’ salaries. Between 2005 and 2007, total coaches’ salaries in the top decile of big-time programs increased by 25 percent, according to the data supplied by the NCAA. A separate study from the NCAA found that for head football coaches alone, in the period from 2004-2006, the median salary across the top tier of major athletic programs increased by 47 percent, by 20 percent for head women’s basketball coaches, and 15 percent for head men’s basketball coaches (Fulks, 2006). The Chronicle of Higher Education reported that University of Southern California football coach Pete Carroll, at more than $4 million per year, was the highest-paid employee of any kind at any private university in the nation in 2007 (Brainard, 2009).
$70m
$60m
$50m
$40m
$30m
$20m
$10m
$0
1 2 3 64 5 7 8 9 10
These deciles, representing the 119 FBS institutions in 2007, are grouped by operating expense budgets as shown in Figure 2a. This figure represents the averages for the major operating expenses for each decile in 2007.
Data source: NCAA
Guarantees
Game Expenses
Team Travel
Direct Facilities Maintenance and Rental
Equipment, Uniforms, Supplies
Sum of Total Athletic Student Aid
Recruiting
Total Salary
Figure 2b:
Where the money goesAverages for major operating expense categories, 2007

College Sports 101 Page 11
In an article on coaches’ compensation, USA Today found that at public universities, the salaries are comparable: Bob Stoops at the University of Oklahoma received a raise early in 2009 to $3.7 million, plus an $800,000 bonus should he remain at his job through 2011. The University of Florida’s Urban Meyer received a raise of $750,000 weeks before the start of the 2009 season, lifting his annual salary to $4 million. The University of Alabama’s Nick Saban, Louisiana State University’s Les Miles, Ohio State University’s Jim Tressel, and the University of Iowa’s Kirk Ferentz are all being paid more than $3 million per year. While they are among the highest-profile university employees and may have multi-year contracts, coaches can be fired for not winning enough games despite meeting or exceeding other expectations, such as leading teams with high graduation rates. Coaches can also break their contracts and jump to another university for massive pay raises, leading to the proliferation of buyout clauses in coaches’ contracts. While the competition among top universities for elite faculty members and administrators can be intense, it tends not to be as public as the battle for coaches. An example of this process is the story of the University of Memphis men’s basketball coach John Calipari jumping to the University of Kentucky. Calipari, who was being paid a reported $2.5 million in 2008-09 at Memphis, jumped to Kentucky for a reported eight-year, $31.5 million contract. As with many coaches’ deals, Calipari was also guaranteed, among other things, two “late model, quality automobiles,” a country club membership, income from basketball camps at university facilities and hundreds of thousands of dollars in performance incentives. Kentucky paid Memphis $200,000, the amount Calipari was required to compensate his former institution for voiding his contract. “We’re the pre-eminent basketball program in the country,” Kentucky athletics director Mitch Barnhart told the Memphis Commercial Appeal, “and if we want a premier coach, then
that’s what it takes to get it done” (McMurray, 2009). Calipari’s contract was negotiated weeks before the state of Kentucky, facing a statewide budget deficit, cut back funding to the university by 2 percent, according to published reports. As part of the cuts, about 20 faculty positions were eliminated or remained unfilled. Football and men’s basketball make enough operating revenue to cover their operating expenses at more than half of the elite athletics programs, including salaries of their head and assistant coaches and additional personnel. During the period from 2004-2006, 54 percent of those football programs reported external revenue (i.e., that from ticket sales, television contracts, and other sources outside the university) that exceeded operating expenses for their football teams, according to the NCAA (Fulks, 2006). Men’s basketball programs achieved greater financial success, with 57 percent producing net revenue during the same three-year period. With few exceptions, however, reported operating surpluses from the two marquee sports were not enough to cover the costs of an athletic department’s other sports offerings, whether it be 14 or 24 squads. The myth of the business model – that football and men’s basketball cover their own expenses and fully support non-revenue sports – is put to rest by an NCAA study finding that 93 institutions ran a deficit for the 2007-08 school year, averaging losses of $9.9 million. That was more than twice as large as the average net revenue ($3.9 million) for the 25 programs that reported an operating surplus in 2008. Even so, this may understate the true cost of intercollegiate athletics at any given institution. Data produced by NCAA member institutions suffer from varying methods of accounting; for instance, the major item of capital costs for facilities, the projected costs of maintaining an athletic department’s infrastructure, the time spent on athletics issues by the central administration, and other factors generally are not fully included

Page 12 Knight Commission on Intercollegiate Athletics
in athletic departments’ financial statements or reports to the NCAA. Also, colleges have different ways of accounting for the cost of athletes’ grants-in-aid: Many big-time programs pay the full cost of tuition to the institution, but sometimes colleges forego such revenue by, for instance, placing athletes on in-state tuition. Overall, spending on athletics appears to have created a so-called “arms race” between competing athletic programs and institutions. Economists Jonathan Orszag and Mark Israel (2009) define an arms race as “a situation in which the athletic expenditures by a given school tend to increase along with expenditures by other schools in the same conference.” In their analysis of the college sports business, using data from 2004-2007, Orszag and Israel (2009) found evidence to support such a dynamic; one university spends an additional dollar in operations costs in Conference X and a rival in the same conference spends an increased 60 cents, and the spending continues among those who can afford it and even those who cannot. In 2007, two of the nation’s most watched conferences, with some of the most popular college sports brands among its members, posted some of the largest financial deficits of the 11 top-tier football-playing conferences. The median net revenue for one league’s member athletic departments was negative $7.2 million; for another it was negative $10.4 million. For the former, its red ink had grown by 44 percent since 2005. Meanwhile, every athletic program in three less prosperous conferences relied on more dollars from their central administrations than they were able to generate on their own. Consider these disparities. The University of Alabama, one of the nation’s most prestigious football powers, is paying salaries of nearly $6.6 million to its head football coach and his nine assistants for the 2009 season. That’s more than 32 bowl-subdivision programs spend on football as a whole, according to an analysis by the Orlando Sentinel (Limon, 2009). The “have-not” institutions within each conference
cannot compete revenue-wise with some of their “have” peers because of stadium capacity, fan demographics and other factors. Some athletic directors believe these intra-conference disparities are as much of a threat to financial stability as the differences among conferences. It is, said one athletic director, similar to the disparities in Major League Baseball, in which the Pittsburgh Pirates and Kansas City Royals must try to compete for players in the same market as the New York Yankees and Los Angeles Dodgers. Iowa State University of the Big 12 is an example of a have-not school in a big-time conference. It brings in a respectable $17 million per year in football revenue. Among its competitors are Texas, with $73 million in football revenue, and Nebraska, with $49 million in football revenue. But Iowa State’s fans and boosters expect its program to retain coaches and build facilities at the same level as their richer Big 12 colleagues. Keeping up with the Joneses is increasingly difficult, if not impossible.

College Sports 101 Page 13
While universities and even the biggest athletics programs are not-for-profit organizations, some can generate significant sums from ticket sales, television contracts, and other sources. Most, however, depend on institutional transfers from general funds, student fees, and state appropriations to cover the expenses discussed in the previous section. The NCAA has begun to make this distinction in its reports as one between “generated” revenue--or that coming from external sources--and “allocated” revenue, which consists of intra-institutional transfers.
lExternal sources of athletics department revenue stand, generally, in this order:
lCash contributions from alumni and others (30 percent);
lTicket sales (28 percent);lPayments from conferences, which include
revenue from regular-season television contracts, royalties from the NCAA’s basketball tournament contract, and football bowl game payouts (17 percent);
lLocal marketing income, such as in-stadium signs and payments from corporate sponsors, local radio-TV rights fees, etc. (10 percent).
The remainder comes from food and program sales at games, sports camp income, guarantees paid out by opponents for road games, and payouts from athletics department scholarship endowments. While these are overall figures, breaking them down yields a much clearer picture of disparities among institutions. At the bottom of the revenue-producing rankings among FBS programs, ticket sales—driven, of course,
by far lower attendance and cheaper prices—account for less than 10 percent of their total revenue. At the top-revenue producers, ticket sales in large stadiums at
high prices generate about 30 percent of all revenue. In 2007, half of big-time programs sold less than $5 million in tickets to all contests. But the other half sold more than $10 million in tickets, with the top 20 percent of
Total Ticket Sales
Total Royalties
Total Guarantees
Total Donations
Total Broadcast Rights
Total NCAA/Conference Distribution
Total Indirect Institutional Support
Total Direct Institutional Support
Total Government Support
Total Student Fees
$90m
$80m
$70m
$60m
$50m
$40m
$30m
$20m
$10m
$0
1 2 3 4 5 6 7 8 9 10
These deciles, representing the 119 FBS institutions in 2007, are grouped by total athletics expenses as shown in Figure 2a. This table shows the averages for major revenues by category. All “generated” or “external” revenues are shown in green or blue and all “allocated” or “institutional” revenues are shown in a shade of red.
Data source: NCAA
Figure 3a:
Where the money comes fromAverages for major revenue categories grouped by operating expense budget, 2007
Chapter 3. Revenues
“Half of all top-flight athletic programs rely on at least $9 million in institutional and governmental subsidies to balance their budgets. Even in the most prosperous conference, its members received a median subsidy of $3.4 million.”

Page 14 Knight Commission on Intercollegiate Athletics
programs exceeding $20 million in ticket sales, most of that attributable to football. This is separate from the donations from fans. Most of these take the form of contributions to “ticket priorities.” Especially at major institutions, ticketholders make annual donations on top of the price of a season ticket to secure prime seating or luxury boxes. These donations are 80% tax-deductible under Internal Revenue Service guidelines. The University of Georgia received some publicity in 2008 when, on the eve of a season in which its football team was ranked No. 1 in early polls, a first-time season-ticket buyer would have had to donate $10,651 for the right to purchase tickets. There is some evidence that this and other forms of fundraising in athletics may compete with overall university fundraising for gifts, according to a recent study by the Chronicle of Higher Education (Wolverton, 2007). On top of revenues generated from ticket sales, universities belonging to the BCS conferences receive significant funds from television contracts through complex arrangements. Essentially, the major television networks sign contracts with the NCAA to televise championship events, including men’s basketball, the primary money generator. They also sign deals with the conferences to broadcast regular-season contests in football, men’s basketball, and occasionally other sports. Finally, they sign contracts to broadcast the assortment of football bowl games and pay royalties to the conferences whose teams are involved. All of these funds are distributed to conferences, which then have their own revenue-sharing arrangements with member institutions. Conferences also reap revenue from their own conference championship events, both from ticket sales and broadcast rights. The television networks then sell advertising and marketing rights to make good their revenue commitments in these broadcasting agreements. (For a more-thorough description of this process, particularly with relevance to bowl games visit ESPN. For more data on the finances of college football, visit the NCAA.)
The end result may or may not be of significant benefit for the institutions involved. For example, the Big Ten Conference distributed $154 million to its 11 members in 2006-7; at the other end of the scale, the Sun Belt Conference distributed roughly $1.2 million to its nine members. This disparity reflects, once more, the gap between the “haves” and “have-nots.” Whether or not they earn significant revenue from these sources, virtually all athletics programs receive some form of institutional subsidy. According to 2007 NCAA financial data, half of all top-flight athletic programs rely on at least $9 million in institutional and governmental subsidies to balance their budgets. Even in the most prosperous conference, its members received a median subsidy of $3.4 million. Such allocations come from student fees, support from a university’s general fund (covering indirect costs such as utilities), state support, staffing or facilities maintenance. In 2006, that average subsidy from central funds stood at 20 percent of total revenue for bowl subdivision programs (Fulks, 2006). As financial burdens on typical college students have increased, the rise in student fees to fund athletics has stirred debate and controversy. At all levels of big-time college sports, students are funding their campuses’ athletics programs with mandatory fees; NCAA data shows that, generally speaking, programs at the lower end of expenses and revenues rankings tend to rely more heavily on student fees than financially successful programs. In 2007, FBS programs with median expenses of $19.7 million saw students pay a median of $4.7 million, or nearly 24 percent of those athletics budgets. On the other end, in the top decile of programs with budgets in the $83 million range, students typically paid for less than two percent of their universities’ sports costs. In 2006, Fulks found that, across the board, six percent of total revenues at bowl-subdivision institutions were paid by student fees. At universities without football and, so, without substantial revenue-generating opportunities, students bore a

College Sports 101 Page 15
higher burden; 18 percent of athletics budgets came from student fees (Fulks, 2006). Battles over fees have triggered campus-wide referenda. In 2008, at California State University, Fresno, students voted against an increase from $7 to $50 per semester; the university president overrode that result and upped the fee to subsidize athletics to $32 per semester. At Utah State University, about 53 percent of students voting approved a 100 percent increase from $113 to $243 annually to help lift the university’s athletics department out of debt. In 2009, students at the University of New Orleans, a non-football-playing Division I institution, soundly rejected a doubling of student fees for athletics from about $200 per year to nearly $400. Student fees often subsidize all or part of ticket prices for events; a typical arrangement is for such fees to cover admission to games for nonrevenue teams and enable students to buy lower-cost season tickets to men’s basketball and football games. While such fees generally are mandatory for full-time students, the number of students who attend such games or purchase tickets varies from campus to campus.
$0
–$1m
–$2m
–$3m
–$4m
–$5m
–$6m
–$7m
–$8m
–$9m
This figure shows the median net operating deficits in the FBS have risen more than 35% from 2004 to 2008.
Data source: 2004-2008 NCAA Revenues and Expenses Report
Figure 3b:
Deficits getting largerMedian net operating results for FBS, 2004-2008
2004 2005 2006 2007 2008

Page 16 Knight Commission on Intercollegiate Athletics
As with the rest of higher education, which has engaged in an “amenities race” for new laboratory facilities, student unions, residence halls, and other projects, a construction boom has echoed throughout intercollegiate athletics as programs have upgraded existing and created new facilities. Many football stadiums have been refurbished, adding capacity, luxury suites and other premium amenities at a cost often exceeding $100 million. Basketball arenas have been built or renovated, as state-of-the-art practice, strength training, and tutoring facilities have proliferated. Most such facilities are financed through private fundraising and selling bonds. The
annual expenses of repaying these bonds have become a significant proportion of many athletics departments’ budgets.
For instance, Ohio State had a reported $197 million facilities debt burden in 2007, with an annual debt service payment of $17 million. With a sold-out 105,000-seat football stadium, Ohio State officials imposed a ticket surcharge on their fans to pay down facilities debt. Overall, Street & Smith’s Sports Business Journal reported that spending on intercollegiate athletic facilities reached $15.2 billion between 1995 and 2005 (King, 2005).
$7m
$6m
$5m
$4m
$3m
$2m
$1m
$0
1 2 3 4 5 6 7 8 9 10
This figure shows the medians for annual debt service grouped by operating expense budget as represented in Figure 2a. Athletic debt service is not included in the operating expense data. The $0 value for decile 1 means that at least the bottom six schools in this decile grouping reported having no athletic debt service.
Data source: NCAA
Figure 4a:
Annual athletic debt service, FBS programsMedians for athletic debt service grouped by operating expense budget, 2007
$100m
$80m
$60m
$40m
$20m
$0
1 2 3 4 5 6 7 8 9 10
This figure shows the medians for overall athletic debt grouped by operating expense budget as represented in Figure 2a. Service payments on athletic debt are not included in the overall expense data. The $0 value for decile 1 means that at least the bottom six schools in this decile grouping reported having no athletic debt.
Data source: NCAA
Figure 4b:
Athletic debts for big-time programsMedians for overall athletic debt grouped by operating expenses budget, 2007
Chapter 4. Construction in college sports: An arms race?
“Some argue that facilities construction should be considered a recruiting expense as different athletics programs woo 17- or 18-year-old high school seniors with the . . . snazziest arena.”

College Sports 101 Page 17
In 2005, the NCAA’s Presidential Task Force on the Future of Intercollegiate Athletics reported that nearly 20 percent of current spending on average is tied to facility expansion and capital debt. The task force warned that “higher education has monetized the anticipated growth potential of athletics for near-term benefits while mortgaging the long-term financial security of the university, if there is a downturn in the fortunes of college sports.” Recruiting costs remain a relatively small item in most budgets, accounting for only two percent of total departmental costs, according to the latest NCAA Revenue and Expenditures Report (Fulks, 2008). However, some argue that facilities construction should be considered a recruiting expense as different athletics programs woo 17- or 18-year-old high school seniors with the most lavish practice facility, shiniest academic study center or snazziest arena.
The University of Kentucky opened a $30 million basketball practice facility in 2007. Georgia opened a $31 million practice and weightlifting facility soon after for men’s and women’s basketball and gymnastics. Texas Tech University spent $4 million four years ago for a student-athlete center, and Texas A&M University topped that with a $27 million academic center and a $22 million basketball practice gym.

Page 18 Knight Commission on Intercollegiate Athletics
Most of this report focuses on revenue, expenses, facilities, and other trends primarily associated with football and men’s basketball, for a simple reason: Those sports are where the money is. However, big-time athletics programs maintain a variety of other teams for a variety of reasons. Among them are institutional history, local differences, and NCAA membership requirements. But an undeniable reason for a large number of athletics programs is the law forbidding colleges from discriminating on the basis of gender: Title IX of the Education Amendments of 1972. Between 1981 and 2007, the number of Division I women’s teams sponsored jumped from 2,011 in 1981-82 to 3,339 in 2006-07, according to NCAA records; the number of women student-athletes in big-time programs more than doubled. Much of this growth was triggered by lawsuits in the mid-1990s forcing colleges and universities to adhere to Title IX guidelines. Despite these gains, far more men than women are still participating in sports at the Division I level. The NCAA’s study found that even though 53 percent of full-time students at Division I institutions in 2007-8 were female, only 45 percent of scholarship athletes were (DeHass, 2004). Virtually no women’s teams attract enough fans to make money, and few have the kind of marketing deals from corporate sponsors that enable men’s teams to generate net operating revenue. In fact, the NCAA reported that in 2006, universities in the Football Bowl Subdivision ran a median annual deficit of just under $5 million on women’s sports. They were hardly alone: 49 percent of universities also ran a deficit on men’s sports, with a
median loss of $4.4 million. In recent years, athletics directors, faced with rising costs and the decision to spend more on revenue-producing sports, have faced a dilemma: Do they cut costs (or eliminate increases) evenly across all sports, even if it makes some teams uncompetitive? Or do they
choose to eliminate a sport altogether to concentrate cost-cutting there? Teams in the so-called Olympic sports—such as track and field or swimming—have fallen prey to the budgetary
knife when athletic departments need to cut back. Such teams are easy targets, but because most athletics departments are not in compliance with Title IX’s requirements for women’s participation, colleges risk expensive legal battles if they cut women’s sports. That leaves cuts to, or finding efficiencies for, men’s sports as the only options. Proponents for men’s sports have long said that sports opportunities for men have been reduced as slots for women have grown because of Title IX, but many studies have found otherwise. A Women’s Sports Foundation study found that between 1992-93 and 2000-01, women’s participation increased annually by 4.5% and men’s participation increased annually by 0.3% (Cheslock, 2008). The corresponding figures are 2.5% and 0.2% for the periods 1981-82 to 1992-93 and 2000-01 to 2004-05. However, out of all the NCAA’s divisions, only in Football Bowl Subdivision programs have there been a decline in men’s opportunities; “slight” in the conferences with automatic bids to the BCS—but larger decline in the other FBS conferences, according to the Women’s Sports Foundation study.
Chapter 5. Title IX and Olympic Sports
“Proponents for men’s sports have long said that sports opportunities for men have been reduced as slots for women have grown because of Title IX, but many studies have found otherwise.”

College Sports 101 Page 19
Just about every athletics program, no matter what its budget, has been in cost-containment and budget-cutting modes over the past year. Such budget trimming has intensified as the national recession deepened. A day does not go by, it seems, when an athletics department or conference is not laying off staff members, reducing travel costs, or rethinking how to conduct postseason tournaments with fewer dollars. Few in academe will be sympathetic, as the downturn has caused layoffs at institutions of all sizes and missions, as well as furloughs and delays in new projects and cutbacks in old ones. Notably, neither in academics nor in athletics are many institutions stepping back to look at enterprise-level changes that would make the cost structure more manageable. This is not to say that athletics programs have not made significant cuts. According to various media reports: Rice University trimmed its athletic budget 10 percent; Conference USA reduced the number of football players on its traveling squads; Iowa State cut a chartered flight to a football game, downsizing to bus travel and an international men’s basketball excursion was eliminated (Cross, 2009); Florida State cut its men’s basketball travel budget by $256,000 (Carter, 2009); Stanford, among the nation’s richest institutions with the broadest sports offerings, must cut more than $7 million from its athletics budget over the next two years (Schlabach, 2009). Nationwide, athletic administration jobs are being eliminated or left unfilled; printed media relations materials are being abandoned for less-expensive Web-based sports information. In some cases, such as the University of Cincinnati and the University of Washington
(Belson, 2009), non-revenue sports have lost scholarship support or been dropped completely. At the beginning of the 2009 football season, the sports budget trims continued
nationwide with no end in sight. To a certain extent, history is repeating itself. “N.C.A.A. Seeking Way to Cut Budget” reads a headline from the April
29, 1975, New York Times (White, 1975). It was about a “Special Meeting on Economy in Intercollegiate Athletics” convened by the NCAA. Cost-cutting legislation and the need to do something “severe” and not “cosmetic” were on the agenda. Among the cuts then: A limit on 105 football scholarships per university was reduced to 95. Fifteen years later, in 1990, the NCAA convened a “Special Committee on Cost Reduction” that led to trimming men’s scholarships in all sports by 10 percent, dropping football to 85 scholarships. A limit on the salaries of the fourth assistant basketball coach at Division I programs also was approved (NCAA News, 1990). (Later, that was ruled a violation of federal antitrust laws, and a jury awarded a class of coaches $54.5 million to be paid by the NCAA.) The reason for the national moves in 1975 and 1990 was the reluctance of individual athletics programs to contain their costs unilaterally. Andy Geiger, who served as athletics director at the University of Pennsylvania, Maryland, Stanford and Ohio State, was a member of the 1990 NCAA cost-containment task force. He said recently that efforts then to reduce costs were done “collectively, which is the only way this effort of cost reduction could happen. We all have to agree and figure out a way to do it.”
Chapter 6. Cost containment, then and now
“A day does not go by, it seems, when an athletics department or conference is not laying off staff members, reducing travel costs, or rethinking how to conduct postseason tournaments with fewer dollars.”

Page 20 Knight Commission on Intercollegiate Athletics
In 2009, conferences have taken the lead on promoting cost containment, creating new travel arrangements, eliminating in-person “media days” for coaches and athletes, and promoting other policies to reduce costs without putting member teams at competitive disadvantages with one another. However, there appear to have been few, if any, substantive changes to the way college athletic programs do business in the current climate. The two exceptions might be Birmingham-Southern College and Centenary College of Louisiana, whose boards voted to drop from Division I to Division III. Neither was a member of the Football Bowl Subdivision, but other universities have pondered a similar move in recent years.

College Sports 101 Page 21
As with universities as a whole, athletics programs are trying to find new sources of revenue to keep up with expanding costs and are looking to the commercial world for assistance. The fast-evolving world of sports business includes event promoters, television networks, marketing firms, ticket brokers and sponsors from all sectors of the corporate world, creating new questions about intellectual property for both the institution and the student-athlete, the appropriate distance between athletes and commercial presence, and the ability to maintain amateur athletics in a commercial marketplace. Ticket sales and donations aside, television revenue and marketing dollars are the largest paths to sizable revenue. The Southeastern Conference (SEC) is an example of success on the broadcast front. In 2009, as noted earlier, the SEC’s 12 member institutions shared $132.5 million in conference-generated revenue, or about a four percent increase over 2008 (Southeastern Conference, 2009). Each school received an average of $11 million. The key sources of revenue within the $132.5 million were $52 million from football television; $25.4 million from football bowls; $14.3 million from the SEC football championship game; $13.6 million from basketball television; $4.1 million from the SEC men’s basketball tournament; and $23.1 million from NCAA championships. With its most recent contract in place, the SEC is expected to distribute upwards of $200 million annually to its institutions in future years. Recently, a major trend among big-time institutions is the outsourcing of marketing, promotions, and sales to professional
agencies. Those agencies, including IMG College, Learfield Sports, and ISP, guarantee athletics departments millions of dollars, and then sell a university’s sports marketing inventory to corporate sponsors and broadcast
partners. Even in this widespread commercial practice, the “haves” and “have-nots” benefit at different orders of magnitude. According to USA Today, in 2009, Ohio State University signed
a deal with IMG guaranteeing the Buckeyes’ athletics department $11 million a year for 10 years in marketing revenue; for that $110 million, IMG will then perform all the work selling in-stadium signs, coaches’ radio and TV shows, and other corporate sponsorships (Perez & Berkowitz, 2009). By comparison, Utah State University recently signed a 10-year deal with Learfield for a total of $7.7 million. Utah State will receive less money over a period of 10 years than Ohio State will each year. As athletics programs seek more commercial funding, they must balance that objective with the principle of protecting athletes from commercial exploitation. This tightrope act has become more difficult with legal challenges that allege current commercial products licensed by the NCAA violate athletes’ publicity rights. Recently, athletes and former student-athletes have sued the NCAA and its commercial partners claiming their names and likenesses are being exploited without permission and compensation. As reported in the New York Times, college quarterbacks’ jerseys numbers, height, weight, hair color, passing styles, home towns and other characteristics appear in EA Sports’ NCAA Football 2009 video game,
Chapter 7. Commercialism
“As athletic programs seek more commercial funding, they must balance that objective with the principle of protecting athletes from commercial exploitation. This tightrope act has become more difficult.”

Page 22 Knight Commission on Intercollegiate Athletics
although their names are omitted (Thomas, 2009). In the suits brought by current and former football and men’s basketball athletes, players charge they are being exploited; their likenesses are generating revenue for the NCAA and the game manufacturer, but not for the student-athlete himself. The lawsuits raise critical questions at a time when the NCAA is considering changes to its rules that could allow for greater use of athletes’ images and names by commercial partners. The NCAA’s governance group regulating amateurism recently has examined the effects of new media issues – such as webcasts and statistics distributed on mobile devices – on the commercialization of student-athletes. Legislation is expected to be introduced to NCAA members that could deregulate in some ways the use of athletes’ likenesses and names. A “Commercial Activities Oversight Committee” has been proposed to track and make decisions in this area (Hosick, 2009).
The NCAA has attempted to frame the issue by proposing a bright-line distinction between the “amateur” model of intercollegiate athletics and the professional model used by big-league sports. NCAA vice president Wallace I. Renfro noted in 2008 that for years, colleges and universities “have encouraged intercollegiate athletics to seek outside sources of revenue as a means of diminishing institutional subsidization . . . The problem is that we mistakenly extend the concept of amateurism to the enterprise itself. To be clear, student-athletes are amateurs. Intercollegiate athletics is not.”

College Sports 101 Page 23
NCAA data from a February 2009 study authored by economists Jonathan Orszag and Mark Israel shows athletics budgets amount to 6 percent of most universities’ total institutional spending (Orszag & Israel, 2009). Despite that relatively thin slice of a campus’ budget, athletics events where thousands of students, faculty, administrators and alums gather are often the visible “front porch” for a university. Contests can be community builders. Logos, nicknames, and television appearances brand institutions locally and nationally. Even if athletics programs do not generate net revenue, they surely stimulate alumni giving and increase prospective student applications. This is known as the “Flutie effect,” on the exaggerated notion that Doug Flutie put Boston College on the map with his Hail Mary pass in a 1984 football game against the University of Miami. Rigorous studies of the subject, however, suggest that there is no significant institutional benefit to athletic success. In a 2004 report for the Knight Commission, Cornell University economist Robert H. Frank, after reviewing the extant scholarly literature, concluded any links to football and men’s basketball victories and increased applications and the SAT scores of the applicants “is small and not significantly different from zero” (Frank, 2004). A 2009 study by Devin G. Pope of the University of Pennsylvania’s Wharton School and Jaren C. Pope of Virginia Tech finds applications do rise from two to eight percent after football and men’s basketball success, but “the impact is often short-lived” (Pope & Pope, 2008). As for donations, while winning records do not necessarily increase gifts, football bowl game appearances do, Frank wrote, to the tune of $6.50 per alumnus at public universities
and $40 per year per alumnus at private schools. “The empirical literature seems to say that if the overall net effect of athletic success on alumni giving is positive, it is likely to be small,” wrote Frank (2004). Indeed, donations to athletics departments may cannibalize contributions to academic programs. As an April 2007 study in the Journal of Sport Management revealed,
athletics departments between 1998 and 2003 received an increased share of gifts – from 14.7 percent to 26 percent - from university supporters
even as overall giving to institutions was flat (Humphreys & Mondello, 2007). Even so, a Knight Commission survey of university presidents finds that they “do not view fundraising for athletics and academics a zero-sum game, in which financial gains for athletics programs are made at the expense of the academic side of the house.” There are two other myths to be dispelled. First, there is no correlation between spending more on athletics and winning more, according to an NCAA report titled, “The Empirical Effects of Collegiate Athletics: An Interim Report” (Litan, Orszag, & Orszag, 2005). Second, increased spending on coaches’ salaries has no significant relationship to success or increased revenue, according to a follow-up study. Given increased expenses demanded by elite programs, the question is: At what cost would a winning athletic program increase the size and quality of applicants and the donations of boosters? Frank wrote: “A big-time athletic program might be a cost-effective means of expanding the applicant pool if a highly visible winning program could be launched at moderate expense. But . . .
Chapter 8. Myths and intangibles
“There is no correlation between spending more on athletics and winning more . . . [and] increased spending on coaches’ salaries has no significant relationship to success or increased revenue.”

Page 24 Knight Commission on Intercollegiate Athletics
even the cost of fielding a losing program is extremely high and growing rapidly” (Frank, 2004). Another trend has been for athletics programs to reclassify from the Football Championship Subdivision to the Football Bowl Subdivision or from Division II to Division I. Division II sports programs offer fewer athletic grants-in-aid, fewer teams, and little media exposure for their athletes, teams and institutions. When Division II schools jump to Division I and, for some, eventually, to the highest FBS status, there is an educational aspiration component to it. “You are who you play,” one official said. “Our alumni tell us, ‘We look at the ticker at the bottom of CNN and [our scores] aren’t there,’ ” Joseph Chapman, president of North Dakota State University, told the Minneapolis Star Tribune before NDSU’s program leaped to Division I in 2004. “Your athletic status is wrapped in your image and visibility as an institution.”
However, elevation to the higher competitive classification rarely lifts net revenue. In a report on about 50 university programs that reclassified from Division II to some subset of Division I, the authors found that that:
lPrograms that stepped up from Division II to Division I spent more than they took in, experiencing “an average deterioration in net operating revenue” of more than $1 million each;
lSchools that switched divisions did not generally tend to experience a significant increase in enrollment, although some did;
lStudent fees – and, so, institutional subsidies - increased considerably as programs moved from Division II to Division I;
lSwitching to Division I increased alumni giving earmarked for athletics, but there was no evidence it helped general alumni donations (Orszag & Orszag, 2005).

College Sports 101 Page 25
Concerns about the expenses of college sports are nothing new, and the current economic crisis only exacerbates a long-term trend. The NCAA’s Presidential Task Force on the Future of Intercollegiate Athletics concluded in 2006 that while there was no “imminent financial crisis in intercollegiate athletics. ...[t]he rate of growth combined with the rapid rise in capital costs has the current system under stress.” The rate of spending is a concern because of the risk it poses to athletics programs, universities, and student-athletes themselves. The success of major conferences and their institutions in the media marketplace may render second-tier conferences and their institutions invisible, destroying the investment such universities have made in “big-time” athletics. As for universities, the run-up in athletics costs comes at a time when other costs are rising faster than inflation in the broad economy and states are reducing appropriations for higher education. Thus, it is plausible to think that a regional university in any of the major conferences may find itself having to choose between funding an academic department and subsidizing athletics. And student-athletes, particularly in non-revenue sports, may be at risk of their teams being cut or funding reduced to meet other needs, such as those of revenue sports. Second, the structure of intercollegiate athletics is changing rapidly. Intercollegiate athletics programs have become heavily dependent on revenue from media and other corporations with no vested interest in higher education. This already has led to tension over game scheduling and marketing presence at events, but it also creates an internal danger for athletics departments: As one official put it, “I just hope that ESPN and CBS are too big to
fail.” If the economy takes another turn, or technology threatens traditional television and media corporations are not able to make good on their contract obligations, the effects in college sports would be seismic. More immediately, there is a concern among athletic administrators that costs will continue to rise, but there are no more pots
of gold to find. As University of Minnesota athletic director Joel Maturi put it recently, major athletics programs may be running out
of that “next somehow,” even as their parent institutions are reeling from an overarching funding dilemma. The future may not be about more revenue. University of Arizona athletics
$100m
$80m
$60m
$40m
$20m
$0
1 2 3 4 5 6 7 8 9 10
In this figure, external or “generated” revenue consists of funds the athletics program earned from external sources, such as ticket sales and broadcast revenues. Internal or “allocated” revenue consists of student fees, transfers from general fund sources, state appropriations, and other sources internal to the institution. Deciles are ranked by total athletics operating expenses as represented in Figure 2a. Operating expenses do not include annual debt service that is illustrated in Figure 4a.
Data source: NCAA
Total Internal Revenue
Total External Revenue
Total Expenses
Figure 9a:
Operating deficits for most programs, operating surpluses for a fewAverage revenue (internal and external) compared to average operating expenses, 2007
Chapter 9. Conclusion
“It is time for a serious examination of the structure of intercollegiate athletics to find ways to brake the runaway train of athletic expenses.”

Page 26 Knight Commission on Intercollegiate Athletics
director Jim Livengood told ESPN.com recently, “The old adage of ‘just make more money’ through better development and fundraising won’t help. The problems are too big to just be able to fix on the revenue side.” Penn State’s athletics director Tim Curley, who currently oversees 29 intercollegiate sports, told the Knight Commission in 2009: “I believe the economic realities and conditions facing athletics will have a major impact on sponsorship [of teams] and participation in the years ahead. I remain concerned that, if adjustments are not made, we will see a reduction of both men and women’s programs in the next three to five years” (Knight Commission on Intercollegiate Athletics, 2009). He warned that non-revenue men’s sports will be hardest hit and reduced to club or intramural status. Moreover, on average, institutional subsidies to athletics are rising faster than educational subsidies for the student body. This means that colleges will have to expend a greater percentage on athletics than ever before. These kinds of concerns are by no means exclusive to athletics. Colleges and universities across the country are under attack for an economic structure that contains few if any incentives to mitigate expenses, and instead rewards institutions for pursuing high-cost research and building programs. Tuition and fees have been rising more quickly than inflation while colleges have had difficulty providing metrics to demonstrate that they are meeting their students’ educational needs. And the expansion of universities in the face of declining state support has created the need to seek funds through corporate partnerships and other arrangements that have prompted ethical questions about the ability of institutions to conduct impartial academic inquiry.
90%
80%
70%
60%
50%
40%
30%
20%
10%
0%
1 2 3 4 5 6 7 8 9 10
This figure shows the average percentage increase in internal or “allocated” funds for athletics, such as student fees, transfers from general fund sources, state appropriations and other internal sources from Fiscal Year 2005 to 2007. These increases are compared with the average budget increases for education and related activities for the entire student body. In 8 of the 10 deciles, the average increase for institutional allocations for athletics is higher. The deciles are ranked according to athletics expenditures as represented in Figure 2a.
Data source: Institutional budgets for education & related expenses (E&R) were gathered from IPEDS by the Delta Project on Postsecondary Education Costs, Productivity, and Accountability. NCAA research staff merged these institutional data with its institutional athletics expenditure data.
Figure 9b:
Spending on sports vs. spending on academicsIncreases in institutional allocations for core educational budgets for student body compared to allocations for athletics, 2005-07
Overall increase in institutional subsidies for athletics 05-07
Overall increase in education and related budgets 05-07
As such, it is incumbent upon colleges and universities to make sure that they and their athletics
programs are functioning efficiently to fulfill their missions. In terms of athletics, this means that it is time for a serious examination of the structure of intercollegiate athletics to find ways to brake the runaway train of athletic expenses.
“. . . on average, institutional subsidies to athletics are rising faster than educational subsidies for the student body.”

College Sports 101 Page 27
References
Austin American-Statesman. (2007, September 20.) A Texas-Size Building Boom.
Belson, K. (2009, May 3). Universities cutting teams as they trim their budgets. New York Times.
Bernstein, M. F. (2001). Football: The Ivy League Origins of an American Obsession, Illinois: University of Illinois Press.
Blumenstyk, G. (2009, May 1). In a time a crisis, colleges ought to be making history. Chronicle of Higher Education, 55 (34), A1.
Brainard, J. (2009, February 27). The biggest campus paycheck may not be the president’s. Chronicle of Higher Education, p.A1.
Carter, A. (2009, June 24). FSU AD Randy Spetman: Proposed budget cut less drastic than anticipated. Orlando Sentinel.
Centenary College. (2009, July 29). Centenary Board Votes to Reposition Centenary Athletics.
Cheslock, J. (2008). Who’s playing college sports? Money, race, and gender. New York: NY, Women’s Sports Foundation.
Cheslock, J. (2009). Maintaining Broad-Based Athletic Programs in an Era of Rapid Expenditure Growth. Presented to the Knight Commission on Intercollegiate Athletics, January 2009, Washington, D.C.
Conference USA. (2009, May 14). Conference USA Concludes 2009 Spring Meetings.
Cross, M. (2009, June 17). Athletic budget cut update #34. Ultimate Sports Insider.
Crowley, J. N. (2006). In the Arena: The NCAA’s First Century. Indianapolis, Ind: National Collegiate Athletic Association.
DeFord, F. (2007, January 10). Birmingham Southern Chose Students Over Athletes. SI.com.
DeHass, D. (2004) 2003-04 Race and Gender Demographics of NCAA Member Institutions’ Athletics Personnel. Indianapolis, IN: National Collegiate Athletic Association.
Frank, R. H. (2004). Challenging the myth: A review of the links among college athletic success, student quality, and donations. Miami, FL: John S. and James L. Knight Foundation Commission on Intercollegiate Athletics.
Fulks, D. L. (2006). Revenues and Expenses, Profits and Losses of Division I-A Intercollegiate Athletics Programs Aggregated by Conference – 2003 Fiscal Year. Indianapolis, IN: National Collegiate Athletic Association.
Fulks, D. L. (2008). 2004 – 06 NCAA Revenue and Expenses of Division I Intercollegiate Athletics Programs Report. Indianapolis, IN: National Collegiate Athletic Association.
Fulks, D. L. (2009). 2004 – 08 NCAA Revenue and Expenses of Division I Intercollegiate Athletics Programs Report. Indianapolis, IN: National Collegiate Athletic Association.
Gerrard, J. (1989, November 22). In $1 Billion Deal, CBS Locks Up N.C.A.A. Basketball Tournament. New York Times.
Hosick, M. B. (2009, March 26). Commercialism project enters legislative phase. NCAA News.
Humphreys, B. R., & Mondello, M. (2007). Intercollegiate athletic success and donations at NCAA Division I institutions, Journal of Sport Management, 21 (5), 265-280.
King, B. (2005, December 5). Race for Recruits. Sports Business Journal, 8(31), 19-25.

Page 28 Knight Commission on Intercollegiate Athletics
Knight Commission on Intercollegiate Athletics (1991). Keeping faith with the student-athlete: A new model for intercollegiate athletics. Miami, FL: John S. and James L. Knight Foundation Commission on Intercollegiate Athletics.
Knight Commission on Intercollegiate Athletics (2006). Public Opinion Poll. Miami, FL: John S. and James L. Knight Foundation Commission on Intercollegiate Athletics.
Knight Commission on Intercollegiate Athletics (2009). Quantitative and Qualitative Research with Football Bowl Subdivision University Presidents on the Cost and Financing of Intercollegiate Athletics. Miami, FL: John S. and James L. Knight Foundation Commission on Intercollegiate Athletics.
Limon, L. (2009, July 29). Come on Down: College football coaches still lining up for rising pay. Orlando Sentinel.
Litan, R. E., Orszag, J. M., & Orszag, P. R. (2005). The Empirical Effects of Collegiate Athletics: An Update. Indianapolis, IN: National Collegiate Athletic Association.
Longman, J. (2009, May 29). As Costs of Sports Rise, Students Balk at Fees. New York Times.
McMurray, J. (2009, April 2), Perks sweeten Calipari’s Kentucky contract: Cars, country clubs, game tickets included in the deal. Associated Press.
Mendenhall, T. C. (1993). The Harvard-Yale Boat Race, 1852-1924, and the Coming of Sport to the American College. Mystic, Conn.: Mystic Seaport Museum
NCAA v. Board of Regents of the University of Oklahoma et al., 468 US 85 (1984).
NCAA News (1990, August 15). Council agrees to sponsor most reform proposals. NCAA News, 27(29).
Orszag, J. M., & Israel, M. (2009). The Empirical Effects of Collegiate Athletics: An Update Based on 2004-2007 Data. Indianapolis, IN: National Collegiate Athletic Association.
Orszag, J. M. & Orszag, P. R. (2005). The Physical Capital Stock Used in Collegiate Athletics. Indianapolis, IN: National Collegiate Athletic Association.
Perez, A. J. & Berkowitz, S. (2009). Multimedia marketing deals at NCAA schools. USA Today.
Pope, J. & Pope, D. (2009). The impact of college sports success on the quantity and quality of student applications. Southern Economic Journal.
Sandomir, R. (1994, December 7). March Madness Stays on CBS’s Calendar. New York Times.
Sandomir, R. (1999, November 19). CBS Will Pay $6 Billion for Men’s N.C.A.A. Tournament. New York Times.
Savage, W. H. (1929). American college athletics. New York: Carnegie Foundation for the Advancement of Teaching.
Schlabach, M. (2009, July 13). Programs struggle to balance budget. ESPN.
Shelman, J. (2007, March). Questions & Answer: Joel Maturi, University of Minnesota Athletics Director. Minnesota Star Tribune.
Smith, M. & Ourand, J. (2008, August 25). ESPN pays $2.25B for SEC rights. Sports Business Journal, Page 01.
Southeastern Conference (2009, May 29). 2008-09 SEC Revenue Distribution. SEC in the Community.
Suggs, W. (2005). A Place on the Team: The Triumph and Tragedy of Title IX. Princeton, N.J.: Princeton University Press.

College Sports 101 Page 29
Suggs, W. (2006). “Historical Overview: At Play in America’s Colleges,” in Lapchick, R.E. (ed.). A New Game Plan for College Sport. Westport, Conn.: Praeger Publishers.
Suggs, W. (2007). “Heroines As Well As Heroes,” in Zimbalist, A. and Hogshead-Makar (eds.). Equal Play: Title IX and Social Change. Philadelphia: Temple University Press.
Thomas, K. (2009, July 3). College starts sue over likenesses in video games. New York Times.
Title IX of the Education Amendments of 1972, 20 U.S.C. § 1681 (2000).
United States Government Accountability Office. (2007) Intercollegiate Athletics: Trends by Sport in National Collegiate Athletic Association Sports. GAO–07–744SP. Washington, D.C.
University of Georgia Sports Communications. (2008, July 15). Score Requirements Announced for Hartman Fund Contributors.
University of Kentucky. (n.d.). Joe Craft Center.
USA Today. (2003). I-A conference expansion timeline. Retrieved July 23, 2009 from http://www.usatoday.com/sports/college/football/expansion-timeline.htm
USA Today. (2007). Compensation for Div. 1-A. college football coaches: An in-depth analysis of total income and how it is complied.
USA Today. (2007). Compensation for Division I men’s basketball coaches: What the coaches earn at the 65 schools that played in the 2006 NCAA Tournament.
Utah State University. (2009, March 24). Utah State University Students Vote To Support Athletic Fee Increase.
White, G. S. (1975, April 29). N.C.A.A. seeking way to cut budget. New York Times.
White, G. S. (1981, March 5). N.C.A.A. Title Basketball Sold to CBS for $48 Million. New York Times.
Wolverton, B. (2007, October 5). Growth in Sports Gifts May Mean Fewer Academic Donations. Chronicle of Higher Education.
Zimbalist, A. (1999). Unpaid Professionals. Princeton: Princeton University Press.
Zwerneman, B. (2009, June 23). Schools now keep score on balance sheets. Houston Chronicle.