ocean renewable energy: overview & progress moo-hyun kim professor ocean engineering program...
Post on 22-Dec-2015
214 views
TRANSCRIPT

Ocean Renewable Energy: Ocean Renewable Energy: Overview & ProgressOverview & Progress
Moo-Hyun KimMoo-Hyun KimProfessorProfessor
Ocean Engineering ProgramOcean Engineering ProgramDept. of Civil EngineeringDept. of Civil Engineering
Texas A&M UniversityTexas A&M University

Fossil FuelsFossil Fuels
• US oil consumption = 25%US oil consumption = 25%
• US oil production = 3%US oil production = 3%
• More than 70% oil importedMore than 70% oil imported
• Energy Independence: #1 Economy, Energy Independence: #1 Economy, SecuritySecurity

Ocean Renewable EnergyOcean Renewable Energy
• WaveWave
• WindWind
• CurrentCurrent
• TideTide
• OTECOTEC
• Salinity (Osmotic Pressure)Salinity (Osmotic Pressure)

Ex. Relative Cost Ex. Relative Cost (cents/kwh)(cents/kwh)Coal & OilCoal & Oil 3-53-5
NuclearNuclear 11-1411-14
HydroHydro 4-104-10
biobio 6-116-11
WindWind 5-7 (6-8)5-7 (6-8)
WaveWave 7-97-9
SolarSolar 10-1510-15
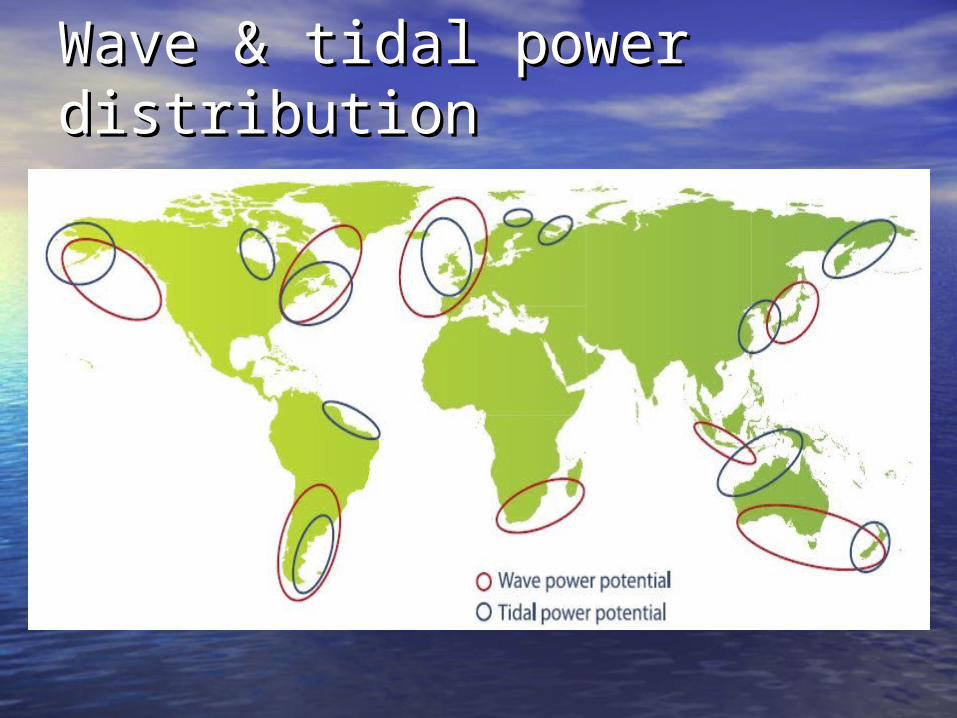
Wave & tidal power Wave & tidal power distributiondistribution

Man-made Tidal Energy Man-made Tidal Energy PlantPlant
France La Rance dam and typical turbine/generator configuration: environmental concern

Natural Tidal-Current Energy Natural Tidal-Current Energy
Promising West Coast SitesPromising West Coast Sites

Natural Current Power: Natural Current Power: KoreaKorea


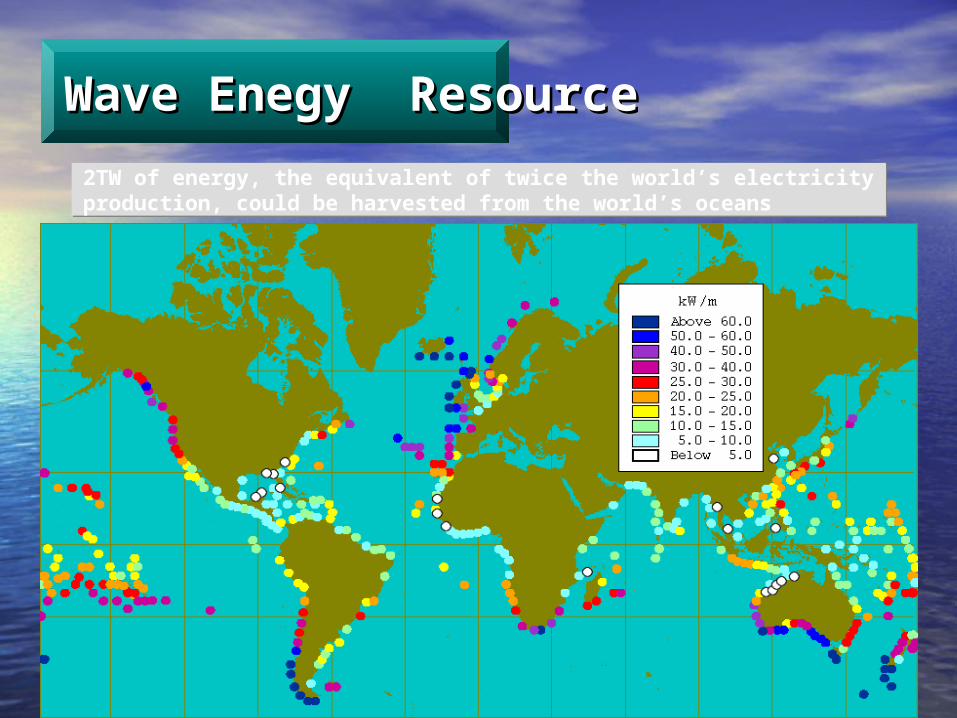
2TW of energy, the equivalent of twice the world’s electricity production, could be harvested from the world’s oceans2TW of energy, the equivalent of twice the world’s electricity production, could be harvested from the world’s oceans
Wave Enegy ResourceWave Enegy Resource
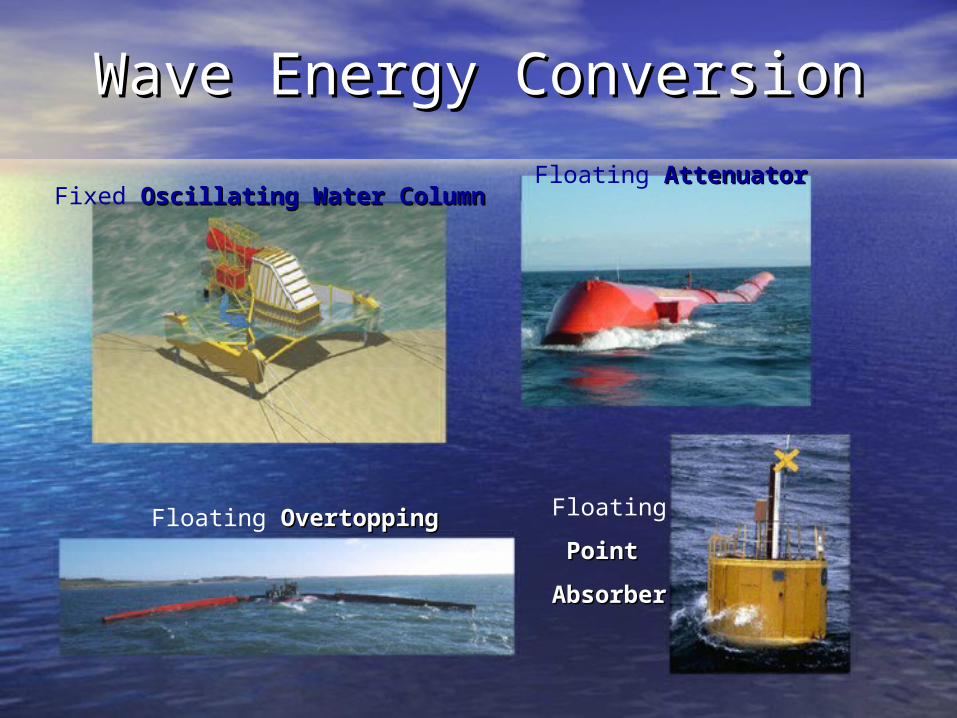
Wave Energy ConversionWave Energy Conversion
Fixed Oscillating Water ColumnOscillating Water ColumnFloating AttenuatorAttenuator
Floating OvertoppingOvertopping Floating
Point Point
AbsorberAbsorber

Land-based OWCLand-based OWCOscillating Water ColumnOscillating Water Column
Islay, ScotlandIslay, Scotland

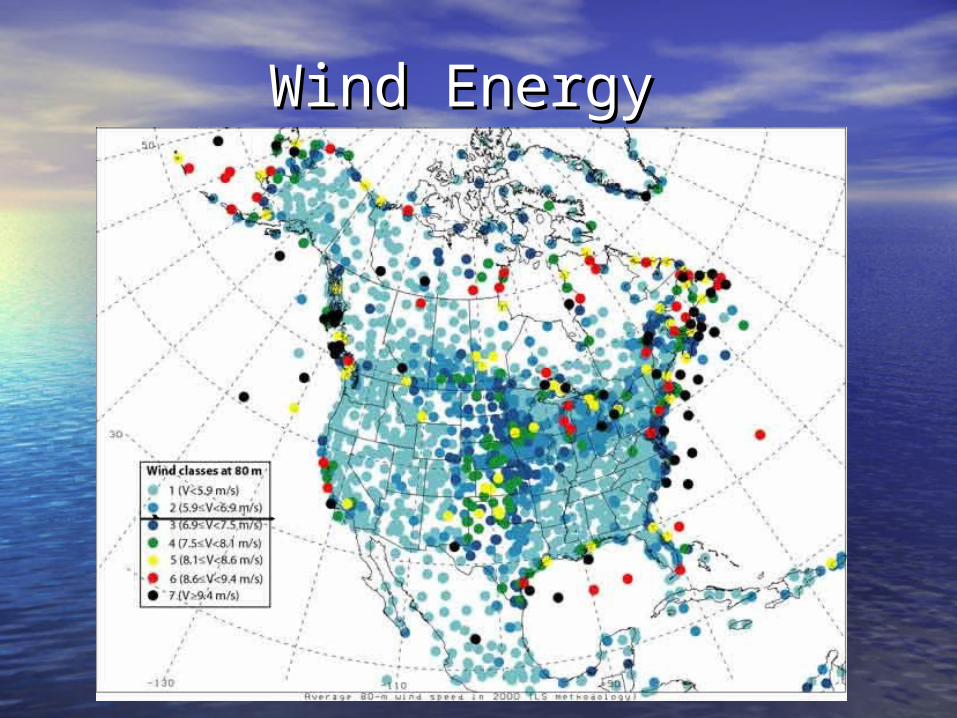
Wind Energy Wind Energy

2007 Wind Energy Use2007 Wind Energy Use
• Worldwide Wind Total=74 GWWorldwide Wind Total=74 GW
Less than 1% of the global electricity Less than 1% of the global electricity useuse
Rapidly Growing Green-WindRapidly Growing Green-Wind Industry: Industry:
Annual Growth Rate = 25%Annual Growth Rate = 25%

Winner of 2006: US, Ger, India, SpainWinner of 2006: US, Ger, India, Spain
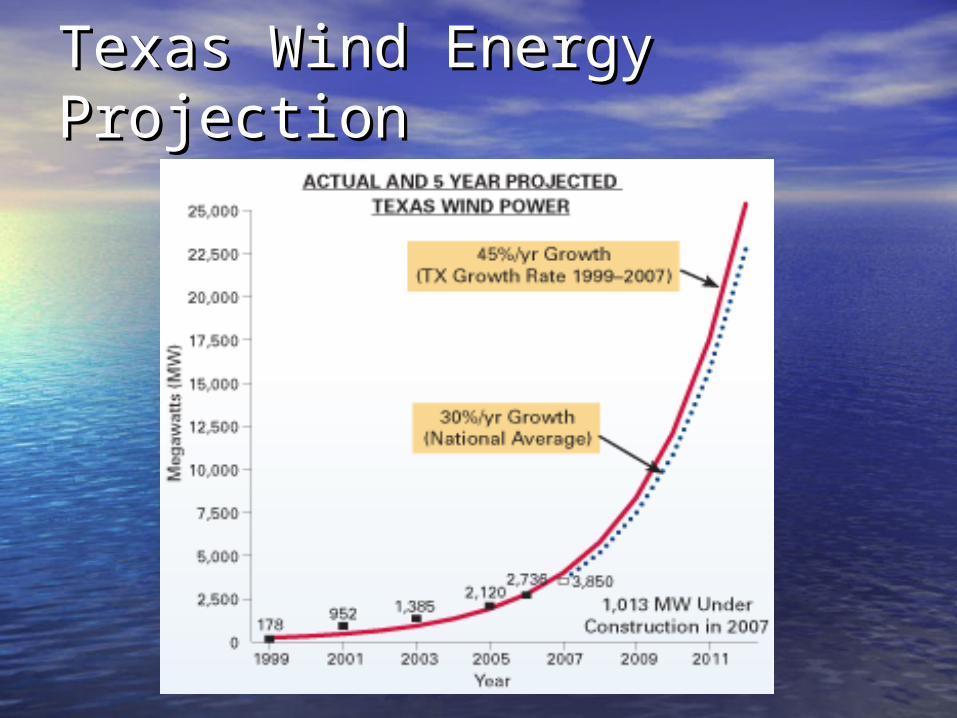
Texas Wind Energy Texas Wind Energy ProjectionProjection

Wind Energy Pros & ConsWind Energy Pros & ConsProsPros• Endless/renewableEndless/renewable• No CONo CO22 Emission Emission• No Land Space (Offshore)No Land Space (Offshore)• No cooling, No pollution, No wasteNo cooling, No pollution, No waste
ConsCons• Noise, Shade, Unsightly, BirdsNoise, Shade, Unsightly, Birds• Survive? Severe Environment Survive? Severe Environment
(Offshore)(Offshore)
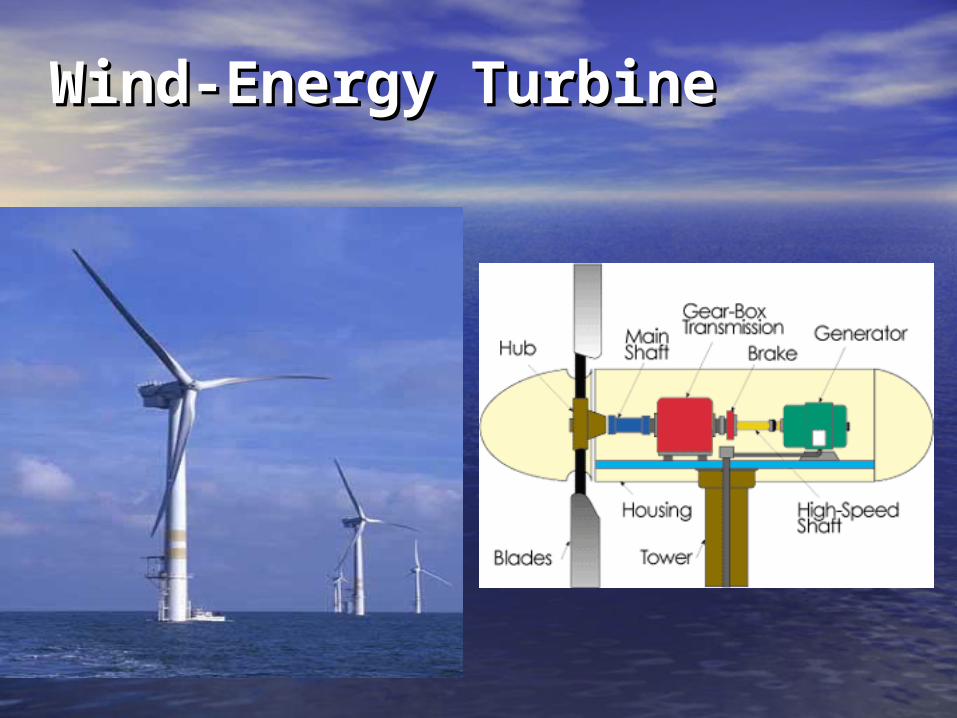
Wind-Energy TurbineWind-Energy Turbine
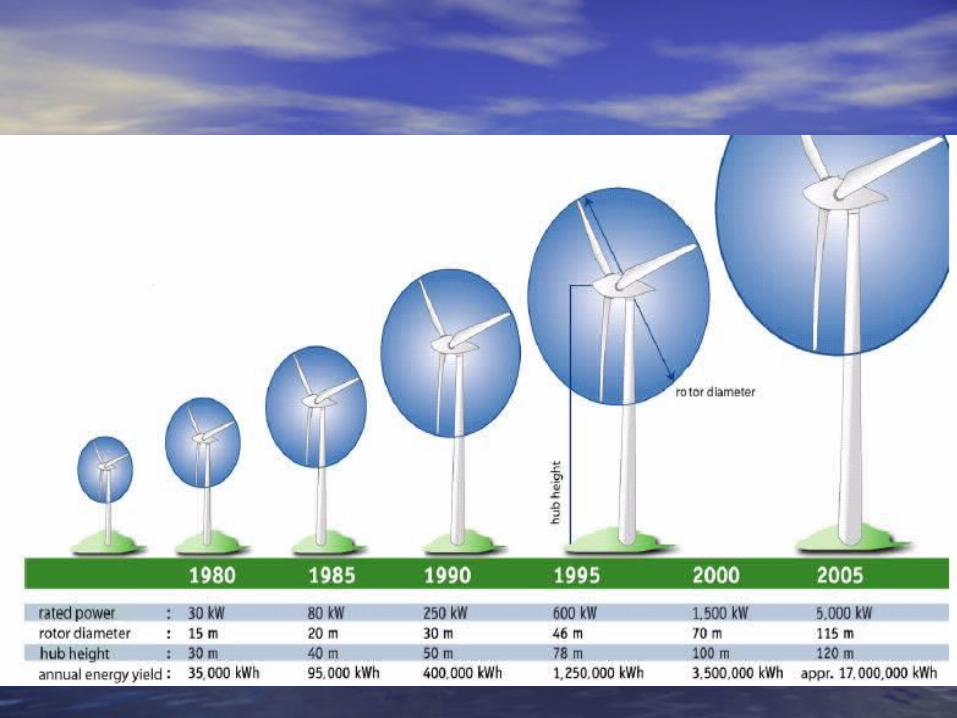

Feasibility/Economy grows with Feasibility/Economy grows with blade sizeblade size
Blade Dia Blade Dia (m)(m)
Hub Hub height (m)height (m)
Power Power (MW)(MW)
Ref (# of Ref (# of homes)homes)
7070 5555 1.6 1.6 500500
100100 7070 3.63.6 12001200
120120 8080 55 16001600

What 500-MW Wind-E Farm Can What 500-MW Wind-E Farm Can Do!Do!
• Provide clean energy for 160K homesProvide clean energy for 160K homes
• Eliminating (per year)Eliminating (per year)- 60-mil lb of CO60-mil lb of CO22 (leading green-house gas)(leading green-house gas)
- 130K lb of NOx 130K lb of NOx (main comp. of smog)(main comp. of smog)
- 300K lb of Sulfur Dioxide 300K lb of Sulfur Dioxide (leading (leading precursor of acid rain)precursor of acid rain)

Why Offshore Wind-Farm? Why Offshore Wind-Farm? FutureFuture• Stronger-steadier quality wind (20-30% Stronger-steadier quality wind (20-30%
better wind, 30-40% more cost)better wind, 30-40% more cost)
• More spaceMore space
• Easier regulatory approvalEasier regulatory approval
• Less noise constraint (operable at higher Less noise constraint (operable at higher speed)speed)
• No visual pollutionNo visual pollution

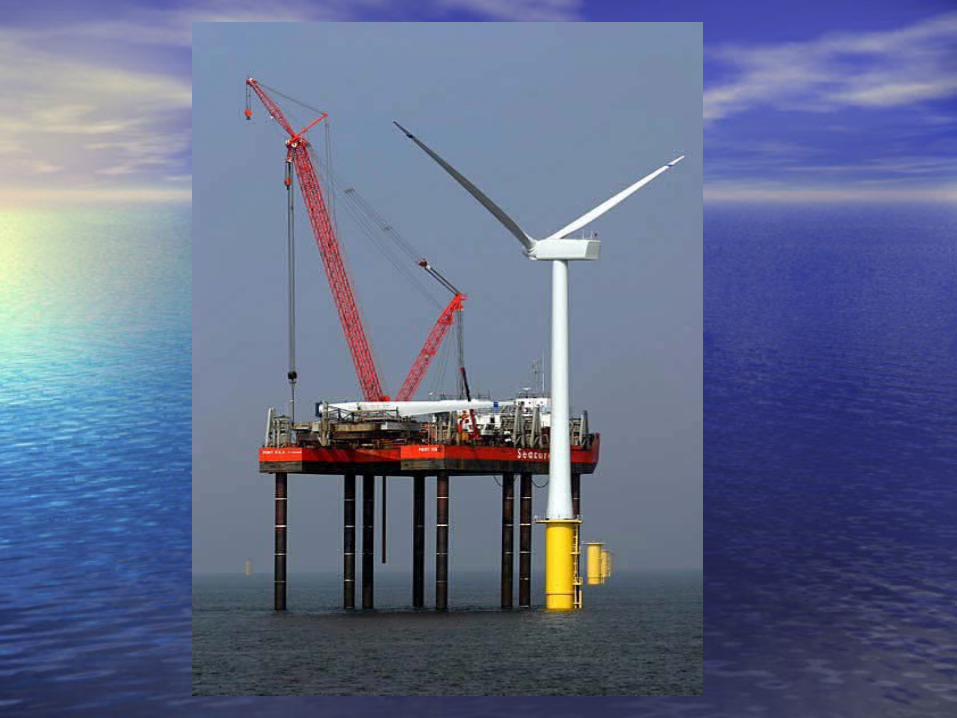
Offshore Wind Energy: Offshore Wind Energy: stronger-stronger-steadiersteadier
REpower - Scotland Norskhydro - NorwayREpower - Scotland Norskhydro - NorwayFixed (tower) 44m depth Floating (spar) >200mFixed (tower) 44m depth Floating (spar) >200m5mw 3mw demo unit underway5mw 3mw demo unit underway126m rotor diameter 90m rotor diameter126m rotor diameter 90m rotor diameter

Various Types of Floating Various Types of Floating WFWF

Status of Offshore Wind Status of Offshore Wind
Offshore ~900 MW of 75,000 MW+ world-wide – less Offshore ~900 MW of 75,000 MW+ world-wide – less than 2%than 2%
11,000 MW+ offshore is projected for 201011,000 MW+ offshore is projected for 2010
Sweden3%
Netherlands2%
Ireland3%
Germany1%
Denmark53%
United Kingdom
38%
United States5%
France1%
Canada6%
Belguim2%
Poland1%
Finland2%
Denmark3%
Germany49%
Ireland6%
Netherlands2%
Sweden4%
Spain4%
United Kingdom15%
Current Future - 2010

Wind Energy Cost TrendsWind Energy Cost Trends
1981: 40 cents/kWh
• Increased Turbine Size• R&D Advances• Manufacturing
Improvements
2007: 5 - 9 cents/kWh2012: 3.6 cents/kWh?
2007: 9-12 cents/kWh
2014: 5 cents/kWh
• Multi-megawatt Turbines• High reliability systems• Infrastructure Improvements
Land-basedClass 4
OffshoreClass 6

KEY: Synergy & Storage KEY: Synergy & Storage 3 times more valuable if provided on 3 times more valuable if provided on demanddemand

Synergy with Fish FarmSynergy with Fish Farm


Structural Failure!Structural Failure!

Floating Wind-F: Dynamic/Fatigue Floating Wind-F: Dynamic/Fatigue FailureFailure• Rotor dynamics and controlRotor dynamics and control
• Platform motions and mooring dynamicsPlatform motions and mooring dynamics

Questions?Questions?