ocde chile
TRANSCRIPT
ORGANISATION FOR ECONOMIC CO-OPERATION AND DEVELOPMENT
OECDEconomic Surveys
Chile
2005
ORGANISATION FOR ECONOMIC CO-OPERATION AND DEVELOPMENT
The OECD is a unique forum where the governments of 30 democracies work together to
address the economic, social and environmental challenges of globalisation. The OECD is also at
the forefront of efforts to understand and to help governments respond to new developments and
concerns, such as corporate governance, the information economy and the challenges of an
ageing population. The Organisation provides a setting where governments can compare policy
experiences, seek answers to common problems, identify good practice and work to co-ordinate
domestic and international policies.
The OECD member countries are: Australia, Austria, Belgium, Canada, the Czech Republic,
Denmark, Finland, France, Germany, Greece, Hungary, Iceland, Ireland, Italy, Japan, Korea,
Luxembourg, Mexico, the Netherlands, New Zealand, Norway, Poland, Portugal, the Slovak Republic,
Spain, Sweden, Switzerland, Turkey, the United Kingdom and the United States. The Commission of
the European Communities takes part in the work of the OECD.
OECD Publishing disseminates widely the results of the Organisation’s statistics gathering and
research on economic, social and environmental issues, as well as the conventions, guidelines and
standards agreed by its members.
Publié également en français
© OECD 2005
No reproduction, copy, transmission or translation of this publication may be made without written permission. Applications should be sent to
OECD Publishing: [email protected] or by fax (33 1) 45 24 13 91. Permission to photocopy a portion of this work should be addressed to the Centre
français d'exploitation du droit de copie, 20, rue des Grands-Augustins, 75006 Paris, France ([email protected]).
This work is published on the responsibility of the Secretary-General of the OECD. The
opinions expressed and arguments employed herein do not necessarily reflect the officialviews of the Organisation or of the governments of its member countries.
TABLE OF CONTENTS
OECD ECONOMIC SURVEYS: CHILE – ISBN 92-64-01355-5 – © OECD 2005 3
Table of contentsTable of contents
Executive summary . . . . . . . . . . . . . . . . . . . . . . . . . . . . . . . . . . . . . . . . . . . . . . . . . . . . . . . . . 8
Assessment and recommendations . . . . . . . . . . . . . . . . . . . . . . . . . . . . . . . . . . . . . . . . . . . 9
Chapter 1. Fostering long-term growth: The challenges ahead. . . . . . . . . . . . . . . . . . . . . 17Trends in growth performance . . . . . . . . . . . . . . . . . . . . . . . . . . . . . . . . . . . . . . . . . . . . 18The challenges ahead . . . . . . . . . . . . . . . . . . . . . . . . . . . . . . . . . . . . . . . . . . . . . . . . . . . . 26
Notes . . . . . . . . . . . . . . . . . . . . . . . . . . . . . . . . . . . . . . . . . . . . . . . . . . . . . . . . . . . . . . . . . . 33Bibliography . . . . . . . . . . . . . . . . . . . . . . . . . . . . . . . . . . . . . . . . . . . . . . . . . . . . . . . . . . . . 34
Annex 1.A1. Identifying turning points in Chile’s economic growth . . . . . . . . . . . . . 36Annex 1.A2. Chile’s resilience to external shocks . . . . . . . . . . . . . . . . . . . . . . . . . . . . . 39Annex 1.A3. Structural reforms in education since the 2003 Survey . . . . . . . . . . . . . 41
Chapter 2. Entrenching macroeconomic stability. . . . . . . . . . . . . . . . . . . . . . . . . . . . . . . . . 43Recent trends and outlook . . . . . . . . . . . . . . . . . . . . . . . . . . . . . . . . . . . . . . . . . . . . . . . . 44Maintaining strong fiscal performance . . . . . . . . . . . . . . . . . . . . . . . . . . . . . . . . . . . . . 46Monetary policy: Building on current achievements . . . . . . . . . . . . . . . . . . . . . . . . . . 55
Notes . . . . . . . . . . . . . . . . . . . . . . . . . . . . . . . . . . . . . . . . . . . . . . . . . . . . . . . . . . . . . . . . . . 57Bibliography . . . . . . . . . . . . . . . . . . . . . . . . . . . . . . . . . . . . . . . . . . . . . . . . . . . . . . . . . . . . 58
Annex 2.A1. Long-term pension system projections . . . . . . . . . . . . . . . . . . . . . . . . . . . 59Annex 2.A2. Estimating a monetary reaction function for Chile . . . . . . . . . . . . . . . . . 63
Chapter 3. Encouraging innovation . . . . . . . . . . . . . . . . . . . . . . . . . . . . . . . . . . . . . . . . . . . . . 65Innovation activity and performance . . . . . . . . . . . . . . . . . . . . . . . . . . . . . . . . . . . . . . . 66Fostering innovation: Chile’s strengths and weaknesses . . . . . . . . . . . . . . . . . . . . . . 72Moving forward: How to boost innovation?. . . . . . . . . . . . . . . . . . . . . . . . . . . . . . . . . . 76
Notes . . . . . . . . . . . . . . . . . . . . . . . . . . . . . . . . . . . . . . . . . . . . . . . . . . . . . . . . . . . . . . . . . . 80Bibliography . . . . . . . . . . . . . . . . . . . . . . . . . . . . . . . . . . . . . . . . . . . . . . . . . . . . . . . . . . . . 82
Annex 3.A1. Budget outlays for public R&D, 2002 . . . . . . . . . . . . . . . . . . . . . . . . . . . . . . 84Annex 3.A2. Innovation Surveys . . . . . . . . . . . . . . . . . . . . . . . . . . . . . . . . . . . . . . . . . . . . 86Annex 3.A3. Technology funds and science and technology programmes: A summary 88
Chapter 4. Strengthening regulation in network industries . . . . . . . . . . . . . . . . . . . . . . . 91The regulatory framework: Cross-sectoral considerations . . . . . . . . . . . . . . . . . . . . . 92The regulation of network industries: Electricity, gas and telecoms . . . . . . . . . . . . . 95Infrastructure concessions . . . . . . . . . . . . . . . . . . . . . . . . . . . . . . . . . . . . . . . . . . . . . . . . 107
Notes . . . . . . . . . . . . . . . . . . . . . . . . . . . . . . . . . . . . . . . . . . . . . . . . . . . . . . . . . . . . . . . . . . 109Bibliography . . . . . . . . . . . . . . . . . . . . . . . . . . . . . . . . . . . . . . . . . . . . . . . . . . . . . . . . . . . . 112
TABLE OF CONTENTS
OECD ECONOMIC SURVEYS: CHILE – ISBN 92-64-01355-5 – © OECD 20054
Chapter 5. Making better use of labour resources . . . . . . . . . . . . . . . . . . . . . . . . . . . . . . . . 115The potential for raising labour utilisation . . . . . . . . . . . . . . . . . . . . . . . . . . . . . . . . . . 116The potential for boosting labour productivity . . . . . . . . . . . . . . . . . . . . . . . . . . . . . . . 121Regional diversity and labour mobility. . . . . . . . . . . . . . . . . . . . . . . . . . . . . . . . . . . . . . 128
Notes . . . . . . . . . . . . . . . . . . . . . . . . . . . . . . . . . . . . . . . . . . . . . . . . . . . . . . . . . . . . . . . . . . 131Bibliography . . . . . . . . . . . . . . . . . . . . . . . . . . . . . . . . . . . . . . . . . . . . . . . . . . . . . . . . . . . . 133
Boxes1.1. Estimates of TFP growth in Chile and Latin America . . . . . . . . . . . . . . . . . . . . . . . 211.2. Environment Performance Review: Challenges and recommendations . . . . . . . 271.3. Taxation of mining: General principles, the Chilean legislation
and international experience . . . . . . . . . . . . . . . . . . . . . . . . . . . . . . . . . . . . . . . . . . . 291.4. Encouraging access to higher education. . . . . . . . . . . . . . . . . . . . . . . . . . . . . . . . . . 323.1. Determinants of innovation in manufacturing . . . . . . . . . . . . . . . . . . . . . . . . . . . . 703.2. Fundación Chile . . . . . . . . . . . . . . . . . . . . . . . . . . . . . . . . . . . . . . . . . . . . . . . . . . . . . . . . 713.3. Fiscal incentives for R&D: The experience of OECD countries . . . . . . . . . . . . . . . 773.4. National Innovation Systems: The case of Australia, Finland, New Zealand
and Sweden. . . . . . . . . . . . . . . . . . . . . . . . . . . . . . . . . . . . . . . . . . . . . . . . . . . . . . . . . . 793.5. Chapter 3: Summary of the main recommendations . . . . . . . . . . . . . . . . . . . . . . . 804.1. Regulation: The efficient-firm standard . . . . . . . . . . . . . . . . . . . . . . . . . . . . . . . . . . 934.2. Price regulation in Chile: The efficient-firm standard in practice . . . . . . . . . . . . 944.3. The new electricity law (Ley Corta II) . . . . . . . . . . . . . . . . . . . . . . . . . . . . . . . . . . . . . 984.4. The electricity generation industry: An overview . . . . . . . . . . . . . . . . . . . . . . . . . . 1014.5. Telecoms: The technology of a telephone network, and entry and competition . . 1064.6. Chapter 4: Summary of the main recommendations . . . . . . . . . . . . . . . . . . . . . . . 1085.1. Informality and the structure of the labour market . . . . . . . . . . . . . . . . . . . . . . . . 1195.2. SENCE: The national agency for training and employment. . . . . . . . . . . . . . . . . . 1255.3. Encouraging labour training: The OECD experience . . . . . . . . . . . . . . . . . . . . . . . . 1275.4. Chapter 5: Summary of the main recommendations . . . . . . . . . . . . . . . . . . . . . . . 130
Tables1.1. Recent estimates of TFP growth in Chile . . . . . . . . . . . . . . . . . . . . . . . . . . . . . . . . . 21
1.A1.1. Maximum likelihood estimates of Markov processes. . . . . . . . . . . . . . . . . . . . . . . 372.1. Basic economic indicators, 1999-2004 . . . . . . . . . . . . . . . . . . . . . . . . . . . . . . . . . . . . 442.2. Public indebtedness, 1990-2004 . . . . . . . . . . . . . . . . . . . . . . . . . . . . . . . . . . . . . . . . . 482.3. Public debt indicators: International comparisons . . . . . . . . . . . . . . . . . . . . . . . . . 50
2.A2.1. Chile: Monetary reaction functions, 1995-2004 . . . . . . . . . . . . . . . . . . . . . . . . . . . . 643.A2.1. Private innovation spending, 2001. . . . . . . . . . . . . . . . . . . . . . . . . . . . . . . . . . . . . . . 863.A2.2. Sources of funds for private R&D spending, 1998 and 2001. . . . . . . . . . . . . . . . . . 87
4.1. Price regulation in network industries . . . . . . . . . . . . . . . . . . . . . . . . . . . . . . . . . . . 934.2. Electricity: Composition of installed capacity by source, 2005 . . . . . . . . . . . . . . . 974.3. Daily average natural gas consumption, 2004 . . . . . . . . . . . . . . . . . . . . . . . . . . . . . 1024.4. Natural gas consumption with back-up, 2003 and 2005. . . . . . . . . . . . . . . . . . . . . 1034.5. Telecoms: Selected indicators, 1980-2004. . . . . . . . . . . . . . . . . . . . . . . . . . . . . . . . . 1045.1. Labour force participation and employment/unemployment rates by age
and gender, 1997-2004 . . . . . . . . . . . . . . . . . . . . . . . . . . . . . . . . . . . . . . . . . . . . . . . . . 1165.2. Effective working time by gender and job status, 2004 . . . . . . . . . . . . . . . . . . . . . 1215.3. Distribution of employment by job status and education attainment, 2004. . . . 1225.4. Distribution of employment by income, 2003 . . . . . . . . . . . . . . . . . . . . . . . . . . . . . 1235.5. Regional diversity, 2003-04 . . . . . . . . . . . . . . . . . . . . . . . . . . . . . . . . . . . . . . . . . . . . . 1295.6. Regional migration, 2002 . . . . . . . . . . . . . . . . . . . . . . . . . . . . . . . . . . . . . . . . . . . . . . . 130
TABLE OF CONTENTS
OECD ECONOMIC SURVEYS: CHILE – ISBN 92-64-01355-5 – © OECD 2005 5
Figures1.1. Growth performance, 1980-2003 . . . . . . . . . . . . . . . . . . . . . . . . . . . . . . . . . . . . . . . . 191.2. Growth decomposition and trends in investment, and labour force
participation and growth, 1970-2010. . . . . . . . . . . . . . . . . . . . . . . . . . . . . . . . . . . . . 201.3. Educational attainment and student performance. . . . . . . . . . . . . . . . . . . . . . . . . 231.4. Labour productivity, 1986-2004 . . . . . . . . . . . . . . . . . . . . . . . . . . . . . . . . . . . . . . . . . 241.5. Sources of real income differentials, 2003 . . . . . . . . . . . . . . . . . . . . . . . . . . . . . . . . 251.6. Concentration and technological content of exports, 1996-2005 . . . . . . . . . . . . . 261.7. Enrolment in higher-education by income quintile, 1990 and 2003 . . . . . . . . . . . 32
1.A1.1. Probability that the economy remains in expansion . . . . . . . . . . . . . . . . . . . . . . . 371.A2.1. Adjustment to the Mexican, Russian and Argentinean crises . . . . . . . . . . . . . . . 39
2.1. Selected economic indicators, 1996-2005 . . . . . . . . . . . . . . . . . . . . . . . . . . . . . . . . . 452.2. Policy stance, 2001-2005 . . . . . . . . . . . . . . . . . . . . . . . . . . . . . . . . . . . . . . . . . . . . . . . 462.3. Fiscal performance, 1990-2005 . . . . . . . . . . . . . . . . . . . . . . . . . . . . . . . . . . . . . . . . . . 472.4. Change in indebtedness and composition of central government
expenditure, 1987-2003 . . . . . . . . . . . . . . . . . . . . . . . . . . . . . . . . . . . . . . . . . . . . . . . . 492.5. Monetary conditions and trends in inflation and interest rates, 2002-2005 . . . . 55
2.A1.1. Density of contributions, life-cycle income and composition of pension flows . . . 613.1. R&D intensity and number of researchers: Argentina, Brazil, Chile
and OECD countries, 2001 . . . . . . . . . . . . . . . . . . . . . . . . . . . . . . . . . . . . . . . . . . . . . . 673.2. Triadic patents and scientific publications: Argentina, Brazil, Chile
and OECD countries, 1990-2001 . . . . . . . . . . . . . . . . . . . . . . . . . . . . . . . . . . . . . . . . . 683.3. Penetration of information and communication technologies (ICT):
Argentina, Brazil, Chile and OECD countries, 2003 . . . . . . . . . . . . . . . . . . . . . . . . . 693.4. R&D intensity, 2002 . . . . . . . . . . . . . . . . . . . . . . . . . . . . . . . . . . . . . . . . . . . . . . . . . . . 693.5. Institutional set-up of public support for R&D . . . . . . . . . . . . . . . . . . . . . . . . . . . . 723.6. Convergence in intellectual property rights protection . . . . . . . . . . . . . . . . . . . . . 754.1. Electricity: Installed capacity, consumption and prices, 1987-2005 . . . . . . . . . . . 964.2. Natural gas: Consumption and supply cuts, 1990-2005 . . . . . . . . . . . . . . . . . . . . . 974.3. Average revenue per minute and number of mobile phone operators, 1995-2003 . . 1045.1. Trends in employment and unemployment rates, 1986-2004. . . . . . . . . . . . . . . . 1175.2. Employment/population ratios by age and gender: Chile
and OECD countries, 2004 . . . . . . . . . . . . . . . . . . . . . . . . . . . . . . . . . . . . . . . . . . . . . . 118

This Survey was prepared in the Economics Department by Luiz de Mello andNanno Mulder, under the supervision of Silvana Malle.
Substantive inputs were received from Anders Reutersward (OECD/ELS) onlabour markets. Consultancy support was provided by José Miguel Benavente andAlexander Galetovic.
Technical assistance was provided by Anne Legendre and Thomas Chalaux,secretarial assistance by Muriel Duluc and Lillie Kee.
The Survey was discussed at a meeting of the Economic and DevelopmentReview Committee on 5 September 2004.
The Survey is published under the responsibility of the Secretary-General of theOECD.

BASIC STATISTICS OF CHILE (2004 UNLESS NOTED)
THE LAND
Area (thousands sq. km) 756.6
POPULATION
Total (millions) 16.0
Inhabitants per sq. km 21.1
Net average annual increase over previous 10 years (in %) 1.2
EMPLOYMENT
Total employment (thousands) 5 653
In %:
Agriculture 13.0
Mining 1.3
Manufacturing 14.1
Services 71.6
GROSS DOMESTIC PRODUCT (GDP)
GDP at current prices and current exchange rate (USD billion) 94.1
Per capita GDP at current prices and current exchange rate (USD) 5 898
Average annual volume growth over previous 5 years (in %) 4.0
In % of GDP:
Agriculture 6.0
Mining 7.9
Manufacturing 15.9
Services 63.0
INVESTMENT
Gross fixed capital formation (GFCF) in % of GDP 25.2
Average annual growth of ratio over previous 5 years (%) 2.5
CONSOLIDATED PUBLIC SECTOR (IN % OF GDP)
Revenue 24.3
Primary balance 3.1
Nominal balance 2.1
Consolidated net debt (central government and central bank) 5.7
INDICATORS OF LIVING STANDARD
Internet subscribers, per 100 inhabitants (2003) 27
Television sets, per 100 inhabitants (2002) 52
Doctors, per 1 000 inhabitants 1.1
Infant mortality per 1 000 live births (2003) 8
FOREIGN TRADE
Exports of goods (USD billion) 32.0
In % of GDP 34.0
Average annual growth over previous 5 years (%) 13.3
Copper exports in % of total exports 44.8
Imports of goods (USD billion) 23.0
In % of GDP 24.4
Average annual growth over previous 5 years (%) 9.3
Total official reserves (million SDRs) 10 298.9
As ratio of average monthly imports of goods 8.4
EXECUTIVE SUMMARY
OECD ECONOMIC SURVEYS: CHILE – ISBN 92-64-01355-5 – © OECD 20058
Executive summary
Chile continues to be a strong performer and the economy has recovered in earnest from the 1998-
2003 slowdown. Macroeconomic management has been exemplary and policies have been framed in
rules-based, credible settings. Public finances are particularly robust, making the economy resilient
to shocks. Structural reform is on-going, unleashing opportunities for growth. But Chile’s income gap
remains sizeable relative to the OECD area. Lifting the economy’s growth potential is therefore
Chile’s overarching policy challenge.
Encouraging innovationChile fulfils important framework conditions for innovation, including macroeconomic stability
and investor-friendly FDI and trade regimes. But R&D intensity is low and financed primarily by the
government in a fragmented National Innovation System that is not conducive to long-term
planning. Further enhancing human capital would facilitate the development and diffusion of
knowledge. The creation of the National Innovation Council can do much to boost policy coordination
but the allocation of government funds will need to be carried out in a cost-effective, transparent,
contestable fashion and geared towards encouraging business-financed innovation consistent with
Chile’s comparative advantages.
Continuing to foster pro-competition regulationRegulatory reform in network industries is on-going. In electricity, recent reform has fostered
competition and aimed at ensuring the security of supply in light of recurrent cuts in gas shipments
from Argentina. Unbundling retailing from distribution would be advisable. In telecommunications,
the central regulatory issue is how to encourage competition while setting efficient prices for
dominant firms. Public-private partnerships have contributed to reducing Chile’s “infrastructure
deficit” over the years, but as this deficit is closing, governance will need to be enhanced to
strengthen independent checks and balances and safeguard the budget from undue exposure to
contingent liabilities.
Making better use of labour inputsHuman capital accumulation, on and off the job, is essential for boosting productivity. Policies
should aim to raise educational standards to the level of international top performers as a means of
accelerating Chile’s catch-up with the more prosperous countries in the OECD area. The quality of
labour training can be improved to encourage the upskilling of those already in the labour force.
Labour force participation can be raised by removing restrictions on full-time work and reforming the
legislation on labour dispatching and subcontracting, which could encourage the use of more flexible
labour contracts, while improving options for affordable childcare and pre-school education.
ISBN 92-64-01355-5
OECD Economic Surveys: Chile
© OECD 2005
OECD ECONOMIC SURVEYS: CHILE – ISBN 92-64-01355-5 – © OECD 2005 9
Assessment and recommendations

ASSESSMENT AND RECOMMENDATIONS
OECD ECONOMIC SURVEYS: CHILE – ISBN 92-64-01355-5 – © OECD 200510
The overarching policy challenge is to lift the economy’s growth potential
The Chilean economy has recovered in earnest from the 1998-2003 slowdown. The
external environment has been supportive, with still abundant international liquidity and
buoyant commodity prices, notably for copper. The rebound in private investment has
been vigorous, raising the investment-to-GDP ratio to 25% in 2004, well above the level
prevailing on average during Chile’s “golden age” of rapid GDP growth (1985-97). Registered
unemployment is only now beginning to come down, despite the closing of the output gap,
largely because labour force participation, particularly for females, has up until recently
outpaced job creation. The overarching policy challenge is to ensure that the momentum
of the recovery, in particular the strength of private investment, is sustainable and
translates into a durable increase in the economy’s growth potential in the years to come.
This can be achieved by encouraging innovative activity, continuing to strengthen pro-
competition regulation, particularly in network industries, and lifting labour force
participation and productivity. By doing so, Chile’s income gap with respect to the OECD
area is likely to close at a speedier pace. Chile’s per capita income (adjusted for purchasing
power parity) is currently less than 40% of the OECD average and less than 30% of that of
the United States, leaving ample scope for further catch-up in relative living standards. The
greatest long-term gains would be expected from progress in accumulating human capital,
where Chile lags the most.
Economic management remains strong, making the economy more resilient to external shocks
Chile’s performance remains strong, underpinned by the authorities’ competent
stewardship of the economy. The perception of sound macroeconomic management is now
well entrenched, and Chile is the only sovereign borrower in Latin America, other than
Mexico, to enjoy an investment-grade credit rating. This achievement should not be
underestimated. In particular:
Fiscal policy has so far been guided by the structural budget surplus rule, introduced
in 2000, but not set in law, calling for a budget surplus of 1% of GDP adjusted for the
effects on public finances of the business cycle and fluctuations in the price of copper.
Framed in a now fully-fledged inflation targeting set-up, monetary policy has been
implemented in a forward-looking manner. Inflation is converging to the mid-point of
the inflation target band of 2-4% and is expected to remain tame over the near term. The
gradual withdrawal of monetary stimulus since September 2004 is appropriate.
Structural reform, facilitated by a comparatively high degree of political cohesiveness,
continues to aim at unlocking opportunities for growth, making the economy more
ASSESSMENT AND RECOMMENDATIONS
OECD ECONOMIC SURVEYS: CHILE – ISBN 92-64-01355-5 – © OECD 2005 11
resilient to external shocks, more diversified in its export base, and less vulnerable to the
vagaries of international commodity prices.
Fiscal institutions have been strengthened, but the future of the structural budget surplus rule is uncertain
The delegation to expert panels of responsibility for the estimation of trend output growth
– a key parameter in the calculation of structural budget balances – as well as the reference
price for copper, has greatly contributed to boosting transparency and confidence in the
policy framework, by in principle helping to protect it from political interference. Insulating
the fiscal stance from terms-of-trade fluctuations is a considerable achievement in the
Latin American context, where reliance on natural resource-related revenue is often the
main culprit for fiscal pro-cyclicality. Nevertheless, the authorities are not in favour of
setting the fiscal rule in law, although they are taking steps towards maintaining the
calculation of the structural budget balance as an integral part of the budget-making
process in the years to come. This should encourage continued adherence to fiscal
rectitude by successive administrations, regardless of their political orientation. While the
principle of the structural budget rule should be maintained, the actual level of the structural budget
balance will need to be set for the near term. In doing so, it will be important to take into
consideration the pressures on the budget that are likely to arise in the years to come in connection
with the pension system, in addition to the financing needs of the central bank, whose capitalisation
remains unresolved.
Further pension reform will be required and the pre-funding of future contingencies is advisable
Recent analysis suggests that the dynamics of central government debt pose negligible
fiscal risk over the medium term, predominantly by virtue of its current low level in
relation to GDP. The transition costs associated with the pension reform of the early 1980s
are fading. But, based on partial information available to date, the coverage of the pension
system and the density of contributions are low: only about 55% of the labour force
currently contributes to a pension fund and, of these, one-half do so for no more than 60%
of their working lives. As a result, there is considerable uncertainty about the future cost to
the budget of the guarantee of a minimum pension to those workers who have contributed
but at a level that is insufficient to ensure a retirement income at or above the minimum
pension. A related issue refers to the assistance pensions, which are not an entitlement,
and hence do not pose a fiscal risk per se. But the value of these pensions is currently about
one-half of that of the minimum pension, and this discrepancy may well not be politically
sustainable over the years. Closing this gap is likely to affect the incentives facing
individuals to save for retirement and would in turn affect the density of contributions and
the cost to the budget of alternative social protection policies over the longer term. It is
therefore important to find an appropriate balance between the incentives for saving for retirement
and the desirable breadth of social protection, which should be high on the policy agenda. Dealing
with these contingencies calls for pre-emptive action, which could involve some pre-funding,
benefiting from the currently healthy fiscal position. Options for increasing the density of
contributions, in particular for females and the self-employed, could also be considered. Fostering
ASSESSMENT AND RECOMMENDATIONS
OECD ECONOMIC SURVEYS: CHILE – ISBN 92-64-01355-5 – © OECD 200512
transparency in the disclosure of information on, and regular updating of, actuarial projections,
preferably as an integral part of the annual budget-making process, would contribute to mustering
the necessary public support for further reform in this area and allow individuals to save more, if
necessary.
Fiscal consolidation has allowed for a counter-cyclical policy stance while reducing public indebtedness
Fiscal management has been beyond reproach in recent years. The main achievement in
this area is the maintenance of a counter-cyclical policy stance. This owes much to the
gradual reduction in the public debt overhang, resulting from continued adherence to the
structural budget surplus rule and its well-functioning, credible mechanism for smoothing
copper-related fluctuations in revenue through the Copper Stabilisation Fund. The
consolidated net public debt (central government and central bank) came down to less
than 6% of GDP in 2004 from nearly 34% of GDP in 1990. The stock of debt is much higher
when taking into account government guarantees of public enterprise liabilities, as well as
the “recognition bonds” issued to cover the transition costs associated with the pension
reform of the early 1980s. It will therefore be important to build on the achievements of recent
years by resisting pressure for greater activism in the years to come justified on the basis of low
indebtedness and the need to satisfy multiple social demands. In particular:
The steady decline in indebtedness has generated an “interest dividend”, allowing scarce
budgetary resources to be channelled to cost-effective, externality-rich social
programmes, consistent with attainment of the government’s social objectives, while
maintaining a relatively low, pro-business tax burden. But Chile’s record in education,
evaluated by international standardised tests, as well as some health indicators, leaves
ample room for improving the efficiency of government spending in these areas. It will
be important to ensure that future increases in public social spending translate into better
outcomes and that sources of finance be found predominantly through the reallocation of
budgetary resources away from lower-priority outlays, rather than by raising the tax take.
Low public indebtedness has also contributed to making the Chilean economy less
dependent over time on external financing and hence more resilient to adverse shocks,
although private external debt is large. Domestic debt management has been prudent and
could continue to gradually reduce the stock of USD-denominated liabilities and replace inflation-
indexed debt by CLP-denominated debt paying a nominal coupon, contributing to the development
of the domestic fixed-income market. The authorities are aware that vigilance will be
required to ensure that the withdrawal of USD-indexed debt does not put undue
pressure on the foreign exchange market. Also, the pace at which inflation-indexed
instruments are redeemed will need to be guided by a judicious assessment of the
demand for these securities by pension funds and insurance companies, which hold the
bulk of traded government debt.
Monetary policy remains cautious and medium-term inflation expectations appear well anchored
The inflation targeting framework for monetary policymaking has been strengthened over
the years and is functioning well. In 1999, the central bank abandoned its policy of also
ASSESSMENT AND RECOMMENDATIONS
OECD ECONOMIC SURVEYS: CHILE – ISBN 92-64-01355-5 – © OECD 2005 13
targeting the nominal exchange rate, which it had pursued since 1984. In doing so, it has
allowed the exchange rate to play a greater role in the stabilisation of activity in response
to external shocks. In 1999-2000, the monetary framework for fully-fledged inflation
targeting was put in place, including the upgrading of the central bank’s modelling and
forecasting capabilities and the strengthening of its communications strategy to enhance
transparency and credibility in the policy framework. There are nevertheless options for
consideration within the central bank’s policy research agenda. With headline and
expected inflation already safely anchored in the 2-4% target range, the central bank could
consider the pros and cons of targeting core, rather than headline, inflation and the
associated adjustments to the width of the target band.
Boosting innovation is high on the government’s policy agenda
The authorities place innovation policy among their policy priorities on their agenda for
growth. Chile’s main strengths in fostering innovation are: its relatively investor-friendly
legislation on FDI; the presence of reasonably competitive pressures arising from product
market regulations, discussed in the 2003 Survey; a liberal trade regime, which facilitates
the diffusion of foreign technology embedded in imported capital goods and inputs; and
robust macroeconomic performance, with stable inflation and low interest rates, which
fulfils a strong framework condition for innovation. But, at 0.7% of GDP in 2002, Chile’s R&D
intensity is low by international standards. Also, innovation activity is financed and carried
out predominantly by the government. Options for private-sector financing of innovation,
such as risk and venture capital, are limited. Human capital is low. To tackle these problems,
it will be important to select among different, often competing, alternatives those which are most
cost-effective and with the greatest potential for fostering the diffusion of innovation.
Innovation policies will need to be more cost-effective and in line with Chile’s comparative advantages
To foster innovation, the authorities are focusing on the creation of new sources of finance
and on reforming the architecture of Chile’s innovation system. These are laudable policy
objectives. In particular:
Central to the government’s policy agenda is an increase in the availability of public
funds for innovation with the use of revenue from the new mining tax, introduced in
May 2005. But this will not in itself result in an appreciable improvement in innovation
performance. While there is no “best practice” approach to balancing the policy mix, the
experience of OECD countries suggests that an increase in direct government support for
innovation can easily run into governance problems, with the risk of capture of
government funds by interest groups. The monitoring of individual programmes will need to
be stepped up pari passu with the increase in financing to ensure that government support is cost-
effective and funds are allocated in a contestable, transparent manner.
Innovation policy, regardless of the support instruments used, should be consistent with
Chile’s comparative advantages. Greater R&D intensity could contribute to improving
the value-added content of exports, but scarce public funds should not be used to “pick
winners”. Innovation would have a high pay-off in most sectors if it focused on the
ASSESSMENT AND RECOMMENDATIONS
OECD ECONOMIC SURVEYS: CHILE – ISBN 92-64-01355-5 – © OECD 200514
diffusion of state-of-the-art technologies adapted to business needs and geared towards
fostering network externalities. This would favour support for general-purpose technologies
with the broadest sectoral application possible, in particular information and communication
technologies. Greater emphasis on support for applied research would be consistent with this
objective.
The authorities are aware of the need to reduce institutional fragmentation. The
overhaul of the institutional architecture of Chile’s innovation system, coupled with the
creation of the National Innovation Council linked to the Presidency to advise the
government on innovation policy, will bear fruit to the extent that it contributes to
greater policy coherence and fosters synergies among different stakeholders and
funding agencies. But governance challenges should not be underestimated. The creation of an
additional institution in an already complex set-up without the appropriate rationalisation of the
existing instances for policymaking and service delivery may do little to address the problem of
fragmentation and overlapping of functions and responsibilities.
The investment climate can be strengthened through further regulatory reform, particularly in network industries
Chile’s strong performance, and in particular the step-up in productivity over the past
decade, is due to a large extent to the strengthening of pro-competition regulation since
the early 1990s. But these achievements do not obviate the need for further reform. In
particular:
It is too soon to evaluate the impact on competition of new legislation approved in
early 2004 for the electricity sector (Ley Corta I). New legislation (Ley Corta II) has also been
approved to ensure the security of supply, against a backdrop of recurrent cuts in
shipments of natural gas from Argentina. These are steps towards removing regulatory
obstacles to the expansion of generation capacity. Further liberalisation of electricity
retailing would be welcome to allow retailers to design efficient price schedules adapted to
consumer preferences.
In the telecom sector, the emergence of competition has been instrumental in reducing
prices and facilitating access by the population to affordable services. The central
regulatory issue in the sector is how to foster competition while simultaneously setting
efficient prices for dominant firms. Further network unbundling, if pursued, should therefore
be consistent with the regulation of dominant firms. Because entry is decided on the basis of
average costs, unbundled parts of a network should also continue to be priced at average cost and
the remaining cross-subsidies would need to be eliminated.
Public-private partnerships have contributed to reducing Chile’s “infrastructure deficit”
over the years. But, as this deficit is closing, the social rates of return on new projects are
likely to decline. This calls for even more judicious project evaluation and enhanced governance
to strengthen independent checks and balances and safeguard the budget from undue exposure to
contingent liabilities.
ASSESSMENT AND RECOMMENDATIONS
OECD ECONOMIC SURVEYS: CHILE – ISBN 92-64-01355-5 – © OECD 2005 15
Boosting labour productivity is vital to improve relative living standards
Chile’s income gap relative to the OECD area reflects not only a deficit in labour utilisation,
owing to relatively low labour force participation, particularly for females, but more
importantly, lower labour productivity, which has risen over time but continues to lag
behind that of OECD countries. Anecdotal evidence suggests that in mining and some
agribusiness activities, now among the most dynamic sectors in the economy, labour
productivity is already on a par with the best performers in the OECD area. The challenge is
to raise productivity elsewhere in the economy, including in services through human capital
accumulation, on and off the job. In particular:
Educational attainment has increased but performance remains poor in comparison
with OECD countries. The government is aware of the weaknesses in this area and has
taken measures to address them. Government spending on education is on the rise,
facilitated by the interest dividend arising from continued prudent fiscal management
and the ensuing reduction in public indebtedness. Options for facilitating access by the
low-income population to higher education include a recently approved reform of
student loans, extending government guarantees for loans from private banks. This is
important because returns to education are estimated to be high. Policies should aim to
raise educational standards to the level of international top performers as a means of accelerating
Chile’s catch-up with the more prosperous countries in the OECD area. But an increase in outlays
will deliver stronger performance only if maintained over time and accompanied by monitored
improvements in the quality of teaching.
The availability of labour training financed through tax rebates and, more recently, the
increase in grants for small enterprises in lieu of tax relief, are steps in the right
direction. But such incentives would still fail to reach some groups of self-employed
persons and their family members, who are most likely to be outside the formal labour
market and for whom the return on investment in human capital accumulation is likely
to be low. While the scope for subsidising job-related training is debatable, policies should
continue to focus on improving the quality of labour training and governance in service delivery.
Labour force participation needs to rise
To lift labour force participation, which is low by international standards, even among
prime-age males, greater flexibility is needed for the allocation of working time. Part-time
work is important for a significant group of female employees and the availability of good-
quality, affordable childcare and pre-school education could encourage labour force
participation in the case of families with dependent children. Regulations on full-time work
should allow working time to be reduced by any number of hours, and not necessarily by up to one-
third, a limit that currently triggers some special provisions. Moreover, reform of legislation
would be welcome in the case of labour dispatching and subcontracting. Based on current
practices, client enterprises are responsible for work supervision, while the dispatching
firm retains a legal role as an employer. It is advisable to introduce legislation to formally clarify
these responsibilities. At the same time, strengthening the legal framework for subcontracting could
encourage a more widespread use of flexible labour contracts.
ASSESSMENT AND RECOMMENDATIONS
OECD ECONOMIC SURVEYS: CHILE – ISBN 92-64-01355-5 – © OECD 200516
In sum, Chile’s vigorous recovery in 2004-05 bodes well for the resumption of sustained growth over the longer term
This Survey’s general assessment is that Chile continues to perform strongly. The pace of
the recovery in 2004, particularly in investment, leaves little doubt that the 1998-2003
slowdown was predominantly cyclical. External conditions have been favourable. More
importantly, policies – framed in rules-based, credible settings – have put public
indebtedness on a declining path, allowing fiscal policy to play a more stabilising role than
in the past, anchoring longer-term expectations and prudently managing natural resource
wealth. This is exemplary, and the current administration’s main legacy. A lasting
challenge for future administrations is to carefully balance the need for preserving fiscal
rectitude and satisfying social demands in a low-debt environment, where the opportunity
cost of government largesse may be underestimated. Structural reforms under
consideration need to be discussed in a broader context that would take into account of
linkages and synergies among different policy areas. Innovation policies can be
strengthened in pursuit of durable growth, but the likely increase in direct government
support will need to be assessed against the objective of raising R&D intensity at the
enterprise level. Further regulatory reform will contribute to a better investment climate to
the extent that it continues to foster competition. Raising human capital, both in schools
and in the workplace, improving the use of labour inputs and lifting productivity will be
essential for closing Chile’s gap in relative living standards.
ISBN 92-64-01355-5
OECD Economic Surveys: Chile
© OECD 2005
OECD ECONOMIC SURVEYS: CHILE – ISBN 92-64-01355-5 – © OECD 2005 17
Chapter 1
Fostering long-term growth: The challenges ahead
The recovery from the 1998-2003 slowdown is now well entrenched. Privateinvestment rebounded particularly strongly, raising the investment-to-GDP ratio to25% in 2004, well above the level prevailing on average during Chile’s “golden age”of rapid GDP growth in 1985-97. Nevertheless, lifting the economy’s growthpotential remains Chile’s overarching policy challenge. This can be addressed byencouraging innovative activity, continuing to strengthen pro-competitionregulation, especially in network industries, and raising labour force participationand productivity. In doing so, Chile’s income gap with respect to the moreprosperous nations is likely to close more rapidly. Currently at less than 40% of theaverage OECD income level, Chile’s per capita income (adjusted for purchasingpower parity) leaves ample scope for further catch-up in relative living standards.
1. FOSTERING LONG-TERM GROWTH: THE CHALLENGES AHEAD
OECD ECONOMIC SURVEYS: CHILE – ISBN 92-64-01355-5 – © OECD 200518
Trends in growth performance
The recovery
The Chilean economy has recovered in earnest from the 1998-2003 slowdown, which
now appears to have been predominantly cyclical (Annex 1.A1). Real GDP grew by over 6%
in 2004, above its estimated trend rate, aided by a rebound in private consumption and,
particularly, investment. The investment-to-GDP ratio rose as a result to over 25% in 2004,
its highest level since 1998 and well above the average during Chile’s “golden age”
(1985-97). A favourable external environment, coupled with sound macroeconomic
policies, has helped. The price of copper has soared since mid-2003, reaching a 17-year
high in mid-2005, and the ensuing gains in the terms of trade have added fuel to the
recovery. The external current account is in a healthy surplus. The labour market is
strengthening with rising real earnings and falling registered unemployment.
Macroeconomic stabilisation over the years is bearing fruit, and the maintenance of a
responsible policy stance in the years to come will meet an important framework condition
for balanced growth. Sound policies have also made the economy more resilient, and Chile
has withstood external shocks well since the end of the 1990s (Annex 1.A2). Fiscal policy
has aimed at a structural budget surplus of 1% of GDP since 2000, leading to a further
reduction in indebtedness. Monetary stimulus is gradually being withdrawn, as headline
and expected inflation are converging to the mid-point of the inflation target range of 2-4%.
The macroeconomic policy stance is appropriate, given the economy’s current position in
the business cycle. Against this background, this chapter will identify the remaining key
impediments to stronger growth and priority areas for action.
Output growth: Factor accumulation or productivity gains?
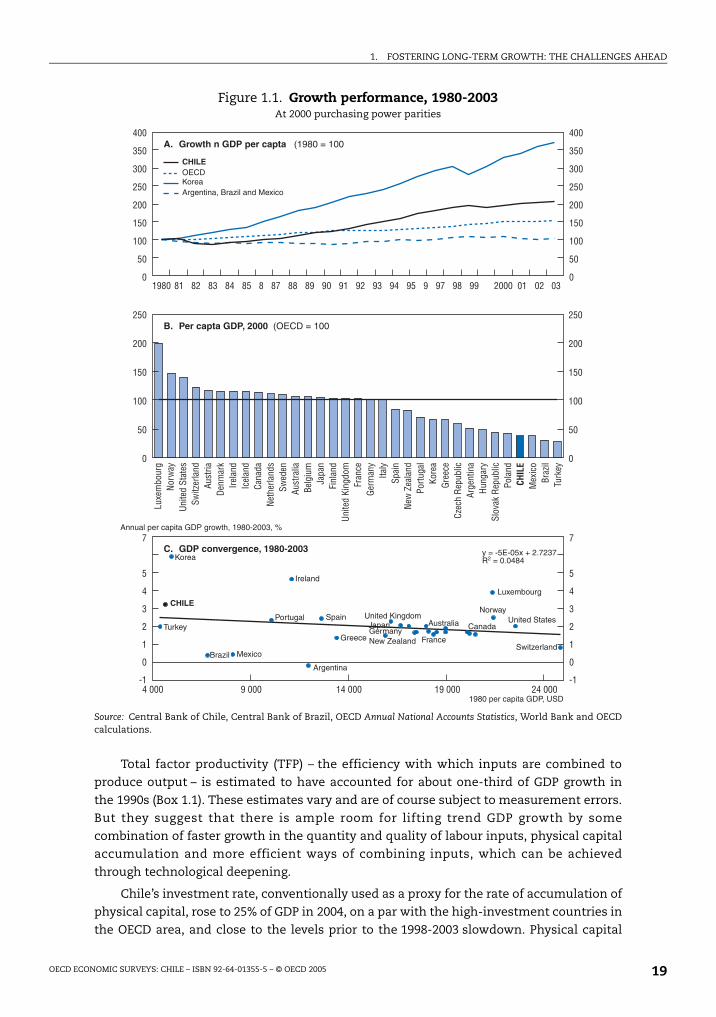
Chile’s growth performance was particularly strong during 1985-97 (Figure 1.1).1 This
period is often referred to as Chile’s “golden age”, with GDP growth averaging about 7% per
year and income per capita virtually doubling. This achievement contrasts with the Latin
American trend of economic stagnation and macroeconomic disarray during most of
the 1980s in the aftermath of the Debt Crisis. But Chile’s per capita income (measured in
purchasing power parity exchange rates) is currently at about 40% of the average OECD
income level, and less than 30% of that of the United States, leaving ample scope for
further catch-up in relative living standards in the years to come.
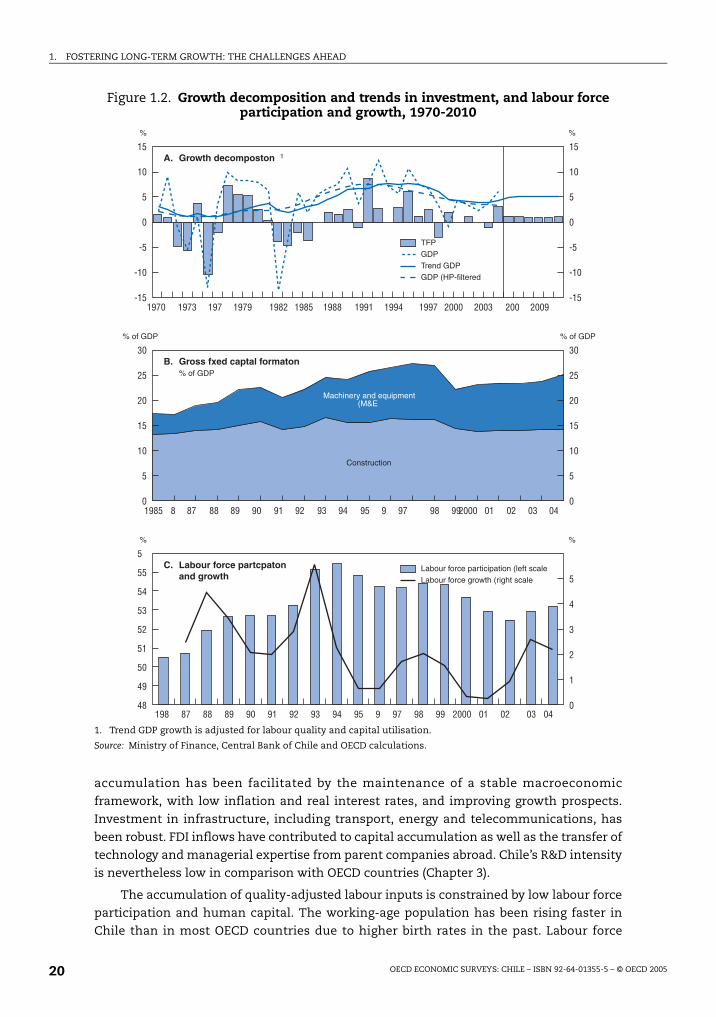
Trend GDP growth is recovering. Estimations provided by the expert committee
(Chapter 2), based on a production function approach akin to that used by the OECD for
member-countries, suggest that trend output – a more accurate measure of growth
performance over longer periods of time – has fallen gradually during the 1998-2003
slowdown to about 4.3% in 2004, considerably lower than during Chile’s “golden age”
(Figure 1.2). Other methodologies based on the univariate smoothing (e.g., Hodrick-Prescott
filtering) of annual growth rates also yield comparable estimates of trend GDP growth,
which is expected to pick up gradually towards 5% per year during 2004-10.2
1. FOSTERING LONG-TERM GROWTH: THE CHALLENGES AHEAD
OECD ECONOMIC SURVEYS: CHILE – ISBN 92-64-01355-5 – © OECD 2005 19
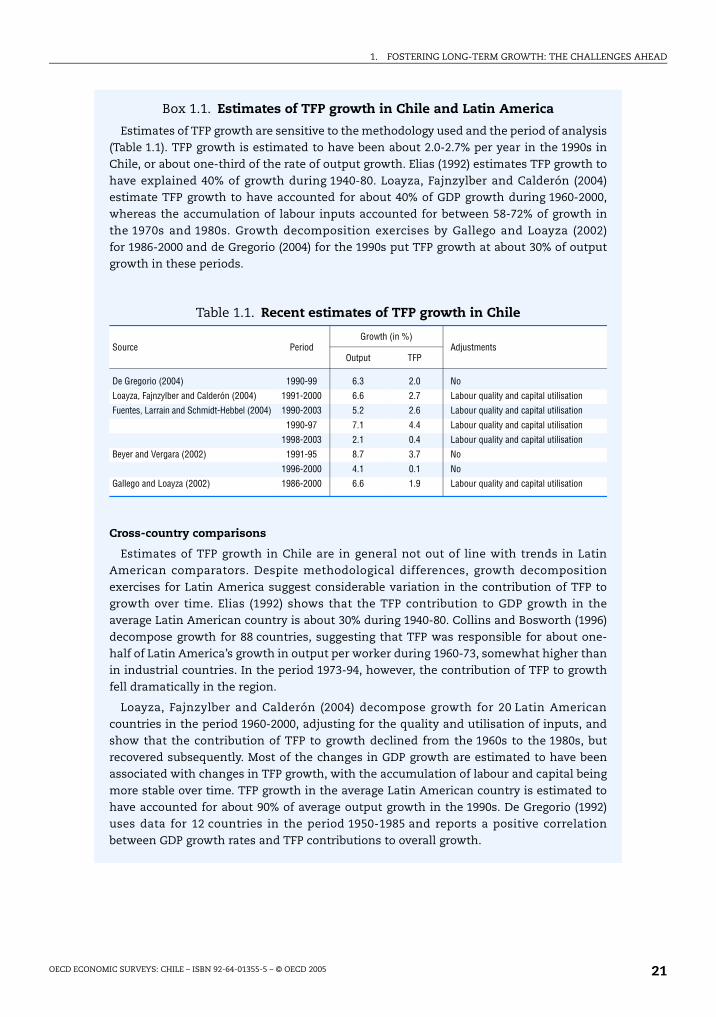
Total factor productivity (TFP) – the efficiency with which inputs are combined to
produce output – is estimated to have accounted for about one-third of GDP growth in
the 1990s (Box 1.1). These estimates vary and are of course subject to measurement errors.
But they suggest that there is ample room for lifting trend GDP growth by some
combination of faster growth in the quantity and quality of labour inputs, physical capital
accumulation and more efficient ways of combining inputs, which can be achieved
through technological deepening.
Chile’s investment rate, conventionally used as a proxy for the rate of accumulation of
physical capital, rose to 25% of GDP in 2004, on a par with the high-investment countries in
the OECD area, and close to the levels prior to the 1998-2003 slowdown. Physical capital
Figure 1.1. Growth performance, 1980-2003At 2000 purchasing power parities
Source: Central Bank of Chile, Central Bank of Brazil, OECD Annual National Accounts Statistics, World Bank and OECDcalculations.
!"
!# $%&'(
#
)&
!
*
'($%
+,-
-..(/ 01 !12 033
4(56
7-8&*9
*%&
&
:
9
7;&
8&#&5<5-
!
"
#
$
%
&"
&'"
(
)
"
# "
*"
+,
-"
.
-
'/
&
",
0
"
1
".
/'
(!
')2,
"'
#
3
"4
%2,
"'
1"
5
'
*!"
6%
8*
1. FOSTERING LONG-TERM GROWTH: THE CHALLENGES AHEAD
OECD ECONOMIC SURVEYS: CHILE – ISBN 92-64-01355-5 – © OECD 200520
accumulation has been facilitated by the maintenance of a stable macroeconomic
framework, with low inflation and real interest rates, and improving growth prospects.
Investment in infrastructure, including transport, energy and telecommunications, has
been robust. FDI inflows have contributed to capital accumulation as well as the transfer of
technology and managerial expertise from parent companies abroad. Chile’s R&D intensity
is nevertheless low in comparison with OECD countries (Chapter 3).
The accumulation of quality-adjusted labour inputs is constrained by low labour force
participation and human capital. The working-age population has been rising faster in
Chile than in most OECD countries due to higher birth rates in the past. Labour force
Figure 1.2. Growth decomposition and trends in investment, and labour force participation and growth, 1970-2010
1. Trend GDP growth is adjusted for labour quality and capital utilisation.
Source: Ministry of Finance, Central Bank of Chile and OECD calculations.
"
"
"=
"
"=
"
"#$
+:+&>=&
$$%&"'%#"=
9
'-&?5'@
()%"
46==946=9
1. FOSTERING LONG-TERM GROWTH: THE CHALLENGES AHEAD
OECD ECONOMIC SURVEYS: CHILE – ISBN 92-64-01355-5 – © OECD 2005 21
Box 1.1. Estimates of TFP growth in Chile and Latin America
Estimates of TFP growth are sensitive to the methodology used and the period of analysis(Table 1.1). TFP growth is estimated to have been about 2.0-2.7% per year in the 1990s inChile, or about one-third of the rate of output growth. Elias (1992) estimates TFP growth tohave explained 40% of growth during 1940-80. Loayza, Fajnzylber and Calderón (2004)estimate TFP growth to have accounted for about 40% of GDP growth during 1960-2000,whereas the accumulation of labour inputs accounted for between 58-72% of growth inthe 1970s and 1980s. Growth decomposition exercises by Gallego and Loayza (2002)for 1986-2000 and de Gregorio (2004) for the 1990s put TFP growth at about 30% of outputgrowth in these periods.
Cross-country comparisons
Estimates of TFP growth in Chile are in general not out of line with trends in LatinAmerican comparators. Despite methodological differences, growth decompositionexercises for Latin America suggest considerable variation in the contribution of TFP togrowth over time. Elias (1992) shows that the TFP contribution to GDP growth in theaverage Latin American country is about 30% during 1940-80. Collins and Bosworth (1996)decompose growth for 88 countries, suggesting that TFP was responsible for about one-half of Latin America’s growth in output per worker during 1960-73, somewhat higher thanin industrial countries. In the period 1973-94, however, the contribution of TFP to growthfell dramatically in the region.
Loayza, Fajnzylber and Calderón (2004) decompose growth for 20 Latin Americancountries in the period 1960-2000, adjusting for the quality and utilisation of inputs, andshow that the contribution of TFP to growth declined from the 1960s to the 1980s, butrecovered subsequently. Most of the changes in GDP growth are estimated to have beenassociated with changes in TFP growth, with the accumulation of labour and capital beingmore stable over time. TFP growth in the average Latin American country is estimated tohave accounted for about 90% of average output growth in the 1990s. De Gregorio (1992)uses data for 12 countries in the period 1950-1985 and reports a positive correlationbetween GDP growth rates and TFP contributions to overall growth.
Table 1.1. Recent estimates of TFP growth in Chile
Source PeriodGrowth (in %)
AdjustmentsOutput TFP
De Gregorio (2004) 1990-99 6.3 2.0 No
Loayza, Fajnzylber and Calderón (2004) 1991-2000 6.6 2.7 Labour quality and capital utilisation
Fuentes, Larrain and Schmidt-Hebbel (2004) 1990-2003 5.2 2.6 Labour quality and capital utilisation
1990-97 7.1 4.4 Labour quality and capital utilisation
1998-2003 2.1 0.4 Labour quality and capital utilisation
Beyer and Vergara (2002) 1991-95 8.7 3.7 No
1996-2000 4.1 0.1 No
Gallego and Loayza (2002) 1986-2000 6.6 1.9 Labour quality and capital utilisation
1. FOSTERING LONG-TERM GROWTH: THE CHALLENGES AHEAD
OECD ECONOMIC SURVEYS: CHILE – ISBN 92-64-01355-5 – © OECD 200522
participation is nevertheless low by international experience, although it rose particularly
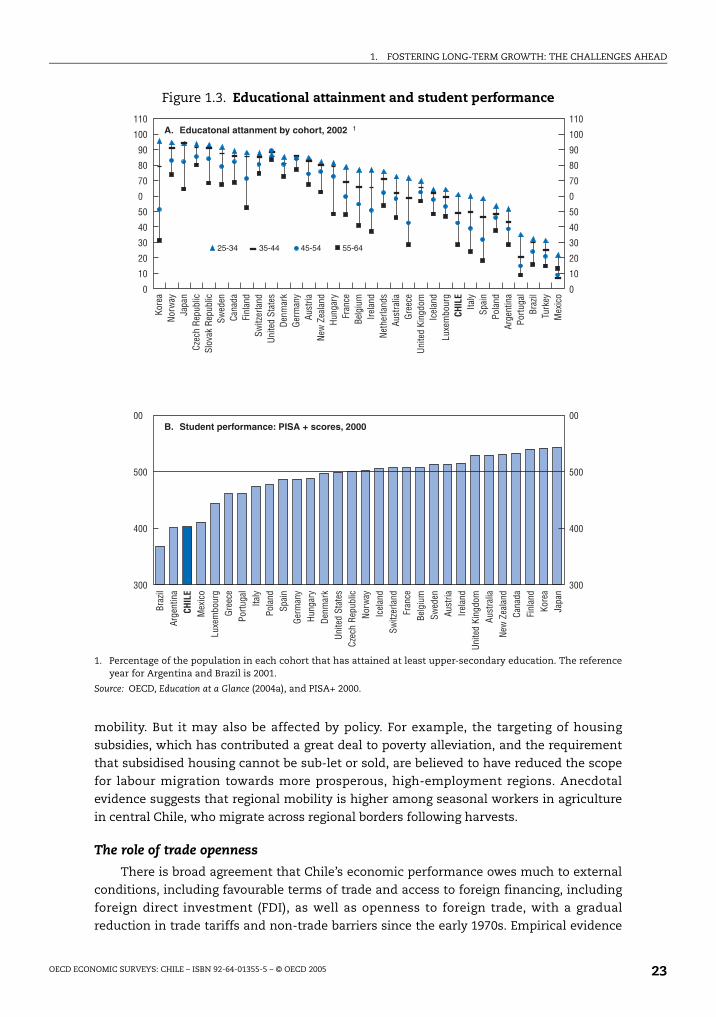
fast in the early 1990s, especially for females.3 The quality of labour inputs has improved
(Figure 1.3), as far as gauged by the increase in educational attainment over the years. But
other countries have outperformed Chile in this regard: upper-secondary school
attainment rates are much higher for younger cohorts in countries such as Greece, and
especially Korea, which nevertheless have similar enrolment rates for older cohorts. The
stock of human capital remains comparatively low: as noted in Chapter 5, Chile’s
population aged 25-64 years had on average less than 10 years of schooling in 2002,
compared with an OECD average of nearly 12 years. The quality of education is also low, as
evidenced by Chile’s relatively poor performance in standardised tests, such as PISA.
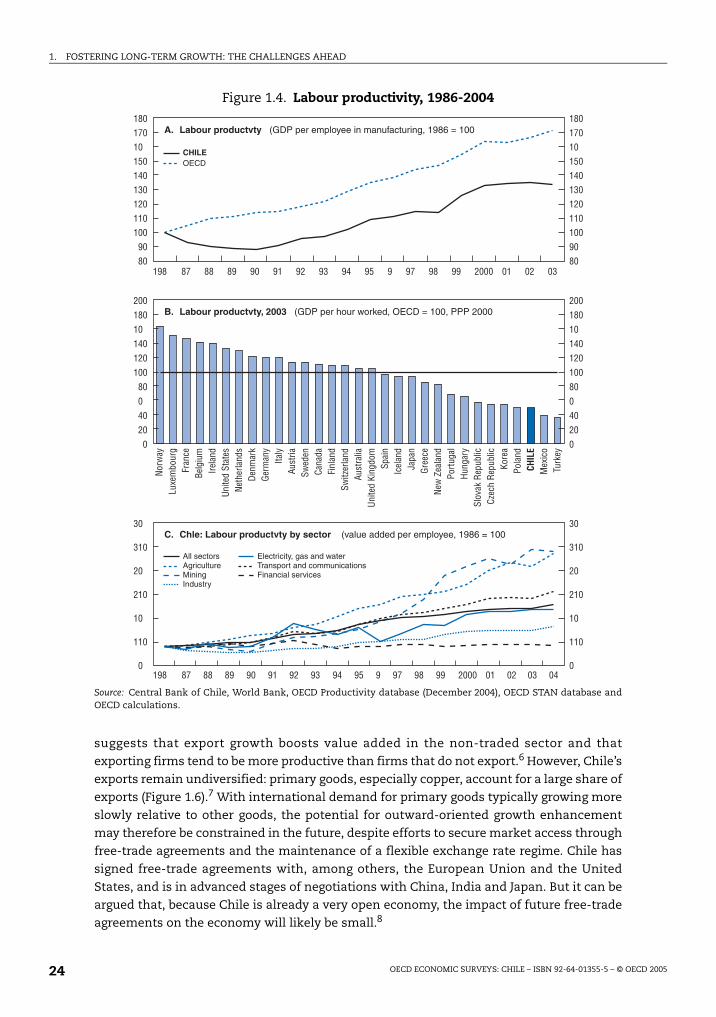
Labour productivity has risen in Chilean manufacturing over time but not as fast as
the OECD average (Figure 1.4). This is a cause for concern, because failure to close the
productivity gap results in the perpetuation of cross-country income differentials.
However, there are important differences in productivity trends across sectors;
productivity has risen faster in mining and agriculture, now the most dynamic sectors in
the Chilean economy. Anecdotal evidence suggests that labour productivity in mining and
some agribusiness activities is already close to the levels observed in the best performing
countries in the OECD area. But in other sectors, such as industry, financial services and
some network industries, such as electricity, gas and water, productivity gains have been
more modest. This underscores the scope for improvement in these sectors, and services
in general, including through further structural reform, as discussed below. The
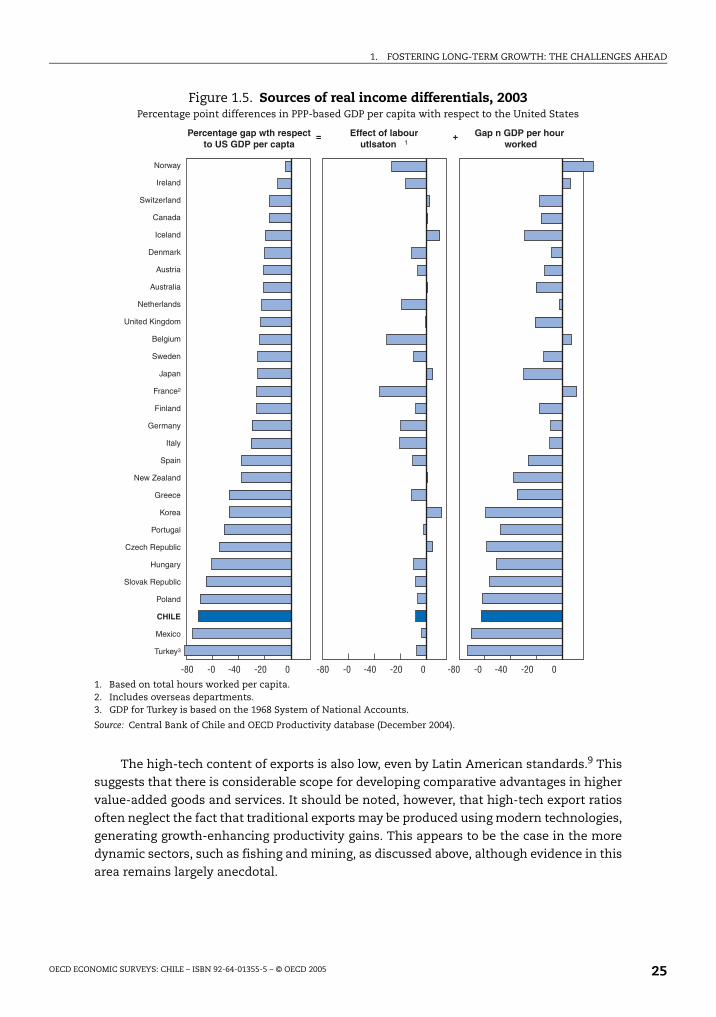
decomposition of Chile’s income gap reflects lower labour productivity, but also lower
labour utilisation, owing to lower labour force participation, particularly for females, which
is only offset in part by longer working hours (Figure 1.5).4
To reduce current regional disparities, higher labour mobility would contribute to
increasing the speed of convergence in relative living standards among the Chilean
regions.5 During 1997-2002, only about 1% of the population moved between regions in a
given year, a relatively small share even by Latin American standards (Chapter 5). The
degree of regional specialisation of economic activity among the 13 Chilean regions – with
a predominance of mining in the North, agriculture and fishing in the South, and industry
and services in the Metropolitan Region of Santiago – poses constraints on regional labour
Box 1.1. Estimates of TFP growth in Chile and Latin America (cont.)
A few caveats
Growth accounting has obvious limitations. The main caveat is that the measurement ofthe TFP component of GDP growth is sensitive to measurement errors because it iscalculated by definition as a residual (i.e., the difference between output growth and aweighted average of the growth rates of both the quantity and quality of factors ofproduction). As a result, for example, TFP will be overestimated if improvements in thequality of capital or labour are underestimated. For example, failure to account forimprovements in educational attainment tends to overestimate the contribution of TFP togrowth. Estimates of TFP growth are also pro-cyclical to the extent that inputs areunderutilised during cyclical downturns. This is the case of the calculation of TFP growthin Chile, as reported by the expert committee, because the unemployment rate is used asa proxy for capital utilisation due to data constraints.
1. FOSTERING LONG-TERM GROWTH: THE CHALLENGES AHEAD
OECD ECONOMIC SURVEYS: CHILE – ISBN 92-64-01355-5 – © OECD 2005 23
mobility. But it may also be affected by policy. For example, the targeting of housing
subsidies, which has contributed a great deal to poverty alleviation, and the requirement
that subsidised housing cannot be sub-let or sold, are believed to have reduced the scope
for labour migration towards more prosperous, high-employment regions. Anecdotal
evidence suggests that regional mobility is higher among seasonal workers in agriculture
in central Chile, who migrate across regional borders following harvests.
The role of trade openness
There is broad agreement that Chile’s economic performance owes much to external
conditions, including favourable terms of trade and access to foreign financing, including
foreign direct investment (FDI), as well as openness to foreign trade, with a gradual
reduction in trade tariffs and non-trade barriers since the early 1970s. Empirical evidence
Figure 1.3. Educational attainment and student performance
1. Percentage of the population in each cohort that has attained at least upper-secondary education. The referenceyear for Argentina and Brazil is 2001.
Source: OECD, Education at a Glance (2004a), and PISA+ 2000.
.!3 !.33 3..3 ..A3
!")'#(*
.
+,
(!
')2,
"'
"4
%2,
"'
(
-"
!"
$
%
/
#
0"
3
-
'*
"
&"
)
"
#
"
/'
.
&'"
&"
,
1"
#
1
"*
!"
6%
5'
+)"%#,+-$$
.
+,
(!')2,
"'
(
!
"
$
%
/
#
0"
3
-
'*
"
&"
# "
/'
.
&'"
,
1"
#
*!"
5'
-"
&"
1
"
1. FOSTERING LONG-TERM GROWTH: THE CHALLENGES AHEAD
OECD ECONOMIC SURVEYS: CHILE – ISBN 92-64-01355-5 – © OECD 200524
suggests that export growth boosts value added in the non-traded sector and that
exporting firms tend to be more productive than firms that do not export.6 However, Chile’s
exports remain undiversified: primary goods, especially copper, account for a large share of
exports (Figure 1.6).7 With international demand for primary goods typically growing more
slowly relative to other goods, the potential for outward-oriented growth enhancement
may therefore be constrained in the future, despite efforts to secure market access through
free-trade agreements and the maintenance of a flexible exchange rate regime. Chile has
signed free-trade agreements with, among others, the European Union and the United
States, and is in advanced stages of negotiations with China, India and Japan. But it can be
argued that, because Chile is already a very open economy, the impact of future free-trade
agreements on the economy will likely be small.8
Figure 1.4. Labour productivity, 1986-2004
Source: Central Bank of Chile, World Bank, OECD Productivity database (December 2004), OECD STAN database andOECD calculations.
()")*,&
', ()")*(*$B&&&5-A
()")*5-5=A
!
!
"
#
$
%
&"
&'"
(
)
"
# "
*"
+,
-"
.
-
'
/
&
"
,
0
"
1
"
.
/'
(!'
)2,
"'
3
"4
%2,
"'
1"
5
'
6%
99 ')&9-
-9&+9&559:9B9
1. FOSTERING LONG-TERM GROWTH: THE CHALLENGES AHEAD
OECD ECONOMIC SURVEYS: CHILE – ISBN 92-64-01355-5 – © OECD 2005 25
The high-tech content of exports is also low, even by Latin American standards.9 This
suggests that there is considerable scope for developing comparative advantages in higher
value-added goods and services. It should be noted, however, that high-tech export ratios
often neglect the fact that traditional exports may be produced using modern technologies,
generating growth-enhancing productivity gains. This appears to be the case in the more
dynamic sectors, such as fishing and mining, as discussed above, although evidence in this
area remains largely anecdotal.
Figure 1.5. Sources of real income differentials, 2003Percentage point differences in PPP-based GDP per capita with respect to the United States
1. Based on total hours worked per capita.2. Includes overseas departments.3. GDP for Turkey is based on the 1968 System of National Accounts.
Source: Central Bank of Chile and OECD Productivity database (December 2004).
7-
)&
*%&
&
)&
5,
9
9
7&9
8&#&5
$5
*&
<
:
:&
5-
)-
*
7;&
#
%26
>-
*B,26
&
!
'(
+,-!
$.+
!%%%'())'$
)/"
-0

1. FOSTERING LONG-TERM GROWTH: THE CHALLENGES AHEAD
OECD ECONOMIC SURVEYS: CHILE – ISBN 92-64-01355-5 – © OECD 200526
The challenges aheadChile’s overarching policy challenge is to maintain GDP growth at a sustained high
pace over the longer term to ensure a faster catch-up in relative living standards. This can
be achieved by encouraging innovative activity, continuing to foster pro-competition
regulation, particularly in network industries, and lifting labour force participation and
productivity. These policy areas are interdependent and the actions to be taken are
mutually reinforcing, creating synergies. Sustainable growth also depends on raising
Chile’s environmental standards (Box 1.2). The greatest long-term gains would be expected
from progress in accumulating human capital, where Chile lags the most.
Encouraging innovation (Chapter 3)
Innovation is important for long-term economic growth because it affects not only
labour productivity but also the efficiency with which inputs are combined. The scope for
Figure 1.6. Concentration and technological content of exports, 1996-2005
1. Refers to 6-month moving averages. Export concentration is defined as the Herfindahl index using disaggregatedexport data.
2. Exports with high technological content refer to ISIC Rev. 3 codes 353, 2423, 30, 32 and 33; and exports withmedium-high technological content refer to ISIC Rev. 3 codes 31, 34, 24 (except 2423), 352, 359 and 29.
Source: Central Bank of Chile, OECD STAN database, UN Commodity Trade Statistics database (UN Comtrade) andOECD calculations.
"
7
7
7
7
7
7
7
7
7
7
7
7
!&
1''%#)%)&$
=(96-&*=(9
+"
+7
+"
+7
+"
+7
+"
+7
+"
+7
+"
+7
+"
+7
+"
+7
+"
+7
+"
>'&5
&"
+,
5'
!
"
.
/
3
89(
$-
'.
9,
*"
)
"
(!
')2,
"'
,
(
#
$
%
&"
-"
"4
%2,
"'
1
"
1"
*!"
# "
6%
/'
#
0"
&'"

1. FOSTERING LONG-TERM GROWTH: THE CHALLENGES AHEAD
OECD ECONOMIC SURVEYS: CHILE – ISBN 92-64-01355-5 – © OECD 2005 27
growth enhancement is highest to the extent that the social returns to innovation exceed
the private returns earned by the innovator. Chile already fulfils a number of framework
conditions to facilitate the diffusion of knowledge. First and foremost, macroeconomic
performance has been robust, with stable inflation and low real interest rates. Also, as
discussed in detail in the 2003 Survey, FDI legislation is relatively investor-friendly, and
product market regulations (PMR) are reasonably pro-competition. Moreover, Chile’s liberal
trade regime facilitates access to foreign technology embedded in imported capital goods
and inputs, which are important conduits for the diffusion of knowledge.
However, innovation activity has a few deterrents. R&D intensity – the usual metric for
innovation – is comparatively low, at about 0.7% of GDP in 2002, and financed primarily by
the government. Empirical evidence for OECD countries suggests that it is business, rather
than government-financed, spending on innovation that is most growth-enhancing. The
business sector in OECD countries spent on average about 1.4% of GDP on R&D in 2001,
about double the level of non-business spending. About 30% of government spending on
R&D in Chile is directed to pure research, although it can be argued that government
support for applied research may be more cost-effective and conducive to the diffusion of
innovation and the creation of network externalities. Innovation policy is formulated and
implemented in a fragmented manner, with a multiplicity of funds for the delivery of
government support. Risk and venture capital markets provide important sources of
external financing for innovation, but are relatively underdeveloped in Chile.
Unsurprisingly, low R&D intensity is reflected in a relatively poor innovation performance,
at least as gauged by the number of triadic patents (i.e., those approved in the United
States, and filed in Japan and the European Union) held by Chileans.10
Box 1.2. Environment Performance Review: Challenges and recommendations
Chile has strengthened its institutions and policies to protect the environment notablysince the establishment of the National Environment Commission (CONAMA) in 1994.CONAMA coordinates the government’s environmental policies, prepares environmentalregulations and fosters integration of environmental concerns in other policy areas. Muchof Chile’s progress in this area since the early 1990s has been driven by concern about theimpact of pollution on the health status of the population and the need for corporateenvironmental responsibility, particularly in firms exporting to OECD countries.
An important achievement has been the reduction in air pollution, although it remainsa serious problem in the Metropolitan Region of Santiago and in the mining areas. Generalemission standards for industrial processes and emitters of toxic air contaminants arelacking. Water pollution has also fallen but quality in some water bodies remains poor, andthere are no water quality objectives.
The authorities are aware of the gap in environmental standards that exists betweenChile and the OECD countries. Challenges remain in strengthening environmentalmanagement and integrating environmental concerns in sectoral policies. To meet thesechallenges, it will be necessary for Chile to: i) thoroughly and efficiently implement itsenvironmental policies; ii) further integrate environmental concerns into economic, socialand sectoral policy decisions; and iii) strengthen its international environmentalcooperation.
Source: OECD (2005a).
1. FOSTERING LONG-TERM GROWTH: THE CHALLENGES AHEAD
OECD ECONOMIC SURVEYS: CHILE – ISBN 92-64-01355-5 – © OECD 200528
To secure additional financing for spending on R&D, the government intends to use
revenue from the mining tax introduced in May 2005. This is to be combined with an
overhaul of the country’s National Innovation System, aiming primarily at fostering policy
coordination and long-term planning. Introduction of the mining tax was justified on the
basis of the non-renewable nature of these natural resources (Box 1.3): the authorities felt
that the payment of a mining tax ensures that the government receives a nominal
payment for the depletion of a non-renewable resource. A previous attempt to introduce a
mining tax was met by stiff congressional resistance and failed to be approved in 2004. The
mining companies were also believed not to be paying their fair share of taxes as they have
been making use of accelerated depreciation rules allowed under the original investment
covenants to reduce their taxable income. The mining companies viewed the proposal with
suspicion, despite assurances by the authorities that the change in legislation was not an
attempt to retroactively change the investment regime.
While growth-enhancing, the gap between social and private returns to innovation
creates a market failure. Private investment in innovation would therefore fall short of the
socially desirable level. But the disincentive for private innovation can be mitigated at least
in part by protecting intellectual property rights (IPR), although the role of IPR protection in
fostering innovation is far from clear-cut.11 In the case of Chile, although IPR legislation is
reasonably investor-friendly, copyrights are poorly enforced. While strong IPR protection
may encourage technology transfers by foreign investors, which are an important vehicle
for the diffusion of innovation, it can limit access to necessary knowledge or research tools,
or allow patenting to be used as a strategic barrier to potential competitors. Judgement
over the appropriate strength of IPR protection therefore needs to be finely balanced.
The market failures associated with innovation motivate policy action in a number of
OECD countries.12 In the case of Chile, the key policy challenge in this area is to select
among different, often competing, alternatives for strengthening innovation performance
those which are most cost-effective and with the greatest potential for encouraging the
business sector to engage in innovation activities. For example, direct government support
can be effective, especially when firms face financial constraints. It is difficult to assess the
effectiveness of government incentives, but tax relief for private R&D can also provide a
stimulus for innovation, while bearing in mind that there are no “best practices” in this
area.
Strengthening the regulatory framework (Chapter 4)
There is broad evidence that policies and institutional settings that foster product
market competition play a key role in influencing firms to seek efficiency gains by adopting
either technological or organisational best practices. On the basis of the OECD
methodology for quantifying product market restrictions (PMR), reported in the
2003 Survey, there appears to be reasonably robust economy-wide competitive pressures in
Chile, whose score is on a par with those of Brazil and Mexico, the Latin American
comparators for which information is currently available, and the average of emerging
markets in the OECD area. All these countries still have a long way to go before reaching the
level of competition of countries with the least restrictive product market environments,
such as the United States.
Anti-trust regulations and institutions have been strengthened.13 The Chilean
authorities place improved competition enforcement high on their growth agenda as a
means to stimulate greater efficiency. It is probably too soon to assess the role of the new
1. FOSTERING LONG-TERM GROWTH: THE CHALLENGES AHEAD
OECD ECONOMIC SURVEYS: CHILE – ISBN 92-64-01355-5 – © OECD 2005 29
Box 1.3. Taxation of mining: General principles, the Chilean legislation and international experience
General principles
While mining can be treated identically to other sectors in the economy, special taxtreatment is provided in most countries. This is because mining activities are inherentlyrisky, capital intensive (and hence costly) and vulnerable to fluctuations in commodityprices. There are several instruments for taxing mining, with some variation acrossminerals and levels of government. Sales-based taxes are used extensively in differentstages of production, including exploration and extraction, because they are simpler toadminister and, most importantly, due to the fact that mining companies do not alwaysgenerate taxable profits. Therefore, the payment of a mining tax ensures that thegovernment receives at least a nominal payment for the depletion of a non-renewableresource. Several countries offer tax incentives, including tax holidays and notional taxdeductions, but the revenue yield of mining taxes and royalties also depends on theefficiency of tax administration.
Chile’s new legislation
Legislation was approved by Congress on May 18, 2005 introducing a 5% tax on theoperating (after normal depreciation) profits of mining companies with sales above50 000 equivalent tonnes of copper (metallic and non-metallic minerals). Enterprises withsales below 12 000 tonnes are exempted, and those with sales between 12 000 and50 000 tonnes will have different statutory rates: 0.5% for sales between 12 000 and15 000 and a 0.5 percentage point increase in the rate for every 5 000 tonnes soldthereafter, up to 4.5% for enterprises with sales between 40 000 and 50 000. Revenues willbe allocated to a fund for innovation (discussed in Chapter 3) with 15% of disbursementsassigned to the mining regions and 10% for the other regions. In exchange for renouncingDL 600 – a guarantee to foreign investors of invariable tax treatment for 10-20 years inexchange for a higher income tax rate, discussed in the 2003 Survey – the miningcompanies will have a reduction of the tax rate to 4% and a guarantee of fixed taxtreatment for 12 years.
International experience
In Argentina, in the case of most minerals, mining is liable for the payment of a licensefee and a royalty. There is also a minimum investment requirement. A new framework forinvestment in the mining sector was set up in 1993, including guaranteed stability in taxregimes and rates for 30 years, as well as in foreign exchange and customs treatment, withthe exception of exchange rate and tax reimbursements, drawbacks and refunds linked toexports. Prospecting and exploration expenses are income tax deductible, as well as anenvironment conservation allowance of up to 5% of operating costs.
In Australia, the two major mining states, Queensland and Western Australia, which areheavily reliant on the mining industry for export and government revenue, have similarlegislation on mining royalties. Western Australia introduced a royalty on gold in 1997,which had hitherto been exempted from taxation. Royalties are based on a gross sales,rather than profit. Some minerals are rated at a fixed amount per tonne produced, whereasothers are rated on an ad valorem basis, with rates ranging between 2.5-7.5% of saleproceeds with a minimum value per tonne for certain minerals. In addition to royalties,tenement holders pay annual rents based of land area and type of tenement (i.e, lease,exploration or prospecting licence, etc.). Royalty revenue is earmarked for Aboriginalpeople living in remote communities in the Northern Territory. New South Wales isconsidering the introduction of a new mining royalty regime.
1. FOSTERING LONG-TERM GROWTH: THE CHALLENGES AHEAD
OECD ECONOMIC SURVEYS: CHILE – ISBN 92-64-01355-5 – © OECD 200530
Competition Tribunal, which replaced the Preventive and Antitrust Commissions in 2003,
in enhancing competition. But rulings are perceived to have become swifter since the
creation of the tribunal. Chile’s competition institutions have played an important role in
promoting competition in the network industries where they have a statutory mandate,
and Chile should ensure that those institutions have the opportunity and resources to
promote competition more broadly by providing input to other regulators on the likely
impact of regulations and consumer welfare. Among areas for further reform is the
enhancement of competition among banks and pension funds.
Much has been done over the years to strengthen the regulation of network industries.
Chile is on balance close to international best practice in this area, and appropriate
regulation has encouraged investment and facilitated access by the population to
affordable services. Nevertheless, there are areas where improvement is needed to
continue to strengthen pro-competition regulation, particularly in network industries. In
Box 1.3. Taxation of mining: General principles, the Chilean legislation and international experience (cont.)
In Brazil, the holder of a mining exploration license must pay rent for the use of land andcompensation to the landowner for any loss or damage caused by the mining activity.Royalties are set at a maximum rate of 3% of net sale proceeds obtained after the last stageof processing (prior to the manufacturing stage) and are payable to the regionaljurisdictions (states, municipalities or the Federal District) where the mining activity islocated. The landowner has the right to receive 50% of the royalties payable to the regionalgovernments.
In Canada, the provinces and territories having significant mining activities imposemining taxes, royalties and/or land taxes on mining operations within their jurisdictions.The provincial mining tax and royalty regimes are based primarily on net productionprofits, rather than net smelter returns. This is a different layer of taxation, separatefrom the federal and provincial/territorial income taxes. The federal and provincialgovernments provide a separate treatment for exploration and other intangible expensesand allow mining companies to recover most of their initial capital investment beforepaying a significant amount of tax. The income tax regime also provides for loss carry-overrules to help mitigate the negative financial effects of fluctuations in prices.
The introduction of mining royalties is being debated in South Africa, which appears tofavour a sales-based royalty regime similar to that of Australia. The mining royalty wouldbe implemented in 2009.
In the United States, mining on federal land, which accounts for more than one-third ofthe western United States, including Alaska and Hawaii, is regulated by the 1872 MiningLaw. There is no differentiated tax treatment for mining companies, and no royalty islevied for the exploitation of hard-rock minerals, unlike coal, oil and natural gas. There isan annual claim fee of USD 100 per year for each 20 acres, whether or not a mine is inoperation. A proposal was made in 1994 to introduce a royalty on hard-rock mining onfederal land motivated mainly by environmental concern. The government proposed theintroduction a gross royalty tax of 8% on sale proceeds of the processed mineral net ofoperating costs, the same royalty paid on coal extracted from federal lands. Royaltyproceeds would be earmarked for cleaning up environmental damage from abandonedmines. Congressional approval is still pending for the draft legislation submitted in 2003 tochange the tax regime for hard-rock mining.
1. FOSTERING LONG-TERM GROWTH: THE CHALLENGES AHEAD
OECD ECONOMIC SURVEYS: CHILE – ISBN 92-64-01355-5 – © OECD 2005 31
the electricity sector, it may be premature to assess the new law (Ley Corta I), in place since
early 2004. Progress is under way in setting transmission and distribution charges (to boost
competition within distribution zones) and unlocking opportunities for small generators.
New legislation was approved in May 2005 (Ley Corta II) to ensure the security of supply, in
view of recurrent cuts in gas shipments from Argentina. In water and sanitation, the main
deficiency of the current regulatory set-up is the burden it places on the expert panel in
charge of setting tariffs. Assessment is carried out for each enterprise independently and
for a large number of parameters, with ample margin for disagreement. The authorities
believe the diversity of extraction technologies across the country makes efficient-firm
regulation difficult, although it could be strengthened. In telecommunications, the central
regulatory issue is how to foster competition while simultaneously setting efficient prices
for dominant firms. The regulatory framework for transport infrastructure through public-
private partnerships is perceived as functioning well, although governance needs to be
improved to ensure that the projects to be granted government guarantees are the ones
with the highest social rates of return.
Raising labour productivity through human capital accumulation (Chapter 5)
To reduce Chile’s income gap, policy should focus primarily on raising labour
productivity, which can be achieved through human capital accumulation. To illustrate, an
increase in secondary school enrolment to the level of New Zealand, for example, is
estimated to raise Chile’s growth rate by 0.8 percentage point per year.14 An increase in
education performance, rather than school enrolment, would result in even faster growth:
empirical evidence for a sample of countries suggests that an increase in Chile’s
performance in education (measured by standardised international test scores) to the level
of the world’s top performers (i.e., those countries in the top decile of the world’s
distribution, including Korea, for example) would increase annual growth by
1.5 percentage points.15 Although these estimates should be interpreted with caution –
because they are affected by measurement errors and methodological differences in
estimation techniques, among other reasons – they underscore the scope for growth
enhancement associated with policies aimed at encouraging human capital accumulation.
Annex 1.A3 reports the actions taken or proposed by the authorities following the
recommendations made in the 2003 Survey for reform in education.
Access to education has improved considerably over time, but more could be done in
higher education. The reforms implemented since the early-1980s, and discussed in the
2003 Survey, notably with the introduction of targeted subsidies for education, have led to
a rapid increase in primary and lower-secondary school enrolment and, consequently, in
the average years of education of the labour force. The 2003 constitutional reform, which
raised the duration of compulsory education from 8 to 12 years, will contribute to further
increasing average years of schooling to the extent that bottlenecks are not created in the
school system and that students face the correct incentives to stay at school, in particular
the poorer ones, who are most likely to drop out.
The quality of education also needs to improve. Despite the increase in primary and
secondary school enrolment over time, Chile’s education performance is far below the
OECD average, although not out of line with that of the emerging market economies in the
OECD area and Latin America. This indicates a quality problem that needs to be addressed
on its own, as the link between public spending and social outcomes is often weak.
Countries that perform better than Chile may simply have spent more on social
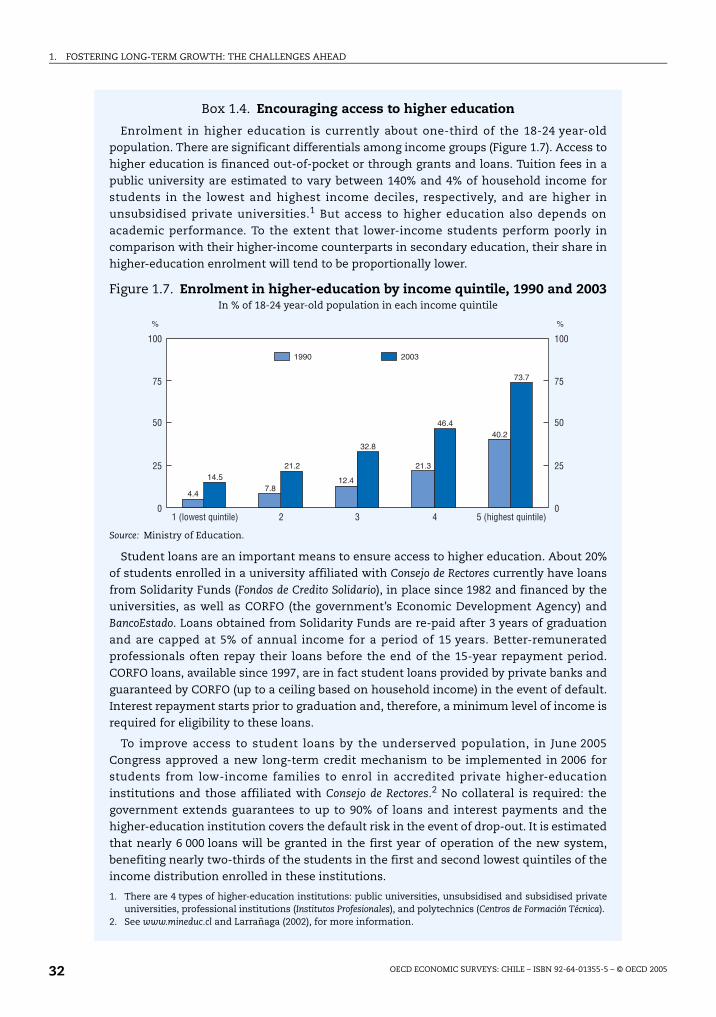
1. FOSTERING LONG-TERM GROWTH: THE CHALLENGES AHEAD
OECD ECONOMIC SURVEYS: CHILE – ISBN 92-64-01355-5 – © OECD 200532
Box 1.4. Encouraging access to higher education
Enrolment in higher education is currently about one-third of the 18-24 year-oldpopulation. There are significant differentials among income groups (Figure 1.7). Access tohigher education is financed out-of-pocket or through grants and loans. Tuition fees in apublic university are estimated to vary between 140% and 4% of household income forstudents in the lowest and highest income deciles, respectively, and are higher inunsubsidised private universities.1 But access to higher education also depends onacademic performance. To the extent that lower-income students perform poorly incomparison with their higher-income counterparts in secondary education, their share inhigher-education enrolment will tend to be proportionally lower.
Figure 1.7. Enrolment in higher-education by income quintile, 1990 and 2003In % of 18-24 year-old population in each income quintile
Source: Ministry of Education.
Student loans are an important means to ensure access to higher education. About 20%of students enrolled in a university affiliated with Consejo de Rectores currently have loansfrom Solidarity Funds (Fondos de Credito Solidario), in place since 1982 and financed by theuniversities, as well as CORFO (the government’s Economic Development Agency) andBancoEstado. Loans obtained from Solidarity Funds are re-paid after 3 years of graduationand are capped at 5% of annual income for a period of 15 years. Better-remuneratedprofessionals often repay their loans before the end of the 15-year repayment period.CORFO loans, available since 1997, are in fact student loans provided by private banks andguaranteed by CORFO (up to a ceiling based on household income) in the event of default.Interest repayment starts prior to graduation and, therefore, a minimum level of income isrequired for eligibility to these loans.
To improve access to student loans by the underserved population, in June 2005Congress approved a new long-term credit mechanism to be implemented in 2006 forstudents from low-income families to enrol in accredited private higher-educationinstitutions and those affiliated with Consejo de Rectores.2 No collateral is required: thegovernment extends guarantees to up to 90% of loans and interest payments and thehigher-education institution covers the default risk in the event of drop-out. It is estimatedthat nearly 6 000 loans will be granted in the first year of operation of the new system,benefiting nearly two-thirds of the students in the first and second lowest quintiles of theincome distribution enrolled in these institutions.
1. There are 4 types of higher-education institutions: public universities, unsubsidised and subsidised privateuniversities, professional institutions (Institutos Profesionales), and polytechnics (Centros de Formación Técnica).
2. See www.mineduc.cl and Larrañaga (2002), for more information.
" "
!
303
30.10
0
03
! 0
0!
3A0330
1!01
:" ;"< :)) ;"<
1. FOSTERING LONG-TERM GROWTH: THE CHALLENGES AHEAD
OECD ECONOMIC SURVEYS: CHILE – ISBN 92-64-01355-5 – © OECD 2005 33
programmes on a cumulative basis over longer periods. More importantly, indicators have
not improved over the years in tandem with the increase in public spending on education.
The increase in public spending is expected to result in an improvement in performance as
long as it complemented by efforts to raise the quality of spending. The authorities are
working towards strengthening the incentives for efficiency gains and improving the
quality of primary education (1st to 4th grades) by introducing a Differentiated Voucher
Scheme (Subvención Educacional Preferencial) within the current funding mechanism for
schools that adhere to the new programme and set targets for academic performance. This
is a welcome development. The lengthening of the school hours (Jornada Escolar Completa),
although not yet fully implemented, may contribute to improving the quality of education
services to the extent that students enrolled in full-time schools are expected to perform
better than part-timers. In any case, a trade-off between quantity and quality over the
medium term should not be expected.
Chile’s higher-education attainment also compares unfavourably with the OECD area.
While this reflects to a large extent an income gap, educational attainment is also
estimated to be below the level that would be predicted on the basis of Chile’s income level.
This higher-education deficit is particularly acute in science and technology, hampering
Chile’s ability to engage in innovation activities, as discussed in Chapter 3. The higher-
education deficit is also more pronounced for lower-income individuals, affecting their
earnings potential and perpetuating income inequality in an already very unequal society.
This is against a background of high estimated returns: at age 50, a male holding a higher-
education degree is estimated to earn nearly 4 times as much as an individual with 8 years
of formal education.16 Higher-education enrolment rates range from 14.5% in the lowest
income quintile to 73.7% in the top income quintile.17 Disparities in higher-education
enrolment reflect inequality of access and gaps in academic performance across income
groups (Box 1.4).
Because the educational attainment of the population is low, effort is needed to
improve the skills of those already in the labour force. This can do much to increase labour
force mobility and to remove unskilled adults from poverty traps. Currently only about
one-fifth of dependent employees receive on-the-job training. Job training is financed
through SENCE, an official fund, through tax relief, but is voluntary and reserved for the
formal sector, thus covering a limited share of the labour force.18 As discussed in Chapter 5,
the dual structure of the labour market is an obstacle to training, because temporary
workers have limited career prospects, while workers with permanent contracts may lack
incentives to improve qualifications because they know that their jobs are secure.
Notes
1. For more information on growth trends in Chile from a historical perspective, see Loayza and Soto(2002) and de Gregorio (2004).
2. This is calculated by dividing estimated annual TFP growth (about 2%) by the share of labour inGDP (about 60%) and subsequently adding the rate of growth of the population (1.7% per yearin 2002-04. See Ministry of Finance (2005), for more information on the calculation of TFP growth.
3. It is argued that Chile’s female labour force participation is consistent with the level predicted by across-sectional regression including as control variables other determinants of participation, suchas fertility rates and income distribution (Central Bank of Chile, 2005, Chapter IV; Tokman, 2005).
4. Information on hours worked is not readily available for Chile on an annual basis. As an estimate,the number of annual hours worked in 2003 was calculated using data provided by INE on normal
1. FOSTERING LONG-TERM GROWTH: THE CHALLENGES AHEAD
OECD ECONOMIC SURVEYS: CHILE – ISBN 92-64-01355-5 – © OECD 200534
hours worked per week, multiplied by 52, minus Sundays and one-half of Saturdays. Based on thiscalculation, the average annual hours worked in 2003 was 1 877 in Chile, against the OECD averageof 1 731.
5. Using a dynamic panel of the 13 Chilean regions during 1975-2000, Soto and Torche (2004) findevidence of convergence in both per capita income and labour productivity, but the results forlabour productivity are not robust to the exclusion of mining from regional GDP. Duncan andFuentes (2005) estimate the speed of convergence to be less than 1% per year, regardless of modelspecification and when mining is not controlled for, which is somewhat higher than thatestimated by Soto and Torche (2004).
6. See García et al. (1996), for more information.
7. As a result, the intensity of intra-industry trade (i.e., the share of total trade that is conductedamong related products) is low. See OECD (2003a) and Oliveira Martins and Price (2004), for acomparison of intra-industry trade and revealed comparative advantages in Argentina, Brazil,Chile, and Mexico.
8. See Chumacero et al. (2004), for more information. Chile’s MFN tariff has been set at a uniform ratesince 1979, reaching 6% in 2003. But the average effective tariff was less than 2% at the beginningof 2004 as a result of trade agreements, covering about two-thirds of exports.
9. See Lederman and Maloney (2003) for empirical evidence that export concentration, not only innatural resources, affects growth performance adversely.
10. The choice of triadic, rather than domestic, patents as an indicator of innovation output is due tothe fact that they are likely to have a higher (and more uniform) value since the patentee is willingto take on the additional costs and delay related to the extension of protection to other countries.Cross-country comparability is also facilitated by the fact that triadic patents have been submittedto the same criteria of innovativeness in all three patenting offices.
11. See Boldrin and Levine (2002), for more information.
12. See OECD (2003b, 2005b), for more information.
13. See Paredes (2001) and OECD (2004b), for more information.
14. See Tokman (2004), for more information and empirical evidence.
15. See Gallego and Loayza (2002), for more information and empirical evidence.
16. See Huneeus and Repetto (2004), for empirical evidence.
17. See Tokman (2004) and Brunner and Elacqua (2003), for more information.
18. See Espinosa (2001), for more information on labour training in small enterprises.
Bibliography
Beyer, H. and R. Vergara (2002), “Productivity and Economic Growth”, in N. Loayza and R. Soto (eds.),Economic Growth: Sources, Trends, and Cycles, Central Bank of Chile, Santiago.
Boldrin, M. and D.K. Levine (2002), “The Case Against Intellectual Property”, American Economic Review,Vol. 92, pp. 209-12.
Brunner, J.J. and G. Elacqua (2003), Capital Humano en Chile, Universidad Adolfo Ibañez, Santiago.
Caballero, R., K. Cowan and J. Kearns (2004), “Fear of Sudden Stops: Lessons from Australia and Chile”,NBER Working Paper, No. 10519, National Bureau of Economic Research, Cambridge, MA.
Calvo, G. and E. Talvi (2005), “Sudden Stops, Financial Factors and Economic Collapse in Latin America:Learning from Argentina and Chile”, NBER Working Paper, No. 11153, National Bureau of EconomicResearch, Cambridge, MA.
Central Bank of Chile (2005), Informe de Política Monetaria, May, Central Bank of Chile, Santiago.
Chumacero, R.A., R. Fuentes and K. Schmidt-Hebbel (2004), “Chile’s Free Trade Agreements: How Big isthe Deal?”, Working Paper, No. 264, Central Bank of Chile, Santiago.
Collins, S.M. and B. Bosworth (1996), “Economic Growth in East Asia: Accumulation versusAssimilation”, Brooking Papers on Economic Activity, Vol. 2, pp. 135-91.
Duncan, R. and Fuentes, J.R. (2005), “Convergencia Regional en Chile: Nuevos Tests, Viejos Resultados”,Working Paper, No. 313, Central Bank of Chile, Santiago.
1. FOSTERING LONG-TERM GROWTH: THE CHALLENGES AHEAD
OECD ECONOMIC SURVEYS: CHILE – ISBN 92-64-01355-5 – © OECD 2005 35
de Gregorio, J. (1992), “Economic Growth in Latin America.”, Journal of Development Economics, Vol. 39,No. 1, pp. 59-84.
de Gregorio, J. (2004), “Economic Growth in Chile: Evidence, Sources, and Prospects”, Unpublishedmanuscript, Central Bank of Chile, Santiago.
Eichengreen, B., R. Hausmann and U. Panizza (2003), “Currency Mismatches, Debt intolerance, andOriginal Sin: Why They Are Not the Same and Why It Matters”, NBER Working Paper, No. 10036,National Bureau of Economic Research, Cambridge, MA.
Elias, V. (1992), Sources of Growth: A Study of Seven Latin American Economies, ICS Press, San Francisco, CA.
Espinosa, M. (2001), “Encuesta a Micro y Pequeñas Enpresas: El Caso de Chile”, ILO InFocus Programme:Boosting Employment through Small Enterprise Development, Santiago.
Fuentes, R., M. Larraín and K. Schmidt-Hebbel (2004), “Fuentes del Crecimiento y Comportamiento dela Productividad Total de Factores en Chile,”Unpublished manuscript, Central Bank of Chile, Santiago.
Gallego, F. and N. Loayza (2002), “La Epoca Dorada del Crecimiento en Chile: Un ProblemaFinanciero,”Revista de Economía Chilena, Vol. 5, pp. 37-63.
García, P., P. Meller and A. Repetto (1996), “Las Exportaciones como Motor de Crecimiento: La EvidenciaChilena” in P. Meller (ed.) El Modelo Exportador Chileno, Crecimiento y Equidad, CIEPLAN, Santiago.
Hamilton, J.D. (1989), “A New Approach to the Economic Analysis of Non-Stationary Time Series andthe Business Cycle”, Econometrica, Vol. 57, pp. 357-84.
Huneeus, C. and A. Repetto (2004), “The Dynamics of Earnings in Chile”, Paper prepared for the 2003Central Bank of Chile Annual Conference, Central Bank of Chile, Santiago.
Larrañaga, O. (2002), “Elementos para una Reforma del Sistema de Crédito Estudiantil en Chile”,Working Paper, No. 189, Economics Department, University of Chile, Santiago.
Lederman, D. and W.F. Maloney (2003), “Trade Structure and Growth”, Unpublished manuscript, WorldBank, Washington, DC.
Lima, V.O. and R.D. Paredes (2004), “Labour Market Regimes and Mobility in Chile”, Unpublishedmanuscript, Universidad Católica de Chile, Santiago.
Loayza, N. and R. Soto (eds.) (2002), Economic Growth: Sources, Trends, and Cycles, Central Bank of Chile,Santiago.
Loayza, N., P. Fajnzylber and C. Calderón (2004), “Economic Growth in Latin America and theCaribbean: Stylised Facts, Explanations, and Forecasts”, Working Paper, No. 265, Central Bank ofChile, Santiago.
Ministry of Finance (2005), Acta Resultados del Comité Consultivo del PIB Tendencial, Budget Office,Santiago.
OECD (2003a), OECD Economic Survey of Chile, OECD, Paris.
OECD (2003b), The Sources of Economic Growth in OECD Countries, OECD, Paris.
OECD (2004a), Education at a Glance, OECD, Paris.
OECD (2004b), Competition Law and Policy in Chile, OECD, Paris.
OECD (2005a), OECD Environmental Performance Reviews: Chile, OECD, Paris.
OECD (2005b), Innovation in the Business Sector, Internal OECD document, OECD, Paris.
Oliveira Martins, J.O. and T. Price (2004), “How Market Imperfections and Trade Barriers ShapeSpecialisation: South America versus OECD”, in OECD, Trade and Competitiveness in Argentina, Brazil,and Chile, OECD, Paris.
Paredes, R. (2001), “Desafíos para a Institucionalidad de Monopolios en Chile”, in H. Bayer andR. Vergara (eds.), Qué Hacer Ahora? Propuestas para el Desarrollo, Centro de Estudios Públicos,Santiago.
Soto, R. and A. Torche (2004), “Spatial Inequality after Reforms in Chile: Where do We Stand?”,Instituto de Economía, Catholic University of Chile, Unpublished manuscript, Santiago.
Tokman, A. (2004), “Educación y Crecimiento en Chile”, Working Paper, No. 289, Central Bank of Chile,Santiago.
Tokman, A. (2005), “Participación Laboral en Chile”, Unpublished manuscript, Central Bank of Chile,Santiago.
1. FOSTERING LONG-TERM GROWTH: THE CHALLENGES AHEAD
OECD ECONOMIC SURVEYS: CHILE – ISBN 92-64-01355-5 – © OECD 200536
ANNEX 1.A1
Identifying turning points in Chile’s economic growth
This Annex applies to Chilean data a conventional technique developed by Hamilton
(1989) for identifying turning points in the business cycle based on a probability law that
governs shifts from high- to low-mean regimes using a Markov switching process.
Attention is focused on GDP growth, economic activity, and unemployment since the
mid-1980s.
The technique can be summarised briefly as follows. The economy is described by a given
indicator yt (i.e., GDP growth, industrial production, etc.) which can have two unobservable
states: a high-mean state (i.e., cyclical upturn), defined by st = 1, and a low-mean state
(i.e., cyclical downturn), defined by st = 2, where . The transition between the
two states follows a first-order Markov chain, such that p(st = j | st–1 = i) = pij, and ,
for all i. The probability law for yt is described by parameter , for st = 1,..., K.
Because only yt is observable, the switch from one state to another is carried out by
maximising the likelihood function of the observable indicator by
choosing θ and making inferences about the state of the economy.
Three quarterly series are used: seasonally-adjusted GDP (available from BCCh) for the
period 1986:Q3-2004:Q3; seasonally-adjusted economic activity (IMACEC, available from
BCCh) for the period 1986:Q3-2004:Q3; and seasonally-adjusted unemployment (available
from INE) for the period 1986:Q4-2004:Q3. Quarterly data were constructed using the
original monthly series.
Table 1.A1.1 reports the probability estimates. The means are nearly twice as large in
the high-mean state than in the low-mean state for GDP and industrial production,
denoting considerable differences between the two states. For example, industrial
production grows by 1.9% per quarter during an average expansion and by 0.8% per quarter
in an average downturn. The estimated probability that an upturn will continue, is high, at
97%. This suggests that an upturn lasts about 8 years (33 quarters), calculated as 1/(1 – p11).
This high estimated probability is due to the fact that the period under examination covers
most of Chile’s high growth period (1985-97). Due to data constraints, it is not possible to
re-estimate these probabilities for a longer time series.
The actual switching dates between states can be calculated for a given probability
threshold. For example, a switching date can be identified whenever the probability that
the economy will stay in the same regime is less than, say, 50% (i.e., st = 1 is selected
whenever p(st = 1) > 0.5). The probabilities that the economy will remain in the high-mean
regime are shown in Figure 1.A2.1. Taking 50% as the threshold probability, and using GDP
as the indicator, there seems to be a cyclical downturn in 1986:Q3, 1987:Q2-1987:Q3,
),(~tt sst Ns Ωµ
∑ ==
K
j ijp1
1),,( p
tt ss Ω= µθ
);,...,,( 11 θyyyp TT −
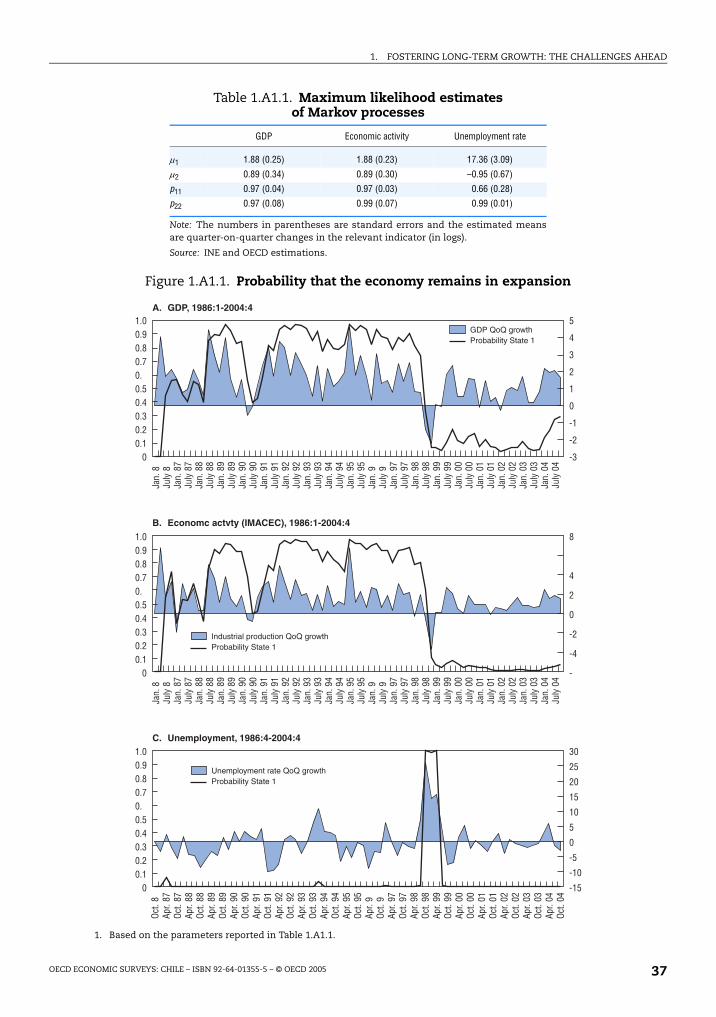
1. FOSTERING LONG-TERM GROWTH: THE CHALLENGES AHEAD
OECD ECONOMIC SURVEYS: CHILE – ISBN 92-64-01355-5 – © OECD 2005 37
Table 1.A1.1. Maximum likelihood estimates of Markov processes
Note: The numbers in parentheses are standard errors and the estimated meansare quarter-on-quarter changes in the relevant indicator (in logs).
Source: INE and OECD estimations.
GDP Economic activity Unemployment rate
µ1 1.88 (0.25) 1.88 (0.23) 17.36 (3.09)
µ2 0.89 (0.34) 0.89 (0.30) –0.95 (0.67)
p11 0.97 (0.04) 0.97 (0.03) 0.66 (0.28)
p22 0.97 (0.08) 0.99 (0.07) 0.99 (0.01)
Figure 1.A1.1. Probability that the economy remains in expansion
1. Based on the parameters reported in Table 1.A1.1.
7777777777
7777777777
7777777777
8'7
#,
7
8'7
2,3,3
+7
+"
!#*45!62,3,3
.#'*#2,33,3
CC66-*
)&9&CC66-*
85-5CC66-*
+7
+"
+7
+"
+7
+"
+7
+"
+7
+"
+7
+"
+7
+"
+7
+"
+7
+"
+7
+"
+7
+"
+7
+"
+7
+"
+7
+"
+7
+"
+7
+"
+7
+"
+7
+"
+7
+"
+7
+"
+7
+"
+7
+"
+7
+"
+7
+"
+7
+"
+7
+"
+7
+"
+7
+"
+7
+"
+7
+"
+7
+"
+7
+"
+7
+"
+7
+"
+7
+"
+7
+"
+7
+"
#,7
8'7
#,
7
8'7
#,
7
8'7
#,
7
8'7
#,
7
8'7
#,
7
8'7
#,
7
8'7
#,
7
8'7
#,
7
8'7
#,
7
8'7
#,
7
8'7
#,
7
8'7
#,
7
8'7
#,
7
8'7
#,
7
8'7
#,
7
8'7
#,
7
8'7
1. FOSTERING LONG-TERM GROWTH: THE CHALLENGES AHEAD
OECD ECONOMIC SURVEYS: CHILE – ISBN 92-64-01355-5 – © OECD 200538
1988:Q2, 1990:Q3-1990:Q4, and 1998:Q3 to present, although the probability of a regime
switch has been rising since end-2003. By mid-2004 the probability of a switch to the high-
mean regime is estimated to have reached 30%. The chronology of cyclical downturns is
comparable when economic activity is used as the indicator.
For unemployment, there appears to have been a short high-mean spell
during 1998:Q3-1999:Q1. This finding is consistent with that reported by Lima and Paredes
(2004), who estimate Markov transition probabilities for switching labour market status
based on data from the Employment and Unemployment Surveys for Greater Santiago
during 1957-2003. The authors show that the increase in unemployment following the
Russian crisis in 1998 is explained essentially on cyclical grounds and by the increase in the
minimum wage during 1998-2000.
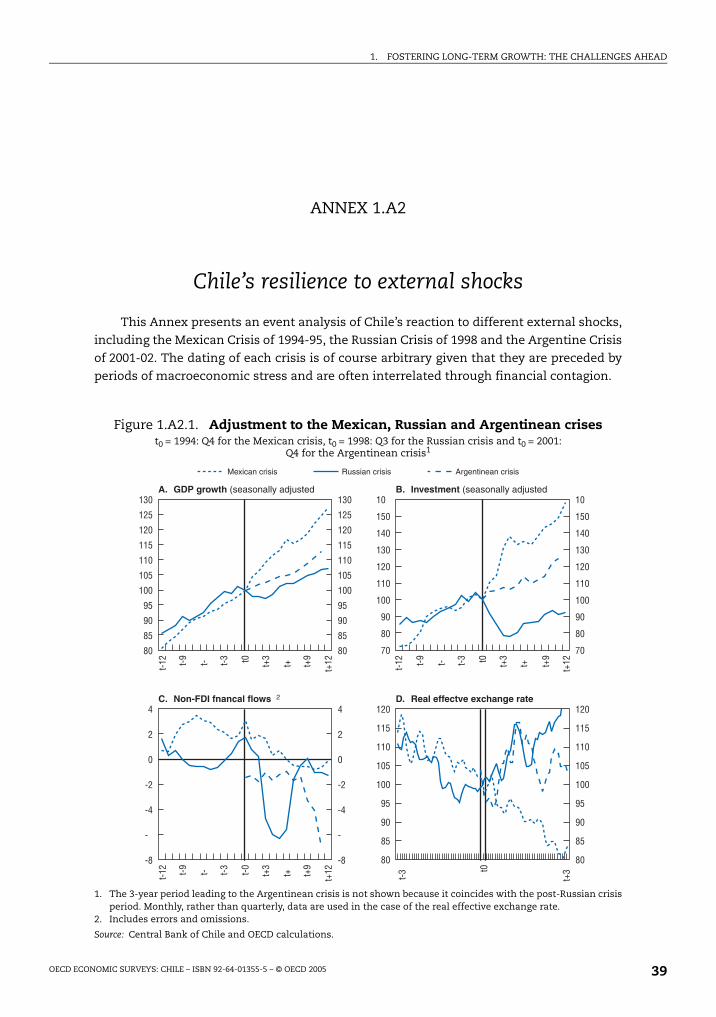
1. FOSTERING LONG-TERM GROWTH: THE CHALLENGES AHEAD
OECD ECONOMIC SURVEYS: CHILE – ISBN 92-64-01355-5 – © OECD 2005 39
ANNEX 1.A2
Chile’s resilience to external shocks
This Annex presents an event analysis of Chile’s reaction to different external shocks,
including the Mexican Crisis of 1994-95, the Russian Crisis of 1998 and the Argentine Crisis
of 2001-02. The dating of each crisis is of course arbitrary given that they are preceded by
periods of macroeconomic stress and are often interrelated through financial contagion.
Figure 1.A2.1. Adjustment to the Mexican, Russian and Argentinean crisest0 = 1994: Q4 for the Mexican crisis, t0 = 1998: Q3 for the Russian crisis and t0 = 2001:
Q4 for the Argentinean crisis1
1. The 3-year period leading to the Argentinean crisis is not shown because it coincides with the post-Russian crisisperiod. Monthly, rather than quarterly, data are used in the case of the real effective exchange rate.
2. Includes errors and omissions.
Source: Central Bank of Chile and OECD calculations.
99-&D9& $#99-&D9&
'(99 29999 99
=
=
=
=
78 %'%'$ 9'%%&
=
=
=
=
=
=
=
=
=
1. FOSTERING LONG-TERM GROWTH: THE CHALLENGES AHEAD
OECD ECONOMIC SURVEYS: CHILE – ISBN 92-64-01355-5 – © OECD 200540
Chile weathered the effects of the Mexican crisis of 1994-95 rather well, aided by an
improvement in the terms of trade in 1995, but the 1998 Russian Crisis appears to have
taken a toll on growth (Figure 1.A2.1). Strong macroeconomic performance has made the
economy more resilient since then and Chile managed to escape contagion from the
Argentinean Crisis of 2001-02, as well as the financial market turbulence in Brazil in late-
2002, with seemingly no lasting detrimental effect on growth. The contraction in non-FDI
financial inflows following the Russian crisis, which was considerably sharper than after
the Mexican and Argentinean crises, does appear to have had a more substantial bearing
on the economy.1 Chile’s macroeconomic adjustment in the aftermath of the Russian
Crisis, with a sizeable reversal in the external current account position, achieved
predominantly on the back of a retrenchment in investment, rather than a surge in saving,
and a marked slowdown in economic activity, was akin to that of other Latin American
countries. This underscores the region’s, including Chile’s, albeit to a lesser extent,
continued vulnerability to external shocks, despite some greater resilience in many
countries as a result of macroeconomic adjustment in the 1990s.
In the case of the Russian Crisis, policies may have exacerbated the post-crisis cyclical
downturn, making it more protracted. The targeting of the exchange rate, which Chile
abandoned only in September 1999, called for a tightening of the monetary stance at the
time, deepening the post-crisis recession. This, coupled with a temporary increase in the
price of copper, put upward pressure on the peso. It has been argued that reluctance to let
the exchange rate play a stabilising role in response to an adverse external shock, often
related to “fear of floating”, was due to the absence of a well-developed currency
derivatives market, which could better insulate domestic credit from exchange rate risk in
countries that cannot borrow externally in their own currency.2
Notes
1. It should be noted that the reversal in non-FDI financial flows was exacerbated by a substantialincrease in pension fund assets abroad, facilitated by a change in prudential regulations raisingthe portfolio ceilings on foreign asset holdings. The acquisition of foreign assets by banks, bothdomestic and foreign-owned, was also substantial in the period. The reversal is less pronounced ifFDI is included in total financial flows.
2. See Eichengreen, Hausmann and Panizza (2003); Caballero, Cowan and Kearns (2004); and Calvoand Talvi (2005), for more information and discussion.
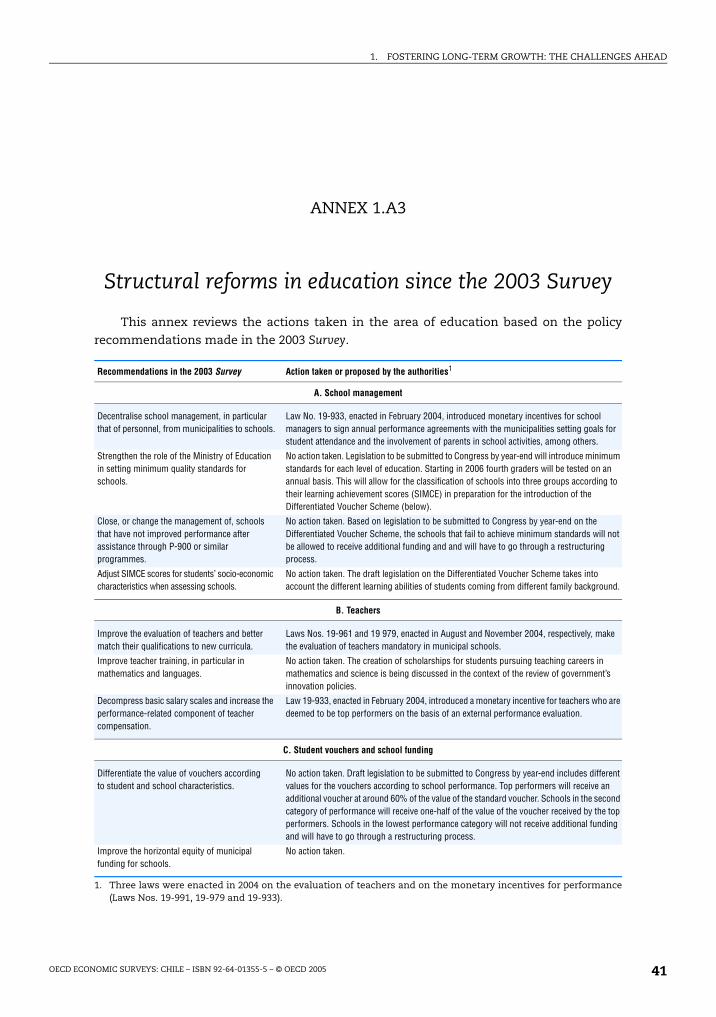
1. FOSTERING LONG-TERM GROWTH: THE CHALLENGES AHEAD
OECD ECONOMIC SURVEYS: CHILE – ISBN 92-64-01355-5 – © OECD 2005 41
ANNEX 1.A3
Structural reforms in education since the 2003 Survey
This annex reviews the actions taken in the area of education based on the policy
recommendations made in the 2003 Survey.
1. Three laws were enacted in 2004 on the evaluation of teachers and on the monetary incentives for performance(Laws Nos. 19-991, 19-979 and 19-933).
Recommendations in the 2003 Survey Action taken or proposed by the authorities1
A. School management
Decentralise school management, in particular that of personnel, from municipalities to schools.
Law No. 19-933, enacted in February 2004, introduced monetary incentives for school managers to sign annual performance agreements with the municipalities setting goals for student attendance and the involvement of parents in school activities, among others.
Strengthen the role of the Ministry of Education in setting minimum quality standards for schools.
No action taken. Legislation to be submitted to Congress by year-end will introduce minimum standards for each level of education. Starting in 2006 fourth graders will be tested on an annual basis. This will allow for the classification of schools into three groups according to their learning achievement scores (SIMCE) in preparation for the introduction of the Differentiated Voucher Scheme (below).
Close, or change the management of, schools that have not improved performance after assistance through P-900 or similar programmes.
No action taken. Based on legislation to be submitted to Congress by year-end on the Differentiated Voucher Scheme, the schools that fail to achieve minimum standards will not be allowed to receive additional funding and and will have to go through a restructuring process.
Adjust SIMCE scores for students’ socio-economic characteristics when assessing schools.
No action taken. The draft legislation on the Differentiated Voucher Scheme takes into account the different learning abilities of students coming from different family background.
B. Teachers
Improve the evaluation of teachers and better match their qualifications to new curricula.
Laws Nos. 19-961 and 19 979, enacted in August and November 2004, respectively, make the evaluation of teachers mandatory in municipal schools.
Improve teacher training, in particular in mathematics and languages.
No action taken. The creation of scholarships for students pursuing teaching careers in mathematics and science is being discussed in the context of the review of government’s innovation policies.
Decompress basic salary scales and increase the performance-related component of teacher compensation.
Law 19-933, enacted in February 2004, introduced a monetary incentive for teachers who are deemed to be top performers on the basis of an external performance evaluation.
C. Student vouchers and school funding
Differentiate the value of vouchers according to student and school characteristics.
No action taken. Draft legislation to be submitted to Congress by year-end includes different values for the vouchers according to school performance. Top performers will receive an additional voucher at around 60% of the value of the standard voucher. Schools in the second category of performance will receive one-half of the value of the voucher received by the top performers. Schools in the lowest performance category will not receive additional funding and will have to go through a restructuring process.
Improve the horizontal equity of municipal funding for schools.
No action taken.

ISBN 92-64-01355-5
OECD Economic Surveys: Chile
© OECD 2005
OECD ECONOMIC SURVEYS: CHILE – ISBN 92-64-01355-5 – © OECD 2005 43
Chapter 2
Entrenching macroeconomic stability
Chile’s macroeconomic management has been exemplary. With the recovery nowfirmly established, monetary policy is returning to a more neutral stance in line withthe convergence of inflation expectations towards the mid-point of the inflationtarget range. The key macroeconomic challenge is to entrench fiscal rectitude, giventhat the structural budget surplus rule adopted in 2000 is not embedded in law andfuture administrations may choose to abandon it. Pressures for greater fiscalactivism should not be underestimated in the future in an environment of relativelylow public indebtedness and in view of the need to satisfy multiple social demands.It is also important to deal with the contingencies associated with the pensionsystem, in the light of continued low density of contributions. This can be addressedby pre-funding these contingencies, benefiting from the currently healthy fiscalposition. Debt management could aim for further reductions in USD and inflation-indexed debt, contributing to the development of a domestic peso-denominatedfixed-income market.
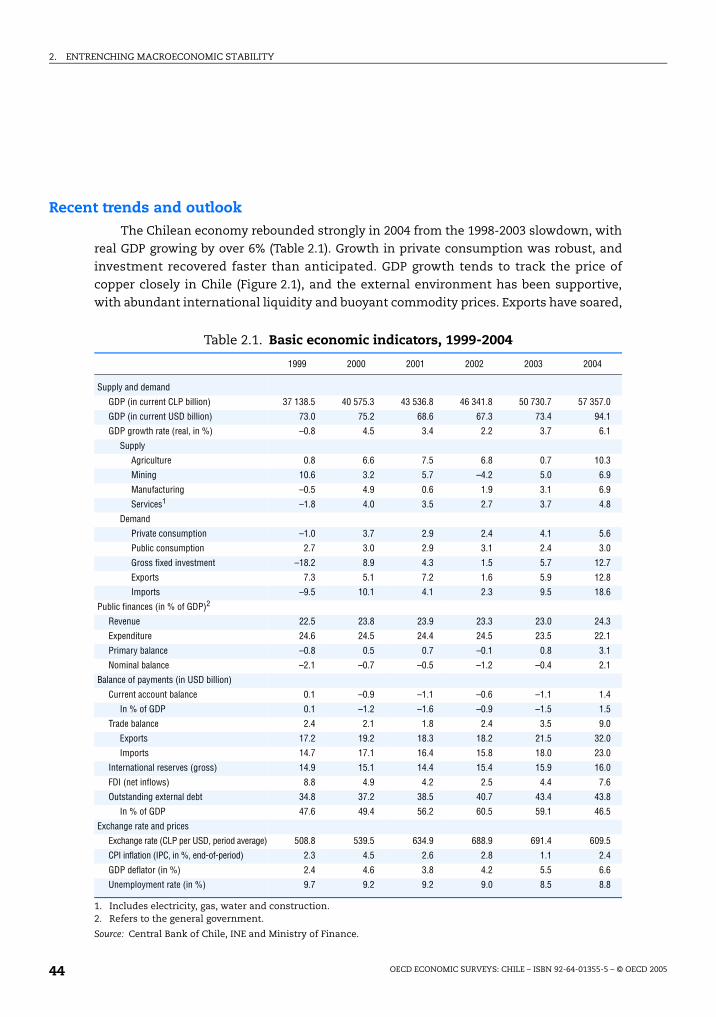
2. ENTRENCHING MACROECONOMIC STABILITY
OECD ECONOMIC SURVEYS: CHILE – ISBN 92-64-01355-5 – © OECD 200544
Recent trends and outlookThe Chilean economy rebounded strongly in 2004 from the 1998-2003 slowdown, with
real GDP growing by over 6% (Table 2.1). Growth in private consumption was robust, and
investment recovered faster than anticipated. GDP growth tends to track the price of
copper closely in Chile (Figure 2.1), and the external environment has been supportive,
with abundant international liquidity and buoyant commodity prices. Exports have soared,
Table 2.1. Basic economic indicators, 1999-2004
1. Includes electricity, gas, water and construction.2. Refers to the general government.
Source: Central Bank of Chile, INE and Ministry of Finance.
1999 2000 2001 2002 2003 2004
Supply and demand
GDP (in current CLP billion) 37 138.5 40 575.3 43 536.8 46 341.8 50 730.7 57 357.0
GDP (in current USD billion) 73.0 75.2 68.6 67.3 73.4 94.1
GDP growth rate (real, in %) –0.8 4.5 3.4 2.2 3.7 6.1
Supply
Agriculture 0.8 6.6 7.5 6.8 0.7 10.3
Mining 10.6 3.2 5.7 –4.2 5.0 6.9
Manufacturing –0.5 4.9 0.6 1.9 3.1 6.9
Services1 –1.8 4.0 3.5 2.7 3.7 4.8
Demand
Private consumption –1.0 3.7 2.9 2.4 4.1 5.6
Public consumption 2.7 3.0 2.9 3.1 2.4 3.0
Gross fixed investment –18.2 8.9 4.3 1.5 5.7 12.7
Exports 7.3 5.1 7.2 1.6 5.9 12.8
Imports –9.5 10.1 4.1 2.3 9.5 18.6
Public finances (in % of GDP)2
Revenue 22.5 23.8 23.9 23.3 23.0 24.3
Expenditure 24.6 24.5 24.4 24.5 23.5 22.1
Primary balance –0.8 0.5 0.7 –0.1 0.8 3.1
Nominal balance –2.1 –0.7 –0.5 –1.2 –0.4 2.1
Balance of payments (in USD billion)
Current account balance 0.1 –0.9 –1.1 –0.6 –1.1 1.4
In % of GDP 0.1 –1.2 –1.6 –0.9 –1.5 1.5
Trade balance 2.4 2.1 1.8 2.4 3.5 9.0
Exports 17.2 19.2 18.3 18.2 21.5 32.0
Imports 14.7 17.1 16.4 15.8 18.0 23.0
International reserves (gross) 14.9 15.1 14.4 15.4 15.9 16.0
FDI (net inflows) 8.8 4.9 4.2 2.5 4.4 7.6
Outstanding external debt 34.8 37.2 38.5 40.7 43.4 43.8
In % of GDP 47.6 49.4 56.2 60.5 59.1 46.5
Exchange rate and prices
Exchange rate (CLP per USD, period average) 508.8 539.5 634.9 688.9 691.4 609.5
CPI inflation (IPC, in %, end-of-period) 2.3 4.5 2.6 2.8 1.1 2.4
GDP deflator (in %) 2.4 4.6 3.8 4.2 5.5 6.6
Unemployment rate (in %) 9.7 9.2 9.2 9.0 8.5 8.8
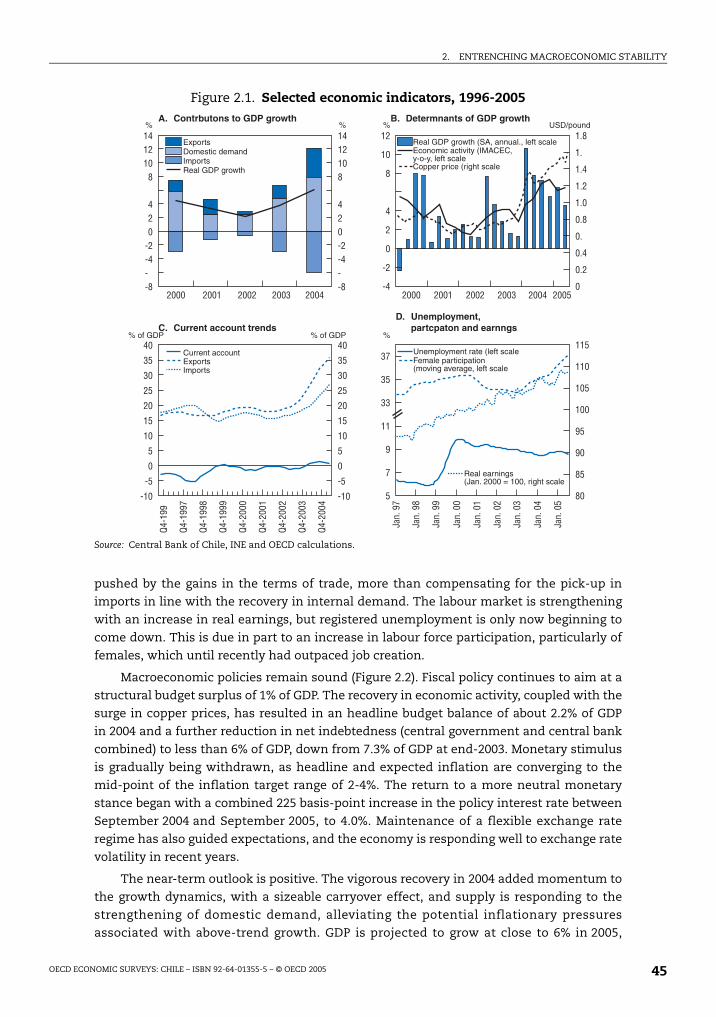
2. ENTRENCHING MACROECONOMIC STABILITY
OECD ECONOMIC SURVEYS: CHILE – ISBN 92-64-01355-5 – © OECD 2005 45
pushed by the gains in the terms of trade, more than compensating for the pick-up in
imports in line with the recovery in internal demand. The labour market is strengthening
with an increase in real earnings, but registered unemployment is only now beginning to
come down. This is due in part to an increase in labour force participation, particularly of
females, which until recently had outpaced job creation.
Macroeconomic policies remain sound (Figure 2.2). Fiscal policy continues to aim at a
structural budget surplus of 1% of GDP. The recovery in economic activity, coupled with the
surge in copper prices, has resulted in an headline budget balance of about 2.2% of GDP
in 2004 and a further reduction in net indebtedness (central government and central bank
combined) to less than 6% of GDP, down from 7.3% of GDP at end-2003. Monetary stimulus
is gradually being withdrawn, as headline and expected inflation are converging to the
mid-point of the inflation target range of 2-4%. The return to a more neutral monetary
stance began with a combined 225 basis-point increase in the policy interest rate between
September 2004 and September 2005, to 4.0%. Maintenance of a flexible exchange rate
regime has also guided expectations, and the economy is responding well to exchange rate
volatility in recent years.
The near-term outlook is positive. The vigorous recovery in 2004 added momentum to
the growth dynamics, with a sizeable carryover effect, and supply is responding to the
strengthening of domestic demand, alleviating the potential inflationary pressures
associated with above-trend growth. GDP is projected to grow at close to 6% in 2005,
Figure 2.1. Selected economic indicators, 1996-2005
Source: Central Bank of Chile, INE and OECD calculations.
7
7
7
7
7
7
7
7
7
" " 8*E&"
"= ""=
()$ #$%
))"$ .#'*#
"$
>
+7
(959&5&)592
>
>
>
>
>
>
>
>
+7
+7
+7
+7
+7
+7
+7
+7
2* 0=95B-)' --=99
(9)59
85-5=9:55BB=9
29<0 9
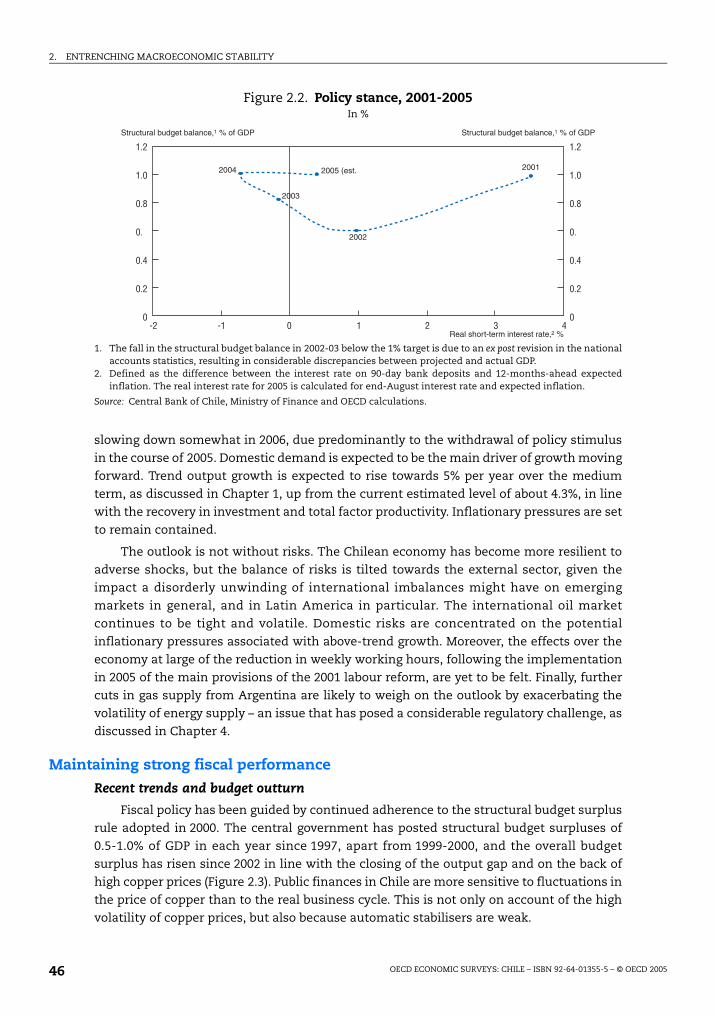
2. ENTRENCHING MACROECONOMIC STABILITY
OECD ECONOMIC SURVEYS: CHILE – ISBN 92-64-01355-5 – © OECD 200546
slowing down somewhat in 2006, due predominantly to the withdrawal of policy stimulus
in the course of 2005. Domestic demand is expected to be the main driver of growth moving
forward. Trend output growth is expected to rise towards 5% per year over the medium
term, as discussed in Chapter 1, up from the current estimated level of about 4.3%, in line
with the recovery in investment and total factor productivity. Inflationary pressures are set
to remain contained.
The outlook is not without risks. The Chilean economy has become more resilient to
adverse shocks, but the balance of risks is tilted towards the external sector, given the
impact a disorderly unwinding of international imbalances might have on emerging
markets in general, and in Latin America in particular. The international oil market
continues to be tight and volatile. Domestic risks are concentrated on the potential
inflationary pressures associated with above-trend growth. Moreover, the effects over the
economy at large of the reduction in weekly working hours, following the implementation
in 2005 of the main provisions of the 2001 labour reform, are yet to be felt. Finally, further
cuts in gas supply from Argentina are likely to weigh on the outlook by exacerbating the
volatility of energy supply – an issue that has posed a considerable regulatory challenge, as
discussed in Chapter 4.
Maintaining strong fiscal performance
Recent trends and budget outturn
Fiscal policy has been guided by continued adherence to the structural budget surplus
rule adopted in 2000. The central government has posted structural budget surpluses of
0.5-1.0% of GDP in each year since 1997, apart from 1999-2000, and the overall budget
surplus has risen since 2002 in line with the closing of the output gap and on the back of
high copper prices (Figure 2.3). Public finances in Chile are more sensitive to fluctuations in
the price of copper than to the real business cycle. This is not only on account of the high
volatility of copper prices, but also because automatic stabilisers are weak.
Figure 2.2. Policy stance, 2001-2005In %
1. The fall in the structural budget balance in 2002-03 below the 1% target is due to an ex post revision in the nationalaccounts statistics, resulting in considerable discrepancies between projected and actual GDP.
2. Defined as the difference between the interest rate on 90-day bank deposits and 12-months-ahead expectedinflation. The real interest rate for 2005 is calculated for end-August interest rate and expected inflation.
Source: Central Bank of Chile, Ministry of Finance and OECD calculations.
7
3
!
7
7
7
7
7
7
7
7
7
7
7
*6&6"=
2959 "
*6&6"=
.90

2. ENTRENCHING MACROECONOMIC STABILITY
OECD ECONOMIC SURVEYS: CHILE – ISBN 92-64-01355-5 – © OECD 2005 47
Public indebtedness has been reduced as a result of sustained fiscal prudence. The
consolidated public debt ratio (central government and central bank) fell steadily during
most of the 1990s (Table 2.2), subsequently trending upwards during 1998-2002, reflecting
a more accommodative fiscal stance in the course of the cyclical downswing and the fall in
the price of copper, and moving down further since then. Although still relatively low by
international comparison, the stock of debt is much higher when guaranteed debt to public
enterprises is included, as well as the recognition bonds issued to cover the transition costs
associated with the pension reform of the early 1980s and the liabilities of government-
owned enterprises.
Figure 2.3. Fiscal performance, 1990-2005
Source: Ministry of Finance and OECD calculations.
: 7<
7
7
7
7
7
7
7
7
7
7
7
7
7
7
7
7
7
7
7
7
7
7
7
7
7
7
7
7
7
7
7
7
7
7
7
7
7
7
7
7
7
7
7
7
7
7
: 7<
8$'$,'# #$%%$'$,
'#
-0&D06&6
==
-5
"$('$%)"
*6%:&=9
)*#$%'#$$$"'('$
! #$%'(/$$$"'('$
4&5&8*&5&7&6
469
999
"= "= "= "=
+9-&996,99
469
9997&6
)9B9+9-999
8*5
9
8*E&
$999-==
"= "="=
B6&6
"=
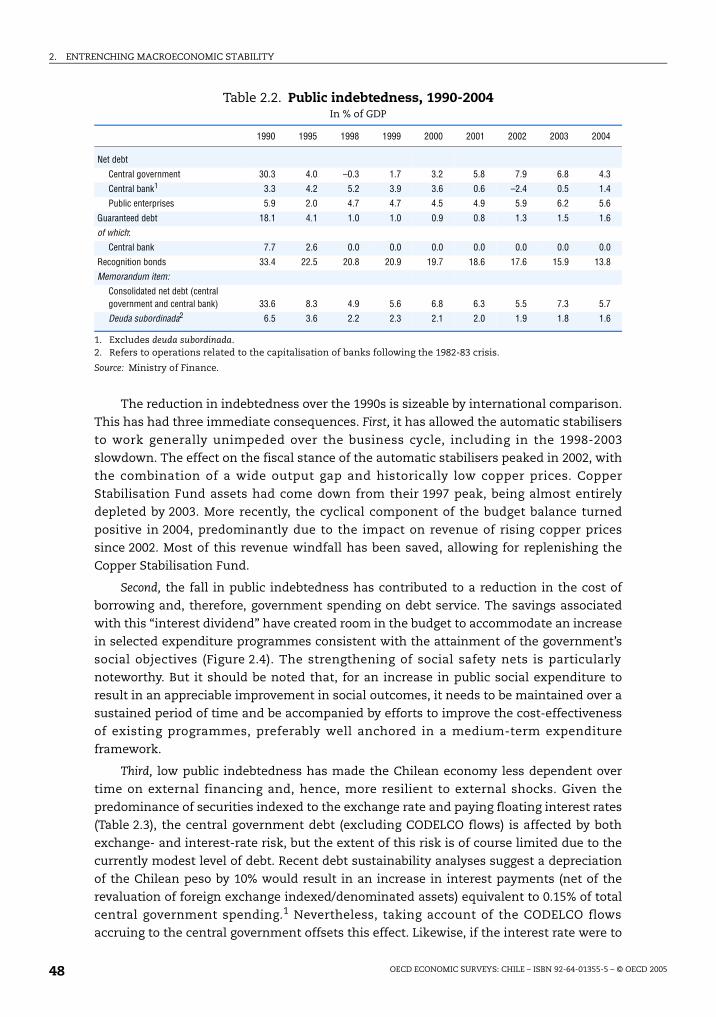
2. ENTRENCHING MACROECONOMIC STABILITY
OECD ECONOMIC SURVEYS: CHILE – ISBN 92-64-01355-5 – © OECD 200548
The reduction in indebtedness over the 1990s is sizeable by international comparison.
This has had three immediate consequences. First, it has allowed the automatic stabilisers
to work generally unimpeded over the business cycle, including in the 1998-2003
slowdown. The effect on the fiscal stance of the automatic stabilisers peaked in 2002, with
the combination of a wide output gap and historically low copper prices. Copper
Stabilisation Fund assets had come down from their 1997 peak, being almost entirely
depleted by 2003. More recently, the cyclical component of the budget balance turned
positive in 2004, predominantly due to the impact on revenue of rising copper prices
since 2002. Most of this revenue windfall has been saved, allowing for replenishing the
Copper Stabilisation Fund.
Second, the fall in public indebtedness has contributed to a reduction in the cost of
borrowing and, therefore, government spending on debt service. The savings associated
with this “interest dividend” have created room in the budget to accommodate an increase
in selected expenditure programmes consistent with the attainment of the government’s
social objectives (Figure 2.4). The strengthening of social safety nets is particularly
noteworthy. But it should be noted that, for an increase in public social expenditure to
result in an appreciable improvement in social outcomes, it needs to be maintained over a
sustained period of time and be accompanied by efforts to improve the cost-effectiveness
of existing programmes, preferably well anchored in a medium-term expenditure
framework.
Third, low public indebtedness has made the Chilean economy less dependent over
time on external financing and, hence, more resilient to external shocks. Given the
predominance of securities indexed to the exchange rate and paying floating interest rates
(Table 2.3), the central government debt (excluding CODELCO flows) is affected by both
exchange- and interest-rate risk, but the extent of this risk is of course limited due to the
currently modest level of debt. Recent debt sustainability analyses suggest a depreciation
of the Chilean peso by 10% would result in an increase in interest payments (net of the
revaluation of foreign exchange indexed/denominated assets) equivalent to 0.15% of total
central government spending.1 Nevertheless, taking account of the CODELCO flows
accruing to the central government offsets this effect. Likewise, if the interest rate were to
Table 2.2. Public indebtedness, 1990-2004In % of GDP
1. Excludes deuda subordinada.2. Refers to operations related to the capitalisation of banks following the 1982-83 crisis.
Source: Ministry of Finance.
1990 1995 1998 1999 2000 2001 2002 2003 2004
Net debt
Central government 30.3 4.0 –0.3 1.7 3.2 5.8 7.9 6.8 4.3
Central bank1 3.3 4.2 5.2 3.9 3.6 0.6 –2.4 0.5 1.4
Public enterprises 5.9 2.0 4.7 4.7 4.5 4.9 5.9 6.2 5.6
Guaranteed debt 18.1 4.1 1.0 1.0 0.9 0.8 1.3 1.5 1.6
of which:
Central bank 7.7 2.6 0.0 0.0 0.0 0.0 0.0 0.0 0.0
Recognition bonds 33.4 22.5 20.8 20.9 19.7 18.6 17.6 15.9 13.8
Memorandum item:
Consolidated net debt (central government and central bank) 33.6 8.3 4.9 5.6 6.8 6.3 5.5 7.3 5.7
Deuda subordinada2 6.5 3.6 2.2 2.3 2.1 2.0 1.9 1.8 1.6
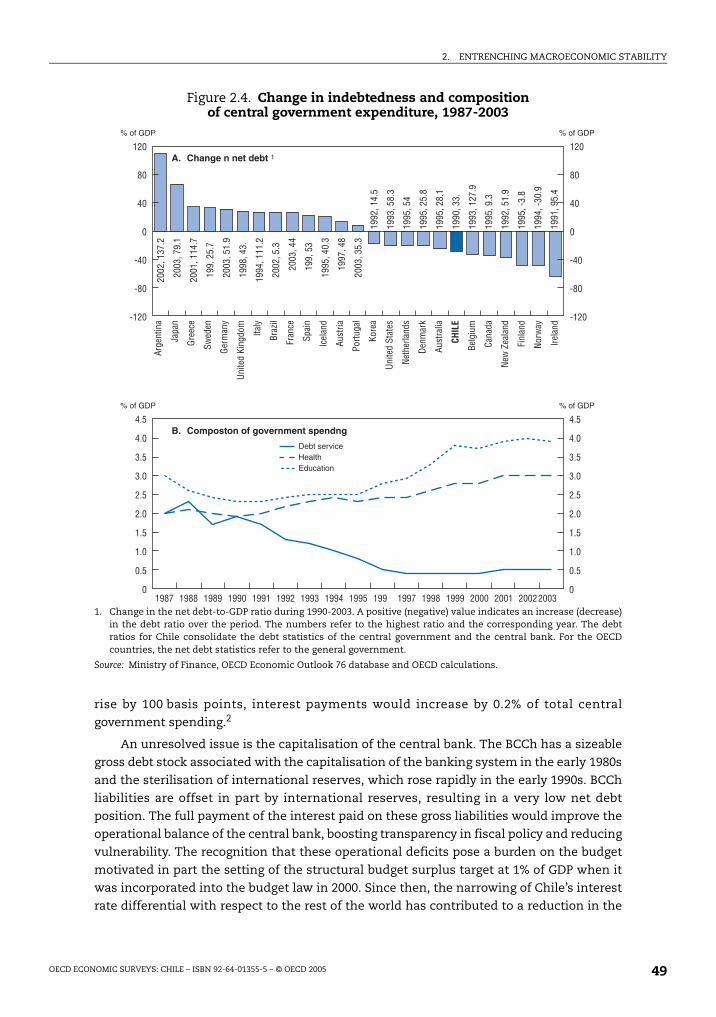
2. ENTRENCHING MACROECONOMIC STABILITY
OECD ECONOMIC SURVEYS: CHILE – ISBN 92-64-01355-5 – © OECD 2005 49
rise by 100 basis points, interest payments would increase by 0.2% of total central
government spending.2
An unresolved issue is the capitalisation of the central bank. The BCCh has a sizeable
gross debt stock associated with the capitalisation of the banking system in the early 1980s
and the sterilisation of international reserves, which rose rapidly in the early 1990s. BCCh
liabilities are offset in part by international reserves, resulting in a very low net debt
position. The full payment of the interest paid on these gross liabilities would improve the
operational balance of the central bank, boosting transparency in fiscal policy and reducing
vulnerability. The recognition that these operational deficits pose a burden on the budget
motivated in part the setting of the structural budget surplus target at 1% of GDP when it
was incorporated into the budget law in 2000. Since then, the narrowing of Chile’s interest
rate differential with respect to the rest of the world has contributed to a reduction in the
Figure 2.4. Change in indebtedness and composition of central government expenditure, 1987-2003
1. Change in the net debt-to-GDP ratio during 1990-2003. A positive (negative) value indicates an increase (decrease)in the debt ratio over the period. The numbers refer to the highest ratio and the corresponding year. The debtratios for Chile consolidate the debt statistics of the central government and the central bank. For the OECDcountries, the net debt statistics refer to the general government.
Source: Ministry of Finance, OECD Economic Outlook 76 database and OECD calculations.
?
7
?7
?
7
?7
?7
?7
?
7
?7
?
?
?7
?
?7
?7
?7
?
?7
?7
?7
?
7
?7
?7
?7
?
7
?7
7
7
7
7
7
7
7
7
7
7
7
7
7
7
7
7
7
7
"(#
+,
/'
/
.
&"
*!"
-
'
,
&'"
#
1
"
.
)
"
$
%
# "
*"
(
0"
-"
&"
"= "=
#$%#$"
"= "=
69B>&
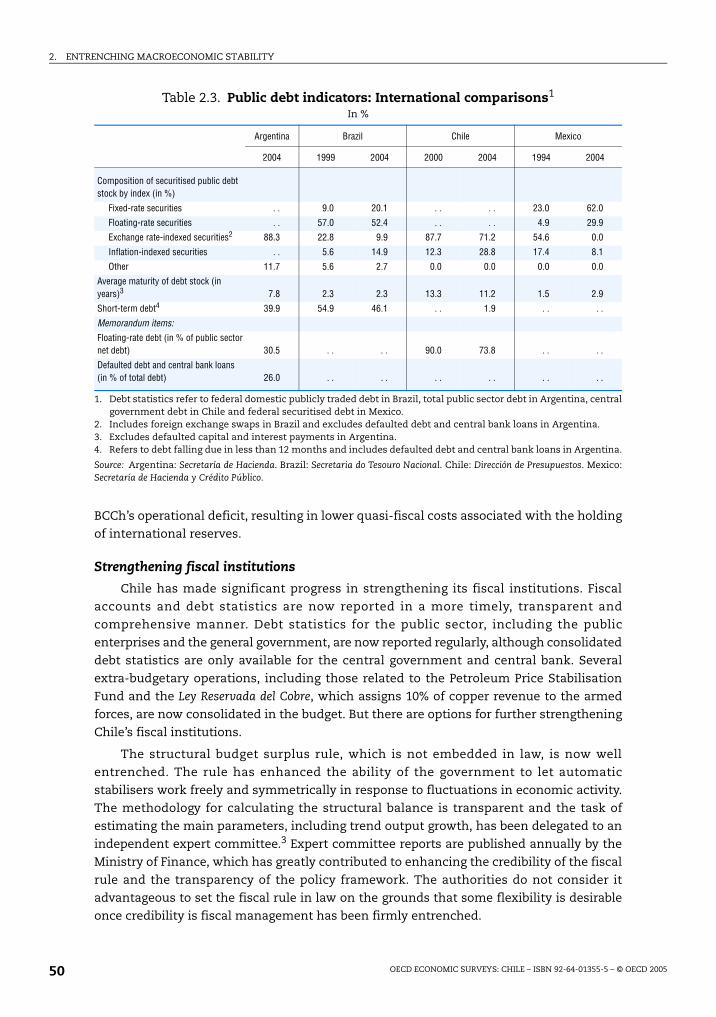
2. ENTRENCHING MACROECONOMIC STABILITY
OECD ECONOMIC SURVEYS: CHILE – ISBN 92-64-01355-5 – © OECD 200550
BCCh’s operational deficit, resulting in lower quasi-fiscal costs associated with the holding
of international reserves.
Strengthening fiscal institutions
Chile has made significant progress in strengthening its fiscal institutions. Fiscal
accounts and debt statistics are now reported in a more timely, transparent and
comprehensive manner. Debt statistics for the public sector, including the public
enterprises and the general government, are now reported regularly, although consolidated
debt statistics are only available for the central government and central bank. Several
extra-budgetary operations, including those related to the Petroleum Price Stabilisation
Fund and the Ley Reservada del Cobre, which assigns 10% of copper revenue to the armed
forces, are now consolidated in the budget. But there are options for further strengthening
Chile’s fiscal institutions.
The structural budget surplus rule, which is not embedded in law, is now well
entrenched. The rule has enhanced the ability of the government to let automatic
stabilisers work freely and symmetrically in response to fluctuations in economic activity.
The methodology for calculating the structural balance is transparent and the task of
estimating the main parameters, including trend output growth, has been delegated to an
independent expert committee.3 Expert committee reports are published annually by the
Ministry of Finance, which has greatly contributed to enhancing the credibility of the fiscal
rule and the transparency of the policy framework. The authorities do not consider it
advantageous to set the fiscal rule in law on the grounds that some flexibility is desirable
once credibility is fiscal management has been firmly entrenched.
Table 2.3. Public debt indicators: International comparisons1
In %
1. Debt statistics refer to federal domestic publicly traded debt in Brazil, total public sector debt in Argentina, centralgovernment debt in Chile and federal securitised debt in Mexico.
2. Includes foreign exchange swaps in Brazil and excludes defaulted debt and central bank loans in Argentina.3. Excludes defaulted capital and interest payments in Argentina.4. Refers to debt falling due in less than 12 months and includes defaulted debt and central bank loans in Argentina.
Source: Argentina: Secretaría de Hacienda. Brazil: Secretaria do Tesouro Nacional. Chile: Dirección de Presupuestos. Mexico:Secretaría de Hacienda y Crédito Público.
Argentina Brazil Chile Mexico
2004 1999 2004 2000 2004 1994 2004
Composition of securitised public debt stock by index (in %)
Fixed-rate securities . . 9.0 20.1 . . . . 23.0 62.0
Floating-rate securities . . 57.0 52.4 . . . . 4.9 29.9
Exchange rate-indexed securities2 88.3 22.8 9.9 87.7 71.2 54.6 0.0
Inflation-indexed securities . . 5.6 14.9 12.3 28.8 17.4 8.1
Other 11.7 5.6 2.7 0.0 0.0 0.0 0.0
Average maturity of debt stock (in years)3 7.8 2.3 2.3 13.3 11.2 1.5 2.9
Short-term debt4 39.9 54.9 46.1 . . 1.9 . . . .
Memorandum items:
Floating-rate debt (in % of public sector net debt) 30.5 . . . . 90.0 73.8 . . . .
Defaulted debt and central bank loans (in % of total debt) 26.0 . . . . . . . . . . . .
2. ENTRENCHING MACROECONOMIC STABILITY
OECD ECONOMIC SURVEYS: CHILE – ISBN 92-64-01355-5 – © OECD 2005 51
The structural budget surplus rule has special provisions for the management of
copper-related revenue.4 This has contributed to insulating the fiscal stance from
fluctuations in the price of copper, ensuring the accumulation of resources during booms
and the withdrawal of funds during cyclical downturns. This is a considerable achievement
in the Latin American context, where the fiscal stance tends to be overly sensitive to terms-
of-trade shocks, making it pro-cyclical, especially in countries with institutions that are
weak and lacking credibility. In general, pro-cyclicality is a common feature of the fiscal
stance in natural resource-exporting countries because their tax bases tend to be more
volatile, calling for mechanisms to stabilise commodity price-related government revenue.
In the case of Chile, the delegation of the task of estimating the copper reference price to
an independent expert committee is exemplary. International experience suggests that the
successful functioning of commodity price stabilisation funds requires setting a reference
price for the relevant commodity in budget formulation based on conservative medium-
term projections, as well as operating rules for using fund resources according to
fluctuations in commodity prices.
In support of longer-lasting fiscal adjustment, the government intends to submit to
Congress draft legislation maintaining the reporting of structural balances in budget
documentation in the years to come. This aims at further enhancing transparency in policy
design by distinguishing the components of the fiscal stance that are associated with
policy from those that are related to fluctuations in economic activity and the terms of
trade. The authorities also intend to add an additional counter-cyclical element in fiscal
policy-making through the Unemployment Contingency Programme (Programa de
Contingencia contra el Desempleo, PCCD). A capped increase in government spending would
be triggered when the national unemployment rate exceeds the average of the previous
five years or when it is higher than 10%. Regardless of how the programme operates, it is
important to note that fiscal rules tend to be most effective when they are simple to
implement and are easy to monitor. All in all, the ultimate test of the appropriateness of
policies in this area will be market scrutiny over the years.
Dealing with the contingencies associated with the pension system
The main source of contingent liabilities for the central government over the longer
term is the guarantee of minimum pensions. The fiscal cost of these pension entitlements
is affected by uncertainty about the financial performance of pension funds, developments
in labour markets and the trajectory of individual contribution density (i.e., actual number
of months of contribution over total potential months of contribution) over time. The
problem is that both the coverage of the “second-pillar” pension system, despite some
improvement, and the density of contributions are low (Annex 2.A1). This puts a burden on
the budget in connection with the guarantee of minimum pensions, which is means-tested
and benefits individuals who have contributed for at least 20 years but have not been able
to save enough to ensure a retirement income at least as high as the minimum pension.
A related issue is the payment of means-tested, general revenue-financed assistance
pensions to those whose contribution history falls short of the minimum required duration
and who do not have alternative sources of income. The aggregate budgetary allocation for
assistance pensions is set by the government in the budget-making process and, therefore,
the value of these benefits depends on the number of beneficiaries. The value of these
benefits is currently about one-half of that of the minimum pension – a discrepancy that
may well not be sustainable over the years, particularly as society becomes wealthier and
2. ENTRENCHING MACROECONOMIC STABILITY
OECD ECONOMIC SURVEYS: CHILE – ISBN 92-64-01355-5 – © OECD 200552
puts a higher premium on equity considerations. If the value of the assistance pensions is
set independently of the number of beneficiaries and rises faster than wages, particularly
the minimum wage, the fiscal cost of these benefits will rise over time. The effect these
developments may have on the incentives facing individuals to save for retirement would
in turn affect the density of contributions and the cost to the budget of alternative social
protection policies over the longer term. The appropriate mix of incentives to save for
retirement and the desirable breadth of social protection therefore needs to be finely
balanced.
Current projections suggest that the pension system is unlikely to pose a heavy
burden on the budget over the longer term. As discussed in the 2003 Survey, government
spending on pensions paid to those individuals affiliated with the old PAYG regime
(including the regime’s operating deficit and payment of recognition bonds) is projected to
fall to less than 1% of GDP per year towards the end of the projection period (2025-30) from
the current level of about 4% of GDP. By that time, the outstanding recognition bonds,
issued to finance the transition from the old PAYG regime to the current three-pillar
system, are projected to have been paid back. These trends would create room in the
budget for addressing the challenges associated with the minimum pension guarantee and
the outlays on assistance pensions, which, based on partial preliminary information, are
projected by the authorities to rise to about 1.2% of GDP over the next 25 years from the
current level of less than 0.5% of GDP. This would call for pre-emptive action, benefiting
from the room created by the gradual reduction in government spending on other pension
commitments over time.
It is important to note that projections of the fiscal cost of guaranteed minimum and
assistance pensions are particularly sensitive to changes in individual contribution density
over time. To the extent that density is overestimated, the future impact on the budget of
outlays on these pensions will be underestimated. As a result, it would be advisable to
carefully evaluate the magnitude of these pension-related contingencies and pre-fund
them, possibly by adjusting the structural budget balance targets to be pursued by future
administrations. Because the capitalisation of the central bank would affect the central
government budget, and hence the estimates of the prudent structural budget balance to
be targeted, it would be advisable to treat both policy matters in conjunction. The
authorities have expressed their intention of creating a pensions-related contingency fund
(Fondo de Reserva de Pensiones) and of limiting spending on minimum pension guarantees
and assistance pensions to 1% of GDP. Alternatively, options can be considered for
increasing the density of contributions. These include making contributions compulsory
for the self-employed, which would call for greatly enhancing compliance enforcement,
and strengthening the incentives for contributing arising from the design of assistance
pensions and health insurance. It should nevertheless be acknowledged that increasing
density does not necessarily reduce pensions-related fiscal contingencies. For example, a
person who is currently not eligible for a minimum pension guarantee may contribute for
a longer period and therefore meet the requirement of 20 years of contribution, becoming
eligible for a minimum pension guarantee.
Fostering transparency in the disclosure of information on actuarial projections would
probably contribute to mustering the necessary public support for pre-emptive action in
this area. Projections of the near-term future fiscal costs associated with the pension
system are already presented in some detail in budget documentation, which is a step
forward. But a requirement to submit in a timely, regular (preferably yearly) and

2. ENTRENCHING MACROECONOMIC STABILITY
OECD ECONOMIC SURVEYS: CHILE – ISBN 92-64-01355-5 – © OECD 2005 53
comprehensive manner periodic actuarial sustainability reports to the legislature together
with, and in support of, budget documentation would be welcome. This could be included
in the draft fiscal transparency law the government intends to submit to Congress. More
could also be done to make the population more aware of their pension rights. The 2002
EPS (Encuesta de Protección Social) Survey suggests that individuals are often unaware of the
performance of their own pension funds, investment options for their retirement savings,
and the eligibility requirements for assistance and minimum pensions.
Maintaining a counter-cyclical policy stance
It is important to avoid pro-cyclicality in the fiscal stance in the years to come. Due to
sound macroeconomic policies and declining public indebtedness, Chile has managed to
implement fiscal policy in a counter-cyclical manner over the recent slowdown, as
discussed above. This is a considerable achievement. In the Latin American context,
international liquidity conditions, which affect investors’ appetite for risky assets, tend to
deteriorate in downturns, when domestic financing also becomes costlier, making the
fiscal stance typically more pro-cyclical in downturns.5 In this regard, the experience of
OECD countries suggests that public indebtedness is a key determinant of fiscal stance
over the business cycle, with the need to rein in the rise in indebtedness often calling for
pro-cyclical remedial action, even when growth is below potential.6 This makes fiscal
consolidation, rather than short-term demand management, the overriding objective of
fiscal policymaking in high-debt countries. But, in the case of Chile, pressures for greater
fiscal activism in the future, particularly in bad times, should not be underestimated in an
environment of relatively low public indebtedness and against the need to satisfy multiple
social demands.
The structural budget surplus rule has been effective in ensuring counter-cyclicality
ex ante, when policies are set, but cannot assure it ex post, when fiscal policy is
implemented. Budget forecasts and outturns often differ; revenue shortfalls and
expenditure overruns are therefore not uncommon during downturns, calling for remedial
measures which may turn out to be pro-cyclical. Budget forecasts may be erroneous
because procedures for calculating trend output, and consequently output gaps, and fiscal
aggregates on a cyclically-adjusted basis may be deficient. Policymakers may therefore be
unable, at the time, to distinguish budgetary changes of a structural nature from those
driven by built-in stabilisers, and/or temporary, yet non-cyclical, fluctuations in revenue.7
Also, tax elasticities may be overstated, in part because standard procedures for calculating
cyclically-adjusted fiscal aggregates do not take into account factors that affect tax
buoyancy, but are related to financial, rather than output and terms-of-trade, cycles.8 The
erroneous diagnosis of cyclical revenue increases as structural would inflate revenue
forecasts, and subsequent shortfalls during downturns may only be remedied pro-
cyclically. This would be equivalent to a persistent overestimation of the copper price used
in budget projections, which would result in an overestimation of the revenue base over
the longer term. Moreover, budget-makers may resort to informal safety margins as a
means to resist pressure for counter-cyclical activism, particularly during downturns. In
the upturn, cyclical revenue gains may be underestimated to curb pressure for tax cuts at
cyclical peaks. By the same token, in the downturn, a cyclical widening of the deficit may
be overestimated to pre-empt calls for a fiscal stimulus. If these safety margins are
unfilled, the fiscal stance turns out to be less counter-cyclical than programmed.
2. ENTRENCHING MACROECONOMIC STABILITY
OECD ECONOMIC SURVEYS: CHILE – ISBN 92-64-01355-5 – © OECD 200554
Strengthening public debt management: Review of trends and policy options
Public debt management has been cautious, a task that has been facilitated by the
gradual reduction in indebtedness. The redemption of gross liabilities and the
accumulation of assets during cyclical upturns have reduced budget financing needs and
costs, including when financial conditions have been adverse. A lower public debt ratio
boosts the government’s preparedness to better cope with the expenditure pressures
associated with the ageing of the population, which are still benign in Chile in comparison
with most OECD countries. But low indebtedness also creates challenges for the
management of government assets and liabilities.
Chile is close to turning its consolidated public debt from a net liability to a net asset
position. In the interim, mechanisms can be used by the government to strengthen the
public debt market, including the replacement of costlier, less liquid outstanding liabilities
by more liquid bonds. This is important because the issuance of government securities
plays an important role in support of the development of a market for private fixed-income
assets. They provide a benchmark for the pricing and referencing of other financial
products, facilitate risk management and provide a low-risk, long-term investment vehicle.
The extent to which the bond markets’ traditional role as a price base for other debt-
market instruments could be replaced over time by corporate bonds or interest rate swaps
is uncertain.
Debt management can contribute further to the development of domestic fixed-
income markets. Two options could be considered:
The BCCh is placing increasing emphasis on the issuance of CLP-denominated securities
paying nominal coupons. Given the preponderance of USD-denominated/indexed
instruments in the traded debt stock, there is ample scope for pursuing this policy
option. This would lead to greater diversification in the composition of public debt.
However, efforts to substitute nominal CLP-denominated for USD-denominated debt
should be pursued while keeping the government’s net foreign exchange position
unchanged, so as to avoid putting undue pressure on foreign exchange markets. This
could be achieved by concomitantly reducing foreign reserve holdings, which would also
contribute to reducing the central bank’s quasi-fiscal losses. The BCCh intends to reduce
reserve holdings to about 12-13% of GDP by end-2005 from nearly 16% of GDP at end-
2004. While the estimation of the optimal level of reserves is not trivial, recent evidence
suggests that there is scope for a gradual reduction in gross reserves.9 In this case,
vigilance would be required to make sure that the unwinding of official reserves is
carried out in a transparent manner with no loss of market confidence, as has been the
case so far.
Inflation-indexed bonds also account for a large share of public debt, providing some
scope for diversification and further improving the composition of debt. In doing so, it is
important to note that institutional investors – particularly pension funds and insurance
companies, which alone hold approximately three-quarters of the public debt stock – are
likely to continue to demand inflation-indexed securities. This is because pension
entitlements are indexed to inflation and therefore pension funds need to hold assets
with similar indexation mechanisms and maturity structure to avoid asset-liability
mismatches. Against this background, the government will need to guard against
preferred demand for this class of securities, which would affect the slope of the yield
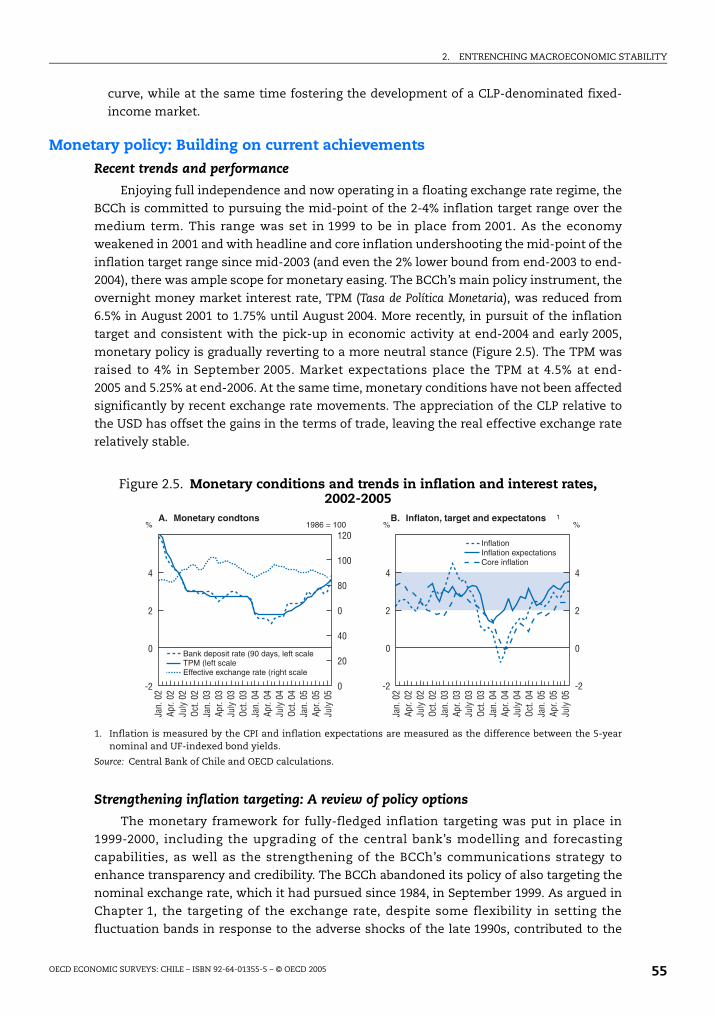
2. ENTRENCHING MACROECONOMIC STABILITY
OECD ECONOMIC SURVEYS: CHILE – ISBN 92-64-01355-5 – © OECD 2005 55
curve, while at the same time fostering the development of a CLP-denominated fixed-
income market.
Monetary policy: Building on current achievements
Recent trends and performance
Enjoying full independence and now operating in a floating exchange rate regime, the
BCCh is committed to pursuing the mid-point of the 2-4% inflation target range over the
medium term. This range was set in 1999 to be in place from 2001. As the economy
weakened in 2001 and with headline and core inflation undershooting the mid-point of the
inflation target range since mid-2003 (and even the 2% lower bound from end-2003 to end-
2004), there was ample scope for monetary easing. The BCCh’s main policy instrument, the
overnight money market interest rate, TPM (Tasa de Política Monetaria), was reduced from
6.5% in August 2001 to 1.75% until August 2004. More recently, in pursuit of the inflation
target and consistent with the pick-up in economic activity at end-2004 and early 2005,
monetary policy is gradually reverting to a more neutral stance (Figure 2.5). The TPM was
raised to 4% in September 2005. Market expectations place the TPM at 4.5% at end-
2005 and 5.25% at end-2006. At the same time, monetary conditions have not been affected
significantly by recent exchange rate movements. The appreciation of the CLP relative to
the USD has offset the gains in the terms of trade, leaving the real effective exchange rate
relatively stable.
Figure 2.5. Monetary conditions and trends in inflation and interest rates, 2002-2005
1. Inflation is measured by the CPI and inflation expectations are measured as the difference between the 5-yearnominal and UF-indexed bond yields.
Source: Central Bank of Chile and OECD calculations.
Strengthening inflation targeting: A review of policy options
The monetary framework for fully-fledged inflation targeting was put in place in
1999-2000, including the upgrading of the central bank’s modelling and forecasting
capabilities, as well as the strengthening of the BCCh’s communications strategy to
enhance transparency and credibility. The BCCh abandoned its policy of also targeting the
nominal exchange rate, which it had pursued since 1984, in September 1999. As argued in
Chapter 1, the targeting of the exchange rate, despite some flexibility in setting the
fluctuation bands in response to the adverse shocks of the late 1990s, contributed to the
" " "A
5*"$ %'"&$
+7
$,&9&-9=9+'=9==B(9
#,7
+"
8'7
)=
=
+7
#,7
+"
8'7
+7
#,7
+"
8'7
+7
#,7
+"
+7
#,7
+"
8'7
+7
#,7
+"
8'7
+7
#,7
+"
8'7
+7
#,7
+"
)=(9
2. ENTRENCHING MACROECONOMIC STABILITY
OECD ECONOMIC SURVEYS: CHILE – ISBN 92-64-01355-5 – © OECD 200556
exacerbation of the post-Russian crisis recession. A more flexible exchange rate regime,
anchored in credible inflation targeting, tends to play a more stabilising role in response to
adverse external shocks and fluctuations in terms of trade.10
Chile is now close to international best practices, and the successful implementation
of inflation targeting over the years has contributed to the gradual phasing out of formal
and informal backward-looking indexation, which had been prevalent in the high-inflation
period until the mid-1990s. Indexation nevertheless remains widespread in long-term
contracts, including rents, tax liabilities and fixed-income instruments, where contractual
arrangements tend to be linked to the CPI (Unidad de Fomento). Empirical evidence shows
that inflation expectations are affected strongly by deviations of current inflation from the
target.11 The BCCh also responds to these deviations according to a well-defined reaction
function (Annex 2.A2). These findings suggest that monetary policymaking has become
more forward-looking and that inflation targeting has played the desirable role of
anchoring inflation expectations in Chile. This is a considerable achievement because,
while the adoption of inflation targeting in both emerging and industrial countries has
been associated with a fall in inflation relative to the pre-inflation targeting period,
empirical evidence suggests that inflation in emerging markets is more likely to deviate
from the central targets and breach the upper bounds set around these targets.12 This is
because of institutional weaknesses in general, as well as the effects of macroeconomic
volatility, which is higher in emerging markets than in more mature economies, often
driven by a lack of resilience to external shocks.
Gradual disinflation in the 1990s has allowed Chile to adjust the inflation target bands
over time. This achievement is particularly noteworthy after abandonment of exchange
rate targeting in 1999 because a resource-based economy tends to be more exposed to
terms-of-trade shocks and, therefore, temporary exchange rate-related fluctuations in
inflation, calling for relatively wider inflation target bands. Also, unlike most inflation
targeters, the BCCh has not emphasised the mid-point of the inflation target band, even in
the early period of inflation targeting. With gradual disinflation leading to well-anchored
inflation expectations, de-emphasising the mid-point of the inflation target has become a
trend in inflation targeting in more mature economies.
While inflation targeting is working well, three issues might be considered within the
BCCh’s policy development research agenda:
With headline and expected inflation already safely within the medium-term target
range, there is an issue of whether core, rather than headline, inflation should be
formally targeted. Targeting core, rather than headline, inflation allows the central bank
to react to underlying inflationary pressures instead of those stemming from temporary
shocks to prices; in doing so, the inflation-output trade-off can be reduced. In its
communication strategy, the BCCh already discusses underlying trends in different
measures of core inflation, which would facilitate the transition. It is nevertheless
important to weigh the risks that such a move may pose for preserving credibility in the
policy framework, because the choice of a given measure of core inflation is essentially
arbitrary. Another consideration is that Chile – as well as Brazil and Mexico, the two
other Latin American countries with well established inflation targeting regimes – still
has a relatively high share of “administered” prices in the consumption price index,
making their exclusion from the measure of inflation to be targeted less compelling.13
2. ENTRENCHING MACROECONOMIC STABILITY
OECD ECONOMIC SURVEYS: CHILE – ISBN 92-64-01355-5 – © OECD 2005 57
An effective communication strategy is an important feature of inflation targeting.
While the BCCh already publishes quarterly Monetary Policy Reports (Informe de Política
Monetaria) and the minutes of the monthly monetary policy meetings, the lag for
publication of the latter could be reduced further from the current three weeks to ideally
one to two weeks. By international comparison, the lag among inflation targeters is
2 weeks in the United Kingdom and Sweden, for example, and one week in Brazil, a
regional comparator.14
To boost accountability, the BCCh Governor could issue an open letter explaining
deviations from the target when these are not met, in addition to the discussion already
presented in the Monetary Policy Reports and presented to Senate. It could nevertheless
be argued that most of the countries where issuance of these open letters is required
have not granted de jure independence to their central bank.
Notes
1. See Crispi and Vega (2003) and IMF (2004a), for more information.
2. See Government of Chile (2004), for more information.
3. See Marcel et al. (2001) and Blondal and Curristine (2005), for more information.
4. See OECD (2003a), for more information on Chile’s Copper Stabilisation Fund.
5. According to ECLAC analysis, in 13 out of the 17 cases in which GDP growth was above trend, thechange in the cyclically-adjusted public-sector budget balance was negative, reflecting anexpansionary fiscal policy. There are also episodes in which the budget balance adjusted for thecycle exhibited little variation despite significant changes in the output gap, such as in Chile (1992-98),Brazil (1990-94), and Mexico (1995-97). See Martner and Tromben (2004), for more information. SeeGavin et al. (1996), for empirical evidence.
6. But it is important to note that fiscal consolidation in a downturn need not be destabilising so longas it restores confidence by putting the debt dynamics back on a sustainable path. There is nowample empirical evidence that fiscal contractions may be expansionary in heavily indebted OECDcountries and that the composition of adjustment, via tax increases and/or expenditure cuts,affects the expansionary potential of fiscal retrenchment. See also OECD (2003b), Chapter IV, formore information.
7. In particular, potential output growth may be overestimated, implying a higher output gap, a highercyclical component of the deficit (or a lower cyclical component of the surplus), and an overestimationof the strength of the cyclically-adjusted balance and revenue base in the longer term. This mayprovide grounds for tax cuts during upswings which may turn out to be unsustainable.
8. Movements in asset and housing prices are a case in point. See OECD (2004a), Chapter VI, for moreinformation and discussion for selected OECD countries.
9. See IMF (2004b), for further discussion and empirical evidence.
10. Exchange rate risk, which is relatively well marketed, is determined predominantly by terms-of-trade shocks in a natural resources-based economy. However, due to exchange rate targeting, thereal exchange rate correlates weakly with commodity prices (Cashin, Cespedes, and Sahay, 2002).This contributed to aggravating exchange rate risk.
11. See Schmidt-Hebbel and Werner (2002) and Cespedes and Soto (2005), for more information.
12. See Mishkin and Savastano (2001), Mishkin (2004) and Roger and Stone (2005) , for furtherdiscussion on inflation targeting in developed and emerging economies.
13. Targeting a measure of core inflation that would exclude “administered” prices may result in anunderestimation of inertial inflation, because administered price inflation tends to be morepersistent. See OECD (2005), for more discussion on the experience of Brazil. In Chile, regulatedprices account for 8.3% of the consumption basket (i.e., electricity, water, telecommunications,public transport, etc.) and contractual prices account for 7.2% of consumption basket (i.e., indexedtariffs, rents, dividends, etc.). See Central Bank of Chile (2005), for more information.
14. See Fracasso, Genberg and Wyplosz (2003), for more information.
2. ENTRENCHING MACROECONOMIC STABILITY
OECD ECONOMIC SURVEYS: CHILE – ISBN 92-64-01355-5 – © OECD 200558
Bibliography
Berstein, S., G. Larrain and F. Pino (2005), “Cobertura, Densidad y Pensiones en Chile: Proyecciones a30 Años Plazo”, Unpublished manuscript Superintendencia de Administradoras de Fondos dePensiones, Ministry of Labour and Social Assistance, Santiago.
Blondal, J. and T. Curristine (2005), “Budgeting in Chile”, OECD Journal on Budgeting, Vol. 4, pp. 7-45.
Cashin, P., L. Cespedes and R. Sahay (2002), “Keynes, Cocoa and Copper: in Search of CommodityCurrencies”, IMF Working Paper, No. 02/223, International Monetary Fund, Washington, DC.
Central Bank of Chile (2005), Informe de Política Monetaria, May, Central Bank of Chile, Santiago.
Cespedes, L. and C. Soto (2005), “Credibility and Inflation Targeting in an Emerging Market: The Caseof Chile”, Working Paper, No. 312, Central Bank of Chile, Santiago.
Clarida, R., J. Galí and M. Gertler (2000), “Monetary Policy Rules in Practice: Some InternationalEvidence”, Quarterly Journal of Economics, Vol. 115, pp. 147-80.
Crispi, J. and A. Vega (2003), “Sostenibilidad y Regla Fiscal: Análisis e Indicadores para Chile”, Estudiosde Finanzas Públicas, Ministry of Finance, Santiago.
Fracasso, A., H. Genberg and C. Wyplosz (2003), “How do Central Banks Write? An Evaluation ofInflation Targeting Central Banks”, Geneva Reports on World Economy Special Report 2, InternationalCentre for Monetary and Banking Studies, Geneva.
Gavin, M., R. Hausmann, R. Perotti and E. Talvi (1996), “Managing Fiscal Policy in Latin America and theCaribbean: Volatility, Procyclicality, and Limited Creditworthiness”, Working Paper, No. 326, Inter-American Development Bank, Washington, DC.
Government of Chile (2004), Informe de Finanzas Públicas: Proyecto de Ley de Presupuestos del Sector Públicopara el Año 2005, October, Ministry of Finance, Santiago.
International Monetary Fund (2004a), Chile: 2004 Article IV Consultation – Staff Report; Public InformationNotice on the Executive Board Discussion; and Statement by the Executive Director for Chile, InternationalMonetary Fund, Washington, DC.
International Monetary Fund (2004b), Chile: Selected Issues, International Monetary Fund,Washington, DC.
Marcel, M., M. Tokman, R. Valdés and P. Benavides (2001), “Balance Estructural del Gobierno Central:Metodología y Estimaciones para Chile: 1987-2000”, Estudios de Finanzas Públicas, September(www.dipres.cl/fr_publicaciones.html).
Martner R. and V. Tromben (2004), “La Sostenibilidad de la Deuda Pública: El Efecto Bola de Nieve y el‘Pecado Original’”, Serie Gestión Pública, No. 46, ILPES/ECLAC, Santiago.
Mishkin, F.S. (2004), “Can Inflation Targeting Work in Emerging Market Countries?”, Paper presented atan IMF Conference in Honour of Guillermo Calvo, International Monetary Fund, Washington, DC,15-16 April.
Mishkin, F.S. and M. Savastano (2001), “Monetary Policy Strategies for Emerging Market Countries:Lessons from Latin America”, Journal of Development Economics, Vol. 66, No. 2, pp. 415-44.
OECD (2003a), OECD Economic Survey of Chile, OECD, Paris.
OECD (2003b), OECD Economic Outlook, No. 74, OECD, Paris.
OECD (2004a), OECD Economic Outlook, OECD, Paris.
OECD (2004b), “Tax Favoured Retirement Savings Plans: A Review of Budgetary Implications and PolicyIssues”, ECO/CPE/WP1(2004)4, OECD, Paris.
OECD (2005), Economic Survey of Brazil, OECD, Paris.
Roger, S. and M. Stone (2005), “On Target? The International Experience with Achieving InflationTargets”, IMF Working Paper, No. WP/05/163, International Monetary Fund, Washington, DC.
Schmidt-Hebbel, K. and A. Werner (2002), “Inflation Targeting in Brazil, Chile, and Mexico:Performance, Credibility, and the Exchange Rate”, Working Paper, No. 171, Central Bank of Chile,Santiago.
Schmidt-Hebbel, K. and M. Tapia (2002), “Inflation Targeting in Chile”, North American Journal ofEconomics and Finance, Vol. 13, pp. 125-46.

2. ENTRENCHING MACROECONOMIC STABILITY
OECD ECONOMIC SURVEYS: CHILE – ISBN 92-64-01355-5 – © OECD 2005 59
ANNEX 2.A1
Long-term pension system projections
Pension system projections have recently been revised based on a sample of individual
records available from pension fund managers (AFPs) and submitted to the pension fund
regulator (Superintendencia de de Administradoras de Fondos de Pensiones).1 There is also a survey
conducted for this same sample of individuals in 2002 (Encuesta de Protección Social, EPS).2
Chile’s pension system: An overview
As noted in the 2003 Survey, Chile has a “three-pillar” pension system. The second pillar
is mandatory, fully funded and privately managed; pensions are earnings-related and
based on defined contributions (discussed below). Contribution rates are capped at 10%
plus the fee paid to the AFPs for management and disability/survivor insurance (2.4% on
average in 2004, see below), in addition to the compulsory 7% contribution to health
insurance. There is also a first pillar corresponding to: i) the means-tested minimum
income guarantee provided by the government for those individuals who have contributed
to a pension fund for at least 20 years but whose accumulated savings are insufficient to
finance a minimum pension upon retirement; ii) the means-tested, general revenue-
financed assistance pension paid to those workers who do not have another source of
income, and iii) the military and national police schemes.3 While the minimum pension
guarantee is an entitlement, payment of an assistance pension is not. The third pillar refers
to complementary retirement plans (optional, fully funded, earnings-related, privately
managed), where contributions are deductible from income taxation up to a maximum of
600 UFs (about USD 18 000) per year.4
There are three alternatives for the payment of retirement income: i) pensions
administered by the AFPs (retiro programado), ii) annuities paid by a life-insurance company
(renta vitalicia), and iii) a combination of both options, where the AFP pays a pension for a
limited period and the life-insurance company pays an annuity, or the AFP pays part of the
pension as a retiro programado and the life-insurance company pays an annuity for the
whole retirement period. Should the person decide to buy an annuity from an insurance
company at the time of retirement, there is a transition cost that has been reduced from a
peak of 5.9% of the accumulated funds in 1999 to 2.4% in September 2004.
Replacement rates are estimated to be in the neighbourhood of 50% (as of May 2004) on
average for the second-pillar regime. Currently, about one-half of old-age pensioners earn a
pension lower than the minimum pension, but the ratio varies among the different pension
regimes: three-quarters of the stock of old-age pensions under retiro programado are below
the minimum pension, a much higher percentage than the 15% under renta vitalicia.
2. ENTRENCHING MACROECONOMIC STABILITY
OECD ECONOMIC SURVEYS: CHILE – ISBN 92-64-01355-5 – © OECD 200560
The main issues
Many individuals, particularly females and the self-employed, have gaps in their
contribution history, affecting their ability to accumulate funds to finance their retirement
income. This is important particularly in the early years of contribution: it is estimated that
contributions during the first 10 years finance about 60% of the value of pensions
considering a total period of 30 years of contributions. Job turnover is also high, which
increases the likelihood of gaps in the individual’s contribution history.
Early retirement is widespread. About two-thirds of males and one-fifth of females
took early retirement in 2003. Although the retirement age is 60 years for females and
65 years for males, early retirement is possible for those who have accumulated enough to
finance a pension equivalent to 50% of the individual’s average income over the last
10 working years and 110% of the minimum pension.5 Individuals are also allowed to
withdraw the funds in excess of the amount needed for financing a pension equivalent to
70% of their average income over the last 10 working years and 150% of the minimum
pension. It is estimated that each year of anticipation of retirement costs about 7% of the
value of pensions on average.
The density of contribution and the coverage of social security are low. Based on
administrative records, the median density (i.e., actual number of months of contribution
over total potential months of contribution) is below 60%.6 Coverage (i.e., the ratio of
individuals contributing to a pension fund to labour force) increased steadily over time but
remains low, at about 55%. The average income of contributors to second-pillar social
security is around USD 580 which is well above the minimum wage (about USD 200). Low
coverage is due in part to the fact that contribution to an AFP is optional for the self-
employed, who account for about 25% of total employment (Chapter 5).
The density of contributions has a strong effect on pension income in a defined-
contribution system. Empirical analysis based on the 2002 EPS survey (assuming a rate of
return of 4% per year, an increase in real wages of 1.5% in real terms per year, and life
expectancy of 82 years for males and 84 years for females) suggests that, if density is about
25%, a minimum wage earner would not manage to save enough to finance a pension
above the minimum pension and would not be entitled to the government-financed
guarantee. To be eligible for a minimum pension guaranteed by the government, a density
of contributions of at least 50% is estimated to be needed for males. With a rate of return
of 6%, there is a positive probability that male workers’ savings would be enough to finance
a pension above the guaranteed level.
Summary of long-term projections
Taking the life-cycle income and density of contributions depicted in Figure 2.A1.1
(Panels A and B), and assuming that the contribution rate is capped at the current level of
10%, wages and the minimum pension rise by 2% per year in real terms, the
unemployment rate is kept constant, and the rate of return of pension funds is 5% per year,
suggests that:
At the current level of the minimum pension, those pensioners who will not have saved
enough for a retirement income above the minimum pension but will have met the
requirement for a minimum pension guarantee (20 years of contribution) will account
for about 10% of pensioners towards the end of the forecast period (2005-25)
(Figure 2.A1.1, Panel C).
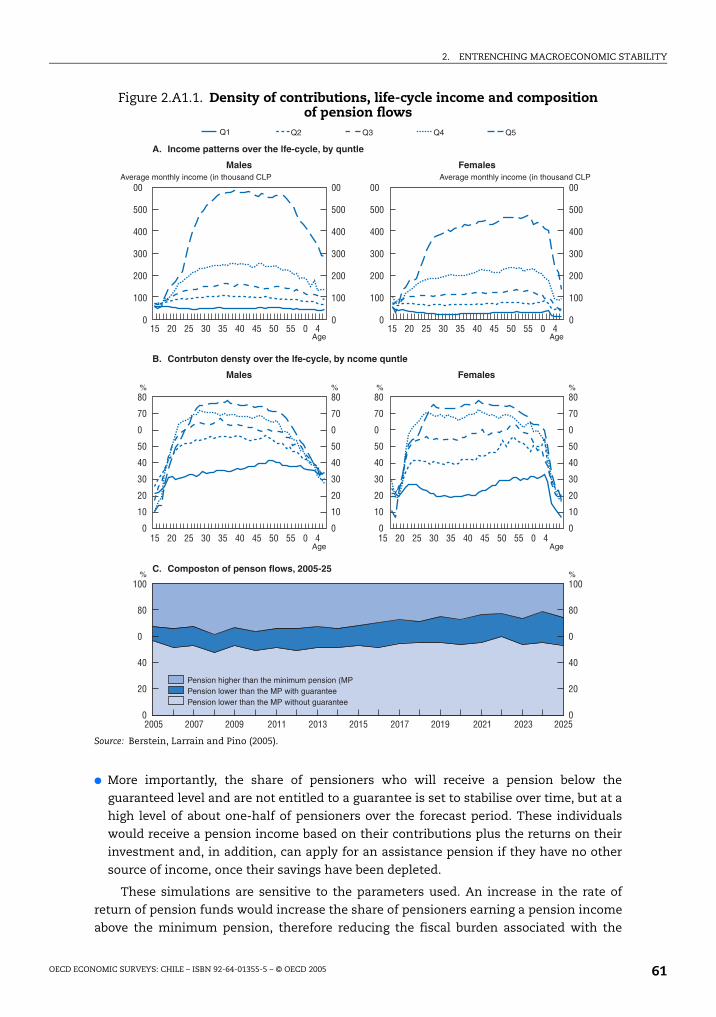
2. ENTRENCHING MACROECONOMIC STABILITY
OECD ECONOMIC SURVEYS: CHILE – ISBN 92-64-01355-5 – © OECD 2005 61
More importantly, the share of pensioners who will receive a pension below the
guaranteed level and are not entitled to a guarantee is set to stabilise over time, but at a
high level of about one-half of pensioners over the forecast period. These individuals
would receive a pension income based on their contributions plus the returns on their
investment and, in addition, can apply for an assistance pension if they have no other
source of income, once their savings have been depleted.
These simulations are sensitive to the parameters used. An increase in the rate of
return of pension funds would increase the share of pensioners earning a pension income
above the minimum pension, therefore reducing the fiscal burden associated with the
Figure 2.A1.1. Density of contributions, life-cycle income and composition of pension flows
Source: Berstein, Larrain and Pino (2005).
"
"
"
""
"
#$'%*'(*:)'
5'$ B5-59&4
C.C C C! C3
()"$*'%*'(*#:)'
5'$
#$%$%'$;;
8#'$ B5-59&4
8#'$
95559'9'9'

2. ENTRENCHING MACROECONOMIC STABILITY
OECD ECONOMIC SURVEYS: CHILE – ISBN 92-64-01355-5 – © OECD 200562
requirement of minimum pension guarantee. A 1 percentage point increase in the rate of
return over an individuals’ working life is associated with an increase in the value of
pensions of about 20%.
Notes
1. The projections reported are available from Berstein, Larrain and Pino (2005).
2. The EPS Survey is available at www.proteccionsocial.cl.
3. Currently, there are about 65 000 beneficiaries of minimum pension guarantees and400 000 beneficiaries of assistance pensions. See Government of Chile (2004), for moreinformation.
4. See OECD (2004b), for more information on tax-favoured retirement-saving plans in OECDcountries.
5. These ceilings will be gradually increased up to 70% of average income and 150% of the minimumpension, according to the legislation approved in 2004.
6. The use of the median, rather than the mean, is justified on the grounds that contributiondensities are not distributed normally. There is a significant number of AFP affiliates with very lowdensities and a large number with contribution densities close to 100%. These statistics includeaffiliates that have contributed at some point in their lives but are now out of the labour force.
2. ENTRENCHING MACROECONOMIC STABILITY
OECD ECONOMIC SURVEYS: CHILE – ISBN 92-64-01355-5 – © OECD 2005 63
ANNEX 2.A2
Estimating a monetary reaction function for Chile
This section aims at providing supporting evidence on the extent to which monetary
stance, measured by the policy interest rate (TPM), is affected by deviations in expected
inflation from the targets. The main hypothesis to be tested is that the BCCh raises the TPM
whenever expected inflation is above the target. This can be done by regressing the policy
interest rate on the gap between expected and target inflation, while controlling for the
business cycle and allowing for some interest rate smoothing.* A strong reaction to
inflationary pressures is essential for boosting credibility in monetary policy.
The variables used in the empirical analysis are as follows: i) inflation expectations are
calculated as the 6-month moving average of the difference between the annualised
nominal interest rate and the UF (Unidad de Fomento)-indexed interest rate on three-month
bank deposits; ii) the output gap is constructed as the difference between the seasonally-
adjusted economic activity index (X12-filtered IMACEC) and the HP-filtered index, proxying
for trend output; iii) the inflation target is defined as the average of the lower and upper
bounds set by the BCCh; and iv) the policy interest rate is the real TPM. Monthly data are
available from the BCCh for the period May 1995 to November 2004.
Estimation of the monetary reaction function suggests that that the BCCh raises the
TPM whenever inflation expectations exceed the target (Table 2.A2.1). The output gap is
statistically significant and signed as expected, suggesting that the TPM is raised when the
economy is growing at above-trend rates (Model 1). The results are robust to: i) the
replacement of the IMACEC index by the seasonally-adjusted IIP industrial production
index (Model 2); ii) the definition of expected inflation as a 12-month moving average of the
difference between the interest rate paid on nominal and UF-indexed bank deposits (not
reported); iii) the use of 12-month ahead inflation expectations collected from market
surveys, rather than interest rate differentials (not reported), although the time period for
which the analysis could be conducted was much shorter; and iv) the inclusion of lagged
changes in the exchange rate among the regressors (Model 3). The possibility that the
monetary reaction function was affected by exchange rate targeting was tested by re-
running the estimating equation for the period prior to September 1999. The results
(Model 4) suggest that monetary policy responsiveness to inflation deviations did increase
with the abandonment of exchange rate targeting.
* See Clarida, Gali and Gertler (2000) for further discussion and empirical evidence on the estimationof monetary policy reaction functions, and Schmidt-Hebbel and Werner (2002) and Schmidt-Hebbeland Tapia (2002), for example, for the estimation of Taylor rules for Chile.
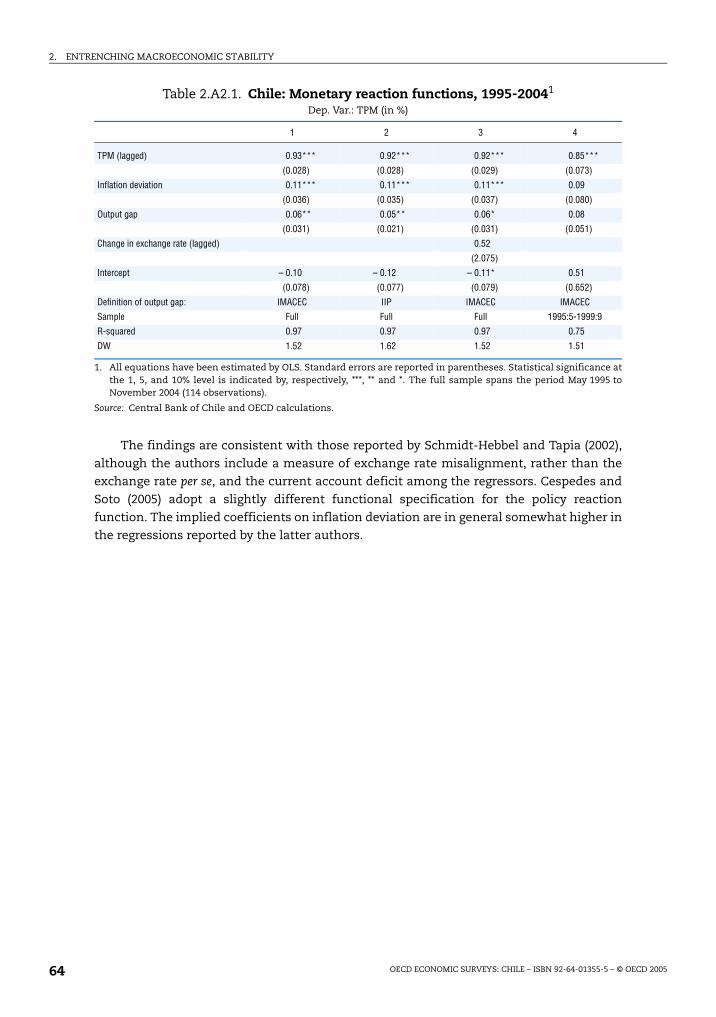
2. ENTRENCHING MACROECONOMIC STABILITY
OECD ECONOMIC SURVEYS: CHILE – ISBN 92-64-01355-5 – © OECD 200564
Table 2.A2.1. Chile: Monetary reaction functions, 1995-20041
Dep. Var.: TPM (in %)
1. All equations have been estimated by OLS. Standard errors are reported in parentheses. Statistical significance atthe 1, 5, and 10% level is indicated by, respectively, ***, ** and *. The full sample spans the period May 1995 toNovember 2004 (114 observations).
Source: Central Bank of Chile and OECD calculations.
The findings are consistent with those reported by Schmidt-Hebbel and Tapia (2002),
although the authors include a measure of exchange rate misalignment, rather than the
exchange rate per se, and the current account deficit among the regressors. Cespedes and
Soto (2005) adopt a slightly different functional specification for the policy reaction
function. The implied coefficients on inflation deviation are in general somewhat higher in
the regressions reported by the latter authors.
1 2 3 4
TPM (lagged) 0.93*** 0.92*** 0.92*** 0.85***
(0.028) (0.028) (0.029) (0.073)
Inflation deviation 0.11*** 0.11*** 0.11*** 0.09
(0.036) (0.035) (0.037) (0.080)
Output gap 0.06** 0.05** 0.06* 0.08
(0.031) (0.021) (0.031) (0.051)
Change in exchange rate (lagged) 0.52
(2.075)
Intercept – 0.10 – 0.12 – 0.11* 0.51
(0.078) (0.077) (0.079) (0.652)
Definition of output gap: IMACEC IIP IMACEC IMACEC
Sample Full Full Full 1995:5-1999:9
R-squared 0.97 0.97 0.97 0.75
DW 1.52 1.62 1.52 1.51

ISBN 92-64-01355-5
OECD Economic Surveys: Chile
© OECD 2005
OECD ECONOMIC SURVEYS: CHILE – ISBN 92-64-01355-5 – © OECD 2005 65
Chapter 3
Encouraging innovation
A good framework for investment in innovation can contribute to increasing Chile’sgrowth potential. Spending on R&D is currently low in relation to GDP and heavilyreliant on government financing. Innovation activity in the business sector is alsolimited by insufficient seed and venture capital and human capital constraints. Thisis despite several favourable framework conditions, including a stablemacroeconomy, liberal foreign trade and investment regimes, and reasonably pro-competition regulations in product markets. The government intends to increasepublic spending on R&D, to be financed by revenue from the mining tax introducedin May 2005, and to create a National Innovation Council. The effectiveness of thesemeasures will depend largely on the extent to which they will boost business-financed innovation consistent with Chile’s comparative advantages.
3. ENCOURAGING INNOVATION
OECD ECONOMIC SURVEYS: CHILE – ISBN 92-64-01355-5 – © OECD 200566
Innovation activity and performanceChile’s spending on R&D, at 0.7% of GDP in 2002, is low in comparison with OECD
countries, but not out of line with Latin American comparators, except Brazil (Figure 3.1). R&D
intensity is a key input to innovation and one of the most widely used indicators to compare
innovation activities in different countries. Unlike the OECD area, where R&D intensity has
risen steadily since the 1980s, spending on R&D has remained fairly stable over time in Chile.1
Consistent with this, the share of R&D personnel in total employment, another key input to the
innovation process, is also comparatively low, with almost 90% of R&D personnel working in
public research institutions. In contrast, in most OECD countries, R&D personnel account for a
substantially higher share of employment, and the majority works in the business sector.
As in the rest of Latin America, most R&D spending is financed by the government in
Chile. This runs counter to OECD-wide trends, where innovation is financed and carried
out primarily by businesses. Preliminary estimates for 2003 suggest that about 70% of R&D
spending in Chile is on applied research, including experimental activities. While a case
can be made for public funding for basic research on the grounds that there may be limited
scope for immediate commercial use for these innovations, which may take time to come
to fruition, there is also the issue of whether larger gains could be achieved by allocating
more funds to applied research. Almost two-thirds of public spending on R&D in 2002-04
was allocated to higher-education institutions and related funds, and linked to the
Ministry of Education (Annex 3.A1).
Variations across countries in R&D intensity tend to reflect income differentials. But
Chile’s gap in relation to the OECD average cannot be ascribed to an income gap alone: R&D
intensity is lower in Chile than in countries with lower income per capita, such as China
and India. This suggests significant scope for catching up, although it should be noted that,
to a large extent, R&D intensity tends to be lower in resource-based economies.2 This is the
case even among OECD countries, where business R&D intensity is considerably lower than
the area-wide average in countries such as Australia and Norway. An additional caveat is
that R&D-related indicators are an imperfect measure of innovative performance.3 Many
other types of expenditure, such as fixed investment and labour training, are not
conventionally recorded as R&D but also contribute to the successful commercial
development of innovations. Moreover, indicators of R&D intensity may not reflect the
productivity of the resources used, particularly if returns to scale are not constant and/or
market competition is imperfect. The limitations of input measures as proxies for
innovation underline the importance of looking at direct output measures.
Consistent with relatively low R&D intensity, the output of innovation activity appears
to be low. Chileans hold relatively few patents abroad and have a poor record of scientific
publications, which are conventional measures of innovation output (Figure 3.2). This is in
line with OECD trends, where the numbers of patents per capita is positively correlated
with business R&D intensity. The share of new products in business turnover provides a
further measure of innovation performance, but information is not readily available for
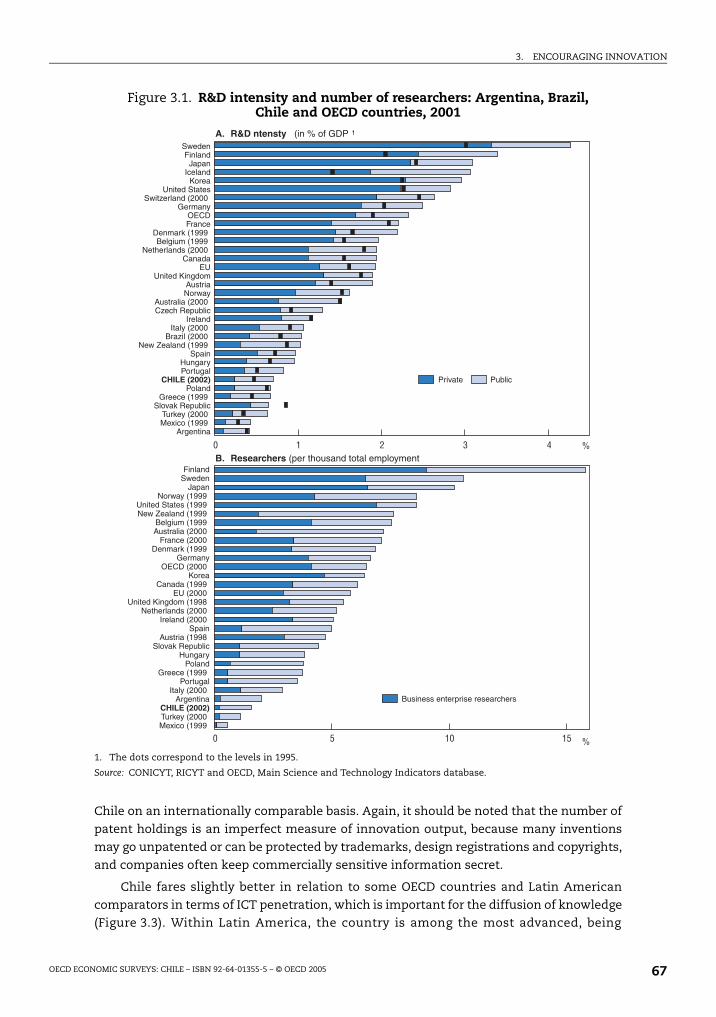
3. ENCOURAGING INNOVATION
OECD ECONOMIC SURVEYS: CHILE – ISBN 92-64-01355-5 – © OECD 2005 67
Chile on an internationally comparable basis. Again, it should be noted that the number of
patent holdings is an imperfect measure of innovation output, because many inventions
may go unpatented or can be protected by trademarks, design registrations and copyrights,
and companies often keep commercially sensitive information secret.
Chile fares slightly better in relation to some OECD countries and Latin American
comparators in terms of ICT penetration, which is important for the diffusion of knowledge
(Figure 3.3). Within Latin America, the country is among the most advanced, being
Figure 3.1. R&D intensity and number of researchers: Argentina, Brazil, Chile and OECD countries, 2001
1. The dots correspond to the levels in 1995.
Source: CONICYT, RICYT and OECD, Main Science and Technology Indicators database.
@
@
*&:&<)&#
8&*9*%&
5-:
5,$5
7&9 &
88&#&5
97-
9 %26
)&)-
$% 7;&
*>-
!46&
*B,26+,- '(
B 6
9< $*"=
:&*&<
7-8&*97;&
$5 9 :
5,5-
#
&8
8&#&57&9
)& *
9*B,26
>-&
)-
!46+,- '(
9$$9&5-5
$999999
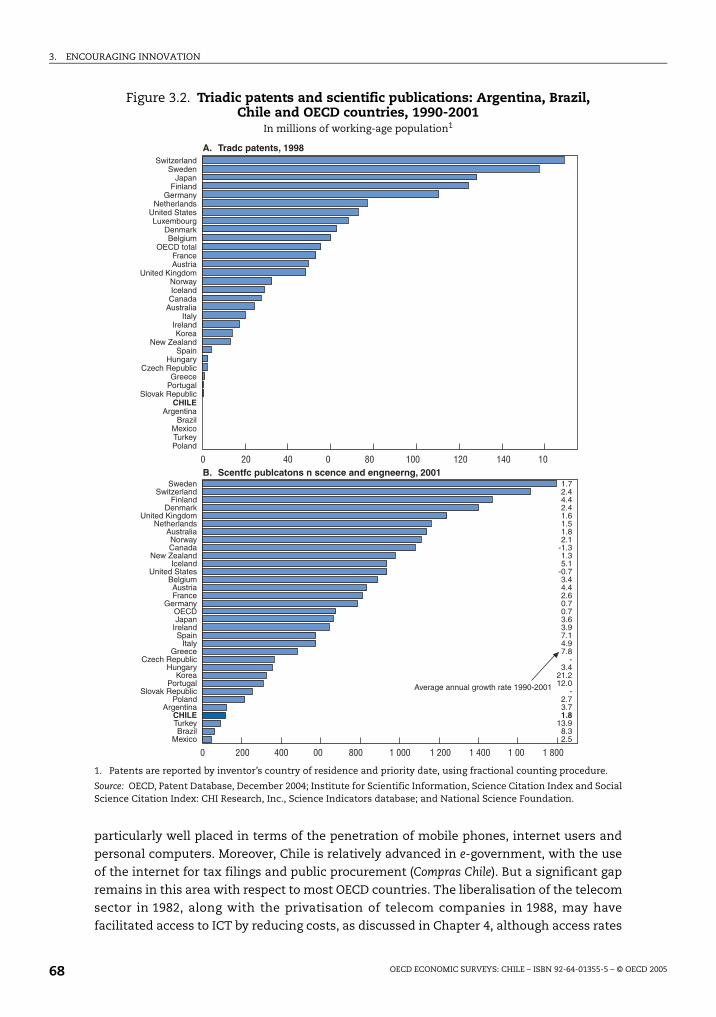
3. ENCOURAGING INNOVATION
OECD ECONOMIC SURVEYS: CHILE – ISBN 92-64-01355-5 – © OECD 200568
particularly well placed in terms of the penetration of mobile phones, internet users and
personal computers. Moreover, Chile is relatively advanced in e-government, with the use
of the internet for tax filings and public procurement (Compras Chile). But a significant gap
remains in this area with respect to most OECD countries. The liberalisation of the telecom
sector in 1982, along with the privatisation of telecom companies in 1988, may have
facilitated access to ICT by reducing costs, as discussed in Chapter 4, although access rates
Figure 3.2. Triadic patents and scientific publications: Argentina, Brazil, Chile and OECD countries, 1990-2001
In millions of working-age population1
1. Patents are reported by inventor’s country of residence and priority date, using fractional counting procedure.
Source: OECD, Patent Database, December 2004; Institute for Scientific Information, Science Citation Index and SocialScience Citation Index: CHI Research, Inc., Science Indicators database; and National Science Foundation.
*%&*&<
:&5-
7&98&*94(56
5,$5
: 9
8&#&57-)&& 9
)-)&#
7;&*
>-%26
*B,26 !
$%
'(+,-&
1"$
*&*%&
:&5,
8&#&57&9
97-&
7;&)&
8&*9$5 9:
5-<)&*)-
%26
>-#
*B,26
&
!+,-$%
'(
+%)('$$"
B
01 03303 030A0.0 00!0!.001!03303 0A0101!0A!0103010
!03 0 0
01!01!00! 0.

3. ENCOURAGING INNOVATION
OECD ECONOMIC SURVEYS: CHILE – ISBN 92-64-01355-5 – © OECD 2005 69
hide large discrepancies between high- and low-income households, and large and
medium/small enterprises.4
Innovation activity is concentrated in large enterprises. Based on information
available from the 2002 R&D Census (covering all sectors of activity, except wholesale and
retail trade), private R&D intensity, at 0.2% of GDP, was concentrated in less than 1% of
firms (excluding micro-enterprises), with 26 large firms accounting for 60% of total
expenditure. Three-quarters of R&D spending was carried out by firms in the metropolitan
area of Santiago, which accounts for about one-half of all formally-registered firms in the
country. In terms of the sectoral distribution of R&D intensity, most spending was in
manufacturing (mainly pulp and paper products, wood and furniture, and food and
beverages), transport, and agriculture (Figure 3.4) – areas where Chile has comparative
Figure 3.3. Penetration of information and communication technologies (ICT): Argentina, Brazil, Chile and OECD countries, 2003
Units per 100 inhabitants
1. Emerging OECD refers to Czech Republic, Hungary, Mexico, Poland, Slovak Republic and Turkey; and advancedOECD refers to the remaining member countries.
Source: International Telecommunications Union.
5" ("""" & &) 1(
! $%5
&B&
Figure 3.4. R&D intensity, 2002Spending in % of value added
Source: Ministry of Economy (2004).
7
7
7
7
7
7
7
7
7
7
7
7
7
7
7
7
7
7
7
7
5
A'
6
,
#'
"
9"''
?
6"
5
-
'"
4'
6
(
'
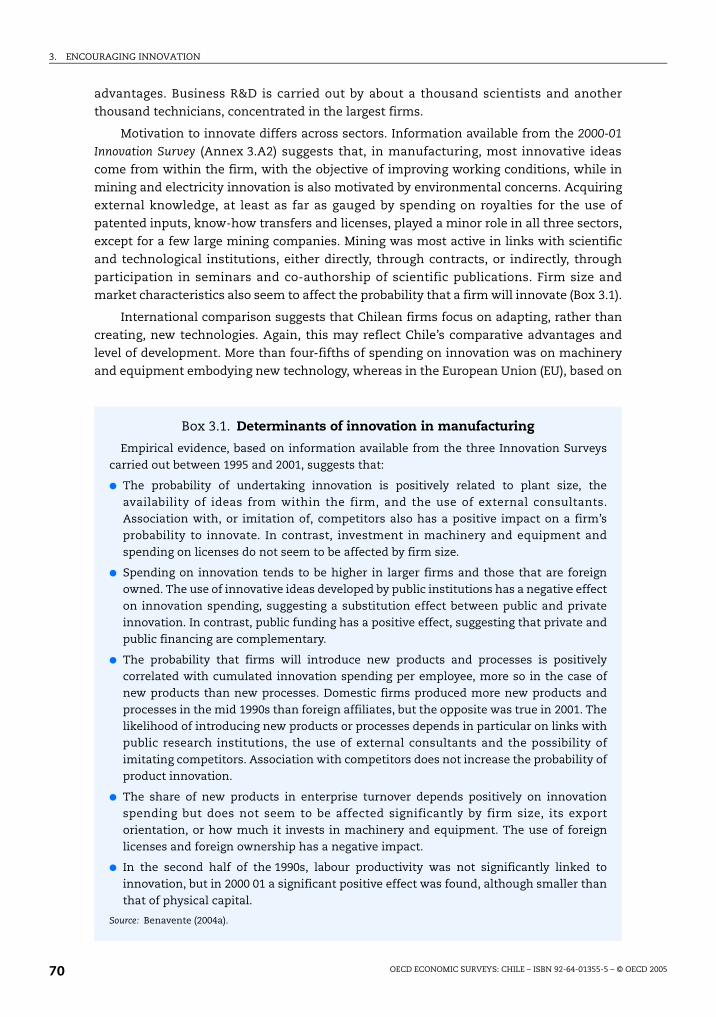
3. ENCOURAGING INNOVATION
OECD ECONOMIC SURVEYS: CHILE – ISBN 92-64-01355-5 – © OECD 200570
advantages. Business R&D is carried out by about a thousand scientists and another
thousand technicians, concentrated in the largest firms.
Motivation to innovate differs across sectors. Information available from the 2000-01
Innovation Survey (Annex 3.A2) suggests that, in manufacturing, most innovative ideas
come from within the firm, with the objective of improving working conditions, while in
mining and electricity innovation is also motivated by environmental concerns. Acquiring
external knowledge, at least as far as gauged by spending on royalties for the use of
patented inputs, know-how transfers and licenses, played a minor role in all three sectors,
except for a few large mining companies. Mining was most active in links with scientific
and technological institutions, either directly, through contracts, or indirectly, through
participation in seminars and co-authorship of scientific publications. Firm size and
market characteristics also seem to affect the probability that a firm will innovate (Box 3.1).
International comparison suggests that Chilean firms focus on adapting, rather than
creating, new technologies. Again, this may reflect Chile’s comparative advantages and
level of development. More than four-fifths of spending on innovation was on machinery
and equipment embodying new technology, whereas in the European Union (EU), based on
Box 3.1. Determinants of innovation in manufacturing
Empirical evidence, based on information available from the three Innovation Surveyscarried out between 1995 and 2001, suggests that:
The probability of undertaking innovation is positively related to plant size, theavailability of ideas from within the firm, and the use of external consultants.Association with, or imitation of, competitors also has a positive impact on a firm’sprobability to innovate. In contrast, investment in machinery and equipment andspending on licenses do not seem to be affected by firm size.
Spending on innovation tends to be higher in larger firms and those that are foreignowned. The use of innovative ideas developed by public institutions has a negative effecton innovation spending, suggesting a substitution effect between public and privateinnovation. In contrast, public funding has a positive effect, suggesting that private andpublic financing are complementary.
The probability that firms will introduce new products and processes is positivelycorrelated with cumulated innovation spending per employee, more so in the case ofnew products than new processes. Domestic firms produced more new products andprocesses in the mid 1990s than foreign affiliates, but the opposite was true in 2001. Thelikelihood of introducing new products or processes depends in particular on links withpublic research institutions, the use of external consultants and the possibility ofimitating competitors. Association with competitors does not increase the probability ofproduct innovation.
The share of new products in enterprise turnover depends positively on innovationspending but does not seem to be affected significantly by firm size, its exportorientation, or how much it invests in machinery and equipment. The use of foreignlicenses and foreign ownership has a negative impact.
In the second half of the 1990s, labour productivity was not significantly linked toinnovation, but in 2000 01 a significant positive effect was found, although smaller thanthat of physical capital.
Source: Benavente (2004a).

3. ENCOURAGING INNOVATION
OECD ECONOMIC SURVEYS: CHILE – ISBN 92-64-01355-5 – © OECD 2005 71
the 1998-2000 Community Innovation Survey, this share was around 40%. Consistent with
that difference, intramural R&D accounted for 11% of spending on innovation, compared to
over one-fifth in the EU. Labour training accounted for only 5% of innovation spending,
compared to one-fifth in the EU. In Chile, the composition of innovation spending in
mining and electricity was similar to that of manufacturing.
Survey data suggest that the major obstacle to innovation is economic, notably its
costs and investment risk. Human resources are considered the second most important
obstacle, including a shortage of skilled personnel and resistance on the part of employees
to changing work practices (see Chapter 5 for a discussion of firm-level labour training).
Based on the EU’s Community Innovation Survey, the ranking of obstacles appears to be
similar in Chilean and European firms. Nevertheless, despite the preponderance of
deterrents of an economic nature, enterprises in the manufacturing sector appear to have
made little use of public funding for R&D, accounting for less than 5% of total funds used
to finance spending on innovation. Enterprises in mining and electricity did not use public
funds at all, possibly due to access to financing, or reliance on technological transfers, from
parent companies abroad. On average, financing tends to come predominantly from
internal sources, with private external sources accounting for about one-quarter of the
funds used to finance innovation. In the EU, by contrast, one-third of manufacturing firms
made use of public funding for R&D. Links between public and private institutions create
network externalities and therefore also have a positive impact on private innovation
activity. Non-profit organisations, such as Fundación Chile, play an important role by
facilitating access by domestic firms to foreign technologies in which the country has
comparative advantages, such as the wine, salmon and fruit industries (Box 3.2).
Box 3.2. Fundación Chile
Fundación Chile is the largest private non-profit organisation fostering innovation inChile. Founded in 1976 by the Chilean government and the US ITT Corporation, its maingoal is to transfer state-of-the-art technology, management techniques and human skillsto natural resource-intensive sectors. To achieve its goals, Fundación Chile creates newcompanies and joint ventures, carries out R&D, adapts foreign technology for product andprocess innovation for client companies in the public and private sectors, and fosters thecreation of technological consortia and the diffusion of technology to small and mediumenterprises.
In recent years, Fundación Chile has focused on biotechnology (forestry genetics and DNAvaccines for aquaculture, among others), financial engineering and information (venturecapital), and management. It has also supported the development of clusters in particularin sectors in which Chile is believed to have comparative advantages, such as agribusiness,eco-tourism, forestry and wood processing. Its activities in the areas of skill upgradingfocus on life-long learning, long-distance education, the use of ICT in education andmanagement in education. It has been successful with starting new ventures. By 1999, ithad set-up 36 ventures, of which 17 had been sold. The six leading companies earnedrevenues surpassing the total cost of the Fundación Chile during its entire existence.
Source: www.fundacionchile.cl and Bitran (2002).

3. ENCOURAGING INNOVATION
OECD ECONOMIC SURVEYS: CHILE – ISBN 92-64-01355-5 – © OECD 200572
Fostering innovation: Chile’s strengths and weaknessesChile has several strong framework conditions that favour the diffusion of innovation.
As discussed in Chapter 1, the country’s main strengths include macro-economic stability,
competition-friendly product market regulations, and liberal foreign trade and investment
regimes, including foreign direct investment (FDI) legislation.5 Empirical evidence for OECD
countries shows that strong output growth, low inflation, deep financial and equity
markets, and pro-competition product market regulation are associated with higher R&D
intensity.6 Against this backdrop, the main issues that are addressed below are: i) direct
government support is delivered in a fragmented institutional setting that lacks a long-
term strategic focus; ii) the seed and risk capital markets are underdeveloped; iii) there is a
shortage of scientists and human capital is low; and iv) copyrights are poorly enforced.
Fiscal incentives
Chile’s mix of instruments to promote innovation in the business sector is tilted
towards direct government support. R&D spending is deductible against corporate income
tax liabilities, as well as one-half of donations to universities. But the bulk of fiscal
incentives comes from direct government support through a multiplicity of funds in an
institutional setting that suffers from fragmentation and lacks a long-term strategic focus.
Innovation funds are typically small and managed predominantly by the Ministries of
Education and Economy (Figure 3.5 and Annex 3.A1). The largest fund, FONDEF, managed
by the Ministry of Education (CONICYT), aims at encouraging business innovation and
fostering competitiveness in joint ventures with universities and technological institutes.
Other important funds, FDI and FONTEC, are managed by the government’s Economic
Development Agency (CORFO).7 In 2005, FDI and FONTEC were merged into a new
programme: Innova Chile. Two smaller funds are FIA (Agrarian Innovation Foundation) and
FIP (Fisheries Research Fund), managed by the Ministries of Agriculture and Economy,
respectively. Access to government support is granted through public tenders. Projects are
selected according to their economic impact, based on the objectives established by fund
managers. All projects require private-sector partnership.
Figure 3.5. Institutional set-up of public support for R&D1
1. Annex 3.A3 describes the individual funds.2. FDI and FONTEC were merged in 2005 into Innova Chile.
'9-=:
'9-=5- '9-=& '9-= 4'99
2: 7)F+ '5 *=&9
:7:
99 8B99 +-)99
)B:)@:7+ :7F+ :):) *99
)&B&9 $&-9
3. ENCOURAGING INNOVATION
OECD ECONOMIC SURVEYS: CHILE – ISBN 92-64-01355-5 – © OECD 2005 73
As illustrated by the manufacturing innovation surveys, access to public financing is
considered cumbersome by businesses. Firms are often discouraged from applying,
because they are reported not to know how to formulate a project proposal and fear that
their ideas will leak to competitors. Moreover, some firms complain that fund managers
and consultants do not have the technical expertise to evaluate projects, which may delay
the application process. Another disincentive is that, once a project is approved, fund
managers decide on the timeframe for execution, which may not match that of the firm.
An additional shortcoming often mentioned by firms is the lack of information on public
resources available to promote innovation.
Fragmentation in the delivery of government support renders policy coordination and
long-term planning difficult. In principle, a coordinating role is attributed to the Ministry of
Education (CONICYT); in practice, however, several ministries carry out their own R&D
activities and, to a large extent, formulate their own policies. In addition, the
fragmentation of public funds precludes potential economies of scale and scope, and
creates overlapping mandates. This is clearly detrimental to the efficient allocation of
scarce budgetary resources. For example, FDI and FONDEF often cater to a similar client
base and seek to overcome comparable market failures (Annex 3.A3).8
Cooperation between businesses and research institutions is weak, discouraging the
creation of network externalities, which are important determinants of innovation.
Information available from the 2000-01 Innovation Survey suggests that less than 5% of
manufacturing firms cooperate with universities. This may be due to the fact that
academic research is insufficiently adapted to firms’ needs, and that many researchers
may be reluctant to cooperate with the business sector. Many firms may also be unable or
unwilling to adopt or find commercial use for new technologies. Cooperation is weak even
in resource-intensive sectors, where the existence of government-funded technological
institutes could facilitate the diffusion of technology to the business sector and foster
cooperation with, and among, firms.9 An evaluation illustrates that firms that do cooperate
with universities spend almost twice as much on R&D, engage in more product and process
innovations, and have higher labour productivity growth.10
Risk and seed capital
The risk and seed capital markets are shallow. These instruments are important to
fund risky innovation projects, particularly for entrepreneurs at an early stage of the R&D
process, having no record of successful research undertakings, limited access to external
funds and facing internal financing constraints. The development of the venture capital
industry is hindered by the low liquidity of the capital market, which reduces exit options
for venture capital investors; restrictions on the exit of foreign capital, such as the
requirement that foreign equity investment must remain in Chile for at least 1 year, which
may discourage entry;11 prudential regulations on pension and mutual fund investment in
venture capital, which reduces the investment pool; insufficient competition in the
financial sector; and the country’s small size and geographical remoteness, which may
discourage foreign investors. To some extent, the preponderance of government financing
for innovation may be crowding out equity financing. Based on a survey conducted by a
NGO in 2003, of the USD 38 million of funds available for new business ventures and
projects in 2002, 87% were public.12 This included FONDEF and CORFO, through FONTEC
and its Seed Capital Programme.13 The main private funds in 2002 were Fundación Andes,
Negocios Regionales and Santiago Innova.
3. ENCOURAGING INNOVATION
OECD ECONOMIC SURVEYS: CHILE – ISBN 92-64-01355-5 – © OECD 200574
Demand factors, not only supply constraints, have contributed to the relative
underdevelopment of venture capital. Anecdotal evidence suggests that there is a lack of
high-quality projects because Chile’s economy is small and resource-based, and has low
R&D intensity.14 Another impediment is the traditional ownership structure in the
business sector: firms are unwilling to grant special rights to minority shareholders, which
is essential to venture capital, and stock options are not widespread as a means of labour
compensation.15 New businesses are typically financed with credit from family or friends,
and when their venture matures, they switch to bank financing, skipping the intermediate
steps of equity financing through seed and venture capital. This is at odds with OECD
trends, where equity financing became more important relative to bank credit during 1996-
2000.
Policy initiatives to foster the development of venture capital have so far focused on
capital market regulations, as discussed in the 2003 Survey. In 1989 pension funds were
allowed to invest 5% of their assets under management in FIDES (Investment Funds for
Enterprise Development). Mutual funds were allowed to invest 10% of their assets in FIDES
in 2000 (Ley de OPAS).16 The 2002 capital market reform created a new stock market for
emerging companies, eliminated taxes on capital gains for high-turnover stocks and for
short sales of bonds and stocks, reduced tax for international financial transactions and
strengthened minority shareholder rights.
Recent initiatives to develop venture capital include the Capital Market Reform, MK II,
currently in Congress. The main aspects of this reform are as follows. First, tax incentives
would be granted, including the introduction of a capped exemption from income taxation
of the capital gains on equity holdings of firms where capital funds participate with at least
20% of the firm’s capital and for a minimum of one and a half year. Second, a new type of
corporation of limited liability would be created, facilitating the participation of venture
capitalists.17 Third, CORFO would be authorised to invest in venture capital funds through
quotas (currently, CORFO can only lend to those funds). Finally, legal barriers to the
management of small companies by the venture capital fund managers would be lifted. To
encourage demand for venture capital, government initiatives include CORFO’s National
Incubator Programme for private firms with the obligatory participation of universities or
technological institutes.18 Fundación Chile would also foster ventures among risk capital
investors.
Enrolment in higher education
Innovation is hampered by a lack of human capital. This is despite the rapid increase
in the enrolment rate in higher education over the last decade, from 14% to 28%
between 1990 and 2002.19 Enrolment in post-tertiary education also expanded rapidly, and
the number of Masters and PhD degrees increased almost five-fold during 1991-2001.20
Nevertheless, tertiary and post-tertiary enrolment remains low compared to OECD
countries. Also, the quality of higher-education institutions is heterogeneous, and
vocational training schools often operate with outdated curricula. To improve quality,
in 1999 the Ministry of Education started an accreditation programme for higher-education
institutions on a voluntary basis. By February 2005, 62 institutions were participating,
covering 85% of the students in higher education, of which 19 have been accredited.21 To
improve access to higher education, especially among students from low- and middle-
income households, the system for student loans is being upgraded with a new scheme,
discussed in Chapter 1.
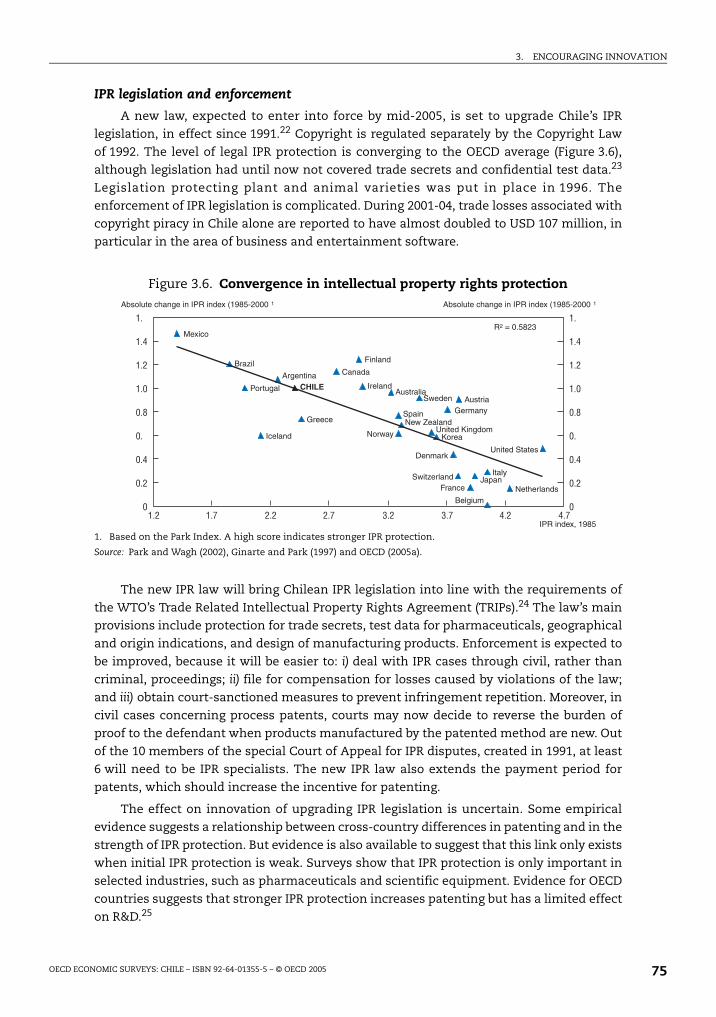
3. ENCOURAGING INNOVATION
OECD ECONOMIC SURVEYS: CHILE – ISBN 92-64-01355-5 – © OECD 2005 75
IPR legislation and enforcement
A new law, expected to enter into force by mid-2005, is set to upgrade Chile’s IPR
legislation, in effect since 1991.22 Copyright is regulated separately by the Copyright Law
of 1992. The level of legal IPR protection is converging to the OECD average (Figure 3.6),
although legislation had until now not covered trade secrets and confidential test data.23
Legislation protecting plant and animal varieties was put in place in 1996. The
enforcement of IPR legislation is complicated. During 2001-04, trade losses associated with
copyright piracy in Chile alone are reported to have almost doubled to USD 107 million, in
particular in the area of business and entertainment software.
Figure 3.6. Convergence in intellectual property rights protection
1. Based on the Park Index. A high score indicates stronger IPR protection.
Source: Park and Wagh (2002), Ginarte and Park (1997) and OECD (2005a).
The new IPR law will bring Chilean IPR legislation into line with the requirements of
the WTO’s Trade Related Intellectual Property Rights Agreement (TRIPs).24 The law’s main
provisions include protection for trade secrets, test data for pharmaceuticals, geographical
and origin indications, and design of manufacturing products. Enforcement is expected to
be improved, because it will be easier to: i) deal with IPR cases through civil, rather than
criminal, proceedings; ii) file for compensation for losses caused by violations of the law;
and iii) obtain court-sanctioned measures to prevent infringement repetition. Moreover, in
civil cases concerning process patents, courts may now decide to reverse the burden of
proof to the defendant when products manufactured by the patented method are new. Out
of the 10 members of the special Court of Appeal for IPR disputes, created in 1991, at least
6 will need to be IPR specialists. The new IPR law also extends the payment period for
patents, which should increase the incentive for patenting.
The effect on innovation of upgrading IPR legislation is uncertain. Some empirical
evidence suggests a relationship between cross-country differences in patenting and in the
strength of IPR protection. But evidence is also available to suggest that this link only exists
when initial IPR protection is weak. Surveys show that IPR protection is only important in
selected industries, such as pharmaceuticals and scientific equipment. Evidence for OECD
countries suggests that stronger IPR protection increases patenting but has a limited effect
on R&D.25
7
7 77777 77
7
7
7
7
7
7
7
7
7
7
7
7
7
7
7
69)2&(. 69)2&(.
)2&(.
2 0. !'(
$%
!
)&
:&
&
)& 9
95-
#8&#&5
7;&*
7-
5,8&*9
7&9$5
:*%& )-
<
*&
3. ENCOURAGING INNOVATION
OECD ECONOMIC SURVEYS: CHILE – ISBN 92-64-01355-5 – © OECD 200576
The number of patents filed in Chile is low, but appears to be trending upwards. In
addition to a poor record in patenting abroad, relatively few patent applications are filed
and approved in Chile: only 3 600 patents were approved during 1992-2000, which is about
one-tenth of the number approved in Mexico, a regional comparator. The process of
handling patent applications by the Industrial Patents Department of the Ministry of
Economy is not considered overly time-consuming (less than 5 years during 1995-2003), or
costly (currently about USD 760-860), although estimates vary considerably.26 To speed up
patent applications and to handle a larger number of applications, this department was
allowed to more than double its staff in 2005.
Moving forward: How to boost innovation?
What to expect from further direct government support
Central to the government’s policy agenda to boost innovation activity is an increase
in direct support. The government intends to double public R&D spending from 0.4% to
0.8% of GDP in a phased manner over the next three years, to be financed by revenue from
the new mining tax, discussed in Chapter 1.27 This will accentuate the current imbalance
in the mix of instruments available for fostering innovation, which is already tilted in
favour of direct government support. It should be noted that international experience
suggests that properly designed tax incentives also contributes to boosting R&D intensity
(Box 3.3), but there are no international “best practices” in this area. Simulations for Chile
illustrate that the fiscal burden of tax incentives would be relatively small.28
Greater reliance on direct government support may run into governance problems.
With increased sources of financing, the authorities may find it difficult to muster the
necessary support in the research community for rationalising the existing funds with the
aim of tackling fragmentation in the panoply of instruments for delivering government
support. The increase in the availability of funds, although gradual over the near term, is
also likely to place an additional burden on fund managers to adequately assess the merits
of individual applications and the cost-effectiveness of their project portfolios against the
policy objectives set by the government. The assessment of existing projects is already
perceived as inadequate and will need to improve if the analysis of the cost-effectiveness
of alternative policy instruments is to be carried out more thoroughly in the years to come.
Innovation policy, regardless of the support instruments used, should be consistent
with Chile’s comparative advantages. Scarce public funds should not be used to “pick
winners”. Direct government support will be effective to the extent that it targets firms
facing limited access to external financing and with insufficient taxable income to make
use of additional tax incentives, should these be introduced pending congressional
approval of the Capital Market Reform (MK II) package. It is true that comparative
advantages change over time, and Chile may already be close to the technological frontier
in some niche areas, discussed in Chapter 1. But innovation would have a higher pay-off in
most sectors if it focused on the diffusion of state-of-the-art technologies adapted to
business needs. This would favour support for the diffusion/adoption of general-purpose
technologies with the broadest sectoral application possible, in particular information and
communication technologies. Greater emphasis on support for applied research would be
consistent with this objective. This emphasis has already guided the design of Innova Chile,
the new private innovation support programme of the Ministry of Economy, but much
remains to be done in other areas.
3. ENCOURAGING INNOVATION
OECD ECONOMIC SURVEYS: CHILE – ISBN 92-64-01355-5 – © OECD 2005 77
Support for innovation is also most effective when oriented to backward, rather than
forward, linkages in the economy. This can maximise the benefits from economies of scale
and geographical proximity among suppliers, improving quality and fostering human
capital accumulation. As discussed in the 2003 Survey, existing clusters have proved
beneficial for participating firms in achieving scale economies, developing infrastructure
and accessing new technologies. Public R&D and labour training could be used to stimulate
the creation of clusters and their specific needs. Cooperation should also be fostered
between businesses and universities. This can be achieved through “knowledge brokers”
helping university researchers to find commercial use for their inventions. Other initiatives
would include the creation of science and technology parks and incubators, but this should
be carried out with great care as international evidence on the cost-effectiveness of these
Box 3.3. Fiscal incentives for R&D: The experience of OECD countries
Many governments encourage innovation on the grounds of market failures due to highsocial, but often low private, rates of return. Conventional incentives include directgovernment support and tax relief for R&D expenditures. Direct support can be advocatedon the grounds that innovation can be carried out by small firms that have little taxableincome and do not have access to market financing, but may suffer from governanceproblems associated with capture by interest groups, especially if programmes lacktransparency and are not adequately evaluated, and funding is not granted in acontestable manner. Tax incentives tend to be more market oriented but create thepossibility that research effort may be duplicated unnecessarily and out of line with socialpriorities.
Evaluating the effectiveness of fiscal incentives is difficult and requires judgment aboutthe extent of the market failures that would prevent innovation, the social value ofgovernment financed research and their spillover benefits for other activities. Bothinstruments – tax relief and direct support – suffer from potential deadweight losses.
The experience of OECD countries suggests that there has been a trend in the policy mixsince the 1980s towards greater reliance on tax incentives, rather than direct governmentsupport for R&D spending. Two key factors behind this change have been a reduction indirect support for defence related research and the need in many countries for budgetaryconsolidation.*
Empirical evidence for OECD countries is not clear cut but suggests that tax incentivestend to be more strongly correlated with innovation activity than direct subsidies. But theeffect of subsidies on innovative activity appears to depend on initial conditions. Higherdirect subsidies tend to have a small positive effect on R&D intensity, especially when thecorporate profit share is low, suggesting that the availability of funding from thegovernment can help to alleviate potential financial constraints. At other times, highersubsidies are found to reduce measured innovative activity, possibly because some typesof research undertaken directly for the government are more likely to be kept secret, ratherthan being made publicly available through patenting.
Empirical evidence is affected by the fact that it is more difficult to monitor take up ratesin the case of tax incentives than grants. Findings also seem to be stronger when based oncountry or industry level data than with micro econometric data, possibly because thehigher level of aggregation is more likely to capture broader inter sectoral spillovers fromthe supported research.
* See OECD (2003), for more information.
3. ENCOURAGING INNOVATION
OECD ECONOMIC SURVEYS: CHILE – ISBN 92-64-01355-5 – © OECD 200578
initiatives is far from unequivocal. A pilot programme in the Netherlands has introduced
government-financed “innovation vouchers”, which firms can redeem against the
purchase of innovation services, as a means to foster network externalities and deepen
cooperation between businesses and research institutions.
Consolidating public institutions and policies
On-going efforts to address the fragmentation and coordination problems in the
delivery of government support have been insufficient. Recent initiatives to step up
coordination include the Chile Innova29 programme launched by the Ministry of Economy
and the consolidation of CORFO’s FDI and FONTEC funds into Innova Chile. These are steps
in the right direction. But more comprehensive reform is needed, extending these
otherwise piecemeal initiatives to other areas of the National Innovation System.
Reform efforts should gain renewed impetus with the creation, pending congressional
approval of draft legislation, of a new National Innovation Council, attached to the
Presidency, including several ministers and representatives from the academic and
business communities. The Council would set goals, formulate policies, rationalise
existing programmes and create incentives to foster cooperation between and within the
private and public sectors. The experience of OECD countries with different institutional
set-ups is instructive (Box 3.4). Again, governance challenges should not be
underestimated, because the creation of an additional institution in an already complex
set-up, without the appropriate rationalisation of the existing instances for policymaking
and the delivery of government support, may do little to address the problem of
fragmentation and overlapping of functions and responsibilities.
IPR, copyright and venture capital
The main policy objective with regard to copyrights should be better enforcement.
With regard to IPR protection, the new IPR law is a considerable improvement and is
expected to facilitate enforcement by permitting dispute resolution through civil
procedures. But the ultimate test of reform in this area will be implementation. Additional
supporting measures could include stricter sanctions for non-compliance to discourage
infringement of the copyright and IPR legislation. More coordinated action by the police,
the customs authorities and the judiciary could do much to step up enforcement in
manufacturing and retail distribution, tighten border controls and reduce street sales of
pirated materials. The implementation of Chile’s free trade agreements with the European
Union and the United States is expected to call for stricter law enforcement. With regard to
the processing of patent applications, the doubling of staff of the Industrial Patent
Department of the Ministry of Economy is expected to make patent applications speedier.
But this department could be granted operational autonomy with its own professional staff
and resources, in line with trends in OECD countries.
Development of the venture capital industry would benefit from further capital
market reform. Prudential regulations on pension and mutual fund investment in these
markets have been eased over the years. The further deepening of capital market reform,
through MK II, currently in Congress, would therefore be welcome. But further
development is contingent on the demand for funds, which should increase with private
innovation activity in general. The government can also contribute in this area,
predominantly through technical assistance and initiatives to improve entrepreneurial
education at universities and business programmes, and the quality of business plans,

3. ENCOURAGING INNOVATION
OECD ECONOMIC SURVEYS: CHILE – ISBN 92-64-01355-5 – © OECD 2005 79
Box 3.4. National Innovation Systems: The case of Australia, Finland, New Zealand and Sweden
In Australia, the Science, Engineering and Innovation Council oversees the country’snational innovation system. The Council is chaired by the Prime Minister. Membersinclude Cabinet ministers, leading researchers and the business community. A majorprogramme is Backing Australia’s Ability, which runs through 2010-11 and builds on aninitial programme implemented in 2001. The programme focuses on three main goals:i) favouring R&D, mainly through the Australian Research Council and its NationalCompetitive Grants Programme, and supporting collaborative networks; ii) acceleratingthe commercial application of ideas, with support for competitive research, technologydiffusion and early-stage commercialisation activities; and iii) developing and retainingskills, through improving the quality of science, mathematics and technology teaching andlearning at schools, new university places with a priority on ICT programmes, andincreased awareness of the importance of science and technology in Australian society.
Since the mid-1990s, the Finnish national innovation system has attracted internationalattention. It is characterised by strong leadership from the Science and Technology PolicyCouncil (STPC), established in 1987, which is in charge of the development andcoordination of national policies. The Council is headed by the Prime Minister. STPCmembers include the Ministers of Science and Technology and Finance; seniormanagement from universities, public research and technological institutes; the businesssector; and representatives from employers’ and employees’ organisations. The NationalTechnology Agency (TEKES) is the main source of public funding for applied research andindustrial R&D. It operates under the Ministry of Trade and Industry but enjoysconsiderable policymaking and operational autonomy. The Academy of Science andLetters promotes scientific and scholarly research.
In New Zealand, public funds are administered by a number of public institutions: theFoundation for Research, Science and Technology (FRST), the Royal Society of New Zealand,the Health Research Council, the Ministry of Research Science and Technology, the TertiaryEducation Commission, the Ministry of Education, New Zealand Trade and Enterprise andthe Venture Investment Fund. Most funds are allocated on a contestable basis to universities,public laboratories (Crown Research Institutes, CRIs) and private firms, which can bid forFRST funds. The funds are allocated to those projects having the highest knowledgespillovers for the country as a whole. CRIs are increasingly oriented towards applied researchand receive one-half of their revenue from FRST and the remainder from other governmentagencies and private sources. CRIs are expected to earn a return on assets to cover the costof capital and are encouraged to patent the intellectual property resulting from theirresearch. In 2002, around 20% of R&D carried out by CRIs and government departments wasfunded by business, against an OECD average for comparable institutions at 9.3%.
In Sweden, innovation policy is coordinated by the Ministries of Education and Science,and Industry, Employment and Communication, although other ministries also supportinnovation activities. Decision-making and implementation is carried out through formalmechanisms and informal networks at the ministerial and agency levels. The ResearchAdvisory Board, which is chaired by the Minister of Education and Science and includesrepresentatives from the research community and industry, plays the main coordinatingrole. Funding for research is provided by the Swedish Research Council and the SwedishAgency for Innovation Systems (VINNOVA), with the latter focusing on applied research.Sweden has numerous innovation-oriented partnerships among R&D-intensivemanufacturing groups, public agencies and universities.
Source: Australia: Department of Education, Science and Training (2005). Finland: OECD (2005b). New Zealand:OECD (2004b). Sweden: European Commission (2004).

3. ENCOURAGING INNOVATION
OECD ECONOMIC SURVEYS: CHILE – ISBN 92-64-01355-5 – © OECD 200580
under CORFO’s Technical Assistance Fund and training of consultants. Other possible
initiatives include the establishment of networks of business incubators to exchange
information on best practices, and a reform of CORFO’s seed and risk capital funds.
Notes
1. See OECD (2005a), for more information.
2. Sheenan and Wykoff (2003) show that R&D intensity is strongly correlated with productionstructure. In high R&D-intensity countries, such as Finland, Germany, Japan, Switzerland and theUnited States, most business R&D is spent, and output is produced, in high-technology sectors. Inlow R&D-intensity countries, such as Australia, Iceland and Norway, high-tech industries accountfor only a small share of output. See also Mullin et al. (1999).
3. See Holm-Nielsen and Agapitova (2002), for more information. In 2002, a first national census ofprivate R&D showed spending to be 74% higher in real terms than in 2001, compared to an increaseof 7% in the public sector over the period, which may be an indication that the private innovationeffort had previously been underestimated.
4. Small enterprises face several constraints for ICT use: high costs of equipment, lack ofunderstanding of potential benefits of ICT use and skill shortages. See World Bank (2004), for moreinformation.
Box 3.5. Chapter 3: Summary of the main recommendations
General principles
Focus policy on long-term planning, fostering business-financed innovation, andfacilitating the diffusion of innovation. Encourage cooperation between businesses andresearch institutions.
Prioritise areas with greatest backward, rather than forward, linkages in the economyand in line with Chile’s comparative advantages.
Government support
Avoid “picking winners” in dynamic sectors that already have access to financing forinnovation and/or technological transfers from parent companies abroad. Target directgovernment support to firms that have limited access to external financing.
Reduce fragmentation and duplication in the delivery of government support.
Improve the governance and cost-effectiveness of innovation funds by strengtheningproject evaluation and allocating funds on a contestable basis. Better disseminateinformation on the public resources available to promote innovation.
Higher education and vocational training
Continue to facilitate access to higher education, especially for students from low- andmiddle-income households.
Step up efforts to improve quality through the accreditation of higher-educationinstitutions. Consider the option of making accreditation compulsory.
Make vocational training more attuned to market demand.
IPR protection and risk/venture capital
Improve the enforcement of copyright protection and speed up the processing of patentapplications.
Develop risk and venture capital through further capital market reform. Work towardscongressional approval of the Capital Market Reform (MK II) package.
3. ENCOURAGING INNOVATION
OECD ECONOMIC SURVEYS: CHILE – ISBN 92-64-01355-5 – © OECD 2005 81
5. Empirical evidence suggests that exporters in the manufacturing sector are more likely to engagein product and process innovations than non-exporters. See Alvarez and Robertson (2004), formore information.
6. For product markets, theory predicts that when competition rises from a low level, potentialcompetitors have an incentive to innovate to converge to, or supersede, the technologies used byincumbents. At high levels of competition, expected rents from new innovations may be low anddiscourage incumbents from carrying out R&D. In the case of employment protection legislation(EPL), high protection may create mismatches in the demand and supply of researchers and wagepressures, thereby discouraging restructuring at the enterprise level, which may be needed toincorporate new technologies. At the same time, high protection reduces labour turnover andallows firms to better use specific skills which in turn favour innovation. See OECD (2005a), formore discussion and empirical evidence for OECD countries.
7. FONTEC covers up to one-half of project costs and provides financing for projects related totechnology transfer, innovation, infrastructure and management training. FDI co-financesinvestment projects and supports business start-ups. Co-financing is offered for the developmentand adoption of new (and cleaner) technologies and technology diffusion. Support for newbusinesses is provided in the form of promoting business alliances, incubator programmes andventure capital. See World Bank (2004) and OECD (2005c), for more information.
8. Other examples of overlapping mandates are the Millenium Initiative and FONDECYT, theKnowledge Economy Science Programme and the Chile Innova programme, and among FIA, FIP, FDIand FONTEC.
9. The main ones are: Metallurgical and Mining Research Centre (CIMM), Natural Resource ResearchCentre (CIREN), Fisheries Promotion Institute (IFOP), Forestry Institute (INFOR), and Agricultureand Livestock Research Institute (INIA). See Rivas (2004a), for an assessment of these institutions.
10. See Benavante (2004b), for more information.
11. According to Art.4 of DL 600.
12. See Fundes (2003), for more details.
13. This programme promotes the creation of new businesses at the incubator and start-up stagesusing new or emerging technologies. It funds up to CLP 35 million per undertaking. Between 2001and mid-2003, it funded 43 projects (out of 150 applications), amounting to CLP 1 billion, mostlyrelated to ICT, but also foodstuffs and health care. The evaluation of projects is outsourced toprivate consultants on risk capital (patrocinadores) following pre-selection by CORFO in a processthat is considered burdensome and inefficient. According to CORFO executives, patrocinadores havedifficulty in assessing the projects’ risks and potential. As patrocinadores are paid for the executionof approved projects, but not for the evaluation of project proposals, they have shifted the burdenof project evaluation to CORFO (Rivas, 2004b).
14. See Rivas (2004b), for more information.
15. See World Bank (2004), for more information.
16. See p. 99 of Ley de OPAS (www.svs.cl).
17. This type of cooperation would allow for example minority shareholder to impose certaindecisions. See Rivas (2004b, p. 22), for more information. Empirical evidence for OECD countriessuggests that financial sector development, stock market capitalisation and the share of corporateprofits in GDP all have a positive impact on R&D. See OECD (2005a), for more information.
18. The programme finances up to 60% of project costs for up to three years and a maximum ofUSD 250 thousand, including 8 incubators (63 projects).
19. In May 2004, there were 64 universities (of which 25 public), 48 professional institutes (all private)and 117 technical training centres. Graduate research is supported by CONICYT. See OECD (2004a)and World Bank (2004), for more information
20. This refers to Masters and PhD degrees granted by the universities affiliated with Consejo deRectores. For more information, see CONICYT (www.conicyt.cl).
21. For more information, see Comisión Nacional de Acreditación de Pregrado (www.cnap.cl).
22. The new IPR law was approved by Congress in March 2005, but will not enter into force untilissuance of specific regulations, expected by mid-2005. The 1991 law introduced standardproceedings for granting patents, trademarks, utility models, and industrial designs.

3. ENCOURAGING INNOVATION
OECD ECONOMIC SURVEYS: CHILE – ISBN 92-64-01355-5 – © OECD 200582
23. See International Intellectual Property Alliance (IIPA) (2005), for more information. In 2005, IIPAupgraded Chile from the “watch list” to the “priority watch list”, highlighting the adoption of betteranti-piracy measures following the approval of the new IPR law.
24. As a developing country, Chile was allowed to postpone the harmonisation of national legislationto comply with TRIP provisions until 1 January 2000. However, legislation had not been approveduntil 2005.
25. See OECD (2005a), for more information.
26. See US Embassy in Santiago (2004) and World Bank (2004), for more information.
27. See Eyzaguirre et al. (2005), for more information.
28. See Benavente (2003), for more information.
29. The following institutions participate in Chile Innova: CORFO, CONICYT, Ministry of Agriculture(FIA), National Institute of Norms (INN) and Fundación Chile. Chile Innova has been financed by aUSD 100 million loan from the IADB and the same amount by the government. Priority areas(e.g., biotechnology, ICT and competitiveness in small and medium enterprises, SMEs) and sectors(e.g., agriculture, fishing, wood industry, renewable energy, e-education and tourism) have beenidentified in response to a survey among stakeholders in the public and private sectors. Prior toChile Innova, there were two main coordination efforts: the Science and Technology Programme(1992-95) and the Technological Innovation Programme (1996-2000). The first focused on basicresearch and had as participants FONDECYT, FONDEF, and FONTEC. The second emphasisedinnovation and included the same membership as the previous programme, as well as the Ministryof Agriculture.
Bibliography
Alvarez, R. and R. Robertson (2004), “Exposure to Foreign Markets and Plant-level Innovation: Evidencefrom Chile and Mexico”, Journal of International Trade and Economic Development, Vol. 13, No. 1, pp. 57-87.
Australian Department of Education, Science and Training (2005), “Backing Australia’s Ability –Building Our Future through Science and Innovation”, http://backingaus.innovation.gov.au.
Benavente, J.M. (2003), “Gastos Privados en Investigación y Desarrollo Chile: Aspectos Teóricos yMetodológicos para el Diseño de un Sistema de Incentivo Público”, Unpublished manuscript,University of Chile, Santiago.
Benavente, J.M. (2004a), “Inovación Tecnológica en Chile: Dónde Estamos y Qué se Puede Hacer”,Working Paper, No. 295, Central Bank of Chile, Santiago.
Benavente, J.M. (2004b), “Cooperación Tecnológica Entre Universidades y Empresas: Qué Son, CómoOperan y Cuál Es Su Impacto en Chile”, En Foco, No. 21, Expansiva, Santiago.
Bitran, E. (2002), “Fundación Chile: Technology Transfer”, Presentation at the Argentina, Brazil, Chileand Mexico Policy Forum on Using Knowledge for Development, Monterrey, June.
Chile Innova (2003), Políticas Tecnológicas: Encuesta sobre Innovación y Productividad (Results of thirdinnovation survey), Ministry of Economy, Santiago.
European Commission (2004), Annual Innovation Policy Report for Sweden, Enterprise and IndustryDirectorate General, Innovation Policy Development Unit, Luxembourg.
Eyzaguirre, N., M. Marcel, J. Rodríguez and M. Tokman (2005), “The Way to the Economy of Knowledge:The Road to Growing Equitably in the Long Term”, Estudios Públicos, No. 97, Centro de EstudiosPúblicos, Santiago, pp. 5-57.
Fundes (2003), Apoyos para el Emprendimiento: Documento Exploratorio, Fundes, Santiago.
Ginarte, J.C. and W.G. Park (1997), “Determinants of Patent Rights: A Cross-National Study”, ResearchPolicy, Vol. 26, pp. 283-301.
Holm-Nielsen, L. and N. Agapitova (2002), “Chile – Science, Technology and Innovation”, LCSHD PaperSeries, No. 79, Department of Human Development, World Bank, Washington, DC.
International Intellectual Property Alliance (2005), International Intellectual Property Alliance 2005 Special301 Report on Global Copyright Protection and Enforcement, IIPA, Washington, DC.
Ministry of Economy (2004), Políticas Tecnológicas: Gasto en Investigación en Empresas del Sector Privado,Ministry of Economy, Santiago.

3. ENCOURAGING INNOVATION
OECD ECONOMIC SURVEYS: CHILE – ISBN 92-64-01355-5 – © OECD 2005 83
Mullin, J., R.M. Adam, J.E. Halliwell and L.P. Milligan (1999), Science, Technology, and Innovation in Chile,International Development Research Centre, Ottawa.
OECD (2003), Tax Incentives for Research and Development: Trends and Issues, OECD, Paris.
OECD (2004a), Reviews of National Policies for Education – Chile, OECD, Paris.
OECD (2004b), Economic Survey of New Zealand, OECD, Paris.
OECD (2005a), “Innovation in the Business Sector”, Internal OECD document, OECD, Paris.
OECD (2005b), Innovation Policy and Performance: A Cross-Country Comparison, OECD, Paris.
OECD (2005c), OECD Environmental Performance Reviews: Chile, OECD, Paris.
Park, W.G. and S. Wagh (2002), “Index of Patent Rights”, in Economic Freedom of the World 2002: AnnualReport, The Cato Institute, Washington, DC.
Rivas, G. (2004a), “Innovación Tecnológica en Chile: Políticas para Fortalecerla”, Unpublishedmanuscript, Santiago.
Rivas, G. (2004b), “El Capital de Riesgo y sus Posibilidades de Desarrollo en Chile”, Unpublishedmanuscript, Santiago.
Sheenan, J. and A. Wykoff (2003), “Targeting R&D: Economic and Policy Implications of Increasing R&DSpending”, STI Working Paper, No. 2003/8, OECD, Paris.
US Embassy in Santiago (2004), 2004 Country Commercial Guide – Chile, US Embassy, Santiago.
World Bank (2004), Chile: New Economy Study, World Bank, Washington, DC.
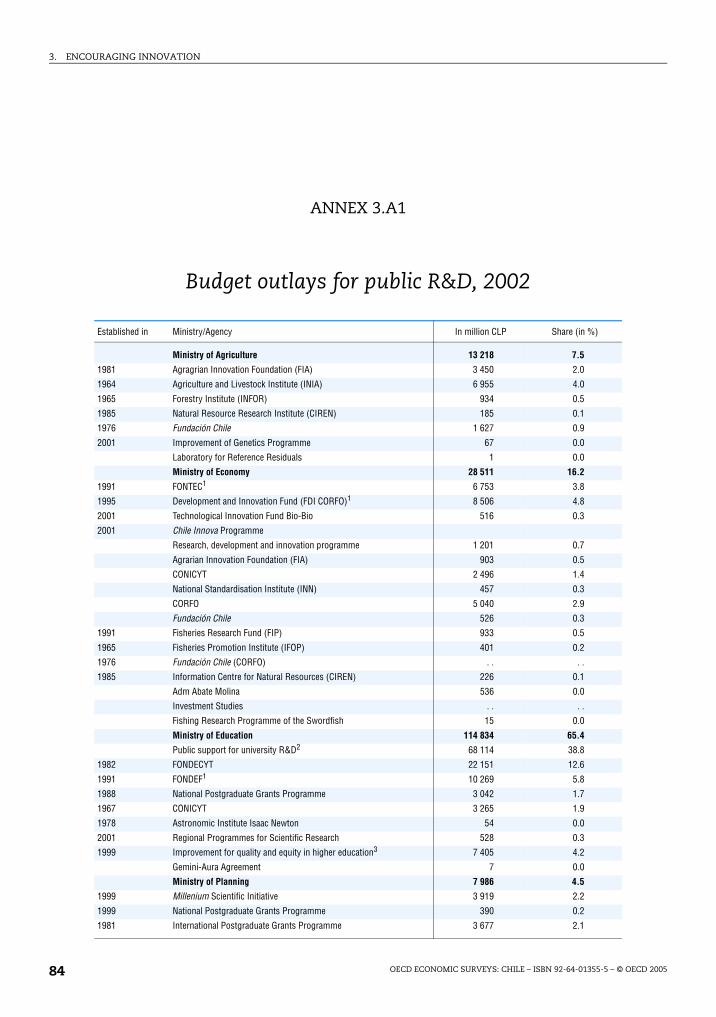
3. ENCOURAGING INNOVATION
OECD ECONOMIC SURVEYS: CHILE – ISBN 92-64-01355-5 – © OECD 200584
ANNEX 3.A1
Budget outlays for public R&D, 2002
Established in Ministry/Agency In million CLP Share (in %)
Ministry of Agriculture 13 218 7.5
1981 Agragrian Innovation Foundation (FIA) 3 450 2.0
1964 Agriculture and Livestock Institute (INIA) 6 955 4.0
1965 Forestry Institute (INFOR) 934 0.5
1985 Natural Resource Research Institute (CIREN) 185 0.1
1976 Fundación Chile 1 627 0.9
2001 Improvement of Genetics Programme 67 0.0
Laboratory for Reference Residuals 1 0.0
Ministry of Economy 28 511 16.2
1991 FONTEC1 6 753 3.8
1995 Development and Innovation Fund (FDI CORFO)1 8 506 4.8
2001 Technological Innovation Fund Bio-Bio 516 0.3
2001 Chile Innova Programme
Research, development and innovation programme 1 201 0.7
Agrarian Innovation Foundation (FIA) 903 0.5
CONICYT 2 496 1.4
National Standardisation Institute (INN) 457 0.3
CORFO 5 040 2.9
Fundación Chile 526 0.3
1991 Fisheries Research Fund (FIP) 933 0.5
1965 Fisheries Promotion Institute (IFOP) 401 0.2
1976 Fundación Chile (CORFO) . . . .
1985 Information Centre for Natural Resources (CIREN) 226 0.1
Adm Abate Molina 536 0.0
Investment Studies . . . .
Fishing Research Programme of the Swordfish 15 0.0
Ministry of Education 114 834 65.4
Public support for university R&D2 68 114 38.8
1982 FONDECYT 22 151 12.6
1991 FONDEF1 10 269 5.8
1988 National Postgraduate Grants Programme 3 042 1.7
1967 CONICYT 3 265 1.9
1978 Astronomic Institute Isaac Newton 54 0.0
2001 Regional Programmes for Scientific Research 528 0.3
1999 Improvement for quality and equity in higher education3 7 405 4.2
Gemini-Aura Agreement 7 0.0
Ministry of Planning 7 986 4.5
1999 Millenium Scientific Initiative 3 919 2.2
1999 National Postgraduate Grants Programme 390 0.2
1981 International Postgraduate Grants Programme 3 677 2.1
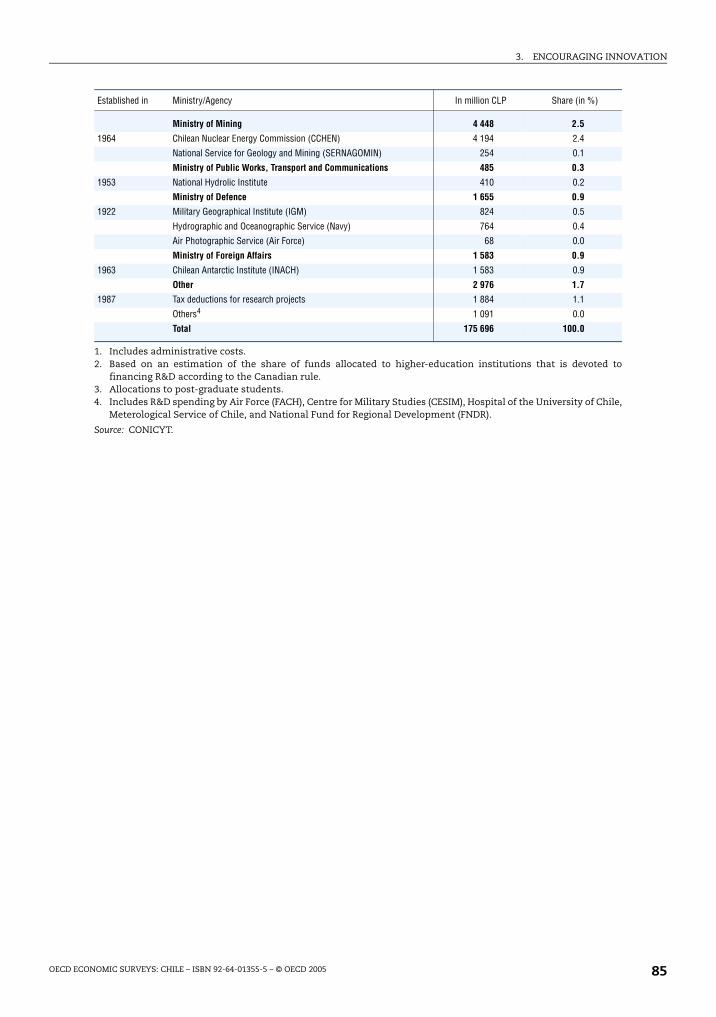
3. ENCOURAGING INNOVATION
OECD ECONOMIC SURVEYS: CHILE – ISBN 92-64-01355-5 – © OECD 2005 85
1. Includes administrative costs.2. Based on an estimation of the share of funds allocated to higher-education institutions that is devoted to
financing R&D according to the Canadian rule.3. Allocations to post-graduate students.4. Includes R&D spending by Air Force (FACH), Centre for Military Studies (CESIM), Hospital of the University of Chile,
Meterological Service of Chile, and National Fund for Regional Development (FNDR).
Source: CONICYT.
Ministry of Mining 4 448 2.5
1964 Chilean Nuclear Energy Commission (CCHEN) 4 194 2.4
National Service for Geology and Mining (SERNAGOMIN) 254 0.1
Ministry of Public Works, Transport and Communications 485 0.3
1953 National Hydrolic Institute 410 0.2
Ministry of Defence 1 655 0.9
1922 Military Geographical Institute (IGM) 824 0.5
Hydrographic and Oceanographic Service (Navy) 764 0.4
Air Photographic Service (Air Force) 68 0.0
Ministry of Foreign Affairs 1 583 0.9
1963 Chilean Antarctic Institute (INACH) 1 583 0.9
Other 2 976 1.7
1987 Tax deductions for research projects 1 884 1.1
Others4 1 091 0.0
Total 175 696 100.0
Established in Ministry/Agency In million CLP Share (in %)
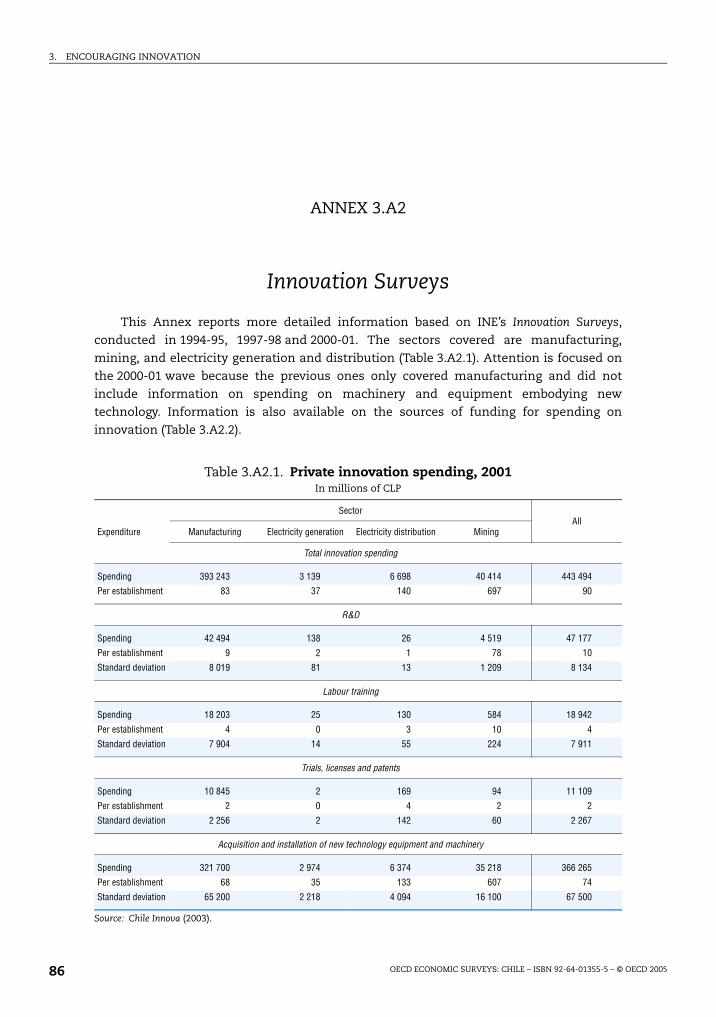
3. ENCOURAGING INNOVATION
OECD ECONOMIC SURVEYS: CHILE – ISBN 92-64-01355-5 – © OECD 200586
ANNEX 3.A2
Innovation Surveys
This Annex reports more detailed information based on INE’s Innovation Surveys,
conducted in 1994-95, 1997-98 and 2000-01. The sectors covered are manufacturing,
mining, and electricity generation and distribution (Table 3.A2.1). Attention is focused on
the 2000-01 wave because the previous ones only covered manufacturing and did not
include information on spending on machinery and equipment embodying new
technology. Information is also available on the sources of funding for spending on
innovation (Table 3.A2.2).
Table 3.A2.1. Private innovation spending, 2001In millions of CLP
Source: Chile Innova (2003).
Expenditure
SectorAll
Manufacturing Electricity generation Electricity distribution Mining
Total innovation spending
Spending 393 243 3 139 6 698 40 414 443 494
Per establishment 83 37 140 697 90
R&D
Spending 42 494 138 26 4 519 47 177
Per establishment 9 2 1 78 10
Standard deviation 8 019 81 13 1 209 8 134
Labour training
Spending 18 203 25 130 584 18 942
Per establishment 4 0 3 10 4
Standard deviation 7 904 14 55 224 7 911
Trials, licenses and patents
Spending 10 845 2 169 94 11 109
Per establishment 2 0 4 2 2
Standard deviation 2 256 2 142 60 2 267
Acquisition and installation of new technology equipment and machinery
Spending 321 700 2 974 6 374 35 218 366 265
Per establishment 68 35 133 607 74
Standard deviation 65 200 2 218 4 094 16 100 67 500
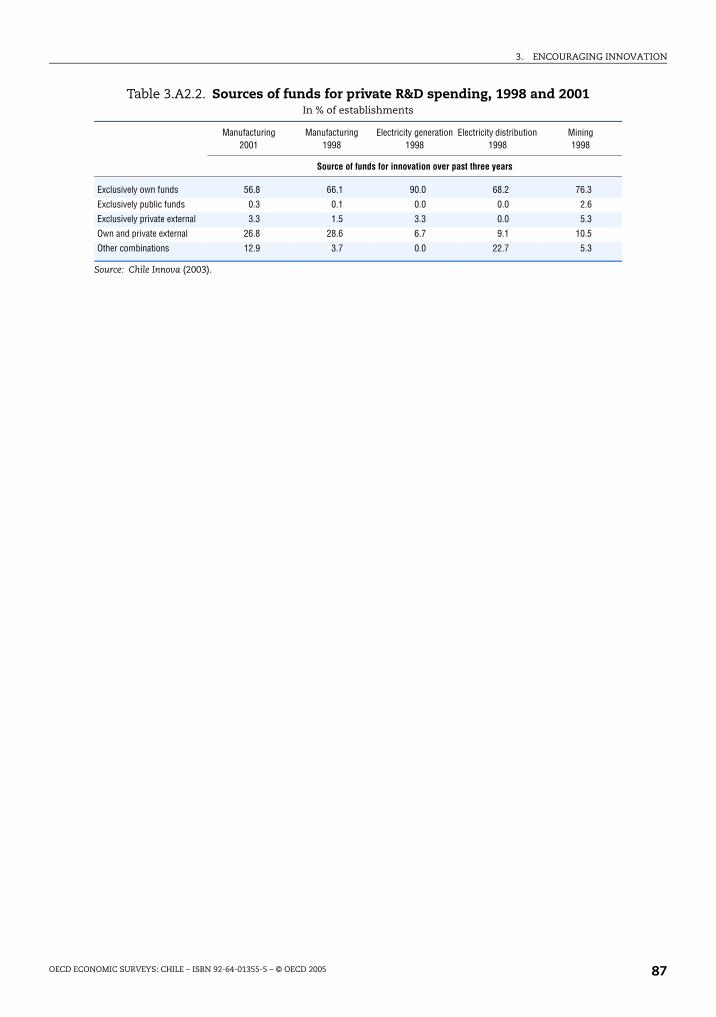
3. ENCOURAGING INNOVATION
OECD ECONOMIC SURVEYS: CHILE – ISBN 92-64-01355-5 – © OECD 2005 87
Table 3.A2.2. Sources of funds for private R&D spending, 1998 and 2001In % of establishments
Source: Chile Innova (2003).
Manufacturing2001
Manufacturing1998
Electricity generation 1998
Electricity distribution 1998
Mining1998
Source of funds for innovation over past three years
Exclusively own funds 56.8 66.1 90.0 68.2 76.3
Exclusively public funds 0.3 0.1 0.0 0.0 2.6
Exclusively private external 3.3 1.5 3.3 0.0 5.3
Own and private external 26.8 28.6 6.7 9.1 10.5
Other combinations 12.9 3.7 0.0 22.7 5.3
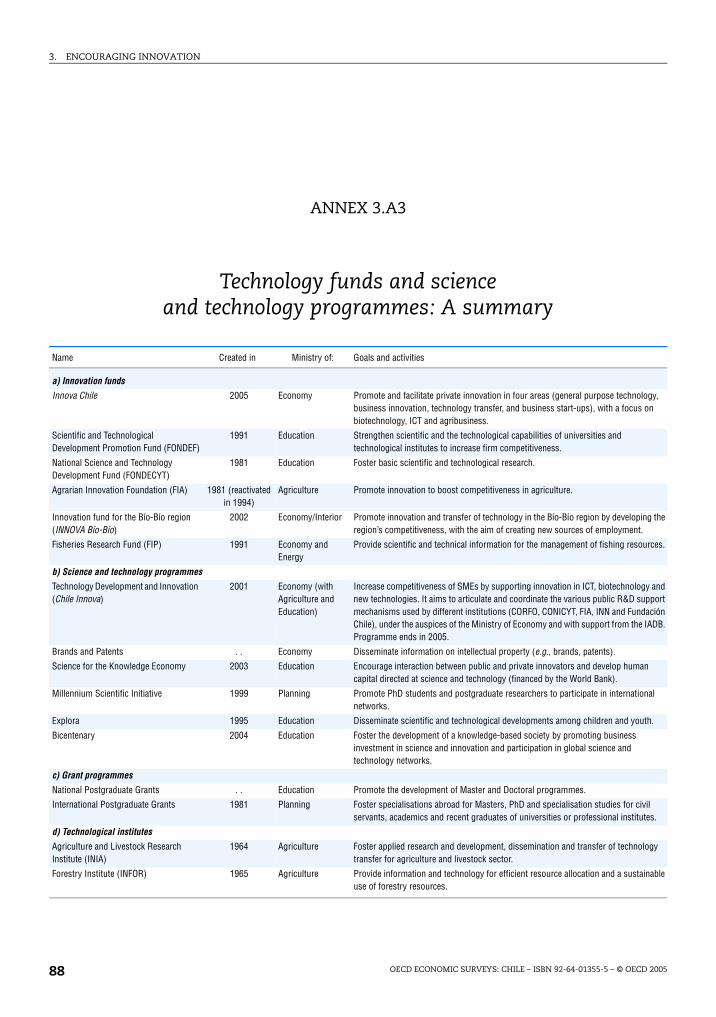
3. ENCOURAGING INNOVATION
OECD ECONOMIC SURVEYS: CHILE – ISBN 92-64-01355-5 – © OECD 200588
ANNEX 3.A3
Technology funds and science and technology programmes: A summary
Name Created in Ministry of: Goals and activities
a) Innovation funds
Innova Chile 2005 Economy Promote and facilitate private innovation in four areas (general purpose technology, business innovation, technology transfer, and business start-ups), with a focus on biotechnology, ICT and agribusiness.
Scientific and Technological Development Promotion Fund (FONDEF)
1991 Education Strengthen scientific and the technological capabilities of universities and technological institutes to increase firm competitiveness.
National Science and Technology Development Fund (FONDECYT)
1981 Education Foster basic scientific and technological research.
Agrarian Innovation Foundation (FIA) 1981 (reactivated in 1994)
Agriculture Promote innovation to boost competitiveness in agriculture.
Innovation fund for the Bío-Bío region (INNOVA Bío-Bío)
2002 Economy/Interior Promote innovation and transfer of technology in the Bío-Bío region by developing the region’s competitiveness, with the aim of creating new sources of employment.
Fisheries Research Fund (FIP) 1991 Economy and Energy
Provide scientific and technical information for the management of fishing resources.
b) Science and technology programmes
Technology Development and Innovation (Chile Innova)
2001 Economy (with Agriculture and Education)
Increase competitiveness of SMEs by supporting innovation in ICT, biotechnology and new technologies. It aims to articulate and coordinate the various public R&D support mechanisms used by different institutions (CORFO, CONICYT, FIA, INN and Fundación Chile), under the auspices of the Ministry of Economy and with support from the IADB. Programme ends in 2005.
Brands and Patents . . Economy Disseminate information on intellectual property (e.g., brands, patents).
Science for the Knowledge Economy 2003 Education Encourage interaction between public and private innovators and develop human capital directed at science and technology (financed by the World Bank).
Millennium Scientific Initiative 1999 Planning Promote PhD students and postgraduate researchers to participate in international networks.
Explora 1995 Education Disseminate scientific and technological developments among children and youth.
Bicentenary 2004 Education Foster the development of a knowledge-based society by promoting business investment in science and innovation and participation in global science and technology networks.
c) Grant programmes
National Postgraduate Grants . . Education Promote the development of Master and Doctoral programmes.
International Postgraduate Grants 1981 Planning Foster specialisations abroad for Masters, PhD and specialisation studies for civil servants, academics and recent graduates of universities or professional institutes.
d) Technological institutes
Agriculture and Livestock Research Institute (INIA)
1964 Agriculture Foster applied research and development, dissemination and transfer of technology transfer for agriculture and livestock sector.
Forestry Institute (INFOR) 1965 Agriculture Provide information and technology for efficient resource allocation and a sustainable use of forestry resources.
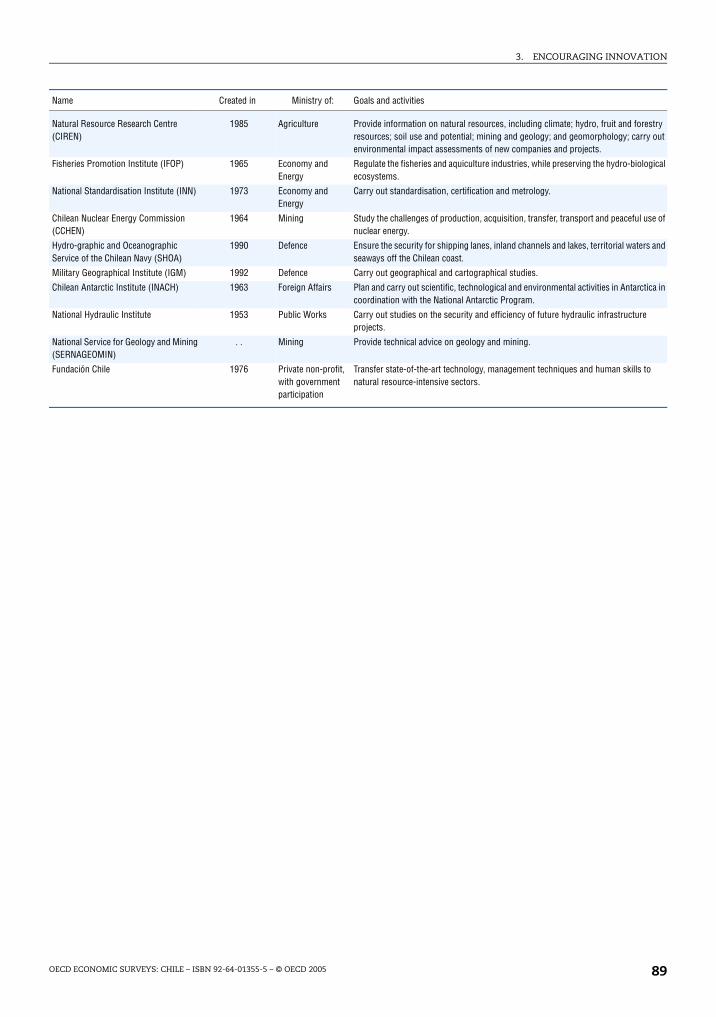
3. ENCOURAGING INNOVATION
OECD ECONOMIC SURVEYS: CHILE – ISBN 92-64-01355-5 – © OECD 2005 89
Natural Resource Research Centre (CIREN)
1985 Agriculture Provide information on natural resources, including climate; hydro, fruit and forestry resources; soil use and potential; mining and geology; and geomorphology; carry out environmental impact assessments of new companies and projects.
Fisheries Promotion Institute (IFOP) 1965 Economy and Energy
Regulate the fisheries and aquiculture industries, while preserving the hydro-biological ecosystems.
National Standardisation Institute (INN) 1973 Economy and Energy
Carry out standardisation, certification and metrology.
Chilean Nuclear Energy Commission (CCHEN)
1964 Mining Study the challenges of production, acquisition, transfer, transport and peaceful use of nuclear energy.
Hydro-graphic and Oceanographic Service of the Chilean Navy (SHOA)
1990 Defence Ensure the security for shipping lanes, inland channels and lakes, territorial waters and seaways off the Chilean coast.
Military Geographical Institute (IGM) 1992 Defence Carry out geographical and cartographical studies.
Chilean Antarctic Institute (INACH) 1963 Foreign Affairs Plan and carry out scientific, technological and environmental activities in Antarctica in coordination with the National Antarctic Program.
National Hydraulic Institute 1953 Public Works Carry out studies on the security and efficiency of future hydraulic infrastructure projects.
National Service for Geology and Mining (SERNAGEOMIN)
. . Mining Provide technical advice on geology and mining.
Fundación Chile 1976 Private non-profit, with government participation
Transfer state-of-the-art technology, management techniques and human skills to natural resource-intensive sectors.
Name Created in Ministry of: Goals and activities


ISBN 92-64-01355-5
OECD Economic Surveys: Chile
© OECD 2005
OECD ECONOMIC SURVEYS: CHILE – ISBN 92-64-01355-5 – © OECD 2005 91
Chapter 4
Strengthening regulation in network industries
Chile’s regulatory framework is working reasonably well. The country’s structuralreforms since the 1980s, with the privatisation of utilities and deregulation ofproduct and labour markets, have improved resource allocation and increased thepopulation’s access to basic services, while calling for a comprehensive upgrading ofregulatory institutions. At the same time, public-private partnerships (PPPs) arecontributing to closing Chile’s infrastructure deficit, particularly in transport. Therecurrent cuts in shipments of natural gas from Argentina since 2004 have putadditional strain on regulation in the electricity sector to encourage investment ingeneration and ensure the security of supply. This chapter reviews regulatoryreform in three network industries (electricity, gas and telecoms), where furtherliberalisation, particularly in electricity retailing, and improvements in theregulation of telecoms would do much to further improve the business climate. Thegovernance of public-private partnerships can be improved by increasingtransparency and accountability in the concession process. In doing so, thegovernment’s exposure to contingent liabilities can be contained.
4. STRENGTHENING REGULATION IN NETWORK INDUSTRIES
OECD ECONOMIC SURVEYS: CHILE – ISBN 92-64-01355-5 – © OECD 200592
The regulatory framework: Cross-sectoral considerations
Overview and main issues
Regulatory reform in network industries has been guided by three principles. First, the
price paid for a service should reflect the social opportunity costs of providing it: when
competition is feasible in a given industry, the market should be liberalised; otherwise,
prices need to be regulated by emulating competition according with the so-called
efficient-firm standard (Box 4.1). Second, utility providers should be privatised and face
hard budget constraints, and tariffs should be set at a level where providers cover their
costs. Finally, access by the needy to services should be facilitated through means-tested
income transfers, rather than price subsidisation, which is more distorting.
Chile’s experience with efficient-firm regulation has been broadly successful, but the
tariff-setting process can be improved.1 Efficient-firm regulation can be used as an
information-extraction device and therefore in principle solve the information asymmetries
about regulated firms’ capital outlays, operating costs, the cost of capital and demand
parameters, which naturally exist between the regulated firm and the regulator (Box 4.2).2
But it has been argued that the requirement to revise the methodology for setting prices
(i.e., the design of the efficient firm) in each tariff review, while in principle ignoring the
actual firm, overburdens the regulator. The regulated firm and the regulator therefore have
the incentive to design the efficient firm with a tariff target in mind.3 The fact that technical
reports published by the regulator during tariff reviews, including regulatory decisions, are
not standardised makes it difficult for analysts and market participants to compare tariff
reviews and learn from past experience.4 Weak corporate accounting standards also
complicate the task of comparing costs across firms during tariff reviews.
Chile’s current regulatory institutional set-up suffers from the following main
shortcomings:5
Institutional fragmentation. Regulators are political appointees.6 The regulatory agencies
lack a professional career stream within the civil service, which leads to high staff
turnover, and institutional memory is often lost between tariff reviews.7 Moreover, each
sector has its own regulatory structure. As a result, the regulatory agency that has the
authority to make a decision is often not in full possession of all necessary information
needed in the decision-making process. Finally, responsibilities often differ among the
sectoral regulators, and interaction and exchange of experiences among regulators is
said to be limited.
Legislative oversight. Because of Chile’s legal tradition, many sectoral regulations need to
be set in law, which is time-consuming and involves political risk in otherwise
essentially technical matters. It should nevertheless be recognised that the legislative
process has sometimes improved the quality of regulation.8
Conflict resolution. Until recently, formal conflict resolution mechanisms existed only in
the cases of telecoms and water,9 and only for disputes arising during tariff reviews.
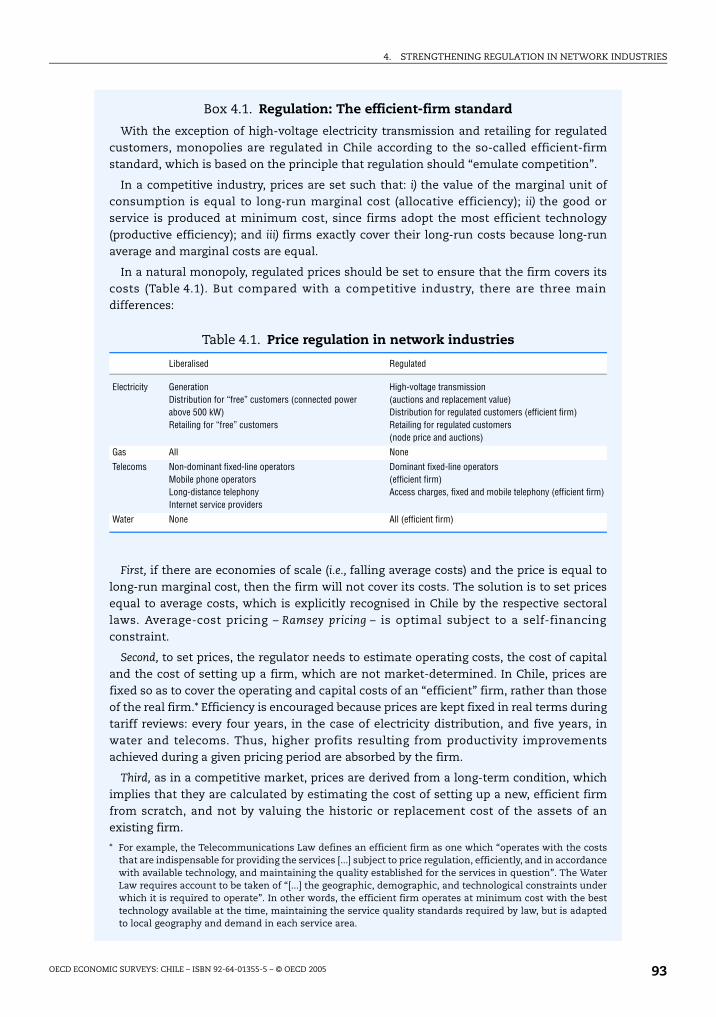
4. STRENGTHENING REGULATION IN NETWORK INDUSTRIES
OECD ECONOMIC SURVEYS: CHILE – ISBN 92-64-01355-5 – © OECD 2005 93
Box 4.1. Regulation: The efficient-firm standard
With the exception of high-voltage electricity transmission and retailing for regulatedcustomers, monopolies are regulated in Chile according to the so-called efficient-firmstandard, which is based on the principle that regulation should “emulate competition”.
In a competitive industry, prices are set such that: i) the value of the marginal unit ofconsumption is equal to long-run marginal cost (allocative efficiency); ii) the good orservice is produced at minimum cost, since firms adopt the most efficient technology(productive efficiency); and iii) firms exactly cover their long-run costs because long-runaverage and marginal costs are equal.
In a natural monopoly, regulated prices should be set to ensure that the firm covers itscosts (Table 4.1). But compared with a competitive industry, there are three maindifferences:
First, if there are economies of scale (i.e., falling average costs) and the price is equal tolong-run marginal cost, then the firm will not cover its costs. The solution is to set pricesequal to average costs, which is explicitly recognised in Chile by the respective sectorallaws. Average-cost pricing – Ramsey pricing – is optimal subject to a self-financingconstraint.
Second, to set prices, the regulator needs to estimate operating costs, the cost of capitaland the cost of setting up a firm, which are not market-determined. In Chile, prices arefixed so as to cover the operating and capital costs of an “efficient” firm, rather than thoseof the real firm.* Efficiency is encouraged because prices are kept fixed in real terms duringtariff reviews: every four years, in the case of electricity distribution, and five years, inwater and telecoms. Thus, higher profits resulting from productivity improvementsachieved during a given pricing period are absorbed by the firm.
Third, as in a competitive market, prices are derived from a long-term condition, whichimplies that they are calculated by estimating the cost of setting up a new, efficient firmfrom scratch, and not by valuing the historic or replacement cost of the assets of anexisting firm.
* For example, the Telecommunications Law defines an efficient firm as one which “operates with the coststhat are indispensable for providing the services [...] subject to price regulation, efficiently, and in accordancewith available technology, and maintaining the quality established for the services in question”. The WaterLaw requires account to be taken of “[...] the geographic, demographic, and technological constraints underwhich it is required to operate”. In other words, the efficient firm operates at minimum cost with the besttechnology available at the time, maintaining the service quality standards required by law, but is adaptedto local geography and demand in each service area.
Table 4.1. Price regulation in network industries
Liberalised Regulated
Electricity GenerationDistribution for “free” customers (connected power above 500 kW)Retailing for “free” customers
High-voltage transmission(auctions and replacement value)Distribution for regulated customers (efficient firm)Retailing for regulated customers(node price and auctions)
Gas All None
Telecoms Non-dominant fixed-line operatorsMobile phone operatorsLong-distance telephonyInternet service providers
Dominant fixed-line operators(efficient firm)Access charges, fixed and mobile telephony (efficient firm)
Water None All (efficient firm)
4. STRENGTHENING REGULATION IN NETWORK INDUSTRIES
OECD ECONOMIC SURVEYS: CHILE – ISBN 92-64-01355-5 – © OECD 200594
Box 4.2. Price regulation in Chile: The efficient-firm standard in practice
The efficient firm is designed during tariff reviews, in principle independently of the realfirm. But in practice some account is taken of the real firm’s assets to set tariffs. A numberof considerations are noteworthy.
Capital gains and losses
The issue of how to treat capital gains and losses arising from asset obsolescence orappreciation is yet to be resolved. Asset obsolescence may be considerable in telecoms dueto technological progress, but also in electricity distribution and water. The value of assetsis expected to increase mainly because the costs of building distribution networks tend torise as the country develops, reflecting higher land prices and the need to comply withtighter urban planning and environmental standards.
Conceptually, the efficient-firm standard implies that both capital losses and gainsshould be borne by the firm: the likelihood of obsolescence must be incorporated intocurrent tariffs, presumably through a higher discount rate. In practice, however, it isdifficult to assign probabilities to obsolescence and, as the case of telecoms suggests,estimates of the cost of capital vary significantly. A related issue is that in many cases costshave increased because the municipalities tend to set urban planning and environmentstandards, which need to be complied with by the utility providers.
Regulated and unregulated services
The issue of whether profits made by the firm when selling non-regulated services shouldbe considered as part of the regulated firm’s income when setting tariffs is difficult to resolve.For example, water companies pass on to regulated users the full costs of cleaning wastewater, but then resell part of it to agricultural producers, an unregulated activity. Although inprinciple economies of scope should be reflected in lower tariffs, in practice it may be desirablethat the firm keep some of the rents as an incentive to exploit these economies.
Efficient-firm and price-cap regulation
In comparison with the experience of the United Kingdom and other OECD countries, theChilean efficient-firm standard differs in the determination of operating costs and theregulatory asset base (i.e., those assets that can be included to calculate tariffs). In particular,in the United Kingdom, the regulator and the regulated firm discuss and negotiate duringtariff reviews which assets of the real firm will be allowed to earn a return, as well as theoperating costs of the real firm. Assets are then priced at their current value and the pricecap is calculated to set tariffs. By contrast, in Chile the design and operating costs of theefficient firm are estimated and the self-financing condition is used to calculate the tariff. Inpractice, however, it has been impossible to ignore the real firm when designing the efficientone. So, in fact, the asset base tends to be a combination of hypothetical and actual assets.1
An alternative option for regulation would be to adopt a standard price cap that is closerto the actual firm, without abandoning long-run average cost pricing: instead of obtainingthe asset base by designing the efficient firm from scratch, the cost of past investmentscould be added to, and assets could be kept in, the regulatory asset base. Provisions againstgold-plating assets would have to be introduced and investments made by the firm wouldhave to be approved by the regulator. Regulation would therefore become an ongoingprocess, because the regulator would still have to monitor investments in-between tariffreviews. Tariff reviews, by contrast, would be needed only to assess variable costs, whichcould still be determined on the basis of efficiency-firm criteria.2
1. See, for example, Rudnick and Raineri (1997), for more information on electricity distribution, and Gönençet al. (2001), for more information on price-cap regulation in the OECD area.
2. Substituting the real firm for the efficient firm implies that asset obsolescence or appreciations would nolonger pose a problem, because assets are always valued at their acquisition cost. Consequently, thediscount rate could be lowered to something close to the risk-free rate.

4. STRENGTHENING REGULATION IN NETWORK INDUSTRIES
OECD ECONOMIC SURVEYS: CHILE – ISBN 92-64-01355-5 – © OECD 2005 95
Disputes arising outside tariff reviews have been arbitrated by the respective regulators.
Resolutions can be appealed through the court system, but procedures are slow and the
outcomes are hard to predict because of a lack of technical expertise.
Options for reform
A comprehensive assessment of Chile’s regulatory framework was carried out in the
late 1990s by the Jadresic Commission, which identified areas for reform. Among its
proposals was the creation of three superintendencies, one for each utility sector
(electricity, gas and telecoms), which would report to the Minister of Economy, and an
undersecretary in charge of research at the Ministry of Economy. Also, it was
recommended that the regulatory agencies should issue manuals of procedures and the
criteria for decision-making in their respective areas. None of these proposals have so far
been adopted. The government’s on-going effort to build a professional civil service is a
step in the right direction and should be extended to the regulatory agencies.
It would be advisable to start tariff reviews once methodological issues have been
resolved. Taking methodological issues out of the tariff review process would force
regulators to adopt regular procedures for upgrading methodologies, collecting the
necessary information to estimate costs, as well as other key parameters needed for the
design of the efficient firm, and setting standards in their areas of activity, making
regulation a continuous process between tariff reviews.
Conflict resolution should be strengthened. In the case of electricity, the creation of
the panel of seven experts in July 2004 is a step in the right direction. These experts are
independent, appointed by the Competition Tribunal for a six-year fixed mandate with
overlapping terms, so that in any given year most members of the panel are not new, and
remunerated adequately.10 When a dispute arises, panel decisions are final and cannot be
appealed.11 The panel began to consider cases only in late 2004, but its resolutions are
already being used as precedent in dispute resolution. If deemed successful, this
institutional innovation could be replicated in the water and telecom sector.
The regulation of network industries: Electricity, gas and telecoms
Electricity
Overview
Electricity was the first network industry to be restructured in Chile. Generation,
transmission and distribution were unbundled in the early 1980s and marginal-cost
dispatching was introduced for generation. The industry was privatised in the late 1980s.
Performance has been satisfactory: generation capacity has expanded continuously since
privatisation in line with demand growth (Figure 4.1). The price of energy fell over
the 1990s, especially with the arrival of Argentine natural gas in 1998, but rose again in the
aftermath of the supply cuts in April 2004.12 Supply cuts were concentrated in May-
June 2004, affecting the North most adversely, and January-April 2005, affecting
predominantly the Centre-South (Figure 4.2). Investment in generation has since stalled
and, as of May 2005, the probability of an energy shortage during the next three years was
estimated to be on the rise. It is expected that changes to the legislation, approved by
Congress in May 2005 (Ley Corta II), will remove the obstacles to investment in generation
associated with the insecurity of supply and, therefore, reduce the likelihood of shortages.
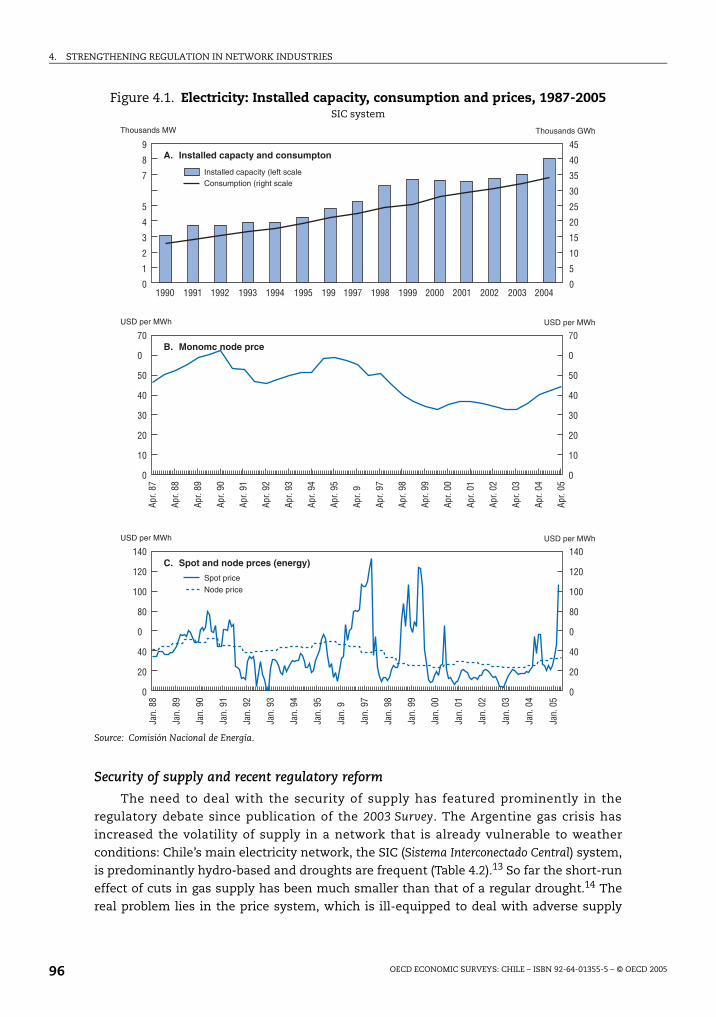
4. STRENGTHENING REGULATION IN NETWORK INDUSTRIES
OECD ECONOMIC SURVEYS: CHILE – ISBN 92-64-01355-5 – © OECD 200596
Security of supply and recent regulatory reform
The need to deal with the security of supply has featured prominently in the
regulatory debate since publication of the 2003 Survey. The Argentine gas crisis has
increased the volatility of supply in a network that is already vulnerable to weather
conditions: Chile’s main electricity network, the SIC (Sistema Interconectado Central) system,
is predominantly hydro-based and droughts are frequent (Table 4.2).13 So far the short-run
effect of cuts in gas supply has been much smaller than that of a regular drought.14 The
real problem lies in the price system, which is ill-equipped to deal with adverse supply
Figure 4.1. Electricity: Installed capacity, consumption and prices, 1987-2005SIC system
Source: Comisión Nacional de Energía.
+7
$''"*"$)#
+""$4*6
5#"
+9&9G+9&9'G
)9&-=9959
8*'G8*'G
#,7
#,7
#,7
#,7
#,7
#,7
#,7
#,7
#,7
#,7
#,7
#,7
#,7
#,7
#,7
#,7
#,7
#,7
#,7
8*'G 8*'G
+7
+7
+7
+7
+7
+7
+7
+7
+7
+7
+7
+7
+7
+7
+7
+7
+7
*7&

4. STRENGTHENING REGULATION IN NETWORK INDUSTRIES
OECD ECONOMIC SURVEYS: CHILE – ISBN 92-64-01355-5 – © OECD 2005 97
shocks.15 Approval of Ley Corta II is an important step towards greater flexibility (Box 4.3).
In particular:
Incentives for regulated customers to adjust consumption in response to changes in
supply have been strengthened. Generators are now allowed to offer regulated
Figure 4.2. Natural gas: Consumption and supply cuts, 1990-2005
Source: Comisión Nacional de Energía.
01
0. 01 0A 01 0A 01
0A
!0A
30
A03
10 10!
100!
5?
+
?
+"?
#7?
,7?
8'7?
4
7?
$'7?
+7?
57?
#,7?
-7?
$)#4(''$%#!6
$)$"957&9&99='9
Table 4.2. Electricity: Composition of installed capacity by source, 2005SIC system
Source: Comisión Nacional de Energía.
Type of plant Installed capacity (in GW) Share of total (in %)
Total 8.0 100.0
Hydro-power 4.7 58.9
Run-of-river 1.3 16.3
Reservoir 3.4 42.5
Thermal power 3.3 41.1
Coal 0.9 11.8
Diesel 0.3 3.7
Open cycle, gas 0.2 3.0
Combined cycle, gas 1.5 18.9
Other 0.3 3.7

4. STRENGTHENING REGULATION IN NETWORK INDUSTRIES
OECD ECONOMIC SURVEYS: CHILE – ISBN 92-64-01355-5 – © OECD 200598
customers served by distributors incentives to reduce consumption, thus efficiently
rationing the available quantity of energy in a situation of shortage. This complements
the existing compensation mechanism, introduced in the late 1980s, requiring
generators to pay the equivalent of the outage cost (i.e., the value of an additional kWh
when energy is rationed) for each kWh saved in response to a supply shock. This
mechanism gives regulated customers the right price signal at the margin, because the
opportunity cost of consuming an additional kWh is equal to the compensation foregone
(i.e., the value of an additional kWh consumed). In practice, however, the mechanism
was deficient for two main reasons. First, it was difficult to understand, being interpreted
as a “punishment” that generators had to pay for not meeting demand, ignoring its role
as a price signal.16 Second, as currently calculated, the outage cost overestimates the
value of a kWh in the presence of a supply shock because it assumes that all users will
reduce consumption by the same proportion.17
Regulated prices can now insulate investment from long-term supply volatility. The
long-run equilibrium price (under uninterrupted supply from Argentina) is currently
estimated in the neighbourhood of USD 30-35/MWh, hence below the level alternatives
fuels (e.g., coal or liquid natural gas, LNG) are estimated to be profitable in the long term
(USD 45-50/MWh). Uncertainty about the supply of Argentine gas discouraged
investment in generation using alternative fuels because, instead of being set in long-
Box 4.3. The new electricity law (Ley Corta II)
In May 2005, Congress approved important changes to the regulatory framework for theelectricity sector to remove the obstacles to investment associated with the Argentine gassupply cuts, which had started in April 2004 and had considerably increased theprobability of an energy shortage in the coming years. The main changes to the legislationare:
First, the new law substitutes competitive bidding for the regulated node price (energy),which is paid by regulated customers. New contracts between generators anddistributors will be signed for up to 15 years. The price set in auction will be keptunchanged in real terms over the entire duration of the contract (adjusted periodicallyfor changes in fuel and other costs). Node prices will still be calculated and used to set aceiling for the auction prices.
Second, the law modifies the rule to calculate the upper and lower bounds of the bandaround the average monomic free price, within which the regulated node price must fall.If the node price differs from the average free price by less than 30%, the bound is keptat the current 5% range. For a price discrepancy of 30%, the band is broadened to plus/minus 10%, and for a price discrepancy of 80% and above, the band is broadened to plus/minus 30%. For a price discrepancy greater than 30% but lower than 80%, there is agradual linear increase in the band. This will allow prices to increase much faster inresponse to an adverse supply shock.
Third, generators are now allowed to offer incentives to regulated customers foradjusting consumption. This is yet to be regulated but, in the event of an energyshortage, it would be desirable to allow a generator who secures a reduction inconsumption by regulated customers to credit this reduction against its contracts withthe distributor, without the need to compensate users, except for the incentives offeredto reduce consumption.

4. STRENGTHENING REGULATION IN NETWORK INDUSTRIES
OECD ECONOMIC SURVEYS: CHILE – ISBN 92-64-01355-5 – © OECD 2005 99
term contracts, about 60% of generators’ sales were carried out at the monomic (energy
and power) node price (i.e., the regulated price equal to the estimated marginal cost over
the following 48 months), which is calculated every six months in April and October, so
that it changes often, reflecting volatility in medium-run supply.18 Recent changes to the
law substituted prices determined in competitive auctions, which will be maintained for
up to 15 years, for the monomic node price. This is expected to shield generators from
further volatility in the supply of Argentine gas, encouraging them to invest in
expanding capacity. In addition, the setting of prices in an auction results in a partial
liberalisation of prices paid by regulated customers, although the tariff structure and
contract conditions remain regulated.
Further liberalisation has been desirable to better deal with the problems created by
vertical integration in electricity distribution and retailing, which prevents competition in
retailing. In particular, regulation of access tariffs has so far discouraged generators from
serving “free” customers. The distribution tariffs paid by regulated customers are fixed
every four years by the regulator. But, until recently, the law was silent on the distribution
tariffs for free customers, discouraging generators from serving free customers located
within the service area of a distribution company.19 Nevertheless, the Ley Corta I, approved
in March 2004, requires distributors to report the tolls for each free customer (more than
500 kW of connected power) based on a formula set by the regulator. Thus, a generator who
wishes to serve a free customer served by a distributor will now know the toll before
making an offer, and the distributor will not therefore be able to hike the distribution toll
to make the generator’s offer uncompetitive.
The retail tariff structure is rigid. There are many different regulated tariffs which vary
with the type of connection (e.g., high or low tension) or the hours when power
consumption is measured. Tariffs are made up of four charges: a fixed charge, a
distribution charge, an energy charge and a peak power charge. But the overwhelming
majority of residential customers pay a simple tariff – the so-called BT-1 tariff – which
combines these charges in one per-kWh rate.20 About 40% of the amount paid per kWh
remunerates distribution facilities, another 15-20% pays for peak power demand, and the
remainder pays for energy. The main advantage of the BT-1 tariff is its simplicity, but it is
inefficient for three reasons. First, residential customers use too little energy because the
tariff is high at the margin.21 Second, because the BT-1 tariff does not differentiate between
energy and peak power charges, residential customers do not receive any incentives to cut
power consumption at peak hours.22 Finally, no regulated tariff, including BT-1, reflects
short-run supply conditions.23
Important improvements have been made to the functioning of CDEC, the Load
Dispatch Centre.24 First, the expert committee has been granted the prerogative of
resolving disputes among CDEC members, and its decisions cannot be contested. This
should facilitate decision-making. Second, the new electricity law sets a four-year term for
the Director, thus increasing his/her autonomy, although the Board can remove him/her
with two-thirds of the votes. Finally, the inclusion of a representative of free customers and
firms that own sub-transmission companies should broaden representation and therefore
reduce incumbents’ incentives to prevent entry.
Options for reform
The option of unbundling retailing from distribution could be considered to encourage
a more efficient use of electricity. In this case, distribution cables would be priced and let
4. STRENGTHENING REGULATION IN NETWORK INDUSTRIES
OECD ECONOMIC SURVEYS: CHILE – ISBN 92-64-01355-5 – © OECD 2005100
separately from energy and power sales. Distribution tariffs would still be regulated,
essentially as in the current system, but electricity would be sold by retailers, who would
buy it from generators and set contract prices freely. Pricing distribution separately from
consumption would allow retailers to design efficient price schedules adapted to consumer
preferences. In doing so, the regulation of distribution would also become less burdensome
and the risk of rationing/outages would be minimised when energy is in short supply
because retailers would have the incentive to find those consumers who are willing to
reduce consumption at the lowest cost. The experience of OECD countries is diverse in this
area. Whereas in countries such as Canada and the United States there is considerable
vertical integration in the industry, other countries (e.g., Netherlands and United Kingdom)
have gone a long way in unbundling retailing from distribution.
The liberalisation of retailing would need to be complemented by prudential
regulations. This is because all users are connected to the same grid and, in a supply
shortage, an outage will occur if nobody reduces consumption. Retailers must have
incentives to enforce their contracts and must either contract enough energy and power to
meet them or write contracts that encourage users to reduce consumption when there is a
shortage. Otherwise, an opportunistic retailer could sell “cheap” electricity and default
when a deficit occurs.
There are reasons for not liberalising the spot market. Currently, dispatch is
centralised in strict variable-cost merit order (Box 4.4), and generators should not be free to
choose plant operation and the price at which they bid. The main reason against
liberalisation is that the largest generator, ENDESA, would have ample room to exercise
market power. It would withhold reservoir water in periods when the system operates
close to capacity and release it when demand is low.25 In turn, the second-largest
generator, GENER, would have incentives to withhold capacity when there is little water
available.
The functioning of CDEC can be improved further. This can be achieved by introducing
explicit operating rules and procedures to constrain discretion. In addition, while the
introduction of new members has the merit of broadening representation, they may also
block decisions because each member of CDEC has veto power. Thus, CDEC’s voting rules
could be reviewed. It is also probably desirable to grant CDEC’s greater operational
autonomy.
Gas
Overview and main issues
Chile’s natural gas market is heavily reliant on imports from Argentina, as discussed
above. There are four disjoint natural gas markets (North, Centre, South and the Magellan
region). Only the Magellan market is supplied in part by the only domestic producer, the
state-owned Empresa Nacional del Petróleo (ENAP).26 The first pipeline connecting Argentina
and Chile came on stream in 1996 to serve a single firm, the Methanex plant in the Magellan
region. The Gasandes pipeline, which connects the Neuquén basin in Argentina with
central Chile, came on stream in 1997. These were followed in 1999 by two pipelines
serving the north of Chile (Gas Atacama and Norandino) and by the Gasoducto del Pacífico
pipeline serving the Concepción area in the south of Chile, which entered in operation
in 2000. Natural gas is used predominantly for electricity generation and industrial
4. STRENGTHENING REGULATION IN NETWORK INDUSTRIES
OECD ECONOMIC SURVEYS: CHILE – ISBN 92-64-01355-5 – © OECD 2005 101
Box 4.4. The electricity generation industry: An overview
The generation market is structured around three prices – spot, node (or regulated) andfree – each corresponding to a separate market.
The spot market
The sequence in which generators operate is set by CDEC (Centro de Despacho Económico deCarga), the Load Dispatch Centre. Given current demand, dispatch is made according to strictmerit order after accounting for transmission constraints. The generators do not make bids;dispatch is made according to their marginal operating costs, which are fixed according totechnical parameters and fuel costs. The spot price always equals the opportunity cost andchanges hourly. Dispatch is mandatory whenever the plant is available and CDEC commandsit to start operating. This implies that dispatch is independent of a generator’s contracts.Generators that sell more energy than they produce are required to buy the difference in thespot market at the spot price. Each month CDEC settles accounts between generators.
Under normal conditions, the spot price equals the operating cost of the most expensivethermal plant dispatched. By contrast, in all the hydrological scenarios in which the model(below) predicts a shortage, energy transfers among generators are valued at the “outagecost”, which is the average cost to users of a proportional reduction in consumption,estimated from user surveys (which are nevertheless conducted infrequently).1 Outage costsassume that restrictions are planned and announced well ahead of time so that largeconsumers can adjust production or install generating capacity and residential users canadjust consumption. The cost of unexpected energy or power cuts is obviously much higher.
The regulated market
The spot price is subject to extreme variations over the year and even during shorterperiods. When the law was introduced it was thought that such volatility wasunacceptable to residential customers and generators. Hence, the price at whichdistributors sell to residential and other small users was regulated.2 Moreover, it ismandatory for generators to sell at the regulated price to distributors.
The regulated (node) price is calculated every six months by CNE (Comisión Nacional de
Energía) and corresponds to the expected marginal cost averaged over the following 24 to48 months.3 To fix this price CNE runs a stochastic dynamic programming model which,given a ten-year projection of peak power and energy demand, minimises the expectedcost of generation and outage by optimally using water in all reservoirs. This model takesexisting plants as given, but optimises entry of future plants over the ten-year horizon. Itestimates the probability of future hydrologies using a sample of 40 past hydrologies. Theregulated price effectively paid by users must fall within a band centred in averagemonomic “free” prices (see below). If the price estimated by CNE falls below the lowerbound of the band, the regulated price is set equal to the lower bound. Similarly, if it fallsabove the upper bound, the price is set equal to the upper bound. Until 2004 the width ofthe band was 10% of the average monomic free price. The law approved in March 2004 (LeyCorta I) narrowed it to 5% of the average monomic free price. Finally, in May 2005 (Ley
Corta II) the width of the band was widened again (see Box 4.3).
The node price remains fixed for 6 months, independently of demand and supplyconditions. Nevertheless, there is a mechanism to ration excess energy demand. When ashortage occurs, the regulator issues a rationing decree and regulated consumers are paidthe difference between the outage cost and the node price (i.e., around USD 230/MWh for arestriction of 10% or less) for each undeliverable kWh; that is, the energy that would havebeen consumed at the regulated price had it been available.

4. STRENGTHENING REGULATION IN NETWORK INDUSTRIES
OECD ECONOMIC SURVEYS: CHILE – ISBN 92-64-01355-5 – © OECD 2005102
consumption (Table 4.3). More than one-half of total industrial consumption (one-quarter
of total consumption) is accounted for by Methanex.
The cuts in gas shipments from Argentina have raised concern about the security of
supply. Because most natural gas consumption is backed up (Table 4.4), most users (except
residential customers) can switch rapidly to alternative fuels at some additional cost.27 In
electricity generation, which accounts for nearly one-half of consumption of natural gas, it
was argued above that the adequate policy response to input volatility would be to
introduce flexible tariffs and contract conditions. If distortions in the price system can be
corrected, then there is no need for mandatory back-up provisions, except for residential
customers, for which back-up is already in place.
Policy options
The introduction of import ceilings and origin restrictions should be resisted. Because
all imports of natural gas come from Argentina, proposals have been made to cap imports
from any given country at 85% of total imports. The requirement was included in Ley
Box 4.4. The electricity generation industry: An overview (cont.)
The “free” market
The “free” customers, those with installed power of more than 500 kW (formerly, 2 MW),have a much simpler pricing regime. These users negotiate energy contracts directly withthe generators. While a significant fraction of these contracts are set at prices that reflectsupply conditions only in the long run, contracts can be freely renegotiated during a supplyrestriction. If the spot price of energy exceeds the user’s valuation of energy, the generatorand the user are expected to undertake a mutually advantageous renegotiation.Notwithstanding this flexibility, prices have remained fairly stable over time.
1. Surveyed users are asked to estimate the cost of reducing “normal” energy use by 10, 20, and more than20%. Users are told that these restrictions would be announced months in advance, given that energy (asopposed to power) outages can be predicted.
2. Until 2004, customers were considered small if their connected power was below 2 MW (for example, asmall shopping centre). In 2004, the law was amended and the limit was reduced to 500 kW.
3. CNE chooses the exact length of the period. In the SIC system, the expected marginal cost is averaged overthe following 48 months (24 months in the SING system).
Table 4.3. Daily average natural gas consumption, 2004In millions of m3 (per cent share in parentheses)
Source: Asociación de Distribuidores de Gas Natural.
Regions Electricity generation Industry Residential use Total
Total 11.2 10.8 0.7 22.7
(49.3) (47.6) (3.1) (100.0)
North 4.0 0.8 . . 4.8
(17.6) (3.4) (21.0)
Centre 7.2 3.0 0.6 10.9
(31.7) (13.4) (2.9) (48.0)
South . . 1.3 0.1 1.4
(5.8) (0.2) (6.0)
Magellan . . 5.7 . . 5.7
(25.0) (25.0)
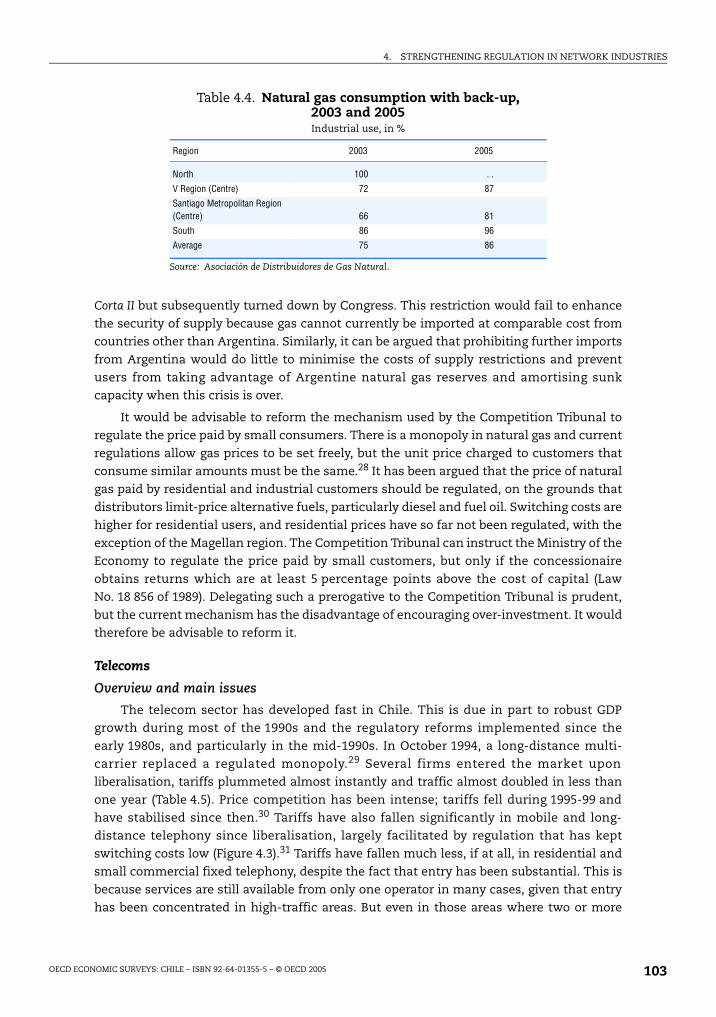
4. STRENGTHENING REGULATION IN NETWORK INDUSTRIES
OECD ECONOMIC SURVEYS: CHILE – ISBN 92-64-01355-5 – © OECD 2005 103
Corta II but subsequently turned down by Congress. This restriction would fail to enhance
the security of supply because gas cannot currently be imported at comparable cost from
countries other than Argentina. Similarly, it can be argued that prohibiting further imports
from Argentina would do little to minimise the costs of supply restrictions and prevent
users from taking advantage of Argentine natural gas reserves and amortising sunk
capacity when this crisis is over.
It would be advisable to reform the mechanism used by the Competition Tribunal to
regulate the price paid by small consumers. There is a monopoly in natural gas and current
regulations allow gas prices to be set freely, but the unit price charged to customers that
consume similar amounts must be the same.28 It has been argued that the price of natural
gas paid by residential and industrial customers should be regulated, on the grounds that
distributors limit-price alternative fuels, particularly diesel and fuel oil. Switching costs are
higher for residential users, and residential prices have so far not been regulated, with the
exception of the Magellan region. The Competition Tribunal can instruct the Ministry of the
Economy to regulate the price paid by small customers, but only if the concessionaire
obtains returns which are at least 5 percentage points above the cost of capital (Law
No. 18 856 of 1989). Delegating such a prerogative to the Competition Tribunal is prudent,
but the current mechanism has the disadvantage of encouraging over-investment. It would
therefore be advisable to reform it.
Telecoms
Overview and main issues
The telecom sector has developed fast in Chile. This is due in part to robust GDP
growth during most of the 1990s and the regulatory reforms implemented since the
early 1980s, and particularly in the mid-1990s. In October 1994, a long-distance multi-
carrier replaced a regulated monopoly.29 Several firms entered the market upon
liberalisation, tariffs plummeted almost instantly and traffic almost doubled in less than
one year (Table 4.5). Price competition has been intense; tariffs fell during 1995-99 and
have stabilised since then.30 Tariffs have also fallen significantly in mobile and long-
distance telephony since liberalisation, largely facilitated by regulation that has kept
switching costs low (Figure 4.3).31 Tariffs have fallen much less, if at all, in residential and
small commercial fixed telephony, despite the fact that entry has been substantial. This is
because services are still available from only one operator in many cases, given that entry
has been concentrated in high-traffic areas. But even in those areas where two or more
Table 4.4. Natural gas consumption with back-up, 2003 and 2005Industrial use, in %
Source: Asociación de Distribuidores de Gas Natural.
Region 2003 2005
North 100 . .
V Region (Centre) 72 87
Santiago Metropolitan Region (Centre) 66 81
South 86 96
Average 75 86

4. STRENGTHENING REGULATION IN NETWORK INDUSTRIES
OECD ECONOMIC SURVEYS: CHILE – ISBN 92-64-01355-5 – © OECD 2005104
operators are present, entrants have taken as given, or at most limit-priced, the residential
tariffs charged by the dominant firm.32
As noted in the 2003 Survey, the central regulatory issue in the telecom sector is how
to foster competition while simultaneously setting efficient prices for dominant firms.33
Regulation and industrial organisation have changed considerably in the sector over the
last two decades, in part due to continuous technological innovation, which has
characterised the industry worldwide, and as a result of pro-competition regulatory
Table 4.5. Telecoms: Selected indicators, 1980-2004
Source: SUBTEL.
Fixed lines(in millions)
Density(lines per 100 inhabitants)
Mobile phones (in millions)
International long-distance outgoing traffic
(in millions of minutes)
Internet connections (in thousands)
1980 0.4 . . . . 8.0 . .
1985 0.5 . . . . 13.4 . .
1986 0.6 . . . . 16.2 . .
1987 0.6 4.7 . . 21.2 . .
1988 0.6 4.9 . . 27.5 . .
1989 0.7 5.4 0.0 29.9 . .
1990 0.9 6.5 0.0 38.8 . .
1991 1.0 7.8 0.0 47.0 . .
1992 1.3 9.4 0.1 53.1 . .
1993 1.5 11.0 0.1 59.5 . .
1994 1.6 11.6 0.1 63.5 . .
1995 1.9 13.2 0.2 113.6 . .
1996 2.3 15.6 0.3 144.2 . .
1997 2.7 18.3 0.4 198.8 62.8
1998 3.0 20.4 1.0 215.0 75.0
1999 3.1 20.3 2.3 210.2 150.0
2000 3.3 21.6 3.4 224.0 586.2
2001 3.5 22.4 5.3 254.9 698.2
2002 3.5 22.1 6.4 273.8 757.8
2003 3.3 20.5 7.5 235.6 836.0
2004 3.3 20.7 9.6 247.5 805.3
Figure 4.3. Average revenue per minute and number of mobile phone operators, 1995-2003
Mobile and long-distance telephony
Source: Based on Galetovic and Sanhueza (2002).
7
7
7
7
7
7
7
7
7
7
7
7
7
7
7
7
7
7
8*
BB5=9
?B56==599
4. STRENGTHENING REGULATION IN NETWORK INDUSTRIES
OECD ECONOMIC SURVEYS: CHILE – ISBN 92-64-01355-5 – © OECD 2005 105
reform. The basic tenets of the law that regulates telecoms in Chile are that no legal
monopolies are granted to any operator, technical interconnection is mandatory at
regulated access charges, and operators are free to set end-user tariffs unless they are
considered “dominant” by the Competition Tribunal. In this case, tariffs are regulated by
the Ministry of Public Works, Transport and Telecommunications in conjunction with the
Ministry of Economy in periodic reviews according to the efficient-firm standard (discussed
above) and based on procedures set out by SUBTEL (Subsecretaría de Telecomunicaciones). The
most recent tariff review was in 2004. In several rulings the Competition Tribunal has
stated that the tariff structure must aim at efficiency and has consistently pressed for
unbundling the networks of incumbent operators.34 The law also regulates service quality.
Regulation has focused on fostering entry. It is believed that, as entrants become
strong enough, tariff regulation will no longer be necessary. For example, access charges
for mobile-to-mobile and fixed-to-mobile calls are much higher than for mobile-to-fixed
calls. This tariff structure has promoted the expansion of mobile telephony. Similarly, the
authorities did not escalate access charges to Telefónica CTC’s network in 1999, arguing
that, in doing so, it would give the operator an undue advantage in other vertically-related
markets, long-distance and mobile telephony. Also, until recently, Telefónica CTC was not
allowed to lower tariffs selectively in areas where it faces competition, but had to do so in
all areas. This facilitated entry, but softened price competition in service areas with more
than one operator to avoid predatory behaviour. It is nevertheless important to note that
entry does not necessarily imply more intense price competition. In fact, concentration
tends to be higher in equilibrium in markets where price competition is more intense.35
This is because, if higher margins can be sustained in equilibrium, then more firms can
cover their sunk costs. Moreover, the objective of liberalising tariffs after enough firms
have entered the market is not necessarily sustainable, as there are density and scale
economies in the provision of local telephony (Box 4.5).
The stated aim of tariff regulation has been to set efficient prices. Because telephone
networks exhibit density and scale economies with limited traffic-sensitive costs, efficient
tariffs will most probably involve cross-subsidies (i.e., the additional revenue generated by
a given set of customers is less than the added costs of serving them). For example, in fixed
telephony, the authorities have kept fixed connection charges low, combined with higher
variable charges. It has been argued that high fixed charges discourage connections
(i.e., the demand for connections is more elastic than the demand for traffic). In doing so,
in all likelihood users from high-income-and-traffic areas cross-subsidise those in low
income-and-traffic areas. While cross-subsidies are not inefficient per se, they tend to be
vulnerable to cream-skimming by competitors. It is likely that this problem has been
present in Chile.
Options for reform
Further empirical analysis is needed on the current price structure to determine the
extent and incidence of existing cross-subsidies. This is important for further network
unbundling, which, if pursued, should be consistent with the regulation of dominant firms.
Because entry continues to be decided on the basis of average costs, unbundled parts of a
network should also continue to be priced at average cost, and most cross-subsidies would
need to be eliminated. In any case, the aim of tariff and access charge regulation should be
allocative efficiency, rather than the pursuit of industrial policy objectives.
4. STRENGTHENING REGULATION IN NETWORK INDUSTRIES
OECD ECONOMIC SURVEYS: CHILE – ISBN 92-64-01355-5 – © OECD 2005106
Box 4.5. Telecoms: The technology of a telephone network, and entry and competition
The basic technology of a telephone network
The telephone network is made up of three parts: the “local loop”, which connects eachsubscriber with its local exchange; a “switchboard”, which identifies the called numberand establishes the physical channel that carries the conversation; and the “inter-officetransport”, which connects each local exchange with all others.
The local loop is made of copper wires which connect each phone with its local exchange(there are also local networks that use coaxial cables normally used to provide cable TV).Each copper wire is dedicated to one user and its average cost does not depend on traffic,but on the “density of users”. Broadly speaking, the higher the density in a given area, thelower the average cost of reaching each user, because fixed investments, such astransmission posts, are spread over more users. Also, the number of copper wires installedequals the number of potential, not actual, users. Therefore, average costs fall withpenetration (i.e., the fraction of potential users actually connected).
Switching and inter-office transport are shared by many users and designed toaccommodate peak traffic. While investments in switchboard capacity and transmissionequipment are, by and large, proportional to traffic, other investments, such as housing,energy back-up and air-conditioning equipment, are subject to indivisibilities. Hence,there are economies of scale in traffic; as a result, average costs fall as traffic increases.
Entry and competition
In principle, three types of entry could be considered to foster competition.
First, entrants could be forced to use their own network to serve all areas already servedby the incumbent. In that case, an entrant whose costs are as high as the incumbent’scannot exploit cross-subsidies in the tariff structure.1 But in any case entry would beunlikely because, even if the entrant is more efficient than the incumbent, the existingnetwork is already sunk and, because of network externalities, one user will switch inequilibrium only if most other users also do so. Thus, Chilean policy-makers opted to allowentry by firms who had to build their own network (i.e., facility-based competition), butcould choose which areas to serve (i.e., selective entry), subject to mandatoryinterconnection by the incumbent at regulated access charges.
Second, mandatory interconnection at regulated access charges solves the problemcaused by network externalities because users who switch to an entrant can still access allsubscribers. Selective entry makes small-scale entry feasible because entrants can targetthose zones where traffic and densities are large enough, leaving to the incumbent thoseareas where traffic and densities are low. This reduces the diseconomies of scale arisingwhen the same firm builds two local loops that serve disjoint areas. But selective entrycreates two problems.
First, it is duplicative, as each local loop is subject to density economies. Because thelocal loop comprises a significant part of the cost of a network, it is unlikely that facility-based competition can ever converge to a competitive market with tariffs equal tomarginal cost; density economies imply that all firms would lose money.2 Hence, pricecompetition must be weakened if more than one firm is sustainable.

4. STRENGTHENING REGULATION IN NETWORK INDUSTRIES
OECD ECONOMIC SURVEYS: CHILE – ISBN 92-64-01355-5 – © OECD 2005 107
Price competition should probably be enhanced in areas when there is more than one
service provider. In this regard, the decision made by the Competition Tribunal in 2003 to
allow dominant operators to offer alternative tariffs is a step in the right direction, while
being mindful of the risk of predatory price competition. The access charges for dominant
firms were raised in the 2004 tariff review, resulting in a more symmetrical regulation of
access charges.
Infrastructure concessions
Overview and main issues
Congress passed a law in 1991 allowing the government to carry out concessions for
most public works, including roads, ports and airports. Concessions are carried out
predominantly through build-operate-and-transfer (BOT) arrangements, where a
concessionaire finances, builds, operates and maintains the infrastructure facility. In
exchange, tolls are collected for a fixed length of time, and the infrastructure facility
reverts to the government when the concession contract expires. Concessions are granted
in competitive auctions open to any participant, national or foreign, and the duration of
contracts is usually between 15 and 30 years. Moreover, most contracts include minimum
revenue guarantees by the government in the event that toll proceeds fall short of an
agreed amount. By the end of 2002, the most important highways, ports and airports had
been franchised, with total investment worth around USD 5 billion.
The overall assessment of the concession programme is by and large positive.36 In the
early 1990s, Chile had a large infrastructure deficit in highways, airports, ports and roads
and, as a result, rates of return, both social and private, were high.37 There is widespread
Box 4.5. Telecoms: The technology of a telephone network,and entry and competition (cont.)
Second, long-run average cost (Ramsey) pricing may be inconsistent with self-financingif the dominant firm faces the threat of selective entry. The problem is that entrydecisions depend on the average costs of serving target areas. Thus, a selective entrantwill choose markets where prices are higher than the average costs of service. But thenthe dominant firm will not cover its costs in areas where Ramsey prices are fixed belowaverage costs. The practical implication is that the finer selective entry is allowed to be,the closer must be the tariff structure to average cost of each part of the network.3
Third, the incumbent’s network can be unbundled (i.e., entrants can pay to separately usethe local loop, inter-office transport, and so on). Compared with facility-basedcompetition, unbundling avoids the duplication of local loops and facilitates entry. Tomitigate the problem of cream-skimming, which may be exacerbated by unbundling,prices must be set at provision cost and the unbundled firm must be granted enough priceflexibility to operate in a more competitive environment.
1. See Baumol et al. (1977), for more information.2. Whether some competition is better than only one regulated firm is an empirical question. It depends on
the trade off between lost density economies and smaller information rents of the regulated firm. SeeGasmi et al. (2002), for more information.
3. Braeutigam (1979) shows that Ramsey prices are still optimal if the dominant firm is subject tocompetition, in the sense that optimal prices satisfy the same first-order conditions. The point made byFaulharber (1975), however, is that these Ramsey prices may be vulnerable to selective entry and thusunsustainable.
4. STRENGTHENING REGULATION IN NETWORK INDUSTRIES
OECD ECONOMIC SURVEYS: CHILE – ISBN 92-64-01355-5 – © OECD 2005108
agreement that a substantial part of the infrastructure deficit would not have been reduced
over the past decade, concomitantly with the strengthening of public finances (Chapter 2),
without these public-private partnerships.38 Cost-benefit analysis must be the overriding
criterion for selecting the projects to be eligible for government guarantees. Governance
could be improved to deal with the following issues:
The concession programme lacks an external regulatory framework. Concessions are
designed (including the setting of tolls) and carried out, projects are implemented and
monitored, and contracts are renegotiated under the authority of the Ministry of
Transport, Telecommunications and Public Works (MOP). Each project is designed
independently and conditions are contract-specific. This creates some tension between
the pressure for performance, measured in terms of value of concessions tendered, and
the enforcement of contracts.39 The Ministry of Finance evaluates the future budget
impact of guarantees, as well as their contingent liabilities. It is unclear, however,
whether this has been enough to enforce good practices.
Chile has had a social evaluation programme for government-financed projects for more
than three decades. This evaluation, which is carried out by the Ministry of Planning,
ranks projects according to their estimated social returns. But “complementary
Box 4.6. Chapter 4: Summary of the main recommendations
Cross-sectoral issues
Settle methodological issues prior to tariff reviews, making regulation a continuousprocess between tariff reviews.
Strengthen the regulatory agencies by building a professional career stream for themwithin the civil service.
Set up expert panels for conflict resolution in the areas of telecoms and water, followingthe example of the electricity sector.
Network industries: energy (electricity and gas) and telecoms
In electricity, consider the option of unbundling retailing from distribution and continueto improve the functioning of CDEC by introducing explicit operating rules andprocedures, and possibly granting it greater operational autonomy.
In natural gas, avoid the introduction of import ceilings and origin restrictions to ensuresecurity of supply.
In telecoms, continue to boost price competition in areas with multiple providers.Conduct further analysis on the current price structure to determine the extent andincidence of existing cross-subsidies.
Infrastructure
Strengthen the cost-benefit analysis for selecting infrastructure projects eligible forgovernment guarantees.
Separate the planning, execution and regulatory stages of infrastructure concessionsand assign these functions to different agencies. Set up an oversight body, preferablyindependent from government, in charge of evaluating projects and monitoringcompliance with contractual covenants.
Make information about the terms of contracts public, preferably in a regular report tobe submitted to the legislature.
4. STRENGTHENING REGULATION IN NETWORK INDUSTRIES
OECD ECONOMIC SURVEYS: CHILE – ISBN 92-64-01355-5 – © OECD 2005 109
contracts” can be negotiated outside the regular screening process. This makes it
difficult for policymakers to assess the overall social returns of projects and, therefore,
their relative merits when awarding government guarantees. Also, contract
renegotiation and ensuing compensations are not published. MOP may face
disincentives for renegotiating contracts for fear of exposing weaknesses in project
evaluation.40 But many highway projects have been renegotiated during construction,
and the conditions under which these contracts have been renegotiated are not public.41
Options for reform
Public-private partnerships should be restricted to projects with high social returns.
When private returns are high, the infrastructure project should be carried out privately,
with no need for government guarantees. As Chile’s infrastructure deficit is closing, social
rates of return on new investments are likely to decline, calling for increasingly more
judicious project evaluation and enhanced governance to introduce independent checks
and balances and safeguard the Treasury from undue exposure to contingent liabilities. In
particular:
The planning, execution and regulatory stages of infrastructure concessions should be
unbundled and assigned to different agencies. These agencies should in turn report to
an oversight body, preferably independent from government, which should also be in
charge of evaluating projects and monitoring compliance with contractual covenants.
Chile’s experience with independent expert panels in support of fiscal policymaking,
discussed in Chapter 2, could be extended to the assessment of contingent liabilities
associated with government guarantees awarded to infrastructure projects. This would
be particularly welcome when assessing social rates of return, which are notoriously
difficult to estimate, and consequently selecting projects eligible for government
guarantees. In general, government guarantees should only be granted if there is a
discrepancy between social and private returns associated with projects that are not
privately profitable. If a project is privately profitable, even if risky, it should not be
eligible for a subsidy or guarantee. International experience suggests that the public
interest tends to be better served, and transparency is enhanced, when social welfare
computations are carried out by an independent agency.
Existing guarantees should be incorporated into the normal budgetary process and
oversight procedures. This should be done in three steps: First, standard accounting
principles should be used to evaluate the cost of guarantees to the budget. The
estimation of contingencies is already reported in the budget law and the regular public
debt management reports issued by the Ministry of Finance, which is a step in the right
direction, but could be strengthened by requiring in each budget law publication of
information on the value of concessions awarded and the guarantees exercised in the
reference period. Second, information about the terms of contracts should be made
public, preferably in a regular report to be submitted to the legislature. Third, guarantees
exercised in a given reference period should be paid out of the current budget.
Notes
1. Tariffs are reviewed according to the following sequential procedure: first, the methodology thatwill be used to model the efficient firm and calculate tariffs is elaborated, coupled with a coststudy, which includes a preliminary methodology, an exchange of views between the regulator andthe regulated firm, and the resolution of disputes, should they arise; and, second, tariffs are set.
4. STRENGTHENING REGULATION IN NETWORK INDUSTRIES
OECD ECONOMIC SURVEYS: CHILE – ISBN 92-64-01355-5 – © OECD 2005110
Tariff reviews take between six months and one year. See Butelmann and Drexler (2003), andGaletovic and Sanhueza (2002), for more information.
2. See, for example, Gómez-Lobo and Vargas (2001), Butelmann and Drexler (2003) and Gómez-Lobo(2005), for more information. This is particularly demanding in the case of water because theextraction technologies vary considerably across the regions. Out of 49 water companies, 18 arecontrolled by the private sector and supply about 95% of consumers. Only four of these18 companies (about 4% of the clients) are totally private, without any state participation.
3. This is also the case of methodologies to calculate key variables. In the case of telecoms, the cost-of-capital methodology presented by the regulated firms and the regulator differ markedly, and sodo the point estimates.
4. Legislation requires that administrative acts be made public. Nevertheless, access to technicalstudies is reported to be difficult because they are not kept in a public repository, but is improving.
5. See Jadresic et al. (2001), for a description of the internal organisation of different regulatoryagencies.
6. For example, the telecom regulator is an undersecretary at the Minister of Transport,Telecommunications and Public Works (MOP) and is overseen by the Minister of Economy. But inpractice, regulation is delegated to MOP’s Undersecretary of Telecommunications. The electricityregulator is also an undersecretary, but reports to a council of ministers. The water regulator is asuperintendency reporting directly to the President. For more information on the water sector,see Bitran and Arellano (2005).
7. This problem has been mitigated in the case of the competition authorities with the reformsleading to the creation of the Competition Tribunal (Tribunal de Defensa de la Libre Competencia) inNovember 2003, with a specific career and remuneration schedules for its staff and fixed-term,renewable appointments for its members. See OECD (2004, 2005a), for more information.
8. For example, it is generally agreed that the draft electricity laws submitted to Congress over thelast couple of years (Ley Corta I and Ley Corta II) were improved significantly during the legislativediscussion.
9. In the case of water, an expert committee made up of three members (two appointed by theregulator, of which one is chosen from a list of names agreed with the utility company, and a thirdexpert appointed by the utility company) is in charge of conflict resolution.
10. The Competition Tribunal appoints the members of the panel and, in principle, care must beexercised when deciding on the composition of the panel between members appointed by theregulator, the government (if any) and the industry, so as to avoid capture by one of the interestedparties.
11. The Minister of Economy has the right to veto a resolution of the panel within ten days after it isissued. So far this prerogative has not been exercised.
12. The Argentine government considered the 1995 protocol for gas exports to Chile void when cuttingsupply in 2004 because it had not been ratified by Congress. Supply restrictions were lifted in partduring July-November 2004. The data underestimates the economic magnitude of the supply cutsin March-April 2005, because Chilean generators serving central Chile have been able to securesupply after agreeing with the Argentine authorities to generate electricity in Argentina with coaland fuel oil.
13. Chile’s electricity system is divided into four non-connected regional systems: CentralInterconnected System (SIC), Interconnected System of the Norte Grande (SING), Aysén system andMagallanes.
14. Total consumption of energy in 2004 was about 34 000 GWh. On average, about 24 000 GWh (70% ofenergy consumed) can be generated by hydro-power. But the share of hydro-power can climb toalmost 100% if the hydrology is very wet (as in 1972) or fall to about 35% (11 000 GWh) in a very dryyear, such as 1968 or 1998. In other words, in a very dry year, 13 000 GWh (more than one-half ofhydro-energy normally available) is lost. In comparison, if gas imports were to be cut entirely forone year, it would result in a shortfall of about 9 000 GWh. In practice, gas cuts were much lowerduring 2004, at around 2 000 GWh.
15. See also Pollitt (2004), for more discussion and background information.
16. See Fischer and Galetovic (2003), for more discussion.
17. For example, Benavente et al. (2005) estimate that, if the compensation mechanism is maintainedfor nine months (the usual duration of a drought in central Chile), residential consumption would
4. STRENGTHENING REGULATION IN NETWORK INDUSTRIES
OECD ECONOMIC SURVEYS: CHILE – ISBN 92-64-01355-5 – © OECD 2005 111
fall by about 12%. By contrast, during the 1998-99 drought, the overall deficit was only 3%. Becausegenerators have to compensate each kWh at the outage cost, such a large reduction will probablymean bankruptcy for those in deficit. Not surprisingly, generators have fought vigorously in courtagainst paying compensation. The result is that in all likelihood a deficit will lead to outages, asin 1998-99. See also Fierro and Serra (1997), for more information.
18. For example, the node price fell even before imports of Argentine gas began in 1997. If the supplyof Argentine gas resumes without interruption, then the node price would fall, discouraginginvestment. New coal or LNG-run plants would come on stream in 2009 at the earliest, anduntil 2008 the probability of a deficit is increasing and without precedent in the history of theprivate electricity sector.
19. This is because the distribution company could adjust the access tariff to render a generator’s offeruncompetitive. In fact, so far only once did a generator win a contract to serve a free customerlocated within the service area of a distribution company, the state-owned Santiago Metro, owingpredominantly to a political decision by the government. In the SIC system, generators havecontracts with about 60 free customers.
20. There is also a per kWh surcharge during the winter months, which is paid by customersconsuming more than 200 kWh. The surcharge affects no more than 10% of residential consumers.
21. Galetovic et al. (2004) estimate that, at the current level of residential consumption, the welfareloss is in the order of USD 50 million per year.
22. Galetovic et al. (2004) show that the cost of supplying residential customers could be cut by aboutUSD 2/MWh by increasing their load factor (i.e., the ratio of peak power consumption to averagepower consumption; a ratio of one implies that the customer’s load is constant all the time) fromthe current 70% to the system average, 74%.
23. Montero and Rudnick (2001) estimate that, if energy rates reflected their current opportunity cost,generation capacity could be cut by at least 20%, based on the elasticity of residential energydemand estimated by Benavente et al. (2005).
24. CDEC was created in 1985 as an association of generators with more than 2% of installed capacity.In 1997 transmission companies with at least 100 km of lines were included. Ley Corta II extendedmembership to firms that own sub-transmission installations (mainly distributors) and arepresentative of free customers. Until 1998 CDEC had been ruled by a Board of Representatives ofeach company and the operation of the system was rotated among them. In 1998 generatorscreated a separate Operations Direction, although its operational autonomy is limited. See Rudnick(2005), for more information.
25. See Arellano (2004a, 2004b), for estimates of consumer surplus and average welfare in the event ofliberalisation of the spot market. Because the supply curve of generators, other than ENDESA, isinelastic when the system operates at close to capacity, the residual demand curve confronted byENDESA at those hours is inelastic, creating an incentive to withhold water.
26. See Balmaceda and Serra (2005), for more information.
27. Back-up is provided by (in order of importance): diesel, fuel oil, LNG, coal, coke gas and kerosene.
28. Decree No. 263 of 1995. See Balmaceda and Serra (2005), for more information.
29. Se OECD (2005b), for more descriptive information.
30. For example, calls to the United States during business hours are significantly cheaper than thoseestimated by Fischer and Serra (2002) had tariffs remained regulated.
31. For example, each long-distance carrier has been accessible through a two-digit code system sincethe early stages of liberalisation and the competition authorities made it illegal for firms to blockdirect access to competitors in exchange for more favourable rates. This kept switching costs low,favouring price competition. In mobile telephony, prices plummeted when the “calling party pays”system and pre-paid phones were introduced in 1999. Pre-paid phones can be discarded and aresold through regular retailers. Switching costs are therefore lower and price competition, moreintense. More recently, the Competition Tribunal has made it illegal for mobile phone operators tocode-block handsets to prevent use in competitor networks (Resolution No. 2 of 2005).
32. Telefónica CTC, the former government-controlled telecom monopoly, is still the dominant firm inChile. Nevertheless, its share in total fixed lines fell from 94% in 1990 to 73.2% in 2003. Cablecompanies (VTR and Metropolis) have taken advantage of economies of scope to serve residentialcustomers, and Entel Phone has targeted the commercial market. See Fischer and Serra (2002), formore information.
4. STRENGTHENING REGULATION IN NETWORK INDUSTRIES
OECD ECONOMIC SURVEYS: CHILE – ISBN 92-64-01355-5 – © OECD 2005112
33. See Jadresic (2002), for further discussion.
34. For example, in Resolution No. 515 of 1998 the Competition Tribunal stated that when settingtariffs, SUBTEL should also unbundle the services offered by dominant firms as much astechnically possible. More recently, in Resolution No. 2 of 2005, the Tribunal recommended thatSUBTEL force all mobile phone operators to sell capacity to virtual mobile operators.
35. See Sutton (1991), for further discussion.
36. See Engel et al. (2000, 2003) and Gómez-Lobo and Hinojosa (2000), for comprehensive overviews.
37. For example, Echenique (2005) estimates the rate of return of the urban highway concessions inSantiago to be of the order of 70%.
38. Because under BOT a private concessionaire finances and operates the infrastructure in exchangefor tolls, it is often claimed that BOT contracts deliver the same efficiency gains as privatisation. Itis argued that: first, a firm that is responsible for construction and maintenance should have theright incentives to invest in quality; second, private firms are supposedly better managers thangovernments; third, BOT contracts might be desirable on distributional grounds, since cost-basedtolls might be easier to justify politically when infrastructure providers are private; and, finally, incontrast to the traditional approach, under BOT only privately profitable projects are built becausethe market mechanism screens projects. Nevertheless, BOTs may not encourage allocativeefficiency when the franchise-holder’s budget constraint is soft.
39. For example, a report issued by the National Controller in October of 2002 concludes that MOPrelies solely on traffic measurements made by the concessionaire, instead of independentmeasurements. This is worrisome, since government guarantees are triggered by low traffic flows,and franchise-holders have incentives to underreport traffic.
40. Evidence is essentially anecdotal. For example, after signing the concession contract for Route 78,which connects Santiago to the port city of San Antonio, MOP required additional works that werenot included in the original contract. The concessionaire asked for compensation for theadditional works and MOP raised the toll by 18.1% during five years. No further explanation wasgiven, the agreement was made public after it was signed, and the calculations that defined thecompensation were not made public. See Paredes and Sanchez (2004), for more information.
41. Twelve out of the 16 highway projects awarded by 1998 had been renegotiated by May 2002. Therewere 31 modifications to the original contracts, with total value of USD 0.5 billion. These projectswere valued at USD 3.4 billion, that is, there was an average cost increase of about 15%. Additionalconstruction work or early completion of sections of the highways were repaid with extensions ofthe concession length, direct payments from MOP, higher tolls, early operation of toll booths andreductions in other construction work. There was no external supervision to ensure that therenegotiation process was fair.
Bibliography
Arellano, S. (2004a), “Market Power in Mixed Hydro-Thermal Electric Systems”, CEA Working Paper,No. 187, Centre for Applied Economics, University of Chile, Santiago.
Arellano, S. (2004b), “Reformando el Sector Eléctrico Chileno: Diga No a la Liberalización del MercadoSpot”, CEA Working Paper, No. 197, Centre for Applied Economics, University of Chile, Santiago.
Balmaceda, F. and P. Serra (2005), “The Chilean Natural Gas Market”, in P. Beato and J. Benavides (eds.)Gas Market Integration in the Southern Cone, Inter-American Development Bank, Washington, DC.
Baumol, W., E. Bailey and R. Willig (1977), “Weak Invisible Hand Theorems on the Sustainability ofMultiproduct Natural Monopoly”, American Economic Review, Vol. 67, pp. 350-65.
Benavente, J.M., A. Galetovic, P. Serra and R. Sanhueza (2005), “Estimando la Demanda Residencial porElectricidad en Chile: El Consumo Responde al Precio”, Cuadernos de Economía, forthcoming.
Bitrán, G. and P. Arellano (2005), “Regulating Water Services: Sending the Right Signals to Utilities inChile”, Public Policy for the Private SectorNo. 286, World Bank, Washington, DC.
Braeutigam, R. (1979), “Optimal Pricing with Intermodal Competition”, American Economic Review,Vol. 69, pp. 38-49.
Butelmann, A. and A. Drexler (2003), “La Regulación de Monopolios Naturales en Chile”, Unpublishedmanuscript, Santiago.
4. STRENGTHENING REGULATION IN NETWORK INDUSTRIES
OECD ECONOMIC SURVEYS: CHILE – ISBN 92-64-01355-5 – © OECD 2005 113
Echenique, M. (2005), “Las Vías Expresas Urbanas? Qué tan Rentables Son?”, forthcoming inA. Galetovic (ed.), Santiago: Dónde Estamos y Hacia Dónde Vamos, Centro de Estudios Públicos,Santiago.
Engel, E., R. Fischer and A. Galetovic (2000), “El Programa Chileno de Concesiones de Infraestructura:Evaluación, Experiencias y Perspectives”, in F. Larraín and R. Vergara (eds.), La TransformaciónEconómica de Chile, Centro de Estudios Públicos, Santiago.
Engel, E., R. Fischer and A. Galetovic (2003), “Privatizing Highways in Latin America: Fixing What WentWrong”, Economia, Vol. 4, pp. 129-64.
Faulharber, G. (1975), “Cross-Subsidiation: Pricing in Public Enterprises”, American Economic Review,Vol. 65, pp. 966-77.
Fierro, G. and P. Serra (1997), “Outage Costs in Chilean Industry”, Energy Economics, Vol. 19, pp. 417-34.
Fischer, R. and A. Galetovic (2003), “Regulatory Governance and Chile’s 1998-1999 Electricity Shortage”,Journal of Policy Reform, Vol. 6, pp. 103-24.
Fischer, R. and P. Serra (2002), “Evaluación de la Regulación de las Telecomunicaciones en Chile”,Perspectivas en Política, Economía y Gestión, Vol. 6, pp. 45-77.
Galetovic, A., J.R. Inostroza and C. Muñoz (2004), “Gas y Electricidad: Qué Hacer Ahora?”, EstudiosPúblicos, Vol. 96, pp. 49-106.
Galetovic, A. and R. Sanhueza (2002), “Regulación de Servicios Públicos: Hacia Dónde Debemos Ir?”,Estudios Públicos, Vol. 85, pp. 101-37.
Gasmi, F., J.J. Laffont and W. Sharkey (2002), “The Natural Monopoly Test Reconsidered: An EngineeringProcess-Based Approach to Empirical Analysis in Telecommunications”, International Journal ofIndustrial Organization, Vol. 20, pp. 435-59.
Gómez-Lobo, A. (2005), “Bottom-up or Top-down Benchmarking in Natural Monopoly Regulation: TheCases of Chile and the United Kingdom”, forthcoming in O. Chisari (ed.), Regulation in Latin America,Edward Elgar, Northhampton, MA.
Gómez-Lobo, A. and S. Hinojosa (2000), “Broad Roads in a Thin Country: Infrastructure Concessions inChile,”World Bank Policy Research Working Paper, No. 2279, World Bank, Washington, DC.
Gómez-Lobo, A. and M. Vargas (2001), “La Regulación de las Empresas Sanitarias en Chile: UnaRevisión del Caso EMOS y una Propuesta de Reforma Regulatoria”, Working Paper, No. 177,Economics Departament, University of Chile, Santiago.
Gönenç, R., M. Maher and G. Nicoletti (2001), “The Implementation and the Effects of RegulatoryReform: Past Experience and Current Issues”, OECD Economic Studies, No. 32, pp. 11-98.
Jadresic, A., V. Blanlot and G. San Martin (2001), La Nueva Regulación, Dolmen, Santiago.
Jadresic, A. (2002), “Agenda Pro-crecimiento y Telecomunicaciones,”Perspectivas en Política, Economía yGestión, Vol. 6, pp. 129-39.
Montero, J.P. and H. Rudnick (2001), “Precios Eléctricos Flexibles”, Cuadernos de Economía, Vol. 38, pp. 91-109.
OECD (2004), Competition Law and Policy in Chile: A Peer Review, OECD, Paris.
OECD (2005a), The Relationship between Competition Authorities and the Sectoral Regulators: Contribution fromChile, Global Forum on Competition, Internal OECD Document, OECD, Paris.
OECD (2005b), Roundtable on Bringing Competition into Regulated Sectors: Contribution from Chile, GlobalForum on Competition, Internal OECD Document, OECD, Paris.
Paredes, R.D. and J.M. Sanchez (2004), “Government Concessions Contracts in Chile: The Role ofCompetition in the Bidding Process”, Economic Development and Cultural Change, Vol. 53, pp. 215-34.
Pollitt, M. (2004), “Electricity Reform in Chile: Lessons for Developing Countries”, Unpublishedmanuscript, University of Cambridge, Cambridge.
Rudnick, H. and R. Raineri (1997), “Chilean Distribution Tariffs: Incentive Regulation”, in F. Morandéand R. Raineri (eds.), (De)regulation and Competition: The Electric Industry in Chile, Ilades/GeorgetownUniversity, Santiago.
Rudnick, H. (2005), “Un Nuevo Operador Independiente de los Mercados Eléctricos Chilenos”,Unpublished manuscript, Santiago.
Sutton, J. (1991), Sunk Costs and Market Structure, MIT Press, Cambridge, MA.

ISBN 92-64-01355-5
OECD Economic Surveys: Chile
© OECD 2005
OECD ECONOMIC SURVEYS: CHILE – ISBN 92-64-01355-5 – © OECD 2005 115
Chapter 5
Making better use of labour resources
To sustain a high rate of GDP growth over the medium term, Chile needs to improvethe functioning of its labour market. This chapter discusses options for reform inthis area. The 2003 Survey found that Chile had greater potential for increasinglabour supply than most OECD economies, having a relatively young populationand low employment/population ratios for women and youths. An increase inlabour supply could be achieved by relaxing restrictions on the duration oftemporary contracts and the allocation of working time for full-time workers, aswell as by improving options for childcare and pre-school education. Lowerproductivity accounts for most of Chile’s income gap relative to the OECD area. Tobridge this gap, human capital accumulation could be encouraged for those alreadyin the labour market by improving the efficiency of labour training at the enterpriselevel, in addition to continuing to raise the quality of formal education.
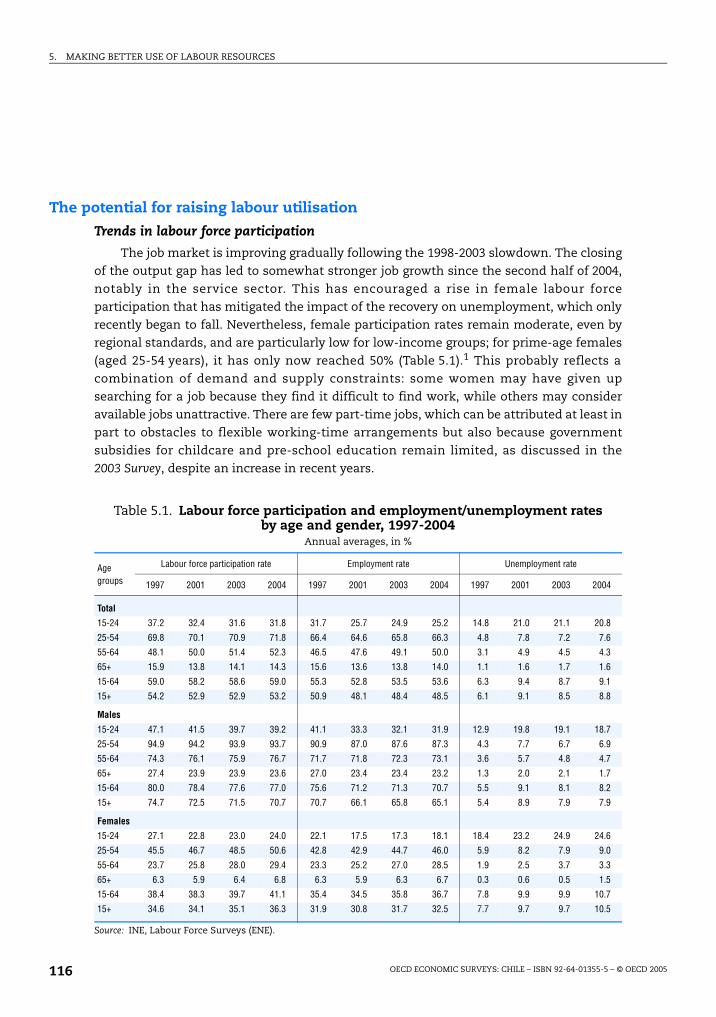
5. MAKING BETTER USE OF LABOUR RESOURCES
OECD ECONOMIC SURVEYS: CHILE – ISBN 92-64-01355-5 – © OECD 2005116
The potential for raising labour utilisation
Trends in labour force participation
The job market is improving gradually following the 1998-2003 slowdown. The closing
of the output gap has led to somewhat stronger job growth since the second half of 2004,
notably in the service sector. This has encouraged a rise in female labour force
participation that has mitigated the impact of the recovery on unemployment, which only
recently began to fall. Nevertheless, female participation rates remain moderate, even by
regional standards, and are particularly low for low-income groups; for prime-age females
(aged 25-54 years), it has only now reached 50% (Table 5.1).1 This probably reflects a
combination of demand and supply constraints: some women may have given up
searching for a job because they find it difficult to find work, while others may consider
available jobs unattractive. There are few part-time jobs, which can be attributed at least in
part to obstacles to flexible working-time arrangements but also because government
subsidies for childcare and pre-school education remain limited, as discussed in the
2003 Survey, despite an increase in recent years.
Table 5.1. Labour force participation and employment/unemployment rates by age and gender, 1997-2004
Annual averages, in %
Source: INE, Labour Force Surveys (ENE).
Age groups
Labour force participation rate Employment rate Unemployment rate
1997 2001 2003 2004 1997 2001 2003 2004 1997 2001 2003 2004
Total
15-24 37.2 32.4 31.6 31.8 31.7 25.7 24.9 25.2 14.8 21.0 21.1 20.8
25-54 69.8 70.1 70.9 71.8 66.4 64.6 65.8 66.3 4.8 7.8 7.2 7.6
55-64 48.1 50.0 51.4 52.3 46.5 47.6 49.1 50.0 3.1 4.9 4.5 4.3
65+ 15.9 13.8 14.1 14.3 15.6 13.6 13.8 14.0 1.1 1.6 1.7 1.6
15-64 59.0 58.2 58.6 59.0 55.3 52.8 53.5 53.6 6.3 9.4 8.7 9.1
15+ 54.2 52.9 52.9 53.2 50.9 48.1 48.4 48.5 6.1 9.1 8.5 8.8
Males
15-24 47.1 41.5 39.7 39.2 41.1 33.3 32.1 31.9 12.9 19.8 19.1 18.7
25-54 94.9 94.2 93.9 93.7 90.9 87.0 87.6 87.3 4.3 7.7 6.7 6.9
55-64 74.3 76.1 75.9 76.7 71.7 71.8 72.3 73.1 3.6 5.7 4.8 4.7
65+ 27.4 23.9 23.9 23.6 27.0 23.4 23.4 23.2 1.3 2.0 2.1 1.7
15-64 80.0 78.4 77.6 77.0 75.6 71.2 71.3 70.7 5.5 9.1 8.1 8.2
15+ 74.7 72.5 71.5 70.7 70.7 66.1 65.8 65.1 5.4 8.9 7.9 7.9
Females
15-24 27.1 22.8 23.0 24.0 22.1 17.5 17.3 18.1 18.4 23.2 24.9 24.6
25-54 45.5 46.7 48.5 50.6 42.8 42.9 44.7 46.0 5.9 8.2 7.9 9.0
55-64 23.7 25.8 28.0 29.4 23.3 25.2 27.0 28.5 1.9 2.5 3.7 3.3
65+ 6.3 5.9 6.4 6.8 6.3 5.9 6.3 6.7 0.3 0.6 0.5 1.5
15-64 38.4 38.3 39.7 41.1 35.4 34.5 35.8 36.7 7.8 9.9 9.9 10.7
15+ 34.6 34.1 35.1 36.3 31.9 30.8 31.7 32.5 7.7 9.7 9.7 10.5

5. MAKING BETTER USE OF LABOUR RESOURCES
OECD ECONOMIC SURVEYS: CHILE – ISBN 92-64-01355-5 – © OECD 2005 117
Chile’s favourable demography facilitates a rapid increase in labour supply. This is
important because, as discussed in Chapter 1, lower labour utilisation rates account for a
considerable share of Chile’s income gap with respect to the OECD area. The 2003 Survey
found that Chile had greater potential for increasing labour supply than most OECD
economies, having a relatively young population and low employment/population ratios
for females and youths.2 Population ageing is under way, but its negative effect on potential
labour supply will be moderate over the near future. Life expectancy at birth was estimated
at 76.5 years in 2004, or marginally below the OECD average, while the total fertility rate
declined from 2.4 children per woman in 2000 to 2.1 in 2004 – the replacement level. As a
result, the working-age population will continue to rise, albeit at a declining rate from the
next decade. These trends are in line with those of regional comparators, including the
Southern Cone countries and Mexico.
Labour supply can still grow on the back of considerable labour market slack. This
includes not only the unemployed, as defined in labour force surveys, but also many
“latent” job seekers. When employment increased in the late 1980s and early 1990s, many
new job seekers were attracted to the labour market and unemployment declined by much
less than expected (Figure 5.1). Similarly, after the mid-1990s, both the employment and
the labour force participation rates fell. Had many of those counted as inactive been more
eager to seek jobs, the unemployment rate might have been substantially higher at end-
2004 than the actual 9% of the labour force (5% of the adult population). A closer scrutiny
of the period 1997-2004 shows a declining employment rate especially for young males
(aged 15-24 years).3 The corresponding rates for young females and prime-age males (aged
25-54 years) declined less, and stabilised from 1999, while positive trends were recorded for
females in the prime age and for both genders in the older working-age cohort (55-64 years
of age).
Robust job growth is a powerful means of reducing poverty and improving the income
distribution, which the authorities place among their main policy challenges. It is also
essential for the financing of social protection, as discussed in Chapter 2. It is to a large
extent for these reasons that OECD governments have increasingly turned their attention
to the employment rate as a key policy target, over and above the narrower goal of reducing
Figure 5.1. Trends in employment and unemployment rates, 1986-2004Annual averages1
1. The employment and unemployment rates are defined in percentage of the adult population, so that the labourforce participation rate is the sum of the employment and unemployment rates.
Source: INE, Labour Force Surveys (ENE).
85-&
5-&
=&./ =&./
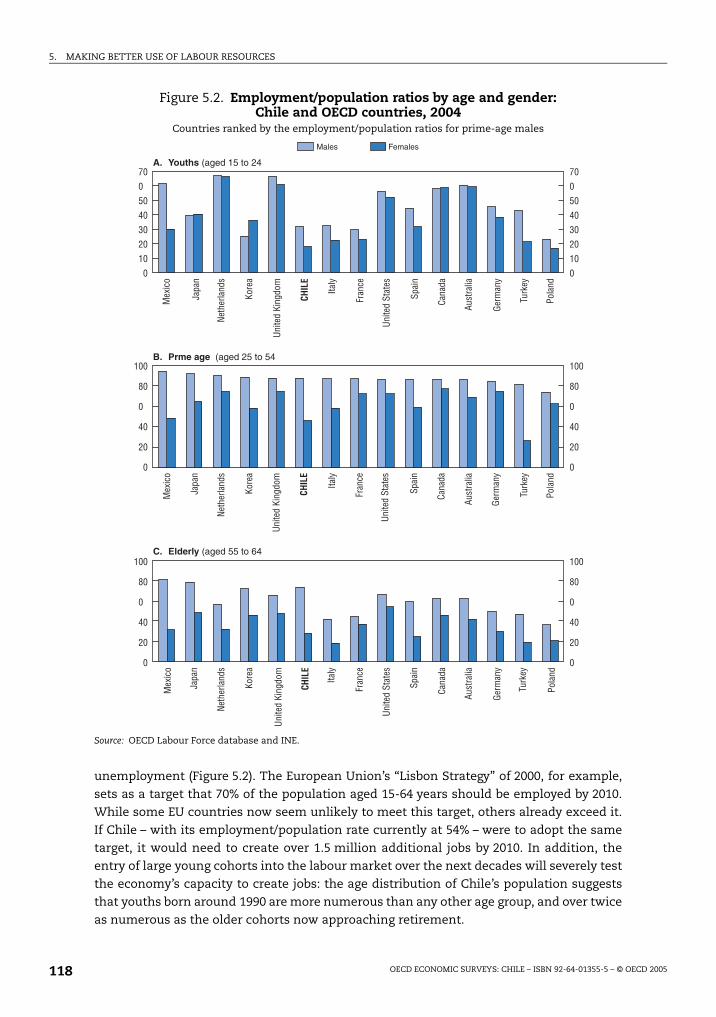
5. MAKING BETTER USE OF LABOUR RESOURCES
OECD ECONOMIC SURVEYS: CHILE – ISBN 92-64-01355-5 – © OECD 2005118
unemployment (Figure 5.2). The European Union’s “Lisbon Strategy” of 2000, for example,
sets as a target that 70% of the population aged 15-64 years should be employed by 2010.
While some EU countries now seem unlikely to meet this target, others already exceed it.
If Chile – with its employment/population rate currently at 54% – were to adopt the same
target, it would need to create over 1.5 million additional jobs by 2010. In addition, the
entry of large young cohorts into the labour market over the next decades will severely test
the economy’s capacity to create jobs: the age distribution of Chile’s population suggests
that youths born around 1990 are more numerous than any other age group, and over twice
as numerous as the older cohorts now approaching retirement.
Figure 5.2. Employment/population ratios by age and gender: Chile and OECD countries, 2004
Countries ranked by the employment/population ratios for prime-age males
Source: OECD Labour Force database and INE.
'9 :59
=)$&. 35
'
+,
)
"
.
.
&"
-
'
,
(
!'"'*&..A3
# "
/
6%
1"
5
'
+,
)
"
.
.
&"
-
'
,
(
#& ..3
# "
/
6%
1"
5
'
+,
)
"
.
.
&"
-
'
,
(
# "
/
6%
1"
5. MAKING BETTER USE OF LABOUR RESOURCES
OECD ECONOMIC SURVEYS: CHILE – ISBN 92-64-01355-5 – © OECD 2005 119
Labour market segmentation
Labour market segmentation reduces the scope for raising utilisation in the formal
sector. Like many other low and medium-income economies, Chile appears to have a
“dual” labour market. This suggests that job openings in the regulated formal economy are
in short supply and that there is a large informal sector. As discussed in the 2003 Survey,
labour market segmentation also tends to blunt and distort competition and to undermine
the incentives to improve skills, making it difficult to reduce Chile’s comparatively skewed
income distribution (Box 5.1).4
International experience shows that rigid employment protection legislation (EPL) can
discourage formal employment, contributing to labour market segmentation. Overall, EPL
is not very restrictive in Chile; there are no special safeguards against large-scale
(collective) dismissals, for example, in contrast to most OECD countries. But a few EPL
provisions are unusually stringent, including a limitation on the duration of fixed-term
contracts to one year and the level of severance pay on termination of indefinite contracts.5
The Ministry of Labour’s 2002 Labour Survey (ENCLA), covering formal enterprises with at
least 5 workers, found that only 13% of all formal employees had jobs defined as
temporary.6 The proportion of workers with non-standard (i.e., fixed-term or specific-task)
contracts was somewhat higher, at 23% in 2004 (according to ENCLA), up from 17% in 1999.
While fixed-term contracts are found in most sectors, specific-task contracts are
Box 5.1. Informality and the structure of the labour market
There is considerable labour market informality in Chile. Employees without labourcontracts accounted for nearly one-quarter of dependent employment in 2003 (17% of totalemployment), while over one-third of the employed of all categories did not contribute tosocial insurance. The situation has not improved in recent years. Most own-accountworkers should also probably be regarded as informal.
Available statistics cannot fully capture the diversity of the job market. Possibleindicators of the “quality” of employment, such as pay, contract type and social insurancestatus, often seem to vary as much within as between common statistical categories ofemployment. A few aggregate indicators about Chile’s employment structure arenoteworthy:
The share of agriculture in employment, at 13%, is on a par with other middle-incomedeveloping countries, but higher than in almost all OECD economies. Within theprimary sector, self-employed farmers and family helpers account for the bulk ofemployment in parts of southern Chile (VIII-XI Regions), while elsewhere, especially incentral Chile, the share of dependent employment in farming tends to be higher.
Most of the net increase in employment over the past decades has occurred in theservice sector, which accounted for nearly two-thirds of total employment in 2004.Industrial employment declined substantially as a result of economic restructuring inthe late 1990s but recovered after 2000, stabilising at about 16% of total employment.
Self-employment is widespread in agriculture and services. Non-agricultural self-employment accounts for about one-quarter of total employment – a high figure byOECD standards – though lower than, for example, in Mexico and Turkey. Most self-employed are own-account workers, who are likely to employ only relatives or domesticworkers, while only about one in ten has been classified as an “employer”.
5. MAKING BETTER USE OF LABOUR RESOURCES
OECD ECONOMIC SURVEYS: CHILE – ISBN 92-64-01355-5 – © OECD 2005120
concentrated, as in many countries, in sectors where job conditions are intrinsically
unstable, especially agriculture and construction.
Employers who find EPL too rigid can often, without breaking the law, engage workers
who are “dispatched” by other employers (Trabajadores suministrados) or resort to
subcontracting. Dispatching accounted for around 5% of employment in enterprises covered
by the Labour Survey (ENCLA) in 1999 and 7.3% in 2002, and is a relatively recent
phenomenon. This is in addition to the practice of subcontracting, common in Chile as in
OECD countries.7 Much of subcontracting relates to legal services, security, cleaning,
marketing and catering, which tend to be provided by specialised firms. But ENCLA shows
that some 20% of subcontracting actually concerns client-enterprises’ own core activities,
suggesting that firms avoid recruiting even for those functions.8 Taken together, the rules for
temporary contracts, subcontracting and dispatching allow for more flexible hiring than the
standard indefinite-duration contracts. Nevertheless, the total number of employees with
such temporary arrangements in the formal sector is still seemingly not higher than the
number of informal employees, which has been estimated at 25% of all employees.
Labour turnover at enterprise level in the formal sector – measured by hirings and
separations – is not out of line with the situation in many OECD countries.9 Judging from
information available from the Labour Survey (ENCLA), 11% of the indefinite contracts in
force in 2002 had been signed in the previous year, down from 17% in 1999.10 Taking into
account all types of contract, labour turnover may have declined even more, although it
must be recognised that turnover is affected by the business cycle. While there are no
comprehensive data, the total turnover rate was under 30% in almost four-fifths of the
enterprises surveyed by ENCLA in 2002. Just over one-half of the reported separations
concerned indefinite contracts, and these were terminated about as often by employers
(dismissals) as by workers (quits). The use of temporary contracts has tended to increase at
the same time as turnover has declined for both temporary and indefinite contracts.
Restrictions on working time
Statutory maximum working time, which corresponds to practice in many enterprises,
was reduced from 48 to 45 hours per week at the beginning of 2005. The 2002 Labour
Survey (ENCLA) of formal employees reported an actual average working week of
46.1 hours, with relatively small variations across the main sectors.11 According to the 2004
Labour Force Survey (ENE), the average effective working time for all formal and informal
employees was 46 hours for males and 42 hours for females (Table 5.2). Only 11% of the
female employees and 5% of males worked under 30 hours per week. Own-account
workers have much more variable working time, especially in non-agricultural sectors, and
somewhat shorter average working time than employees. Both part-time work and very
long working times are common among the self-employed and some salaried workers.
Part-time own-account workers appear to include a significant group with very low
incomes, suggesting a casual or marginal participation in the economy.
Existing rules provide limited room for allocating regular working time, which cannot
exceed 10 hours per day, posing an obstacle to better labour utilisation. Overtime is capped
at 2 hours per working day, and allowed only on a temporary basis and when deemed
necessary for the enterprise, with a mandatory additional compensation of 50% of the hourly
wage. Sunday work is excluded in principle, but there are exceptions and some recent
increase has been noted.12 Enterprises can introduce shorter “ordinary” working weeks than
the legal maximum, but this practice is not common. The legislation does not discourage
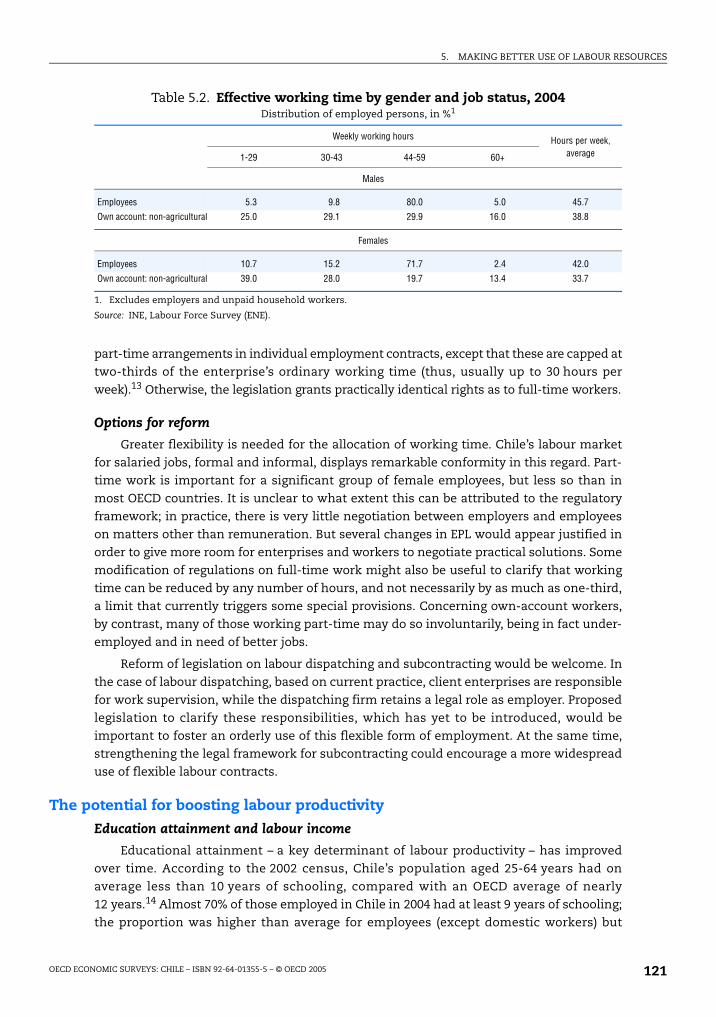
5. MAKING BETTER USE OF LABOUR RESOURCES
OECD ECONOMIC SURVEYS: CHILE – ISBN 92-64-01355-5 – © OECD 2005 121
part-time arrangements in individual employment contracts, except that these are capped at
two-thirds of the enterprise’s ordinary working time (thus, usually up to 30 hours per
week).13 Otherwise, the legislation grants practically identical rights as to full-time workers.
Options for reform
Greater flexibility is needed for the allocation of working time. Chile’s labour market
for salaried jobs, formal and informal, displays remarkable conformity in this regard. Part-
time work is important for a significant group of female employees, but less so than in
most OECD countries. It is unclear to what extent this can be attributed to the regulatory
framework; in practice, there is very little negotiation between employers and employees
on matters other than remuneration. But several changes in EPL would appear justified in
order to give more room for enterprises and workers to negotiate practical solutions. Some
modification of regulations on full-time work might also be useful to clarify that working
time can be reduced by any number of hours, and not necessarily by as much as one-third,
a limit that currently triggers some special provisions. Concerning own-account workers,
by contrast, many of those working part-time may do so involuntarily, being in fact under-
employed and in need of better jobs.
Reform of legislation on labour dispatching and subcontracting would be welcome. In
the case of labour dispatching, based on current practice, client enterprises are responsible
for work supervision, while the dispatching firm retains a legal role as employer. Proposed
legislation to clarify these responsibilities, which has yet to be introduced, would be
important to foster an orderly use of this flexible form of employment. At the same time,
strengthening the legal framework for subcontracting could encourage a more widespread
use of flexible labour contracts.
The potential for boosting labour productivity
Education attainment and labour income
Educational attainment – a key determinant of labour productivity – has improved
over time. According to the 2002 census, Chile’s population aged 25-64 years had on
average less than 10 years of schooling, compared with an OECD average of nearly
12 years.14 Almost 70% of those employed in Chile in 2004 had at least 9 years of schooling;
the proportion was higher than average for employees (except domestic workers) but
Table 5.2. Effective working time by gender and job status, 2004Distribution of employed persons, in %1
1. Excludes employers and unpaid household workers.
Source: INE, Labour Force Survey (ENE).
Weekly working hours Hours per week, average1-29 30-43 44-59 60+
Males
Employees 5.3 9.8 80.0 5.0 45.7
Own account: non-agricultural 25.0 29.1 29.9 16.0 38.8
Females
Employees 10.7 15.2 71.7 2.4 42.0
Own account: non-agricultural 39.0 28.0 19.7 13.4 33.7

5. MAKING BETTER USE OF LABOUR RESOURCES
OECD ECONOMIC SURVEYS: CHILE – ISBN 92-64-01355-5 – © OECD 2005122
relatively low for own-account workers (Table 5.3). As in many countries, farmers stand out
with much lower average attainment than other groups. Chile’s education system has
recently improved in many respects, but the same holds for many of the countries with
which it competes in the world market. The importance of education as a trigger of
economic growth was pointed out in Chapter 1. International studies, quoted there, found
that growth performance was strongly correlated with enrolment in education and with its
quality.
Educational attainment is a powerful determinant of labour income. This suggests
considerable scope for improvement as a means of not only increasing the economy’s
growth potential but also reducing income disparities, which remain high. Farmers,
construction workers, employees without a formal employment contract and those with
temporary jobs, unskilled manual and, to a lesser extent, skilled manual workers tend to
be over-represented among the very poor, defined as those individuals in the bottom
income quintile (i.e., well below the poverty line) (Table 5.4). Social insurance coverage, a
sign of formal employment, is more prevalent in high-income quintiles, as expected, but
there are significant groups of contributors and non-contributors in every quintile, as
discussed in Chapter 2. Most bottom-quintile workers have not completed secondary
education, while a majority in the top quintile have post-secondary education.
The increase in schooling has been accompanied by a reduction in youth employment,
which is currently very low in Chile in comparison with OECD countries. This suggests that
the labour market awards high returns to investment in formal education, but not
necessarily in work experience and job-related skill acquisition. By contrast, among OECD
countries, youth employment is twice as high in the Netherlands and in English-speaking
Table 5.3. Distribution of employment by job status and education attainment, 2004In %
Source: INE, Labour Force Survey (ENE).
Years of education
0-8 9-12 13+
All workers 30.1 44.6 25.2
By job status
Employers 14.0 34.7 51.3
Employees (non-domestic) 22.9 47.1 30.1
Unpaid family workers 40.4 46.8 12.8
Own-account workers 45.3 40.0 14.7
Domestic service workers 54.4 42.9 2.7
By occupation
Professional and technical 1.7 12.0 86.3
Office work 4.2 50.6 45.2
Management 9.0 28.2 62.9
Transport work 24.9 65.7 9.4
Sales 27.8 52.6 19.6
Skilled and semiskilled manual 35.9 53.5 10.6
Personal service work 39.4 52.7 8.0
Unskilled labourers 44.2 52.1 3.7
Farmers 70.9 26.1 3.0
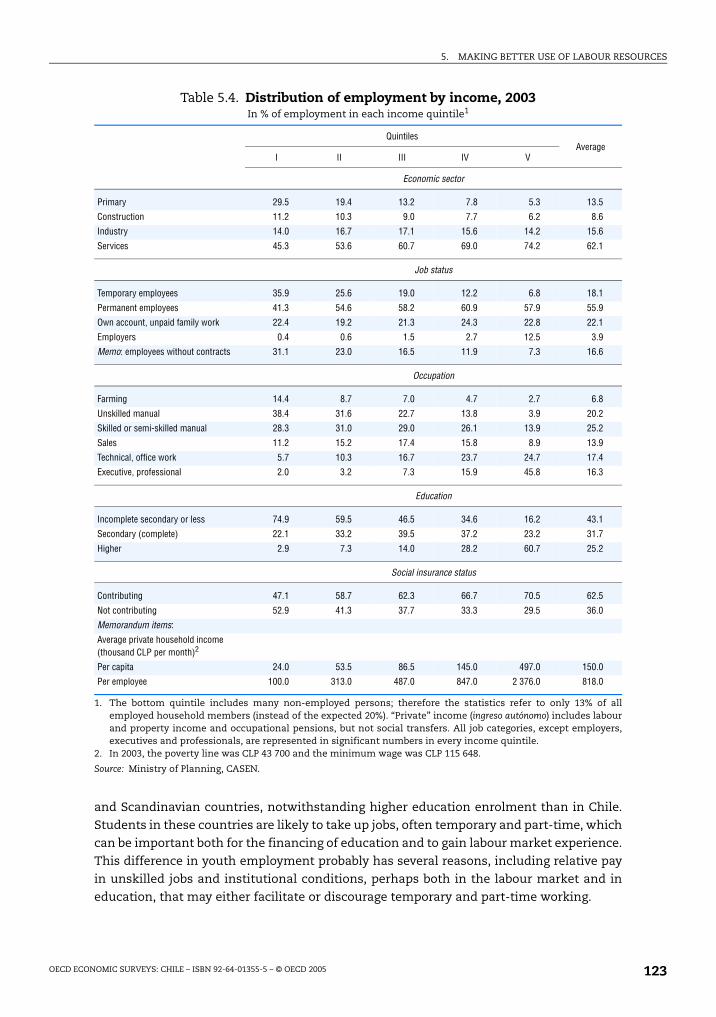
5. MAKING BETTER USE OF LABOUR RESOURCES
OECD ECONOMIC SURVEYS: CHILE – ISBN 92-64-01355-5 – © OECD 2005 123
and Scandinavian countries, notwithstanding higher education enrolment than in Chile.
Students in these countries are likely to take up jobs, often temporary and part-time, which
can be important both for the financing of education and to gain labour market experience.
This difference in youth employment probably has several reasons, including relative pay
in unskilled jobs and institutional conditions, perhaps both in the labour market and in
education, that may either facilitate or discourage temporary and part-time working.
Table 5.4. Distribution of employment by income, 2003In % of employment in each income quintile1
1. The bottom quintile includes many non-employed persons; therefore the statistics refer to only 13% of allemployed household members (instead of the expected 20%). “Private” income (ingreso autónomo) includes labourand property income and occupational pensions, but not social transfers. All job categories, except employers,executives and professionals, are represented in significant numbers in every income quintile.
2. In 2003, the poverty line was CLP 43 700 and the minimum wage was CLP 115 648.
Source: Ministry of Planning, CASEN.
QuintilesAverage
I II III IV V
Economic sector
Primary 29.5 19.4 13.2 7.8 5.3 13.5
Construction 11.2 10.3 9.0 7.7 6.2 8.6
Industry 14.0 16.7 17.1 15.6 14.2 15.6
Services 45.3 53.6 60.7 69.0 74.2 62.1
Job status
Temporary employees 35.9 25.6 19.0 12.2 6.8 18.1
Permanent employees 41.3 54.6 58.2 60.9 57.9 55.9
Own account, unpaid family work 22.4 19.2 21.3 24.3 22.8 22.1
Employers 0.4 0.6 1.5 2.7 12.5 3.9
Memo: employees without contracts 31.1 23.0 16.5 11.9 7.3 16.6
Occupation
Farming 14.4 8.7 7.0 4.7 2.7 6.8
Unskilled manual 38.4 31.6 22.7 13.8 3.9 20.2
Skilled or semi-skilled manual 28.3 31.0 29.0 26.1 13.9 25.2
Sales 11.2 15.2 17.4 15.8 8.9 13.9
Technical, office work 5.7 10.3 16.7 23.7 24.7 17.4
Executive, professional 2.0 3.2 7.3 15.9 45.8 16.3
Education
Incomplete secondary or less 74.9 59.5 46.5 34.6 16.2 43.1
Secondary (complete) 22.1 33.2 39.5 37.2 23.2 31.7
Higher 2.9 7.3 14.0 28.2 60.7 25.2
Social insurance status
Contributing 47.1 58.7 62.3 66.7 70.5 62.5
Not contributing 52.9 41.3 37.7 33.3 29.5 36.0
Memorandum items:
Average private household income (thousand CLP per month)2
Per capita 24.0 53.5 86.5 145.0 497.0 150.0
Per employee 100.0 313.0 487.0 847.0 2 376.0 818.0

5. MAKING BETTER USE OF LABOUR RESOURCES
OECD ECONOMIC SURVEYS: CHILE – ISBN 92-64-01355-5 – © OECD 2005124
Job-related training
Improvements in education attainment have made successive young cohorts
gradually better prepared not only for entering the labour market, but also for further
learning on and off the job. International experience suggests that life-long learning has
immense potential effects on productivity and labour force participation in the long term,
but it requires a complex interaction between work and learning that is difficult to achieve
unless employers and workers share a mutual interest in skill enhancement. In practice,
persons in low-skill jobs are almost everywhere among the least likely to attend adult
training. With longer initial education, young people tend to postpone their occupational
choices. Demands for vocational training are addressed increasingly to higher-education
institutions, for which a growing proportion of school leavers are eligible. Tertiary
education institutions should also be prepared to meet much of the future demand for
further education of employed adults. In addition, however, education and training policy
must take account of the needs of a large group of employed persons not eligible for higher
education.15 This group, which will remain substantial in the near future, includes many of
those at risk of unemployment.
Labour training is financed predominantly through tax relief. The main public
institution to support enterprise-level training is SENCE (Servicio Nacional de Capacitación y
Empleo), which also supervises labour offices (Box 5.2). Labour training provided by
enterprises has benefited almost 20% of all dependent employees in recent years (15% of
the employed). But SENCE has very limited control over the training it subsidises.16 It must
generally approve applications for tax deductibility if an enterprise purchases training
from an authorised provider, and also, with few exceptions, if training is provided in-house.
Enterprises are typically free to choose training content and to select trainees,
notwithstanding a possibility – foreseen in the law but rarely used – to obtain a somewhat
higher tax rebate if the training is agreed upon by a bipartite training committee at the
enterprise level. For the future, however, OECD experience suggests that a greater
involvement of workers and their associations could be a useful means of increasing
awareness of the potential benefits of better training.
Efforts are continuing to improve the quality of labour training. Responding to growing
concern about quality, the government and SENCE have gradually tightened the
requirements for accreditation of training centres (OTECs).17 A certification system has
been introduced for particular skills, now in place for installation work and tourism, for
example, but not yet for the most common occupations in industry and construction, or in
the most dynamic sectors in the economy. New legislation about skill certification is under
way but has not been approved. It has been argued that further regulation is needed,
because the market for training services is largely supply-driven. For this reason, SENCE
also seeks to play an advisory role: studies have suggested that employers are often ill-
informed about training possibilities.18
Emphasis has been placed increasingly on direct government support, rather than tax
incentives, for labour training in small enterprises. The authorities abolished the tax rebate
from March 2005 for the smallest group of firms (i.e., those with no more than about one
employee receiving the minimum wage), while making training grants available for the
self-employed and their family members. This change was motivated in large part by
concern about the risk of abuse, especially in small firms. A recent evaluation focusing on
small and micro-enterprises found that at least 15% of the supported firms engaged in
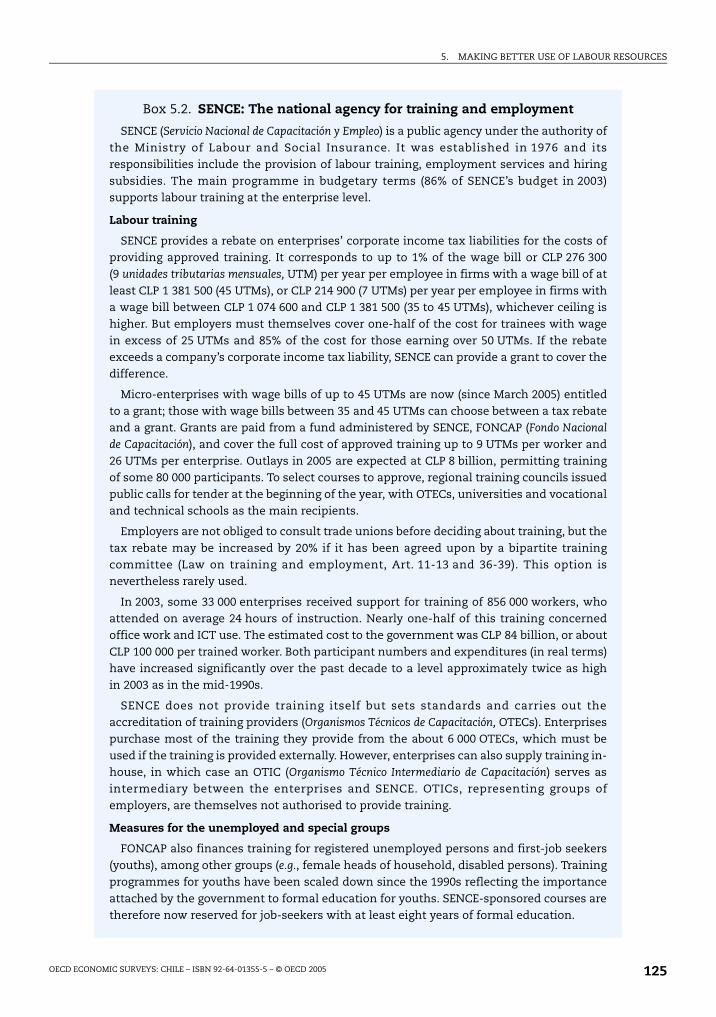
5. MAKING BETTER USE OF LABOUR RESOURCES
OECD ECONOMIC SURVEYS: CHILE – ISBN 92-64-01355-5 – © OECD 2005 125
Box 5.2. SENCE: The national agency for training and employment
SENCE (Servicio Nacional de Capacitación y Empleo) is a public agency under the authority ofthe Ministry of Labour and Social Insurance. It was established in 1976 and itsresponsibilities include the provision of labour training, employment services and hiringsubsidies. The main programme in budgetary terms (86% of SENCE’s budget in 2003)supports labour training at the enterprise level.
Labour training
SENCE provides a rebate on enterprises’ corporate income tax liabilities for the costs ofproviding approved training. It corresponds to up to 1% of the wage bill or CLP 276 300(9 unidades tributarias mensuales, UTM) per year per employee in firms with a wage bill of atleast CLP 1 381 500 (45 UTMs), or CLP 214 900 (7 UTMs) per year per employee in firms witha wage bill between CLP 1 074 600 and CLP 1 381 500 (35 to 45 UTMs), whichever ceiling ishigher. But employers must themselves cover one-half of the cost for trainees with wagein excess of 25 UTMs and 85% of the cost for those earning over 50 UTMs. If the rebateexceeds a company’s corporate income tax liability, SENCE can provide a grant to cover thedifference.
Micro-enterprises with wage bills of up to 45 UTMs are now (since March 2005) entitledto a grant; those with wage bills between 35 and 45 UTMs can choose between a tax rebateand a grant. Grants are paid from a fund administered by SENCE, FONCAP (Fondo Nacional
de Capacitación), and cover the full cost of approved training up to 9 UTMs per worker and26 UTMs per enterprise. Outlays in 2005 are expected at CLP 8 billion, permitting trainingof some 80 000 participants. To select courses to approve, regional training councils issuedpublic calls for tender at the beginning of the year, with OTECs, universities and vocationaland technical schools as the main recipients.
Employers are not obliged to consult trade unions before deciding about training, but thetax rebate may be increased by 20% if it has been agreed upon by a bipartite trainingcommittee (Law on training and employment, Art. 11-13 and 36-39). This option isnevertheless rarely used.
In 2003, some 33 000 enterprises received support for training of 856 000 workers, whoattended on average 24 hours of instruction. Nearly one-half of this training concernedoffice work and ICT use. The estimated cost to the government was CLP 84 billion, or aboutCLP 100 000 per trained worker. Both participant numbers and expenditures (in real terms)have increased significantly over the past decade to a level approximately twice as highin 2003 as in the mid-1990s.
SENCE does not provide training itself but sets standards and carries out theaccreditation of training providers (Organismos Técnicos de Capacitación, OTECs). Enterprisespurchase most of the training they provide from the about 6 000 OTECs, which must beused if the training is provided externally. However, enterprises can also supply training in-house, in which case an OTIC (Organismo Técnico Intermediario de Capacitación) serves asintermediary between the enterprises and SENCE. OTICs, representing groups ofemployers, are themselves not authorised to provide training.
Measures for the unemployed and special groups
FONCAP also finances training for registered unemployed persons and first-job seekers(youths), among other groups (e.g., female heads of household, disabled persons). Trainingprogrammes for youths have been scaled down since the 1990s reflecting the importanceattached by the government to formal education for youths. SENCE-sponsored courses aretherefore now reserved for job-seekers with at least eight years of formal education.
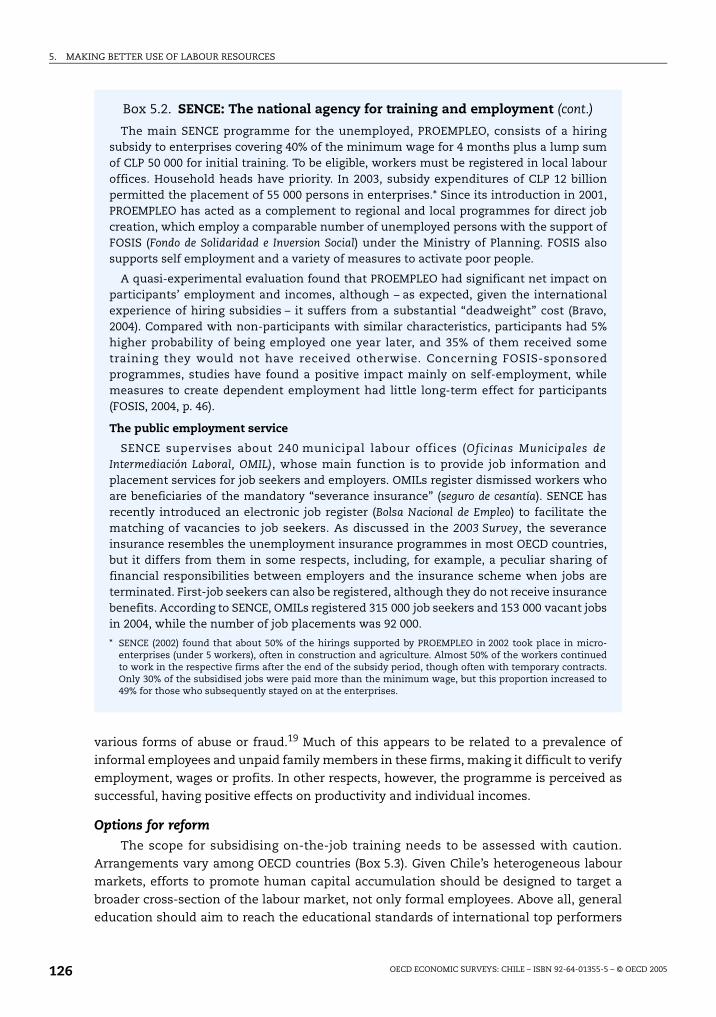
5. MAKING BETTER USE OF LABOUR RESOURCES
OECD ECONOMIC SURVEYS: CHILE – ISBN 92-64-01355-5 – © OECD 2005126
various forms of abuse or fraud.19 Much of this appears to be related to a prevalence of
informal employees and unpaid family members in these firms, making it difficult to verify
employment, wages or profits. In other respects, however, the programme is perceived as
successful, having positive effects on productivity and individual incomes.
Options for reformThe scope for subsidising on-the-job training needs to be assessed with caution.
Arrangements vary among OECD countries (Box 5.3). Given Chile’s heterogeneous labour
markets, efforts to promote human capital accumulation should be designed to target a
broader cross-section of the labour market, not only formal employees. Above all, general
education should aim to reach the educational standards of international top performers
Box 5.2. SENCE: The national agency for training and employment (cont.)
The main SENCE programme for the unemployed, PROEMPLEO, consists of a hiringsubsidy to enterprises covering 40% of the minimum wage for 4 months plus a lump sumof CLP 50 000 for initial training. To be eligible, workers must be registered in local labouroffices. Household heads have priority. In 2003, subsidy expenditures of CLP 12 billionpermitted the placement of 55 000 persons in enterprises.* Since its introduction in 2001,PROEMPLEO has acted as a complement to regional and local programmes for direct jobcreation, which employ a comparable number of unemployed persons with the support ofFOSIS (Fondo de Solidaridad e Inversion Social) under the Ministry of Planning. FOSIS alsosupports self employment and a variety of measures to activate poor people.
A quasi-experimental evaluation found that PROEMPLEO had significant net impact onparticipants’ employment and incomes, although – as expected, given the internationalexperience of hiring subsidies – it suffers from a substantial “deadweight” cost (Bravo,2004). Compared with non-participants with similar characteristics, participants had 5%higher probability of being employed one year later, and 35% of them received sometraining they would not have received otherwise. Concerning FOSIS-sponsoredprogrammes, studies have found a positive impact mainly on self-employment, whilemeasures to create dependent employment had little long-term effect for participants(FOSIS, 2004, p. 46).
The public employment service
SENCE supervises about 240 municipal labour offices (Oficinas Municipales deIntermediación Laboral, OMIL), whose main function is to provide job information andplacement services for job seekers and employers. OMILs register dismissed workers whoare beneficiaries of the mandatory “severance insurance” (seguro de cesantía). SENCE hasrecently introduced an electronic job register (Bolsa Nacional de Empleo) to facilitate thematching of vacancies to job seekers. As discussed in the 2003 Survey, the severanceinsurance resembles the unemployment insurance programmes in most OECD countries,but it differs from them in some respects, including, for example, a peculiar sharing offinancial responsibilities between employers and the insurance scheme when jobs areterminated. First-job seekers can also be registered, although they do not receive insurancebenefits. According to SENCE, OMILs registered 315 000 job seekers and 153 000 vacant jobsin 2004, while the number of job placements was 92 000.
* SENCE (2002) found that about 50% of the hirings supported by PROEMPLEO in 2002 took place in micro-enterprises (under 5 workers), often in construction and agriculture. Almost 50% of the workers continuedto work in the respective firms after the end of the subsidy period, though often with temporary contracts.Only 30% of the subsidised jobs were paid more than the minimum wage, but this proportion increased to49% for those who subsequently stayed on at the enterprises.
5. MAKING BETTER USE OF LABOUR RESOURCES
OECD ECONOMIC SURVEYS: CHILE – ISBN 92-64-01355-5 – © OECD 2005 127
Box 5.3. Encouraging labour training: The OECD experience
OECD countries have a variety of fiscal and institutional mechanisms for encouraginglabour training. There has been a gradual shift away from direct subsidies to private or publictraining providers towards service delivery co-financed by employers, employees and thegovernment. Public spending and take-up rates vary considerably across countries.
Tax rebates
Many OECD countries provide tax rebates for the costs incurred by enterprises whenproviding labour training. Some countries allow more than the full cost of training to bededucted from corporate income tax liabilities, varying from an additional 10% inLuxembourg to 20% in Austria and the Netherlands and 50% in Italy. Countries also differ inthe type of expenses that are deductible: in-house training, external training and trainees’compensation. Austria, Italy and Luxembourg allow deductions of training expenditures tobe deferred for several years to avoid the business cycle-related disincentive to invest intraining when employers expect low or negative profits. Belgium and Spain have corporatelevy/grant schemes: a training levy is imposed on all firms independently of their trainingexpenditure, after which they can recover (part of) their training costs through grants. Insome OECD countries (e.g., Denmark, Netherlands), sectoral training levies are introducedthrough branch-level collective agreements. Canada (Quebec) and France have “train or pay”schemes, requiring firms that do not invest in training to pay a training levy.
Subsidies
Most OECD countries subsidise enterprise-level training to some extent. Grant schemestend to have high administrative costs, posing a disproportionate burden on smallenterprises. The European Social Fund, for example, supplements subsidies by central andlocal governments.
Co-financing
Tax rebates and subsidy programmes may have substantial deadweight costs. “Train orpay” and levy/grant schemes may also encourage enterprises to overspend on labourtraining. Co-financing schemes therefore go some way in addressing these shortcomings.They allow the government to share the financial burden associated with labour trainingwhile creating incentives for enterprises to carefully monitor the quality of training and totailor it to the needs of their workforces.
Co-financing schemes include pay-back clauses, requiring workers to reimburse at leastpart of the training costs to the employer in the case of separation within a specific periodof time. These provisions are required by law in Luxembourg and included in individualemployment contracts in many OECD countries. Apprenticeship contracts (when payingsalaries below productivity), time accounts (i.e., conversion of overtime compensation intotraining), and company-based individual learning accounts (i.e., savings accounts for thepurpose of stimulating future training) are in place in Canada, the Netherlands, Spain(Basque region), Sweden, the United Kingdom and the United States.
Policies can also encourage the establishment of training consortia pooling resources ofmultiple enterprises. Examples are Germany, Korea and the United States. In Germany,business associations co-manage the apprenticeship system, which has contributed toraising skills and reducing youth unemployment. There are also countries (e.g., UnitedKingdom and United States) that provide loan schemes for training (guarantees,subsidisation of interest, and/or loans), tax incentives and subsidies, and possibilities ofpart-time study.
Source: OECD (2003, 2004a).
5. MAKING BETTER USE OF LABOUR RESOURCES
OECD ECONOMIC SURVEYS: CHILE – ISBN 92-64-01355-5 – © OECD 2005128
as a means of accelerating Chile’s catching up with the more prosperous countries in the
OECD area. Increasing schooling also affects the labour market, for example by delaying
youths’ entry into the labour market and by fostering higher expectations about further
learning. The need to provide a tax relief, or grants in the case of small enterprises, will
probably decline as employers and workers become more aware of the need for training. In
the present situation, however, these subsidies appear to permit SENCE to play a limited
but useful role in promoting the development of better training standards.
More can be done to improve the quality of labour training. The government’s
emphasis on quality standards is undoubtedly justified. But SENCE’s legal power to enforce
quality requirements should be more stringent, especially with respect to in-service
training in enterprises. Current efforts to improve governance and control, aimed at
preventing misuse of public funds, should be pursued. But in a long-term perspective, the
development of job-related human capital will depend more crucially on institutional
conditions in the labour market than on public subsidies.
Regional diversity and labour mobility
Trends in labour mobility
Regional labour mobility has the potential for increasing the speed of convergence in
income and living standards among the Chilean regions that is expected in the presence of
sustainable economic growth. As discussed in Chapter 1, the rate at which per capita
income in the poorer regions catches up with their more prosperous counterparts is
relatively low in Chile by international standards. This is against the background that Chile
is a highly urbanised country, as the other Southern Cone countries, and that the
population is concentrated in the main metropolitan area, Santiago, where job market
conditions are better. In particular:
About one-half of Chile’s population live in metropolitan Santiago (Región Metropolitana,
RM) and Valparaíso (V Region) (Table 5.5). This densely populated area offers a large
potential for job mobility and labour market competition that should encourage a rise in
labour force participation. But this potential is not fully exploited, as evidenced by the
fact that Valparaíso has the lowest employment-population ratio in the country and
below-average household income. The possibilities to commute to jobs are improving
gradually through the on-going upgrading of transport infrastructures, and by increasing
car ownership.20 In the rest of the country, too, most people live in cities, but their local
job markets are smaller, less diverse, and separated by relatively long distances.21
Average household incomes are comparatively high in the more urbanised areas, except
for Valparaíso. Several of the better-off regions experienced strong population growth in
the past decade, and their labour markets are dominated by services, although they also
include Antofagasta (II Region), Chile’s principal mining area. Comparatively low
incomes and high poverty rates are found in areas with higher agricultural shares in
employment (around 30% in five regions), but also in Atacama (III Region), the second
most important mining region, and in Biobío (VIII Region), which has a large and partly
environmentally problematic manufacturing sector.22 The highest poverty rate in 2003
was reported in the least industrialised region, Araucanía (IX Region), which is also
characterised by a significant representation of Chile’s largest indigenous ethnic group,
the Mapuche.
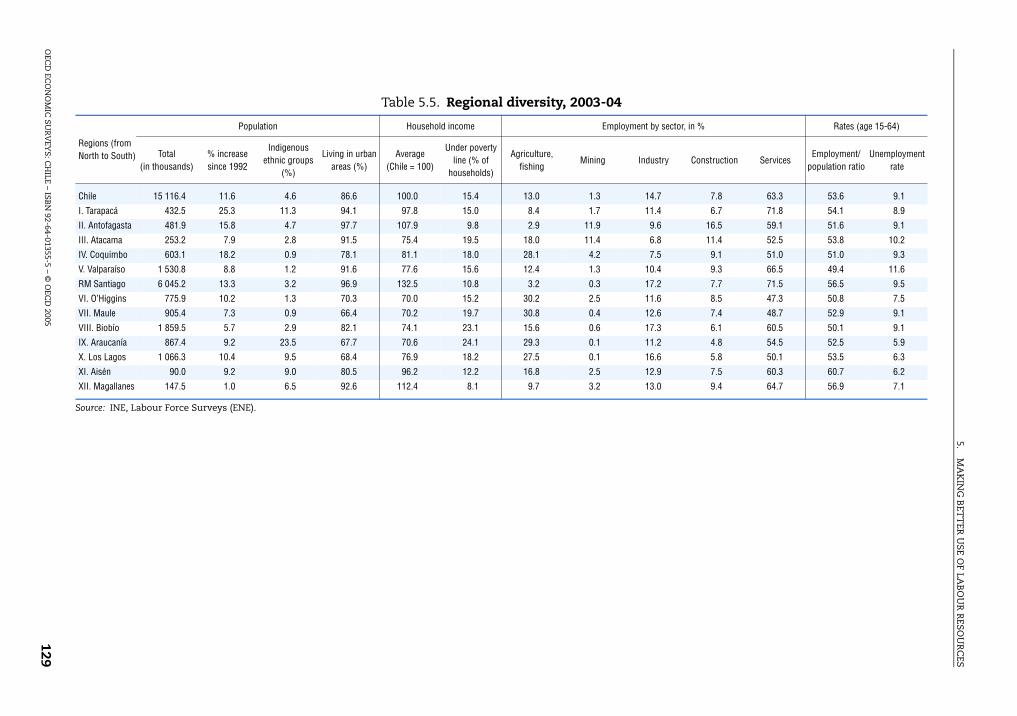
5.M
AK
ING
BET
TER
USE O
F LAB
OU
R R
ESOU
RC
ES
OEC
D EC
ON
OM
IC SU
RV
EYS
: CH
ILE – ISBN
92-64-01355-5 – © O
ECD
2005129
Table 5.5. Regional diversity, 2003-04
Source: INE, Labour Force Surveys (ENE).
Regions (from North to South)
Population Household income Employment by sector, in % Rates (age 15-64)
Total (in thousands)
% increase since 1992
Indigenous ethnic groups
(%)
Living in urban areas (%)
Average (Chile = 100)
Under poverty line (% of
households)
Agriculture, fishing
Mining Industry Construction ServicesEmployment/
population ratioUnemployment
rate
Chile 15 116.4 11.6 4.6 86.6 100.0 15.4 13.0 1.3 14.7 7.8 63.3 53.6 9.1
I. Tarapacá 432.5 25.3 11.3 94.1 97.8 15.0 8.4 1.7 11.4 6.7 71.8 54.1 8.9
II. Antofagasta 481.9 15.8 4.7 97.7 107.9 9.8 2.9 11.9 9.6 16.5 59.1 51.6 9.1
III. Atacama 253.2 7.9 2.8 91.5 75.4 19.5 18.0 11.4 6.8 11.4 52.5 53.8 10.2
IV. Coquimbo 603.1 18.2 0.9 78.1 81.1 18.0 28.1 4.2 7.5 9.1 51.0 51.0 9.3
V. Valparaíso 1 530.8 8.8 1.2 91.6 77.6 15.6 12.4 1.3 10.4 9.3 66.5 49.4 11.6
RM Santiago 6 045.2 13.3 3.2 96.9 132.5 10.8 3.2 0.3 17.2 7.7 71.5 56.5 9.5
VI. O’Higgins 775.9 10.2 1.3 70.3 70.0 15.2 30.2 2.5 11.6 8.5 47.3 50.8 7.5
VII. Maule 905.4 7.3 0.9 66.4 70.2 19.7 30.8 0.4 12.6 7.4 48.7 52.9 9.1
VIII. Biobío 1 859.5 5.7 2.9 82.1 74.1 23.1 15.6 0.6 17.3 6.1 60.5 50.1 9.1
IX. Araucanía 867.4 9.2 23.5 67.7 70.6 24.1 29.3 0.1 11.2 4.8 54.5 52.5 5.9
X. Los Lagos 1 066.3 10.4 9.5 68.4 76.9 18.2 27.5 0.1 16.6 5.8 50.1 53.5 6.3
XI. Aisén 90.0 9.2 9.0 80.5 96.2 12.2 16.8 2.5 12.9 7.5 60.3 60.7 6.2
XII. Magallanes 147.5 1.0 6.5 92.6 112.4 8.1 9.7 3.2 13.0 9.4 64.7 56.9 7.1
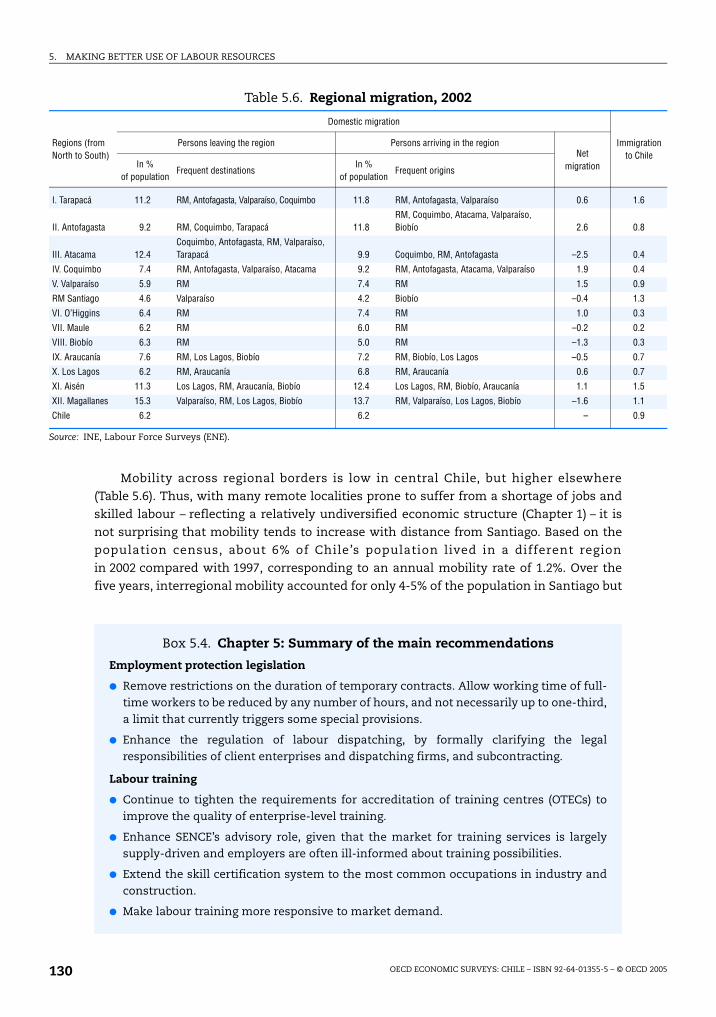
5. MAKING BETTER USE OF LABOUR RESOURCES
OECD ECONOMIC SURVEYS: CHILE – ISBN 92-64-01355-5 – © OECD 2005130
Mobility across regional borders is low in central Chile, but higher elsewhere
(Table 5.6). Thus, with many remote localities prone to suffer from a shortage of jobs and
skilled labour – reflecting a relatively undiversified economic structure (Chapter 1) – it is
not surprising that mobility tends to increase with distance from Santiago. Based on the
population census, about 6% of Chile’s population lived in a different region
in 2002 compared with 1997, corresponding to an annual mobility rate of 1.2%. Over the
five years, interregional mobility accounted for only 4-5% of the population in Santiago but
Table 5.6. Regional migration, 2002
Source: INE, Labour Force Surveys (ENE).
Regions (from North to South)
Domestic migration
Immigration to Chile
Persons leaving the region Persons arriving in the regionNet
migrationIn % of population
Frequent destinationsIn %
of populationFrequent origins
I. Tarapacá 11.2 RM, Antofagasta, Valparaíso, Coquimbo 11.8 RM, Antofagasta, Valparaíso 0.6 1.6
II. Antofagasta 9.2 RM, Coquimbo, Tarapacá 11.8RM, Coquimbo, Atacama, Valparaíso, Biobío 2.6 0.8
III. Atacama 12.4Coquimbo, Antofagasta, RM, Valparaíso, Tarapacá 9.9 Coquimbo, RM, Antofagasta –2.5 0.4
IV. Coquimbo 7.4 RM, Antofagasta, Valparaíso, Atacama 9.2 RM, Antofagasta, Atacama, Valparaíso 1.9 0.4
V. Valparaíso 5.9 RM 7.4 RM 1.5 0.9
RM Santiago 4.6 Valparaíso 4.2 Biobío –0.4 1.3
VI. O’Higgins 6.4 RM 7.4 RM 1.0 0.3
VII. Maule 6.2 RM 6.0 RM –0.2 0.2
VIII. Biobío 6.3 RM 5.0 RM –1.3 0.3
IX. Araucanía 7.6 RM, Los Lagos, Biobío 7.2 RM, Biobío, Los Lagos –0.5 0.7
X. Los Lagos 6.2 RM, Araucanía 6.8 RM, Araucanía 0.6 0.7
XI. Aisén 11.3 Los Lagos, RM, Araucanía, Biobío 12.4 Los Lagos, RM, Biobío, Araucanía 1.1 1.5
XII. Magallanes 15.3 Valparaíso, RM, Los Lagos, Biobío 13.7 RM, Valparaíso, Los Lagos, Biobío –1.6 1.1
Chile 6.2 6.2 – 0.9
Box 5.4. Chapter 5: Summary of the main recommendations
Employment protection legislation
Remove restrictions on the duration of temporary contracts. Allow working time of full-time workers to be reduced by any number of hours, and not necessarily up to one-third,a limit that currently triggers some special provisions.
Enhance the regulation of labour dispatching, by formally clarifying the legalresponsibilities of client enterprises and dispatching firms, and subcontracting.
Labour training
Continue to tighten the requirements for accreditation of training centres (OTECs) toimprove the quality of enterprise-level training.
Enhance SENCE’s advisory role, given that the market for training services is largelysupply-driven and employers are often ill-informed about training possibilities.
Extend the skill certification system to the most common occupations in industry andconstruction.
Make labour training more responsive to market demand.
5. MAKING BETTER USE OF LABOUR RESOURCES
OECD ECONOMIC SURVEYS: CHILE – ISBN 92-64-01355-5 – © OECD 2005 131
10-15% in the three northernmost and the two southernmost regions. In addition, about 1%
of the 2002 population had immigrated to Chile from other countries since 1997, with the
greatest concentrations in Santiago, the far North and the far South. Emigration from Chile
is possibly higher than immigration, but comparable data are not available.23 On average,
geographic mobility appears lower in Chile than in the United States, but on a par with
mobility between regions in the countries of the European Union.24
Options for reform
Economic growth, and the structural changes it entails, will likely be the ultimate
driving force behind a gradual integration of regional economies. Some further integration
of the labour market will also be necessary in order to reduce the disadvantages faced by
business and job seekers in most regions outside Santiago. International experience points
to the special importance of education, which can stimulate local job creation while at the
same time promoting mobility. Structural change combined with gradually better
schooling means that a growing proportion of job seekers will be looking at specialised
segments of the job market that do not exist in every locality. This will undoubtedly require
much mobility in both directions between Santiago and the rest of the country – including
not only the most distant regions, where mobility is already quite high, but all regions
including those situated near Santiago. The government also has a role to play in
promoting the infrastructure investments that will be necessary in order to expand local
labour markets where workers can commute, notably in and around the biggest cities, as
well as to facilitate mobility over longer distances.
Notes
1. As discussed in Chapter 1, it is argued that Chile’s female labour force participation is inconsistentwith the level predicted by a cross-sectional regression including as control variables otherdeterminants of participation, such as fertility rates and income distribution (Central Bank ofChile, 2005, Chapter IV; Tokman, 2005).
2. According to the population census, Chile had 15.1 million inhabitants in 2002, or almost 2 millionmore than in 1992. The population is still relatively young, with 26% aged under 15 years and only8% aged 65 years or more. The working-age population (15 to 64 years of age) was about 10 millionand is set to reach nearly 12 million by 2015.
3. These results must be interpreted with some caution because the underlying sample surveys(Encuesta Nacional de Empleo, ENE) refer to a set of population data that does not take account ofthe 2002 census. Judging from the latter, ENE overstates the total population, but it is not clear howthis may affect its estimates of other variables.
4. The income distribution is unusually skewed in Chile, Brazil and a few other Latin Americancountries, with Gini coefficients of 0.55 or more. Outside Latin America, economies at comparabledevelopment levels generally report lower coefficients.
5. Moreover, employers who cannot demonstrate economic reasons for dismissals may find itdifficult and expensive to dismiss just a few workers on individual grounds. When employersterminate indefinite contracts, they must pay relatively high severance benefits (up to 11 monthlywages). The labour legislation does not recognise “lack of skills” as a valid reason for dismissal, andunjustified dismissals can lead to additional penalties.
6. See Dirección del Trabajo (2003), for more information.
7. See Ministry of Labour (2003), for more information. No figure is provided for the number ofsubcontracted workers, but around one-half of surveyed enterprises subcontracted one or moretasks, with limited variations between sectors and regions.

5. MAKING BETTER USE OF LABOUR RESOURCES
OECD ECONOMIC SURVEYS: CHILE – ISBN 92-64-01355-5 – © OECD 2005132
8. Concerning dispatched workers, ILO (2001, p. 78) suggested that the dispatcher-client relationshipcan vary depending on the kind of work concerned. Some client firms used dispatching firms withwhich they had economic links for unspecified jobs, while independent dispatching firms wereengaged for more specialised work.
9. There is considerable cross-country variation in labour turnover, measured by hirings orseparations. Aggregate estimates from around 2000 range from 6 % per year in Japan to 40-50% inBrazil; in the United States, the separation rate was 37% in early 2004, while in European countriesit varies mostly between 10 and 25%. For more information, see the Brazilian Ministry of Labour’sRelação Annual de Informações Sociais (RAIS); US Bureau of Labor Statistics, www.bls.gov; JapanInstitute of Labour, www.jil.go.jp; OECD (1994), Chapter 5; and Gimpelson and Lippoldt (2000).
10. In contrast to labour turnover, the rates of job creation and job destruction at the enterprise levelappear to have been fairly stable during 1997-2003. In enterprises that were members of theAsociación Chilena de Seguridad (ACHS), representing 41% of all employees, the reported rates of netjob creation and net job destruction were each about 13% of employment per year in the period(Ferrada and Reinecke, 2004).
11. The reported average weekly working time was 48 hours in industry and commerce, about46.5 hours in agriculture, construction and various services and about 44.5 hours in public utilitiesand financial services. See Dirección de Trabajo (2003), for more information.
12. The proportion of enterprises operating on Sundays has increased from about 21 to 27%during 2002-04.
13. Labour Law, Art. 40bis. If a part-time employee exceeds his/her reduced work schedule, overtimepay must not be lower than the general minimum wage per hour.
14. See OECD (2004b), for more information. The average education attainment was over 13 years insix OECD countries (Australia, Denmark, Germany, Iceland, the Netherlands, and Norway), while itwas lower than in Chile in only four OECD countries (Italy, Mexico, Portugal, and Turkey).
15. According to the 2003 CASEN Survey, 43% of the employed had less than a complete secondaryeducation.
16. See the Inter-American Development Bank (2003), for more information.
17. SENCE has adopted the International Standardisation Organisation’s “ISO 9000” standardsconcerning the management of training centres, requiring, among other things, a “commitment toquality, customer focus, adequacy of its resources, and employee competence”. The possibleapplication of ISO standards for training content has also been discussed, but no decision has yetbeen made.
18. See CGP Consultores (2001), SENCE (2001) and University of Chile (2003), for more information.
19. Numerous applicants were found to simulate employment, by means of last-minute payments ofcertain taxes, for example, for unpaid family members or persons unconnected with theenterprise (University of Chile, 2003).
20. According to the 2002 census, 22% of the households had cars, up from 16% in 1992.
21. The largest urban agglomeration outside the Santiago-Valparaíso area is Concepción andneighbouring towns in coastal Biobío (VIII Region), with altogether nearly 900 000 inhabitants,while no other city has more than about 300 000 inhabitants.
22. See OECD (2005), for more information.
23. As mentioned above, the 2002 census gave a total population figure about 3% lower than expectedaccording to Chile’s official population register. While the reasons for this have not been fullyanalysed, unrecorded migration is one of several possible explanations.
24. Labour mobility is estimated at 1.2-1.4% per year in the European Union countries (Commission ofthe European communities, 2002, 2004), whereas in the United States, according to the 1995census, 44% of the population had changed place of residence since 1990. About 25% moved withincounties, 9% between counties within states, 8% between states and 2% from abroad (US CensusBureau, 2000).
5. MAKING BETTER USE OF LABOUR RESOURCES
OECD ECONOMIC SURVEYS: CHILE – ISBN 92-64-01355-5 – © OECD 2005 133
Bibliography
Central Bank of Chile (2005), Informe de Política Monetaria, May, Central Bank of Chile, Santiago.
CGP Consultores (2001), Caracterisación de las Necesidades de Capacitación Vinculadas a las Micro y PequeñasEmpresas: Resumen Ejecutivo del Estudio, CGP Consultores, Santiago.
Commission of the European Communities (2002), Commission’s Action Plan for Skills and Mobility,COM(2002)72 final, Commission of the European Communities, Brussels.
Commission of the European Communities (2004), Report on the Implementation of the Commission’sAction Plan for Skills and Mobility, COM(2004)66 final, Commission of the European Communities,Brussels.
Dirección de Trabajo (2003), Encuesta Laboral (ENCLA) 2002: Relaciones de Trabajo y Empleo en Chile, DT,Santiago.
Ferrada, C. and G. Reinecke (2004), Creación y Destrucción de Empleo en Empresas Afiliadas a la ACHS, ILO,Santiago.
Gimpelson, V. and Lippoldt, D. (2000), The Russian Labour Market: Between Transition and Turmoil,Rowman and Littlefield Publishers, Inc., Lanham, MD.
Inter-American Development Bank (2003), IPES 2004: Good Jobs Wanted: Labor Markets in Latin America,IADB, Washington, DC.
International Labour Office (2001), El Otro Trabajo. El Suministro de Personas en las Empresas, ILO,Santiago.
Ministry of Labour (2003), Encuesta Laboral (ENCLA) 2002, Ministry of Labour, Santiago.
OECD (1994), The OECD Jobs Study: Evidence and Explanations, OECD, Paris.
OECD (2003), Employment Outlook, OECD, Paris.
OECD (2004a), Employment Outlook, OECD, Paris.
OECD (2004b), Education at a Glance, OECD, Paris.
OECD (2005), OECD Environmental Performance Reviews: Chile, OECD, Paris.
SENCE (2001) Informe Final Abreviado: Estudio para Incentivar el Uso de la Franquicia Tributaria para laCapacitación en las MYPE, SENCE, Santiago.
SENCE (2002), Estudio de Impacto del Programa Proempleo Línea Bonificación para el aprendizaje. ResumenEjecutivo, SENCE, Santiago.
Tokman, A. (2005), “Participación Laboral en Chile”, Unpublished manuscript, Central Bank of Chile,Santiago.
University of Chile (2003), Evaluación de Resultado e Impacto del Programa de Capacitación Destinado a laMicro y Pequeña Empresa, Department of Economics, Santiago.
US Census Bureau, Geographical Mobility, Special Studies, www.census.gov/prod/2000pubs.

OECD PUBLICATIONS, 2, rue André-Pascal, 75775 PARIS CEDEX 16
PRINTED IN FRANCE
(10 2005 19 1 P) ISBN 92-64-01355-5 – No. 54421 2005

OECD Economic Surveys
Chile
Vo
lum
e 2
005/1
9
OE
CD
Ec
on
om
ic S
urv
eys C
HIL
E
ChileSpecial Features: Innovation; Regulatory Reform; Labour Markets
Economic SurveysMost recent editionsAustralia, February 2005Austria, July 2005Belgium, May 2005Canada, December 2004Czech Republic, January 2005Denmark, March 2005Euro area, September 2005Finland, December 2004France, September 2005Germany, September 2004Greece, September 2005Hungary, July 2005Iceland, April 2005Ireland, July 2003Italy, August 2003Japan, March 2005Korea, June 2004Luxembourg, September 2003Mexico, November 2005Netherlands, July 2004New Zealand, January 2004Norway, October 2005Poland, June 2004Portugal, November 2004Slovak Republic, September 2005Spain, April 2005Sweden, August 2005Switzerland, January 2004Turkey, December 2004United Kingdom, March 2004United States, May 2004
Non-Member EconomiesMost recent editionsBaltic States, February 2000Brazil, February 2005Bulgaria, April 1999Chile, November 2005China, September 2005Romania, October 2002Russian Federation, September 2004Slovenia, May 1997Federal Republic of Yugoslavia, January 2003
Volume 2005/19 – November 2005Supplement No. 1
ISSN 0376-6438 2005 SUBSCRIPTION
(18 ISSUES)
No
ve
mb
er 2
00
5
ISBN 92-64-01355-510 2005 19 1 P
-:HSTCQE=UVXZZV:
Subscribers to this printed periodical are entitled to free online access. If you do not yet have online access via your institution’s network, contact your librarian or, if you subscribe personally, send an e-mail to:
Volume 2005/19 – November 2005Supplement No. 1
www.oecd.org