nview nnm (v5 40) user manual- performance monitoring service kuwait/nview nnm (v5_40... · nview...
TRANSCRIPT

www.raisecom.com
NView NNM (V5_40) User Manual- Performance Monitoring Service

Legal Notices
Raisecom Technology Co., Ltd makes no warranty of any kind with regard to this manual, including, but not limited to, the implied warranties of merchantability and fitness for a particular purpose. Raisecom Technology Co., Ltd shall not be held liable for errors contained herein or direct, indirect, special, incidental or consequential damages in connection with the furnishing, performance, or use of this material.
Warranty.
A copy of the specific warranty terms applicable to your Raisecom product and replacement parts can be obtained from Service Office.
Restricted Rights Legend.
All rights are reserved. No part of this document may be photocopied, reproduced, or translated to another language without the prior written consent of Raisecom Technology Co., Ltd. The information contained in this document is subject to change without notice.
Copyright Notices.
Copyright ©2012 Raisecom. All rights reserved. No part of this publication may be excerpted, reproduced, translated or utilized in any form or by any means, electronic or mechanical, including photocopying and microfilm, without permission in Writing from Raisecom Technology Co., Ltd.
Trademark Notices
is the trademark of Raisecom Technology Co., Ltd.
Java™ is a U.S. trademark of Sun Microsystems, Inc.
Microsoft® is a U.S. registered trademark of Microsoft Corporation.
Windows NT® is a U.S. registered trademark of Microsoft Corporation.
Windows® 2000 is a U.S. registered trademark of Microsoft Corporation.
Windows® XP is a U.S. registered trademark of Microsoft Corporation.
Windows® and MS Windows® are U.S. registered trademarks of
Microsoft Corporation.

Contact Information
Technical Assistance Center
The Raisecom TAC is available to all customers who need technical assistance with a Raisecom product, technology, or, solution. You can communicate with us through the following methods:
Address: Building 2, No. 28 of the Shangdi 6th Street, Haidian District, Beijing 100085
Tel: +86-10-82883305
Fax: +86-10-82883056
World Wide Web
You can access the most current Raisecom product information on the World Wide Web at the following URL:
http://www.raisecom.com
Feedback
Comments and questions about how the NView NNM performance management monitoring service works are welcomed. Please review the FAQ in the related manual, and if your question is not covered, send email by using the following web page:
http://www.raisecom.com/en/xcontactus/contactus.htm.
If you have comments on the NView NNM performance management monitoring service specification, instead of the web page above, please send comments to:
We hope to hear from you!

CONTENTS Chapter 1 Performance Monitoring Service------------------------------------------------------ 1
1.1 Overview -------------------------------------------------------------------------------------------------------------------- 1 1.2 Functions and features ------------------------------------------------------------------------------------------------ 2 1.3 Application scenes ------------------------------------------------------------------------------------------------------ 3 1.4 Basic concepts ----------------------------------------------------------------------------------------------------------- 3 1.5 Install and upgrade ------------------------------------------------------------------------------------------------------ 4 1.6 Common operation description ------------------------------------------------------------------------------------ 5
1.6.1 Configure operation function entrance instructions ----------------------------------------------------------------------------- 5 1.6.2 Select multiple records ---------------------------------------------------------------------------------------------------------------- 6 1.6.3 Records page display control -------------------------------------------------------------------------------------------------------- 7
Chapter 2 Configure Performance Monitoring Service -------------------------------------- 8 2.1 Overview -------------------------------------------------------------------------------------------------------------------- 8 2.2 Parameters configuration --------------------------------------------------------------------------------------------- 8 2.3 Start service --------------------------------------------------------------------------------------------------------------- 9
2.3.1 Start automatically with the start of NView NNM -------------------------------------------------------------------------------- 9 2.3.2 Start through EXE executable file ------------------------------------------------------------------------------------------------- 10
2.4 Basic information ------------------------------------------------------------------------------------------------------ 10 2.5 Collection estimate---------------------------------------------------------------------------------------------------- 10
Chapter 3 Monitor Real-time Performance ----------------------------------------------------- 13 3.1 Overview ------------------------------------------------------------------------------------------------------------------ 13 3.2 Function entrance ----------------------------------------------------------------------------------------------------- 13
3.2.1 Launch from NView NNM system menu ---------------------------------------------------------------------------------------- 13 3.2.2 Launch from topology chart or topology tree ----------------------------------------------------------------------------------- 14 3.2.3 Launch from collection task management interface -------------------------------------------------------------------------- 15 3.2.4 Launch from inventory management --------------------------------------------------------------------------------------------- 15 3.2.5 Small icons in the interface --------------------------------------------------------------------------------------------------------- 16 3.2.6 Real-time performance graph toolbar -------------------------------------------------------------------------------------------- 16
3.3 Monitor real-time performance graph -------------------------------------------------------------------------- 17 3.4 Configure real-time performance graph display type ----------------------------------------------------- 19 3.5 View performance data ---------------------------------------------------------------------------------------------- 19
Chapter 4 Configure Performance Template --------------------------------------------------- 21 4.1 Overview ------------------------------------------------------------------------------------------------------------------ 21 4.2 Configure metric template group -------------------------------------------------------------------------------- 21 4.3 Configure user-defined metric template ----------------------------------------------------------------------- 23 4.4 Configure threshold template ------------------------------------------------------------------------------------- 25
4.4.1 Configure threshold template ------------------------------------------------------------------------------------------------------ 25 4.4.2 Performance threshold alarm report process ---------------------------------------------------------------------------------- 30
Chapter 5 Configure Performance Collection Task ----------------------------------------- 31 5.1 Overview ------------------------------------------------------------------------------------------------------------------ 31 5.2 Configuration process ----------------------------------------------------------------------------------------------- 31 5.3 Interface description ------------------------------------------------------------------------------------------------- 32
5.3.1 Batch tasks deployment interface ------------------------------------------------------------------------------------------------- 32 5.3.2 Single-point task interface ---------------------------------------------------------------------------------------------------------- 34 5.3.3 Small icons in the interface --------------------------------------------------------------------------------------------------------- 35
5.4 Create batch deployment task ------------------------------------------------------------------------------------ 35 5.5 Create single-point task --------------------------------------------------------------------------------------------- 41 5.6 Start collection task --------------------------------------------------------------------------------------------------- 43 5.7 Stop collection task --------------------------------------------------------------------------------------------------- 44 5.8 Manage collection task ---------------------------------------------------------------------------------------------- 44
5.8.1 Query collection task ----------------------------------------------------------------------------------------------------------------- 44 5.8.2 View collection task properties ----------------------------------------------------------------------------------------------------- 45 5.8.3 View detailed information of collection task ------------------------------------------------------------------------------------ 45 5.8.4 Modify collection task ---------------------------------------------------------------------------------------------------------------- 46 5.8.5 Delete collection task ---------------------------------------------------------------------------------------------------------------- 46 5.8.6 Refresh collection task record ----------------------------------------------------------------------------------------------------- 46
Chapter 6 Browse Historical Performance ----------------------------------------------------- 47

6.1 Overview ------------------------------------------------------------------------------------------------------------------ 47 6.2 Function entrance ----------------------------------------------------------------------------------------------------- 47 6.3 Browse historical performance graph -------------------------------------------------------------------------- 48
Appendix A Glossary -------------------------------------------------------------------------------------- 52 Appendix B Acronym -------------------------------------------------------------------------------------- 53

Preface
About This Manual
This manual introduces primary functions of the configuration management software for RC series products.
Who Should Read This Manual
This manual is a valuable reference for sales and marketing staff, after service staff and telecommunication network designers. For those who want to have an overview of the features, applications, structure and specifications of NView NNM device, this is also a recommended document.
Relevant Manuals
NView NNM (V5_40) Maintenance Guide
NView NNM (V5_40) Operation Guide
NView NNM Upgrade Guide
Organization
This manual is an introduction of the main functions of NView NNM. To have a quick grasp of the using of NView NNM, please read this manual carefully. The manual is composed of the following chapters
Chapter 1 Performance Monitoring Service
This chapter introduces performance monitoring service function and application scenes as well as installation and deployment.
Chapter 2 Configure Performance Monitoring Service
This chapter introduces performance monitoring service configuration and management.
Chapter 3 Monitor Real-time Performance
This chapter introduces the configuration method to view real-time performance graph and data when monitoring real-time performance.
Chapter 4 Configure Performance Template
This chapter introduces the configuration methods of performance template group, performance template and threshold template.
Chapter 5 Configure Performance Collection Task
This chapter introduces the methods to configure batch and single-point performance collection task.
Chapter 6 Browse Historical Performance
This chapter introduces the methods to browse historical performance graph and use data.
Appendix A Glossary
Appendix B Acronym

www.raisecom.com User Manual
1
Chapter 1 Performance Monitoring Service
This chapter introduces performance monitoring service function and application scenes as well as installation and deployment.
Overview Functions and features Application scenes Basic concepts Install and upgrade Common operation description
1.1 Overview
As NView NNM network management system performance management service module, NView NNM performance monitoring service (Short for performance monitoring service) provides performance data monitoring function based on network element performance data and faced to the network. This function helps users know the current and past load and flow conditions of the network, provides basis for fault warning and clearance as well as network optimization.
Performance monitoring service networking is shown below. In this networking, users can use various NView NNM functions to manage network element device through client side, and at the same time use performance monitoring service to monitor and collect network element performance. Each performance monitoring service can support 2000 equivalent elements at most.
Figure 1-1 Performance monitoring service networking
Performance monitoring service supports to use NView NNM setup program and NView NNM
www.raisecom.com User Manual
2
upgrade tool and upgrade packet. User can monitor the real time performance of network element device after enabling performance monitoring service. User still needs to configure performance collection task to collect the historical performance data of network element device.
Performance monitoring service supports to collect the performance index of Raisecom devices; user can also define index template to select the performance index to follow. Performance monitoring service supports to configure alarm threshold, when the collected network element device performance exceeds threshold, the alarm will be reported to NView NNM. Both the performance index and threshold support modular configuration mode to facilitate users to configure a large number of network element devices.
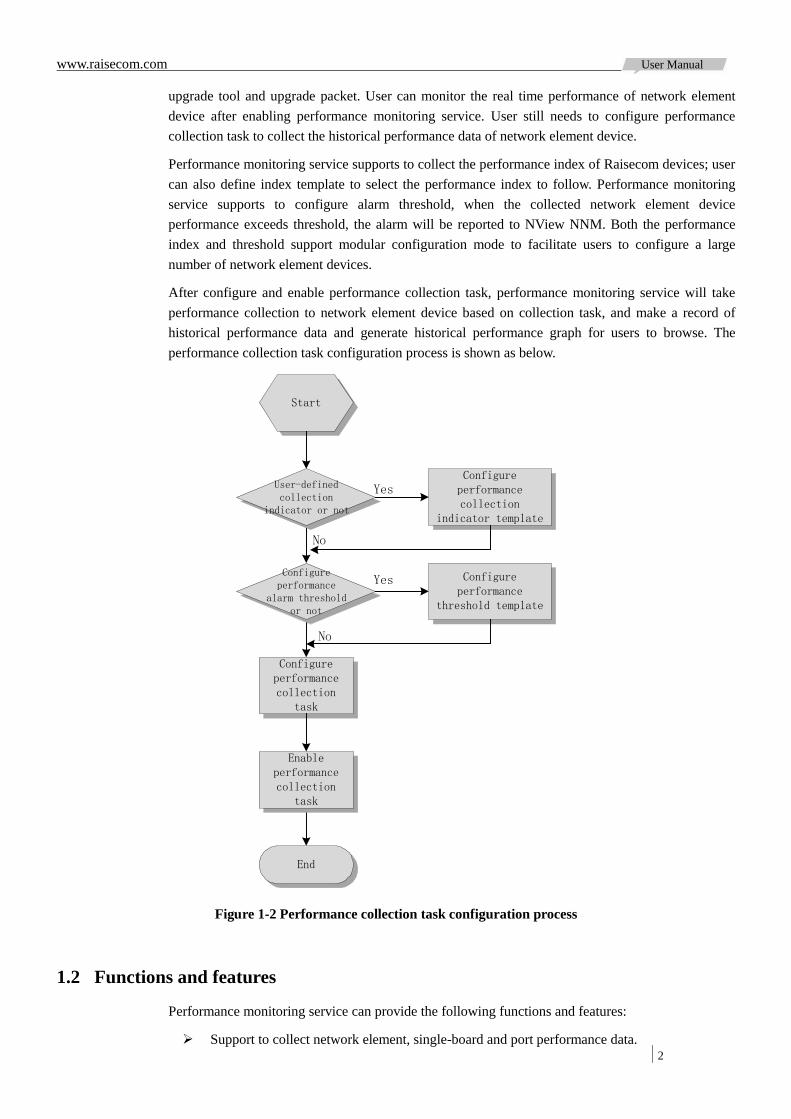
After configure and enable performance collection task, performance monitoring service will take performance collection to network element device based on collection task, and make a record of historical performance data and generate historical performance graph for users to browse. The performance collection task configuration process is shown as below.
Start
Configure performance collection
task
End
User-defined collection
indicator or not
Configure performance
alarm threshold or not
Configure performance collection
indicator template
Configure performance
threshold template
Enable performance collection
task
No
Yes
No
Yes
Figure 1-2 Performance collection task configuration process
1.2 Functions and features
Performance monitoring service can provide the following functions and features:
Support to collect network element, single-board and port performance data.

www.raisecom.com User Manual
3
Support tasking collection process and batch and single node mode to configure collection task.
Support performance data analysis and count and provide graphical performance monitoring mode for users.
Support to monitor real-time performance. User can use different real-time data collection interval (The shortest interval is 10s) to collect real-time performance data and support to view real-time performance graph and performance data.
Support to browse historical performance. Through collection task deployment, user can collect performance data periodically and continuously and store to database. Moreover, user can view multiple time dimensions (original data, hour, day, week, month and year) historical performance graph and performance data through NView NNM client.
Support the alarm based on performance threshold. When performance data exceeds threshold, it will generate performance alarm and report to NView NNM system so as the operation and maintenance staff to take action.
Support performance index template. User can filter the performance index to follow in index template and add multiple performance index templates to one performance index template group, then use performance index template group to custom-made performance index to collect in collection task creation.
Support performance threshold template. User can use performance threshold template and performance index template together to configure performance threshold in batch for multiple performance index quickly.
1.3 Application scenes
Network environment needs to ensure the normal operation of service. Monitoring and analyzing network devices connectivity, BER, traffic and other various performance data, can confirm the stability of operation and find decline of service quality before the fault occurred. Because worse service quality as a warning of the network problems, so set alarm threshold.
Performance monitoring service can be used in the following application scenarios.
In the network deployment, the performance monitoring service can take fast monitoring to the equipment performance, help maintenance staff to know the operation status and discover the operation problems in the process of equipment deployment, so as to improve the overall efficiency.
During the early time of network operation, use can find the network bottleneck through performance monitoring on key devices, which will facilitate for network optimization and guarantee the stable operation after network deployment.
In the process of network operation and maintenance, real-time performance monitoring can confirm the operation status of equipments, and historical performance monitoring is easy for statistical records based on performance threshold.
With the fast development of network services, the reasonable performance threshold setting can generate performance alarm before fault occurrence, which avoids the performance bottlenecks and facilitates network expansion in time.
When fault occurs, operation & maintenance staff will analyze the possible causes of the fault through the historical performance graph in order to remove the fault quickly.
After troubleshooting, operation & maintenance staff will confirm equipment working status through monitoring real-time performance data so as to make sure that the faults are removed completely.
1.4 Basic concepts
Performance data is the important data generated in network equipment operation. User can control the equipment running status, forecast and clear troubles through analyzing the performance data. Performance management is one of the key function modules in TMN (Telecom Management

www.raisecom.com User Manual
4
Network) theoretical models. NView NNM performance monitoring service has met the requirements of performance management.
Some basic concepts involved in system interface and configuration operation of performance component are described below:
Performance collection data: performance monitoring service collects performance data from actual device, including real-time performance data and historical performance data. Real-time performance data refers to performance monitoring service collect
performance data real-timely from network device, but not stored in database. Network management client will draw real-time performance graph according to real-time performance data in order to view the monitoring real-time performance.
Historical performance data refers to performance collection task collects historical performance data from network device and then store to database for users to view. Network management client can draw historical performance graph according to historical performance data.
Performance collection resource: various resources supporting performance management in network management system, including NE, chassis, central office board, ONU, various ports, CPU and RAM, etc. the resources have corresponding performance collection index, performance monitoring service can collect performance data to resources supporting performance management.
Performance collection index: refers to classify resource performance collection data. For example: “CPU utilization” and “Ethernet port packet loss rate” are performance collection index, corresponding to CPU and Ethernet port resource performance collection data respectively. All performance index data type, accuracy, maximum value and minimum value are depended on the actual network device, each performance management object has relevant performance collection index. User can use performance index group to filter collection index to follow.
Index group: the category of performance collection index. Each performance collection belongs to one index group. For example, “Ethernet port” is an index group, including packet loss rate (receive), unicast packets (receive), port flow (Transmit) and other index.
Performance management object: index group subset or universal set. For example: The Ethernet port of some type of device only support index group “Ethernet port” index, then the Ethernet port of this type of device corresponding performance management object are only this part of index.
Performance threshold: performance collection index threshold. When index data exceeds performance threshold, according to user configuration performance monitoring service will generate alarm and report to NView NNM network management system. User can use performance threshold template to configure performance index in batch.
Collection task: tasks performed by performance monitoring service. User configures device performance collection resource, collection time and period, index and threshold comprehensively to form collection task. The collection task is scheduled and performed by performance monitoring service and collect performance data from actual device.
Single node task: take collection configuration to the collection resource of single network element node. The single network element node supports to configure multiple collection resources and multiple performance indexes in batch in one collection task. These collection resources and performance indexes need to belong to the same performance management object.
Batch deployment task: take collection configuration to the collection resource of multiple network element nodes, supporting to configure collection task to multiple collection resources with the same performance management object in batch.
1.5 Install and upgrade
Performance monitoring service needs to cooperate with NView NNM for use。
For V5.3 and above kernel version, user can use V5.4 upgrade bag to upgrade NView NNM, the performance monitoring service will be upgraded at the same time.

www.raisecom.com User Manual
5
For V5.3 below kernel version, user needs to upgrade NView NNM to V5.3 kernel version first, and then upgrade it to V5.4; the performance monitoring service will be upgraded correspondingly.
For new installation, NView NNM only adopts NView NNM installation process and upgrade package to take upgrade and installation. After NView NNM is upgraded, performance monitoring service also completes upgrade and no longer requires a separate upgrade or installation.
Note: Currently, performance monitoring service is no longer support of distributed performance deployment. V5.4 kernel version has already centralized deployed performance monitoring service and does not need to take separate installation and upgrade. The original distributed performance deployment, please contact technical support personnel.
Performance monitoring service upgrade and installation steps are as below:
Step 1 Launch upgrade tool. Double-click desktop shortcut "Start Upgrade Tool" or double-click RunUpgrade.exe. RunUpgrade.exe file default directory is C:\NMS\PLATFORM\um\utool\. The start operation is completed until the current version information bar displays current version information.
Step 2 Click <Please Specify Upgrade Package> button, select local upgrade packet file in the pop-up [Select] dialog box; click <Please Specify Backup Directory> button, specify backup directory in the pop-up [Select] dialog box.
Step 3 Click <Detect> button, system update manager will detect upgrade package automatically.
Note: The detection process will detect upgrade version tool, which will upgrade automatically if the version is too low. After the automatic upgrade, it will pop up successful upgrade prompt, click <OK> and then restart upgrade tool to perform upgrade operation.
Step 4 Prompt message box shows that the detection is complete, click <Backup> button. Input backup abbreviation and description information in the pop-up edit backup information interface.
Step 5 Click <Save> button to start the backup. When prompt message box displays success message, the backup is successful.
Step 6 Click <Upgrade> button to begin the upgrade. In upgrade process, the prompt message box will display relevant information, after the successful upgrade prompt, upgrade operation is complete.
Step 7 After the upgrade is complete, click <Close> button to exit Update Manager.
Please refer to NView NNM Upgrade Guide for upgrade details of NView upgrade management tools with upgrade package.
1.6 Common operation description
1.6.1 Configure operation function entrance instructions The configuration operation described in this manual is generally launched by right key shortcut menu, the interface provides function menu and toolbar button at the same time. The configuration operation performed by right key shortcut menu, function menu and toolbar button are the same. Function menu and toolbar interfaces are shown as figure 1-3, the specific operation is shown in table 1-1.

www.raisecom.com User Manual
6
Figure 1-3 Function menu and toolbar interfaces
Note: According to whether to select a record, or whether to select multiple records, the operation has some restrictions, and the restricted operation menu and button will be gray, which indicates it cannot take the appropriate operation. For example, if not select any record, it cannot perform modification, queries and other operations.
Table 1-1 Common configuration operation function entrance
Configuration operation Right key shortcut menu Function menu Toolbar button
Show property information [Property] [Operation/Property]
Query record [Query] [Operation/Query]
Refresh record [Refresh/Refresh in Conditions] (If it is the query record, refresh
according to query conditions; otherwise, the function is the same
with [Refresh/Refresh All] )
[Refresh/Refresh All]
[Operation/Refresh/Refresh in Conditions]
[Operation/Refresh/Refresh All]
Export record to local file [Export/All items /To Excel file]
[Export/All items /To Text file]
[Export/Current Page/To Excel File]
[Export/Current Page/To Text File]
[Export/Option/To Excel File]
[Export/Option/To Text File]
[Operation/ Export/All items /To Excel file]
[Operation/ Export/All items /To Text file]
[Operation/ Export/Current Page/To Excel file]
[Operation/ Export/Current Page/To Text file]
[Operation/ Export/Option/To Excel file]
[Operation/ Export/Option/To Text file]
Add record [Add] [Operation/Add]
Modify record [Modify] [Operation/Modify]
Delete record [Delete] [Operation/Delete]
Show details [Details] [Operation/Details]
1.6.2 Select multiple records In the record list, to select multiple records can take batch delete or export the selected records. User can select multiple records in accordance with the following methods.

www.raisecom.com User Manual
7
Select multiple consecutive records: Click on a record, do not release the left mouse button and drag up or down; or click on a record, press Shift key and click again to a record, select all records in the middle of the two records.
Select multiple inconsecutive records: Press Ctrl key, click to select multiple records.
1.6.3 Records page display control The records are usually shown in interface in the form of paging; the page display control button in toolbar provides page size configuration, page navigation and statistics record functions, as shown in table 1-2.
Table 1-2 Page display control function
Toolbar button Function description
Configure one page to show the maximum records
Show the first page record
Show the previous page record
Show the next page record
Show the last page record
Go to specified page, input page number and click Enter key
Show all records

www.raisecom.com User Manual
8
Chapter 2 Configure Performance Monitoring Service
This chapter introduces performance monitoring service configuration and management.
Overview Parameters configuration Start service Basic information Collection estimate
2.1 Overview
Performance monitoring service communicates with devices through SNMP protocol to collect performance data, analyze performance data and draw performance graph.
To start performance monitoring service can monitor real-time performance, view real-time performance graph. If users want to collect historical performance data and view historical performance graph, they also need to configure performance collection task.
Performance monitoring service supports to view basic information and collection estimate.
Basic information displays performance monitoring service name, IP address, service status and description. The basic information is automatically generated, which does not support to modify.
The collection estimate supports to assess the collection situation of performance collection task as well as data list and chart.
Performance monitoring service interface is divided into three parts:
Performance monitoring service selection area: in the upper left side of the interface, displaying each performance monitoring service in the form of “Computer name _ Performance monitoring service”.
Management function area: in the lower left side of the interface, including basic information and collection estimate.
Display relevant information: in the right side of the interface, displaying the appropriate information according to the selected service and management function. By default, it displays the basic information of selected probe.
2.2 Parameters configuration
Parameters configuration of performance monitoring service is shown as below:
Parameter configuration for real-time performance graph (optional)
Real-time performance graph parameters can adjust the last time and interval of real performance collection, unit at seconds. The parameters generally do not need to modify. By default, real-time performance collection interval is "10s, 20s, 30s, 60s, and 120s", the last time is 1800s (if modified, the value of LastingSpanList (used to control real-time collection lasting time) and StoringSpanList (used to configure performance graph x-coordinate length) needs to maintain consistent). The location of configuration file is in the installation path of NView NNM client:

www.raisecom.com User Manual
9
\NMS\PLATFORM\NNM5\client\config\pm\perfmconf.xml, which can be modified by “Text” file, as shown below.
Figure 2-1 Modify real-time collection interval and lasting time
2.3 Start service
NView NNM provides system monitoring function, which can start performance monitoring service through system monitoring client. The performance monitoring service supports to start through system monitoring and also supports to start performance monitoring service manually through EXE executable file. After manual start of performance monitoring service, system monitoring can manage performance monitoring service.
2.3.1 Start automatically with the start of NView NNM After performance monitoring service is configured to start automatically, user just needs to double-click “Network management server” to start performance monitoring service. User can also manually start/stop performance monitoring service in NMS system monitoring client.
Step 1 In NView NNM host operation system, double-click the shortcut “Network management server” on the desktop to start NView NNM network management software.
Step 2 After the network management server start is complete, it will pop up start successful dialog box, that prompts “The network management server (NMSServer) has successfully started, click <OK>.
Step 3 In NView NNM host operation system, double-click the shortcut “System monitoring client” on the desktop to start system monitoring client.
Step 4 Input system monitoring username and password in the login screen, and then click <OK> to enter system monitoring client.
Step 5 View “Platform service” operation status in “Process monitoring” tab page to make sure the operation status is “In service”, which indicates NView NNM platform service has been started completely.
Note: “Platform service” start mode is “Auto” by default, which means that after NView NNM is started, the “Platform service” will be started automatically.
Step 6 In “Process monitoring” tab page, right-click “performance monitoring service” records, and then click [Set the Start Mode/Auto] in shortcut menu to configure performance monitoring service auto start with NView NNM.

www.raisecom.com User Manual
10
Step 7 (Optional) When performance monitoring service status is "Stopped", right-click “performance monitoring service” records, and then click [Start Service] in shortcut menu to start performance monitoring service manually.
Step 8 (Optional) When performance monitoring service status is “In service”, right-click “performance monitoring service” records, and then click [Stop Service] in shortcut menu to stop performance monitoring service manually.
2.3.2 Start through EXE executable file The default installation folder path for performance monitoring procedures is “C:\the NMS\PLATFORM\NNM5\pm1000”, double-click “Perfmonitor.exe” file in the folder to start performance monitoring service.
Note: Before starting performance monitoring service, please start NView NNM network management server at first.
2.4 Basic information
Please voew the basic information of performance monitoring service as follows:
Click NView NNM system menu [Performance/Performance Monitoring Service Management]
Click “Basic Info” in the below left function tree, the right interface will show the specific basic information, as shown below.
Parameter Value Description
Name Parameter form is “Computer
name_Performance monitoring service”
Show service name.
Right-click “My computer”, click “Property”, the computer name can be configured in “Computer
name” tab page by click <Modify>, then restart the computer.
IP Dotted decimal IP address Show performance monitoring service IP address.
Description - Show performance monitoring service description.
Status Start
Stop
Show performance monitoring service status.
Only start performance monitoring service, the performance management functions can be used.
2.5 Collection estimate
Collection estimate shows performance monitoring service collection time length and monitoring service load data by color, load data interface is shown in figure 2-2. Performance server can take statistics to the analysis file generated in device performance data collection, generate monitoring service load data and provide load chart.

www.raisecom.com User Manual
11
Figure 2-2 Collection estimate interface
Collection estimate in upside area: record and analyze collection task execution process status attribute information, including the number of network elements collected, the maximum elapsed time (seconds) (collection task can contains multiple devices; the maximum elapsed time refers to the longest collection operation time in all devices collection tasks), the minimum elapsed time (seconds), total time (seconds), start time, end time, load ratio (the difference between end and start time divides by the total elapsed time).
Collection estimate in downside area: show collection failure information, including network element ID, network element IP, reasons for failure, number of failures. When the collection estimate records show red, user needs to pay attention to whether the number of failures is too many. Too many times failures will make estimate records show red, but the collection load is not really too big, please check the network element device with collection failure.
Note: Error log information is not to be shown automatically, but needs collection estimate upside area to choose to perform the collection task, and the error log information can be shown only in the execution process of collection task.
Please view performance monitoring service collection estimate according to the following steps:
Step 1 View collection estimate data sheet.
Click NView NNM system menu [Performance/Performance Monitoring Service Management].
In the bottom left of function tree, click “Collection estimate”, and the right interface will show the collection estimate data sheet in latest day.
Select query time range and then click <Query> to show estimate data in time range. Click to select a piece of estimate data, the below interface will show collection failure
information. According to collection task execution time, make sure the color of collection task, as shown in the table below.
Total collection time Color Description
0s~200s Green Monitoring service load is normal
200s~250s Yellow Monitoring service load is heavier

www.raisecom.com User Manual
12
Total collection time Color Description
250s and above Red Monitoring service load is too large; it is recommended to increase performance monitoring
service through distributed deployment
Step 2 View collection load chart.
Click “Load Chart” tab, the interface will display collection time chart in the right side. (Optional) Click "Load Data" tab, select time range to query, click <Query> to configure
chart to display the time range. (Optional) Click chart tool button to save/print an image, or to switch the chart display mode,
the button's function is shown in the following table.
Button Icon Description
Save graphics Save current graphics to local
Print graphics Print current graphics
Line chart Show collection estimate line chart
Area chart Show collection estimate area chart
Histogram Show collection estimate histogram

www.raisecom.com User Manual
13
Chapter 3 Monitor Real-time Performance
This chapter introduces the configuration method to view real-time performance graph and data when monitoring real-time performance.
Overview Function entrance Monitor real-time performance graph Configure real-time performance graph display type View performance data
3.1 Overview
Real-time performance monitoring of network devices is an important means to learn device operating and service status. To view performance data from the command line, the performance data refers to performance value at some time or time slot, which is not intuitive to operate, but more cumbersome.
The real-time performance graph function provided by performance monitoring service can make performance data graphical, draw performance graph automatically based on real-time performance data, and display the real-time status of device performance data clearly and intuitively. Moreover, User can select to view different network element device easily in real-time performance graph monitoring.
After NView NNM platform service and performance monitoring service are started, user can take real-time performance monitoring through NView NNM client.
3.2 Function entrance
To monitor real-time performance graph supports four function entrances for users to select:
In performance monitoring service performance graph, select a single network element to monitor. This way can easily switch network element to select in the network.
In topology chart or topology tree, select a single network element to monitor. This way can only monitor the selected network element.
In performance collection task management interface, select a single task to monitor. This way can only monitor performance resources configured in collection task.
In inventory management, select the records of a single network element to monitor. This way can only monitor the selected network element.
3.2.1 Launch from NView NNM system menu Please launch performance monitoring service performance graph function from NView NNM system menu according to the following steps.
Click NView NNM system menu [Performance/Performance Graph] to open performance graph interface.

www.raisecom.com User Manual
14
In the left side device list, click to choose the network element to monitor real-time performance, the right side will show the network element performance collection resource.
Click “Real-time performance graph” tab to display real-time performance graph interface. Click to select the resource, the right interface will show resource-related performance
metrics. The performance resource to choose can only be the same types of resources. For example, “Ethernet” and “SDH15 minutes multiplex section” are different resource types; user can select multiple resources in the same resource type.
Click to select performance metric, the right interface will show initial status of performance graph, as shown in Figure 3-1.
Figure 3-1 Real-time performance graph interface
3.2.2 Launch from topology chart or topology tree Please launch performance monitoring service performance graph function from topology chart or topology tree according to the following steps.
Right-click network element in topology chart or topology tree, and then click [Performance Management/Performance Graph] in shortcut menu to open performance graph interface
Click to select the resource, the right interface will show resource-related performance metrics. The performance resource to choose can only be the same types of resources. For example, “Ethernet” and “SDH15 minutes multiplex section” are different resource types; user can select multiple resources in the same resource type.
Click “Real-time performance graph” tab to show real-time performance graph interface. Click to select performance metric, the right interface will show initial status of performance
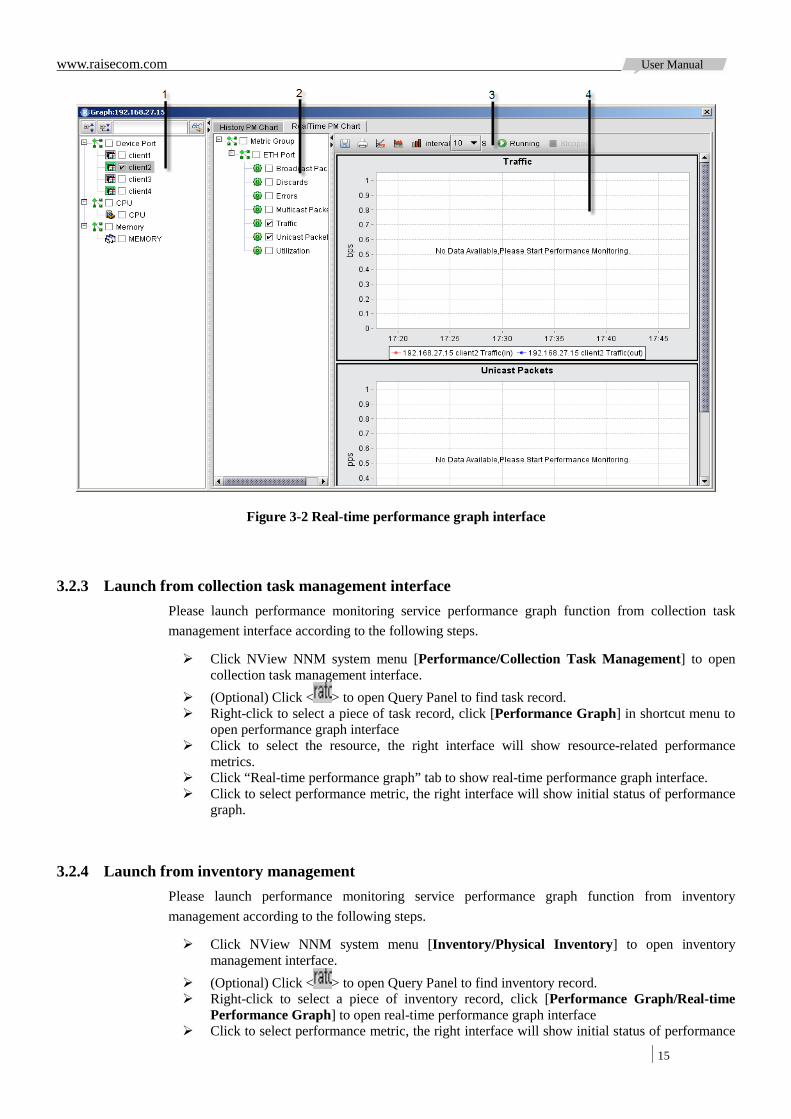
graph, as shown in Figure 3-2.
www.raisecom.com User Manual
15
Figure 3-2 Real-time performance graph interface
3.2.3 Launch from collection task management interface Please launch performance monitoring service performance graph function from collection task management interface according to the following steps.
Click NView NNM system menu [Performance/Collection Task Management] to open collection task management interface.
(Optional) Click < > to open Query Panel to find task record. Right-click to select a piece of task record, click [Performance Graph] in shortcut menu to
open performance graph interface Click to select the resource, the right interface will show resource-related performance
metrics. Click “Real-time performance graph” tab to show real-time performance graph interface. Click to select performance metric, the right interface will show initial status of performance
graph.
3.2.4 Launch from inventory management Please launch performance monitoring service performance graph function from inventory management according to the following steps.
Click NView NNM system menu [Inventory/Physical Inventory] to open inventory management interface.
(Optional) Click < > to open Query Panel to find inventory record. Right-click to select a piece of inventory record, click [Performance Graph/Real-time
Performance Graph] to open real-time performance graph interface Click to select performance metric, the right interface will show initial status of performance

www.raisecom.com User Manual
16
graph.
3.2.5 Small icons in the interface The small icons description in device list:
Table 3-1 Icon description in device list
Icon Description
Network element device
Deploy performance collection task network element device
Network element device is offline
Deploy performance collection task network element device offline
The small icons description in collection resource object list:
Table 3-2 Collection resource icons description
Icon Description
Resource classification, which contains one or more resources, select/cancel resource classification can select/cancel all
resources under this classification at the same time.
The resource is online and no collection.
The resource is offline and no collection.
The resource is online and has configured collection task.
The resource is offline and has configured collection task.
The small icons description in performance metric list:
Table 3-3 Performance metric icons description
Icon Description
Collection metric group, which contains one or more metrics, select/cancel metric group can select/cancel all
metrics under this group at the same time.
Collection metric
3.2.6 Real-time performance graph toolbar The small icons description in real-time performance graph toolbar:
Table 3-4 Real-time performance graph toolbar function button description

www.raisecom.com User Manual
17
Button Icon Description
Save graphics Save current graphics to local
Print graphics Print current graphics
Line chart Show collection estimate line chart
Area chart Show collection estimate area chart
Histogram Show collection estimate histogram
Interval
Configure real-time performance collection interval, unit: s, supporting the following intervals:
10
20
30
60
120
Collection interval refers to the interface to collect performance data by performance monitoring service
to network element. Performance graph can also collect interval as x-coordinate axis to draw
performance graph.
Start
Start to draw real-time performance graph
User cannot modify collection interval when real-time performance graph is started.
Stop
Stop to draw real-time performance graph
3.3 Monitor real-time performance graph
To monitor real-time performance graph can grasp the device real-time operating performance status, open performance graph interface, please monitor real-time performance graph according to the following steps:
Step 1 (Optional) Query network element, which only applies to launch performance graph from system menu. Input query information in the above of network element list, click <Query> to filter network element list. It is “and” relationship in query parameters, that is to filter network element meeting all input query conditions. The query parameters are shown as below. (User cannot query and select network element when to launch performance monitoring service from topology figure and topology tree.)
Parameter Description
Device name Query network element device name.
Device name refers to network element name, right-click network element, and click <View Property> in shortcut menu to view
network element name.

www.raisecom.com User Manual
18
Parameter Description
Subnet name Query network element located subnet.
Click< > to pop up “Select subnet” dialog box, click to select the subnet to query, and then click <OK>. “Select subnet” dialog box can provide search function, input subnet name and then click
< > to search subnet meeting the query conditions.
Device IP Query network element IP address.
Format: dotted decimal IP address.
Device purpose Query network element device purpose.
The default device purpose is “Unspecified”, including the following options:
Blank, not query device purpose.
Unspecified
Common user access
Key account access
Community aggregation
Bureau station aggregation
Relay transmission
Right-click network element, and click <View Property> in shortcut menu to view the purpose.
Step 2 Click to select real-time performance network element to monitor in the left device list, the right interface will show network element performance collection resource. This step is only available to launch performance graph from system menu.
Step 3 Select resources according to resource type and slot. User can only select resource in the same resource type, the same type of resource support to select 5 resources at most. Click to select resource type and slot classification, and all resources in this classification will be selected.
Step 4 Click “Real-time performance graph” tab in the right after selecting resource to show performance metrics and real-time performance graph interface.
Step 5 Select performance metrics accordance to metrics group, supporting to select multiple performance metrics; each performance metric shows one performance graph. Multiple resources will be distinguished in different colors in the same performance graph.
Step 6 (Optional) Click < > drop-down list to configure real-time collection interval.
Step 7 Click <Start> to draw real-time performance graph for monitoring.
Step 8 (Optional) Click <Stop> to stop real-time performance collection and stop drawing performance graph.
Step 9 (Optional) Save and print the performance graph. Right click performance graph, and then click [Save] or [Print] in the shortcut menu to save performance graph to local file or print performance graph by the printer.
Note:
The one-time continuous collection time for real-time performance graph is fixed at 30

www.raisecom.com User Manual
19
minutes, and the real-time performance will stop automatically after 30 minutes. User can select network element device, resources, and metrics in the collection process;
however, once the selection is modified, real-time performance graph will be stopped and restarted.
Each metric can be drawn to one performance graph; in the same performance graph, multiple resources will be shown in different colors.
Figure 3-3 is an instance of performance graph, which shows to monitor 192.168.18.2 network element device resources port 1. The performance metric to monitor is unicast packets. This figure distinguishes Tx/Rx unicast packets in different colors.
Figure 3-3 Performance graph instance
3.4 Configure real-time performance graph display type
In real-time performance graph collection and drawing process, or after the drawing of real-time performance graph, user can modify performance graph display type.
Click < >, < >, < > in real-time chart toolbar to switch real-time performance graph display type to line chart, area chart and histogram.
3.5 View performance data
In real-time/historical performance graph collection and drawing process, or after the drawing of real-time performance graph, user can view performance data.
Right-click a performance graph and click <View Performance Data> in shortcut menu to open performance data dialog box and view performance data list, as shown in Figure 3-4. Click <Save to Excel> to export performance data to local file.

www.raisecom.com User Manual
20
Figure 3-4 View performance data
Performance data can display the standard unit prefix, which are the symbols composed of multiple units (decimal or fractional units), such as G (Giga), k (Kilo) and so on. If collection performance data fails, record as “NaN”.
Table 3-5 Prefix Description of performance data
Name of unite prefix Factor Symbol
Giga 109 G
Mega 106 M
Kilo 103 k
Centi 10-2 c
Milli 10-3 m
www.raisecom.com User Manual
21
Chapter 4 Configure Performance Template
This chapter introduces the configuration methods of performance template group, performance template and threshold template.
Overview Configure metric template group Configure user-defined metric template Configure threshold template
4.1 Overview
There are so many device and port resources in network, and the resources often support multiple performance collection metrics and performance threshold. For the refined port-level performance collection, how to provide a convenient and rational configuration method is very necessary.
User can select performance metrics and threshold template easily in collection task configuration process to improve configuration efficiency. If templates used in collection task need unify modification, user can stop collection task to modify the templates, and then restart collection task to take performance collection and threshold monitoring according to the modified template.
Performance monitoring task template supports the following features:
Support metric template group function: the metric template group can contain multiple metrics templates, users can define metric template group to facilitate to classify and view.
Support metric template function: metric template contains the related performance metrics, user can define metric template and filter performance metric to pay attention to. Performance template function can make performance metric template, provide multiple templates based on network element device or port types, and basically meet performance monitoring configuration requirements. The operation and maintenance can also define metric template to performance metric to pay attention to.
Support threshold template function: performance threshold template refers to configure performance metric alarm threshold in template based on performance metrics template. The alarm threshold is divided into upper threshold and lower threshold, each can be configured to emergency, major, minor, and prompt alarm levels respectively, and at the same time can configure whether to report alarm to NView NNM when performance metric exceeds the threshold.
Note:
The performance monitoring service provides system default performance metrics template and template group, but not provide default performance threshold template.
If not need user-defined metric template, user can use the system default metric template to configure collection task directly.
If need to configure performance alarm threshold, please configure threshold template and then configure collection task.
4.2 Configure metric template group
The performance monitoring service provides system default template group “system metric
www.raisecom.com User Manual
22
template group”, including all system default metric templates, which cannot be modify and delete. If there is metric template in metric template group, the metric template group cannot be deleted.
To configure metric template group refers to classify metric templates; in the process to configure metric template group, it will prompt whether user needs to create metric template and threshold template.
Step 1 Create user-defined metric template group.
In NView NNM system menu, click [Performance/Template Management/Metrics Template Group Management] to open metric template group list interface.
Right-click in the list interface, click [Add] in shortcut menu to pop up metric template group dialog box; the parameters are shown in the table below.
After configuration, click <OK> to complete the creation.
Parameters Description
Template group name Configure template group name, which cannot be repeated
and has 50 characters at most.
Template group description Configure template group description information.
System default “No” metrics that it is not system default template group.
Step 2 (Optional) configure to create user-defined metric template and threshold template to template group.
After creating metric template group, it will pop up confirmation dialog box, prompting that “The operation is successful! Add metric template in this metric template group?”
Click <Yes> to open add metrics template interface; please refer to 4.3 Configure user-defined metrics template for the configuration method; or click <No> to close the prompt.
After configuring user-defined metrics template, click <OK> to complete the creation and pop up confirmation dialog box, prompting “The operation is successful! Add threshold template in this metric template?”
Click <Yes> to open add threshold template interface; please refer to 4.4 Configure threshold template for the configuration method; or click <No> to close the prompt.
Note: User-defined metric template or performance threshold template can also be configured after creating template group.
Step 3 View the properties information of template group.
Right-click to select a piece of template group record in list interface Click [Properties] in shortcut menu to pop up properties panel and show template group
name, description and status information. Or click [Details] in shortcut menu to pop up detailed information interface and show template group name, description and status information.
Step 4 (Optional) Modify the properties information of template group.
Right-click to select a piece of template group record in list interface Click <Modify> in shortcut menu to pop up Modify dialog box, user can modify template
group name and description information.
Step 5 (Optional) Delete template group.
Right-click to select a piece of template group record in list interface Click <Delete> in shortcut menu to pop up Delete dialog box, user can delete template group
here. If there is metric template in metric template group, this metric template group doesn’t support to delete and it will pop up delete error prompt.

www.raisecom.com User Manual
23
4.3 Configure user-defined metric template
The performance monitoring service provides a rich system default metric template; the default metric template contains all performance metrics. If users only need to focus on some certain metrics, they can define metrics template.
The system default template only supports to view performance metrics and properties information in template, but not support to modify and delete. User-defined metric template support to modify and delete, but has the following constraints.
If the collection task with user-defined template is started, user cannot modify and delete user-defined template.
If the collection task with user-defined template is stopped, user can modify user-defined template and after restarting collection task, performance monitoring service will take collection in accordance with the modified metric template.
The metric template used by collection task doesn’t support to delete, please make sure whether need to delete the used metric template collection task; Only when all collection tasks with this template are deleted, the user-defined metric template can be deleted.
Note:
Collection task configuration needs to select the device or port resources; user needs to consider whether the template metrics are suitable to the actual situation of device in user-defined metric template. Although user can specify any metrics in the template, but only the templates in line with the device or port resources can be selected to take collection task, and the template metrics not matching actual performance resources cannot perform collection operation. For example:
Ethernet port metrics group can be divided into “Ethernet port”, “Ethernet port (ISCOM5108ETHPORT)” and “Ethernet port (DLCOMETHPORT)” metric groups according to the type of device. User needs to select metrics in “Ethernet port (ISCOM5108ETHPORT)” to define metric template for ISCOM5108.
To configure collection task for Ethernet port, user only needs to select the template including “Ethernet port” performance metrics.
Step 1 Create user-defined metric template.
In NView NNM system menu, click [Performance/Template Management/Metrics Template Management] to open metric template list interface.
Right-click in the list interface, click [Add] in shortcut menu to pop up metric template dialog box; the interface and parameters are shown as below.
After configuration, click <OK> to complete the creation.

www.raisecom.com User Manual
24
Figure 4-1 Create metric template
Table 4-1 Create metric template interface parameters
Parameters Description
Name Configure template name, which cannot be repeated.
Subordinate metric group Configure template subordinated template group.
Description Configure template description information.
System default Show whether it is system default. The system default template doesn’t support to modify and delete.
Search performance metric group/metrics
Input search keyword, click < > to search performance metric group/metric.
Left metric group/metrics classification
Select performance metric to add to the template.
Click to select metric group and all metrics in this metric group will be selected automatically.
Add Configure performance metrics in metric template.
Remove the added performance metric to right list from left list.

www.raisecom.com User Manual
25
Delete Delete performance metric from the selected metric template.
Remove the deleted performance metric to left list from right list.
Right metric group/metrics classification
Select performance metric to delete from template.
Click to select metric group and all metrics in this metric group will be selected automatically.
Step 2 View the performance metrics in template.
Right-click to select a piece of template record in list interface Click [Details] in shortcut menu to pop up detailed information interface and show template
name, description and system default template or not and other basic information. At the same time, the right panel of performance metric below the interface will show performance metric in this template.
(Optional) In the left side of all template list, click to select a piece of template record, the right side will update to show performance metric in this template. The template list in interface also provides search function, input template name and then click < > to search the appropriate template.
Step 3 View template priorities information.
Right-click to select a piece of template record in list interface Click [Priorities] in shortcut menu to pop up priorities panel and show template name,
description, subordinated template group name and system default template or not.
Step 4 (Optional) Modify user-defined template priorities and details.
Right-click to select a piece of template record in list interface Click <Modify> in shortcut menu to pop up Modify interface, which is the same with
template creation interface, user can modify template name, description and performance metric.
Step 5 (Optional) Delete user-defined metrics template.
Right-click to select a piece of template record in list interface Click <Delete> in shortcut menu to pop up Delete dialog box, user can delete template here.
If collection task has used user-defined metric template, the metric template doesn’t support to delete and it will pop up delete error prompt.
4.4 Configure threshold template
The network service quality declining is often a precursor to failure, after setting alarm threshold, operation and maintenance personnel will get alarm information when service quality declines to a certain extent and thus take countermeasures to avoid the failure. The main role of alarm threshold: during the execution process of collection task, some of the properties exceed the value setting in alarm threshold, it will send alarm notification. Users need to set alarm threshold if they want to monitor performance data purposefully.
4.4.1 Configure threshold template Alarm metrics threshold are usually divided into upper and lower limit alarms, and support multiple alarm levels thresholds respectively, so the configuration is generally more complicated. When the threshold template is created, user can use threshold template to configure performance collection task simply and quickly. Multiple collection tasks can use the same or different threshold templates and when collection tasks are stopped, user can take unified modification to collection task

www.raisecom.com User Manual
26
performance alarm threshold with this threshold template by modifying threshold template, and then restart collection task and take monitoring according to the modified threshold.
Threshold template is associated with the performance metrics template, each performance metric template support to associate with multiple threshold templates, and each threshold template can only belong to one metric template and after threshold template is created, its subordinated metric template cannot be modified. To configure collection task, user can only select one metric template and use one threshold template subordinated this metric template at most.
Performance metric threshold is configured depending on the specific circumstances, the threshold template does not provide the system default template, but provides a unified template structure for user to configure. Threshold template supports to modify and delete, but has the following constraints:
If the collection task with threshold template is started, user cannot modify and delete threshold template.
If the collection task with threshold template is stopped, user can modify threshold template and after restarting collection task, performance monitoring service will take monitoring in accordance with the modified threshold template.
The threshold template used by collection task doesn’t support to delete, please make sure whether need to delete the used metric template collection task; Only when all collection tasks with this template are deleted, the threshold template can be deleted.
Step 1 Create performance threshold template.
In NView NNM system menu, click [Performance/Template Management/Threshold Template Management] to open threshold template list interface.
Right-click in the list interface, click [Add] in shortcut menu to pop up threshold template Add dialog box; the interface and parameters are shown as below.

www.raisecom.com User Manual
27
Figure 4-2 Create threshold template
Table 4-2 Create threshold template interface parameters
Parameters Description
Name Configure threshold template name, which cannot be repeated.
Subordinate metric group Configure threshold template subordinated metric template.
Click <Query> to search metric template and select. After the threshold template is created, the parameters cannot be modified again.
System default Show whether it is system default template. The system default template doesn’t support to modify and delete.
Metric group/metrics name Show metrics and metrics subordinated metrics group name.
Alarm report To select indicates to report alarm over threshold; after selected, configure one metric threshold at least.
Click to select metric group and all metrics in the automatically selected metric group will report alarm.

www.raisecom.com User Manual
28
Upper emergency/major/minor/prom
pt alarm threshold
Show different levels upper alarm thresholds.
Double-click a piece of record and take configuration in metric threshold details dialog box.
Lower emergency/major/minor/prom
pt alarm threshold
Show different levels lower alarm thresholds.
Double-click a piece of record and take configuration in metric threshold details dialog box.
Click <Query> to pop up query interface, and then click < > to pop up query panel; configure query conditions to search threshold template subordinated metric template. As shown in figure 4-3, the instance is to search template records in “Template name” including “Ethernet”, select “LINK” in “Template name” query conditions, input “Ethernet”, and then click <Query> to show query results.
Figure 4-3 Query threshold template subordinated metric template instance
Click to select the metric template record, click <OK> to configure threshold template subordinated metric template.
Double-click a piece of record to pop up metric threshold configuration dialog box, configure threshold in the text box, and then click <OK> to complete the configuration, as shown below. Do not input threshold indicates not need to monitor this metric threshold.
Click <OK> to complete the creation after all needed metric threshold configuration is complete.

www.raisecom.com User Manual
29
Figure 4-4 Configuration metric threshold
Table 4-3 Configure metric threshold interface parameters
Parameters Description
Metric name Show metric name.
Upper emergency/major/minor/prompt alarm threshold
Configure different levels upper alarm threshold.
Lower emergency/major/minor/prompt alarm threshold
Configure different levels lower alarm threshold.
Step 2 View the metric threshold in template.
Right-click to select a piece of template record in list interface Click [Details] in shortcut menu to pop up detailed information interface and show template
name, description and system default template or not and other basic information. At the same time, the metric threshold panel below the interface will show the threshold in template.
Double-click a piece of metric threshold record to open the detailed information of metric threshold to view threshold configuration.
(Optional) In the left side of all template list, click to select a piece of template record, the right side will update to show metric threshold in this template. The template list in interface also provides search function, input template name and then click < > to search the appropriate template.
Step 3 View template priorities information.
Right-click to select a piece of template record in list interface Click [Priorities] in shortcut menu to pop up priorities panel and show template name,
description, subordinated template group name and system default template or not.
Step 4 (Optional) Modify threshold template priorities and details.
Right-click to select a piece of template record in list interface

www.raisecom.com User Manual
30
Click <Modify> in shortcut menu to pop up Modify interface, which is the same with template creation interface, user can modify template name, description and metric threshold.
Step 5 (Optional) Delete threshold template.
Right-click to select a piece of template record in list interface Click <Delete> in shortcut menu to pop up Delete dialog box, user can delete template here.
If collection task has used threshold template, the metric template doesn’t support to delete and it will pop up delete error prompt.
4.4.2 Performance threshold alarm report process The collection task with alarm threshold supports to generate alarm notification beyond alarm threshold, the alarm report process is shown below:
Start
Configure performance
collection or not?
Performance data collection
processing
Exceed performance
threshold or not?
Enable threshold alarm
reporting or not?
Report to NView NNM
Record performance data
processing performance figure
End
No
No
No
Yes
Yes
Yes
Figure 4-5 Performance threshold alarm reporting process

www.raisecom.com User Manual
31
Chapter 5 Configure Performance Collection Task
This chapter introduces the methods to configure batch and single-point performance collection task.
Overview Configuration process Interface description Create batch deployment task Create single-point task Start collection task Stop collection task Manage collection task
5.1 Overview
To take performance monitoring to network element device, user usually needs to set resources, performance metric and threshold to collect and perform continuously and periodically. According to performance monitoring features, performance monitoring service provides collection task mode to take performance monitoring to network equipment. Performance collection also provides metrics template and threshold template configuration function; the configuration process is simple and convenient, which improves the performance monitoring configuration efficiency.
Performance monitoring collection task supports to select performance collection resources, performance metrics, alarm thresholds, and supports to configure collection frequency as well as task execution cycle, etc. Performance monitoring service takes scheduling to perform collection task and performance monitoring to network element device based on user configuration, and then records the collected performance data to the database for user to view historical performance data and historical performance graph.
Performance collection task is divided into the following two types:
Batch deployment tasks: to take performance monitoring to network element device, user can use performance monitoring service batch deployment collection tasks function to configure performance collection to multiple device resources with the same type. User only needs to configure a collection task to monitor multiple resources; in one batch deployment task, these resources with the same type can belong to different network element devices.
Single-point task: single-point configuration is to configure a single device. The main function of single-point configuration is to configure and issue collection task with single device as collection object. A single collection device object can configure performance metrics in batch to multiple collection resources of this single-point simultaneously by configuring collection task. These resources belong to one network element device, and the collection resources in one single-point task also need the same type of collection resources.
5.2 Configuration process
The process to configure performance collection task is shown in figure 5-1. The collection task configuration process has the following features.

www.raisecom.com User Manual
32
Performance monitoring service provides system default template for each type of collection resources, so after selecting collection resource, it will use system default template by default, or select user-defined metric template to filter the performance metric to monitor.
To monitor performance metric threshold, user needs to configure threshold template at first, and then take selection in collection task configuration.
By default, performance collection task will be collected continuously when the collection task is started. If user needs to define collection execution cycle, please configure collection plan.
Start
(Optional) Configure indicator template
End
Configure task name, collection
cycle, collection status
Select collection resources
(Optional) Configure threshold template
(Optional) Configure collection
plan
Figure 5-1 Performance collection task configuration process
5.3 Interface description
5.3.1 Batch tasks deployment interface In NView NNM system menu, click [Performance/Collection Task Management] to open collection task management interface, as shown in Figure 5-2, it will show the created collection task
www.raisecom.com User Manual
33
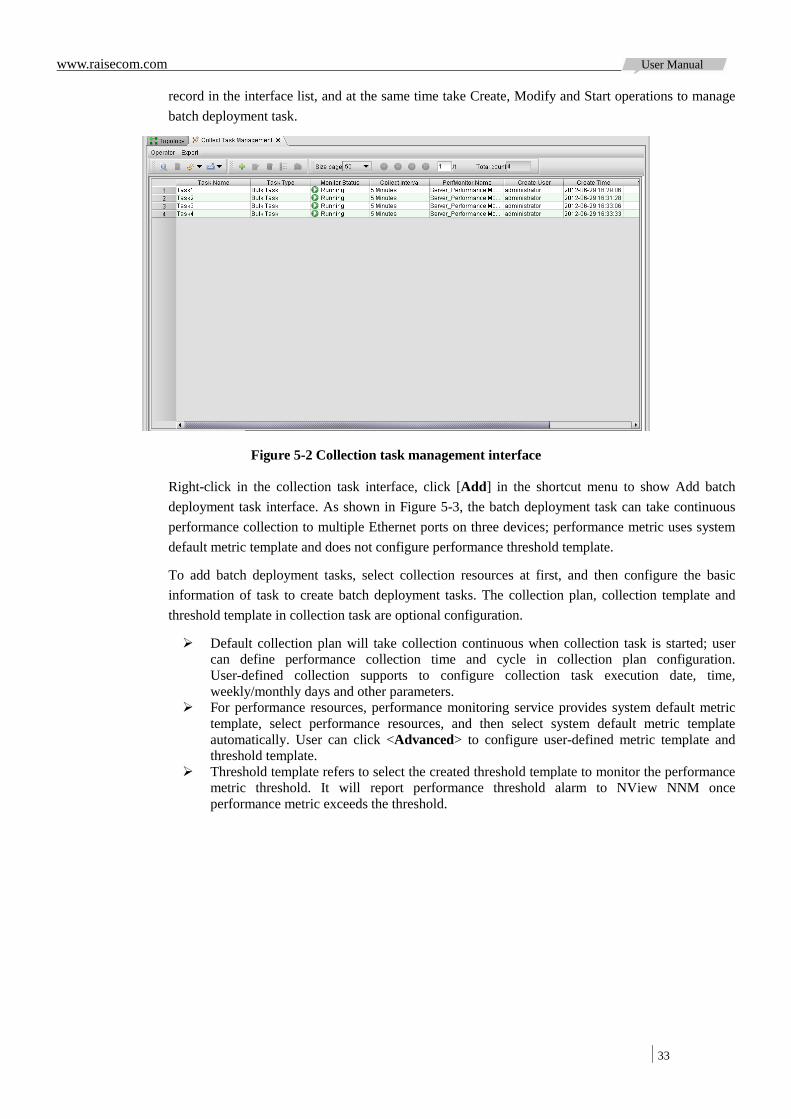
record in the interface list, and at the same time take Create, Modify and Start operations to manage batch deployment task.
Figure 5-2 Collection task management interface
Right-click in the collection task interface, click [Add] in the shortcut menu to show Add batch deployment task interface. As shown in Figure 5-3, the batch deployment task can take continuous performance collection to multiple Ethernet ports on three devices; performance metric uses system default metric template and does not configure performance threshold template.
To add batch deployment tasks, select collection resources at first, and then configure the basic information of task to create batch deployment tasks. The collection plan, collection template and threshold template in collection task are optional configuration.
Default collection plan will take collection continuous when collection task is started; user can define performance collection time and cycle in collection plan configuration. User-defined collection supports to configure collection task execution date, time, weekly/monthly days and other parameters.
For performance resources, performance monitoring service provides system default metric template, select performance resources, and then select system default metric template automatically. User can click <Advanced> to configure user-defined metric template and threshold template.
Threshold template refers to select the created threshold template to monitor the performance metric threshold. It will report performance threshold alarm to NView NNM once performance metric exceeds the threshold.

www.raisecom.com User Manual
34
Figure 5-3 Add batch deployment tasks interface
Note: These resources can belong to different network element device in one batch deployment task, but the resources classifications need to be the same, for example, user can select multiple network element devices to configure Ethernet port.
5.3.2 Single-point task interface Right-click network element in topology figure or topology tree, and then click [Performance Management/Single-point Configuration] in shortcut menu to open single-point task interface
Click to select collection resources to configure basic information, collection plan, metric template and threshold template of single-point task to complete the configuration. As shown in Figure 5-4, it shows the configuration of a collection of task: the task is to take continuous collection to the Ethernet ports of “Chassis 1, Slot 12, Ethernet electrical port 1” in “192.168.18.200” device; performance metric uses system default “Ethernet port system metric template” and “Unicast packet Tx/Rx threshold template” to configure alarm threshold.

www.raisecom.com User Manual
35
Figure 5-4 Single-point task interface
Note: In a single-point task, the selected resources need to belong to the same resource classification. For example, user can select the Ethernet ports of multiple slot boards on one network element device to configure.
5.3.3 Small icons in the interface In collection resource object port list, the small icons in left side of each port have the following meanings.
Table 5-1 Collection resource object icon description
Icon Description
Resources classification, including one or more resources; to Select/Cancel to select resource classification will Select/Cancel
all resources in this classification simultaneously.
Port status is Up and hasn’t deployed collection task.
Port status is Down and hasn’t deployed collection task.
Port status is Up and has deployed collection task.
Port status is Down and has deployed collection task.
5.4 Create batch deployment task
To configure performance collection to multiple device resources with the same types, user can use the batch deployment collection task function of performance monitoring service to configuration.

www.raisecom.com User Manual
36
User only needs to configure a collection task to monitor multiple resources; in one batch deployment task, these resources with the same type can belong to different network element devices.
Step 1 In NView NNM system menu, click [Performance/Collection Task Management] to open collection task management interface.
Step 2 Right-click in the collection task interface, click [Add] in the shortcut menu to show add batch deployment tasks interface.
Step 3 Select performance metric categories. In the left side resource type tree, classify resources in NView NNM, the category description is shown as below. Double-click to select the category, the right interface will show classified collection resources, all port resources are shown by default.
Table 5-2 Resource category description
Category Description
NE Show NE category resources
Chassis Show NE chassis category resources
Central office card Show NE central office card category resources
ONU Show ONU category resources
Port Show port category resources, including the following port categories according to different port types:
All (Show all port resources)
PDH electrical port
Ethernet port
PDH optical port
SDH port
V35 port
PCM voice port
VoIP voice port
Serial port
EPON port
Other ports
System resources Show NE system category resources
CPU
RAM

www.raisecom.com User Manual
37
Category Description
Other resources Show TDM, EPON, switch, EoC and other NE device category resources.
CNU coaxial-cable link
ATU port
PON optical port (OLT PON port optical module)
ONU PON interface (ONU PON port and PON port optical module)
ISCOM5108 ETH port
HP path (SDH high order path and SDH remote high order path, supporting 15 minutes/24 hours)
MS path (SDH multiplexing section/generation section and SDH remote multiplexing section/generation section, supporting 15 minutes/24 hours)
LP path (SDH low order path, supporting 15 minutes/24 hours)
Y1731 (Y.1731 Ethernet OAM link)
iTN201 resources
Logical link (EPON ONU logical link)
OLT to ONU resources (ONU and OLT receives ONU optical power)
UNI electrical port
GE port optical module
TDMoP_TDM
Step 4 Configure collection resources. Click < > in “Resource configuration” panel to open add collection resource interface, as shown in Figure 5-5, collection resources record is as shown in Table 5-3. Click and select to configure performance collection resources, click <OK> to configure collection resources. Just select resource records same with “Performance management object” when select to configure performance collection resources.
Note: To configure collection resources, user can select to add a required resource, and then click
< > to show resource records same with “Performance management object” in the add collection resources interface, that is the same type collection resources records. Then user can select the same
type collection resources quickly. Or click < > to open Query Panel and set query conditions to filter records.

www.raisecom.com User Manual
38
Figure 5-5 Add collection resources
Table 5-3 Resources record description
Parameter Description
Select Select: collection resources to add.
Please not to select the following types of records:
Not select the records with “Monitor or not” as “Yes”, which indicates other collection task has already performed collection to this resource.
Not select the records with different “Performance management object” simultaneously, for example, not select the performance resource records with
“Performance management object” as “Device port” and “EoS” simultaneously.
Subnet Show NE located subnet name. Only NE and ONU resources can show this parameter.
NE Show resources subordinated NE name.
Resource name Show resources name.
Monitor or not Show whether the resources have deployed collection task.
Performance management
object
Show resources performance management object.
The performance management objects to collect resources in one performance collection task need to be the same.
IP address Show resources subordinated NE IP address.
Operating status
Show port resources operating status. Only port resources can show this parameter.
Normal: port works normally. Only “Normal” resources can collect performance data.
Fault: port fault.
Unknown: cannot know port status.
Port type Show port type. Only port resources can show this parameter.

www.raisecom.com User Manual
39
Parameter Description
Online status Show NE online status. Only NE and ONU resources can show this parameter.
Exist status Show chassis or central office card exist status. Only chassis and central office card can show this parameter. Not exist card will show “Lose”.
Step 5 Configure the basic task information.
Table 5-4 Basic information parameters description
Parameter Value Description
Task name - Configure batch deployment task names.
The task names cannot be the repeated.
Collection cycle 5 minutes
15 minutes
24 hours
Configure collection task execution frequency cycle, i.e. the time interval to perform one time
performance collection.
Collection status Stop
Start
Suspend
Configure the initial status of collection task.
Stop by default. Only “Start” collection task performs performance collection. After collection task is created, user can modify collection status in
collection task management interface.
Step 6 (Optional) Click <Advanced> to configure metrics template and threshold template, the template settings interface is shown in Figure 5-6, the parameters are shown in Table 5-5. To configure template, select metric template in the above interface at first, and then select threshold template of the metric template in “Threshold template name” drop-down list box below the interface. Click <OK> when the template configuration is complete.
Figure 5-6 Template setting interface

www.raisecom.com User Manual
40
Table 5-5 Metric template and threshold template parameters description
Parameter Description
Metric template setting
Click to select the metric template to record configuration collection task.
Use system default template by default, also supporting to select user-defined metric template. Only when user-defined metric
template contains resources supporting performance metric, the user-defined template record can be shown.
Metric template name
Configure to select threshold template of metric template.
Click to select metric template record, click drop-down list box to select threshold template. The interface will show the detailed
information of selected threshold template.
Step 7 (Optional) Click “Collection plan setting” tab to configure collection plan. By default, performance task performs continuous collection only then collection task is started, user can configure collection plan to collect performance data periodically. The configuration parameters of collection plan are shown in Table 5-6.
Note: Continuous collection and user-defined collection can perform collection only then collection task is started.
Table 5-6 Configuration parameters of collection plan
Parameter Description
Continuous collection
Collect performance data continuously after starting collection task.
By default, select continuous collection.
User-defined collection
Collect performance data according to collection plan configuration periodicity after starting collection task.
Configure follow-up parameters after selecting user-defined collection.
Task start/end date Configure user-defined collection data range
Daily start/end time slot
Configure user-defined collection time slot, supporting multiple time slots collection.
By default, “00:00:00-23:59:59” to collect, i.e. all day collection.
To modify time slot, select default time record at first, and then click < > to remove default record.
Add collection time slot records
Select time slot record, and then click < > to remove collection time slot record.
Weekly collection days
Collect based on weekly collection days.
Click <Select> to configure weekly collection days.
Select all: collect from Monday to Sunday, which is default.
User-defined: configure days to collect from Monday to Sunday and collect in the selected days.
Select working day: collect from Monday to Friday.

www.raisecom.com User Manual
41
Parameter Description
Monthly collection days
Collect based on monthly collection days.
Click <Select> to configure monthly collection days.
Select all: collect all the month, which is default.
User-defined: configure days to collect from the first day to the end day in this month and collect in the selected days.
Step 8 In add batch deployment task interface, click <OK> to create batch collection task. The additional task will also be shown in collection task management interface.
5.5 Create single-point task
The main function of single-point configuration is to take single device as collection object, configure and issue collection task. A single collection device object can configure performance metric in batch to multiple collection resources of this single-point simultaneously by configuring collection task. These resources belong to one network element device, and the collection resources in one single-point task also need the same type of collection resources.
Step 1 Right-click network element in topology figure or topology tree, click [Performance Management/Single-point Configuration] in the shortcut menu to open single-point task interface.
Step 2 Click to select collection resources. Select/Cancel to select resource category will Select/Cancel all resources in this category simultaneously. Please do not select resources with small
icon and , these two icons indicated the collection resources have already configured performance collection task and cannot configure again.
Note: In a single-point task, the selected resources shall belong to the same resource category. For example, user can select Ethernet ports of multiple slot single-boards on one NE device to configure, and these Ethernet ports belong to the same resource category.
Step 3 Configure the basic information of single-point task.
Table 5-7 Basic information parameters description
Parameter Value Description
Task name - Configure batch deployment task names.
The task names cannot be the repeated.
Collection cycle 5 minutes
15 minutes
24 hours
Configure collection task execution frequency cycle, i.e. the time interval to perform one time
performance collection.
Collection status Stop
Start
Suspend
Configure the initial status of collection task.
Stop by default. Only “Start” collection task performs performance collection. After collection task is created, user can modify collection status in
collection task management interface.
Step 4 (Optional) Click “Collection plan setting” tab to configure collection plan. By default, performance task performs continuous collection only then collection task is started, user can configure collection plan to collect performance data periodically. The configuration parameters of

www.raisecom.com User Manual
42
collection plan are shown in Table 5-8.
Note: Continuous collection and user-defined collection can perform collection only then collection task is started.
Table 5-8 Configuration parameters of collection plan
Parameter Description
Continuous collection
Collect performance data continuously after starting collection task.
By default, select continuous collection.
User-defined collection
Collect performance data according to collection plan configuration periodicity after starting collection task.
Configure follow-up parameters after selecting user-defined collection.
Task start/end date Configure user-defined collection data range
Daily start/end time slot
Configure user-defined collection time slot, supporting multiple time slots collection.
By default, “00:00:00-23:59:59” to collect, i.e. all day collection.
To modify time slot, select default time record at first, and then click < > to remove default record.
Add collection time slot records
Select time slot record, and then click < > to remove collection time slot record.
Weekly collection days
Collect based on weekly collection days.
Click <Select> to configure weekly collection days.
Select all: collect from Monday to Sunday, which is default.
User-defined: configure days to collect from Monday to Sunday and collect in the selected days.
Select working day: collect from Monday to Friday.
Monthly collection days
Collect based on monthly collection days.
Click <Select> to configure monthly collection days.
Select all: collect all the month, which is default.
User-defined: configure days to collect from the first day to the end day in this month and collect in the selected days.
Step 5 (Optional) Click <Advanced> to configure metrics template and threshold template, the template settings interface is shown in Figure 5-7, the parameters are shown in Table 5-9. To configure template, select metric template in the above interface at first, and then select threshold template of the metric template in “Threshold template name” drop-down list box below the interface. Click <OK> when the template configuration is complete.
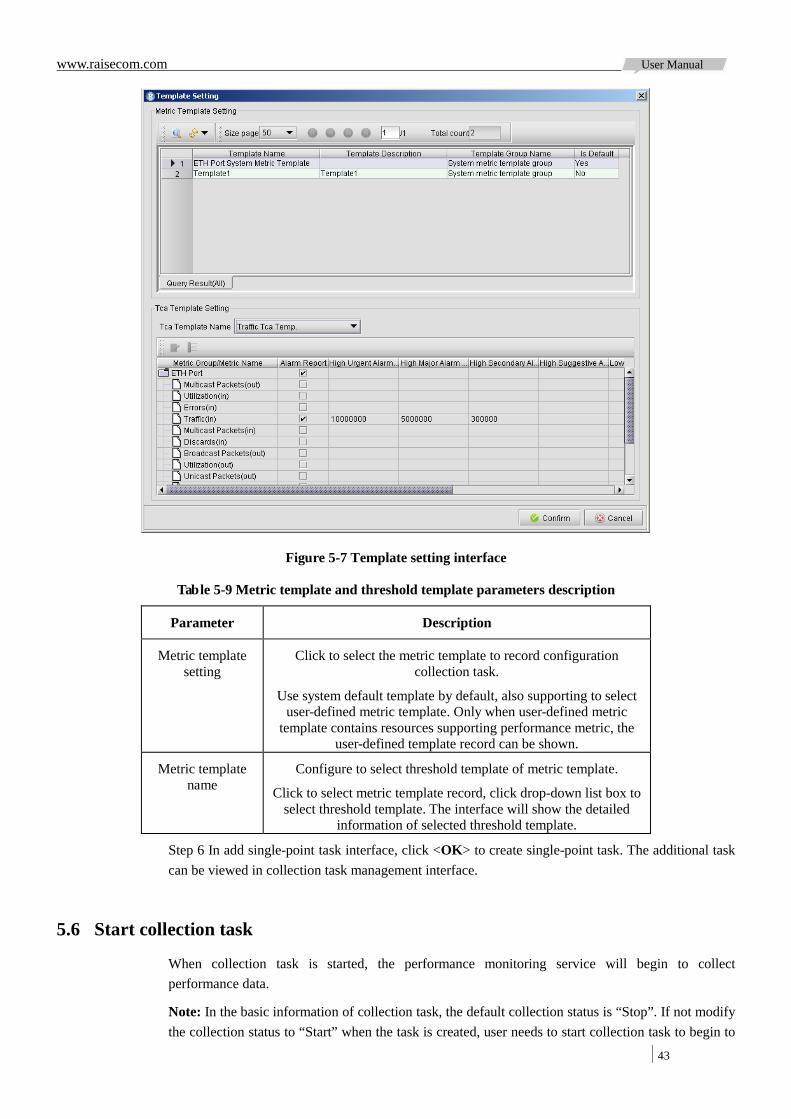
www.raisecom.com User Manual
43
Figure 5-7 Template setting interface
Table 5-9 Metric template and threshold template parameters description
Parameter Description
Metric template setting
Click to select the metric template to record configuration collection task.
Use system default template by default, also supporting to select user-defined metric template. Only when user-defined metric
template contains resources supporting performance metric, the user-defined template record can be shown.
Metric template name
Configure to select threshold template of metric template.
Click to select metric template record, click drop-down list box to select threshold template. The interface will show the detailed
information of selected threshold template.
Step 6 In add single-point task interface, click <OK> to create single-point task. The additional task can be viewed in collection task management interface.
5.6 Start collection task
When collection task is started, the performance monitoring service will begin to collect performance data.
Note: In the basic information of collection task, the default collection status is “Stop”. If not modify the collection status to “Start” when the task is created, user needs to start collection task to begin to

www.raisecom.com User Manual
44
collect performance data.
Step 1 In NView NNM system menu, click [Performance/Collection Task Management] to open collection task management interface.
Step 2 For the records with task operating status as “ ”, click to select a piece of record, or click and press the left mouse and drag to select multiple records. Right-click in the shortcut menu, click [Start].
Step 3 When the collection task is started, the task operating status will show as “ ”.
5.7 Stop collection task
When collection task is stopped, the performance monitoring service will not collect performance data. To stop collection task cannot influence the collected performance data and historical performance graph view.
Step 1 In NView NNM system menu, click [Performance/Collection Task Management] to open collection task management interface.
Step 2 For the records with task operating status as “ ”, click to select a piece of record, or click and press the left mouse and drag to select multiple records. Right-click in the shortcut menu, click [Stop].
Step 3 When the collection task is stopped, the task operating status will show as “ ”.
5.8 Manage collection task
5.8.1 Query collection task Performance collection task uses the common query component, user can set task name, task operating status to query collection task record.
Step 1 In NView NNM system menu, click [Performance/Collection Task Management] to open collection task management interface.
Step 2 Click < > in toolbar to open Query Panel, set query conditions and record values to filter the records.
Step 3 (Optional) Customize query conditions. Click “Customize query line” below the query panel, click to select/cancel whether to show query field in query conditions. Click to select the name of
query condition, and then click < > to adjust the display order of query conditions.
Step 4 (Optional) Customize order conditions. Click “Customize order conditions” below the query panel, click drop-down list box in right side of record field, select ascending or descending to configure collection task record order conditions. The task records will install order conditions to display in order, when setting multiple order conditions, it will take an order in accordance with the field up and down order in “Customize order conditions”. Click to select the name of query condition,
and then click < > to adjust the up and down order of order conditions.

www.raisecom.com User Manual
45
5.8.2 View collection task properties Collection task list interface displays the properties information of collection task, user can also view collection task properties through properties panel.
Step 1 In NView NNM system menu, click [Performance/Collection Task Management] to open collection task management interface.
Step 2 Double-click a collection task record to open the properties panel to view task properties. The properties information is shown in Table 5-10.
Table 5-10 Properties information
Parameter Value Description
Task name - Show collection task name
Task type Batch tasks
Single-point task
Show collection task type
Task operating status
Start
Stop
Show collection task operating status
Performance data can be collected only when the collection task is started.
Collection interval
300
900
86400
Unit: second
Show collection data time interval, which is the performance data collection frequency.
Performance monitoring
process name
- Show performance monitoring service name to perform collection task.
Created by - Show Nview NNM user name to create collection task.
Created time - Show created time of collection task.
Modified by - Show Nview NNM user name to modify collection task recently.
It will show only when the task is modified.
Modified time - Show the latest modified time of collection task.
It will show only when the task is modified.
5.8.3 View detailed information of collection task To view the detailed information of collection task, user can view basic information, collection resource, template setting and collection plan of collection task.
Step 1 In NView NNM system menu, click [Performance/Collection Task Management] to open collection task management interface.
Step 2 Right-click a piece of collection record, click [Details] in shortcut menu to open detailed information interface of collection task, which is the same with the interface to create collection task, including basic information, collection resource, template setting, collection plan and other task information of collection task.

www.raisecom.com User Manual
46
5.8.4 Modify collection task To modify collection task, user can modify the basic information, collection resource, template setting, collection plan and other task information of collection task.
Note: The started collection task cannot be modified, please stop collection task at first.
Step 1 In NView NNM system menu, click [Performance/Collection Task Management] to open collection task management interface.
Step 2 Right-click a piece of collection record, click [Modify] in shortcut menu to open detailed information interface of collection task, which is the same with the interface to create collection task, including basic information, collection resource, template setting, collection plan and other task information of collection task.
5.8.5 Delete collection task To delete collection task, user can delete the created collection task, after deleting collection task, performance monitoring service will stop collecting the network element related performance data.
Note:
The started collection task cannot be deleted, please stop collection task at first. When network element is deployed collection task, the network element topology nodes are
not allowed to delete, please delete network element nodes collection task at first.
Step 1 In NView NNM system menu, click [Performance/Collection Task Management] to open collection task management interface.
Step 2 Right-click a piece of collection record, click [Delete] in shortcut menu to pop up confirmation dialog box “Confirm to delete?”, click <Yes> to perform the delete operation, click <No> not to perform the delete operation.
5.8.6 Refresh collection task record To refresh collection task records, user can refresh the created collection task records.
Step 1 In NView NNM system menu, click [Performance/Collection Task Management] to open collection task management interface.
Step 2 Right-click in the shortcut menu, click [Refresh/Refresh All] to refresh collection task records.
Step 3 (Optional) Click < > to open Query Panel, set query conditions filter records, right-click in the shortcut menu, click [Refresh/Refresh in Conditions] to refresh collection task query records.

www.raisecom.com User Manual
47
Chapter 6 Browse Historical Performance
This chapter introduces the methods to browse historical performance graph and use data.
Overview Function entrance Browse historical performance graph
6.1 Overview
Historical performance browsing of network device is an important means to learn device operating and service status. To view performance data from the command line, the performance data refers to performance value at some time or time slot, which is not intuitive to operate, but more cumbersome.
The historical performance graph function provided by performance monitoring service can make performance data graphical, draw performance graph automatically based on historical performance data, and display the working status of device performance data clearly and intuitively.
When collection task is configured, performance monitoring service will perform performance data collection and save them to database. User can browse historical performance graph and data to view whether the network device and service are running normally so that the operation and maintenance personnel can check.
The historical performance graph is divided into the following six categories:
Original: collected original performance data, including all performance data collected after the performance task is started.
Hour: hourly performance data, taking statistics based on original performance data, one piece of record per hour.
Day: daily performance data, taking statistics based on original performance data, one piece of record per day.
Week: weekly performance data, taking statistics based on original performance data, one piece of record per week.
Month: monthly performance data, taking statistics based on original performance data, one piece of record per month.
Year: annual performance data, taking statistics based on original performance data, one piece of record per year.
6.2 Function entrance
The function entrance to browse historical performance graph and data and monitor real-time performance graph and data is the same, which is shown in “Historical performance graph” tab page in performance graph interface. Historical performance graph and real-time performance graph interfaces are basically the same, please refers to 3.2 Function entrance for the detailed description of

www.raisecom.com User Manual
48
different functions interface.
To browse historical performance graph supports four function entrances for users to select:
In performance monitoring service performance graph, select a single network element to monitor. This way can easily switch network element to select in the network.
In topology figure or topology tree, select a single network element to monitor. This way can only monitor the selected network element.
In performance collection task management interface, select a single task to monitor. This way can only monitor performance resources configured in collection task.
In inventory management, select the records of a single network element to monitor. This way can only monitor the selected network element.
6.3 Browse historical performance graph
To browse historical performance graph can master the device's operating performance status, as shown in Figure 6-1. Click [Performance/Performance Graph] in system menu to enter this interface. Interfaces from other function entrance and this interface are basically the same, for other function entrance has already specify network element or specific performance collection resource in launching performance graph operation, so there is no area in the left side to select network element device.
Figure 6-1 Historical performance graph interface instance
Open performance graph interface and browse historical performance graph according to the following steps:
Step 1 (Optional) Query network element, which only applies to launch performance graph from
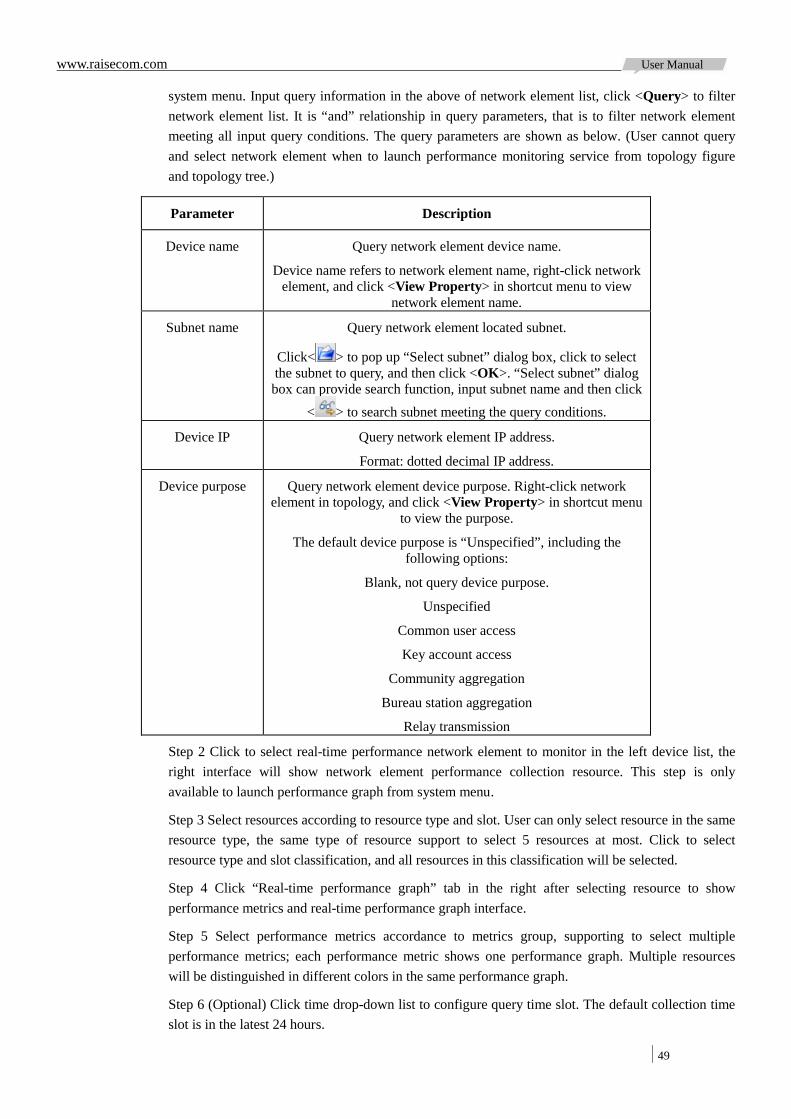
www.raisecom.com User Manual
49
system menu. Input query information in the above of network element list, click <Query> to filter network element list. It is “and” relationship in query parameters, that is to filter network element meeting all input query conditions. The query parameters are shown as below. (User cannot query and select network element when to launch performance monitoring service from topology figure and topology tree.)
Parameter Description
Device name Query network element device name.
Device name refers to network element name, right-click network element, and click <View Property> in shortcut menu to view
network element name.
Subnet name Query network element located subnet.
Click< > to pop up “Select subnet” dialog box, click to select the subnet to query, and then click <OK>. “Select subnet” dialog box can provide search function, input subnet name and then click
< > to search subnet meeting the query conditions.
Device IP Query network element IP address.
Format: dotted decimal IP address.
Device purpose Query network element device purpose. Right-click network element in topology, and click <View Property> in shortcut menu
to view the purpose.
The default device purpose is “Unspecified”, including the following options:
Blank, not query device purpose.
Unspecified
Common user access
Key account access
Community aggregation
Bureau station aggregation
Relay transmission
Step 2 Click to select real-time performance network element to monitor in the left device list, the right interface will show network element performance collection resource. This step is only available to launch performance graph from system menu.
Step 3 Select resources according to resource type and slot. User can only select resource in the same resource type, the same type of resource support to select 5 resources at most. Click to select resource type and slot classification, and all resources in this classification will be selected.
Step 4 Click “Real-time performance graph” tab in the right after selecting resource to show performance metrics and real-time performance graph interface.
Step 5 Select performance metrics accordance to metrics group, supporting to select multiple performance metrics; each performance metric shows one performance graph. Multiple resources will be distinguished in different colors in the same performance graph.
Step 6 (Optional) Click time drop-down list to configure query time slot. The default collection time slot is in the latest 24 hours.

www.raisecom.com User Manual
50
Step 7 Click historical performance graph category drop-down box to select to historical performance graph category.
Table 6-1 Historical performance graph category
Parameter Description
Original Show original performance data performance graph according to time slot.
Original performance data refers to all performance data by collection task based on collection interval.
Hour Show integral point performance data performance graph according to time slot.
Day Show daily historical performance graph according to time slot.
Week Show weekly historical performance graph according to time slot.
Month Show monthly historical performance graph according to time slot.
Year Show annual historical performance graph according to time slot.
Note:
In hourly, daily, weekly, monthly and annual performance graphs, each point data in performance curve is calculated based on original data. According to different performance metrics, there are different calculation methods. The typical calculation methods are as follows:
Calculate total sum of the data: accumulate performance data in one time slot, for example calculate data flow by accumulating total sum of the data.
Calculate average value of the data: average performance data in one time slot, for example use CPU utilization rate to calculate the average value.
Step 8 Click <Query> to show historical performance graph, Figure 6-2 is an instance of performance graph, which shows to monitor 192.168.18.2 network element device resources port 1. The performance metric to monitor is unicast packets. This figure distinguishes Tx/Rx unicast packets in different colors.

www.raisecom.com User Manual
51
Figure 6-2 Performance graph instance

www.raisecom.com User Manual
52
Appendix A Glossary
Inventory Various resources in network management system
Equivalent NE Each NE device can be converted to equivalent NE according to the equivalent coefficient so as to calculate network management system management capacity
Symbol Symbol is schematic topology node, which cannot take network management, but give better display to network structure.
Alarm The reported information when device or network management system detects failure.
Node General terms of subnet, NE and symbols in network management system.
Customer Customer uses device provided service; the customer information can associate with NE, alarm and can only be stored in network management system.
Synchronization Network management system updates device resource or alarm information in database by synchronization function to make network management system correspondence with device.
Topology Graphical network structure in network management system, which can show networking situation, subnet/NE alarm and online status intuitionally.
Network Element Network device takes management in network management system as network element
NMS Monitor
Auxiliary program of network management system, which can manage various service programs in network management system and monitor network management system
operating status.
Performance
Monitor Network management system collects and shows device flow, packet loss and other
performance data.
User Network management system client user; the collection of user and user group management domain and operation permission confirms network management function used by user.
Resource Management objects in network management system, including device, chassis, single-board, port and etc.
Subnet Subnet refers to the logical division of network topology structure in network management
system, which can help show NE topology structure clearly in network management system. The subnet interior can contain subnet, NE, symbol, and link etc topology nodes.

www.raisecom.com User Manual
53
Appendix B Acronym
A
AES Advanced Encryption Standard
C
CPU Central Processing Unit
D
DES Data Encryption Standard
E
EPON Ethernet Passive Optical Network
F
FPGA Field-Programmable Gate Array
FTP File Transfer Protocol
G
GUI Graphical User Interface
I
ICMP Internet Control Message Protocol
IP Internet Protocol
L
LLDP Link Layer Discovery Protocol
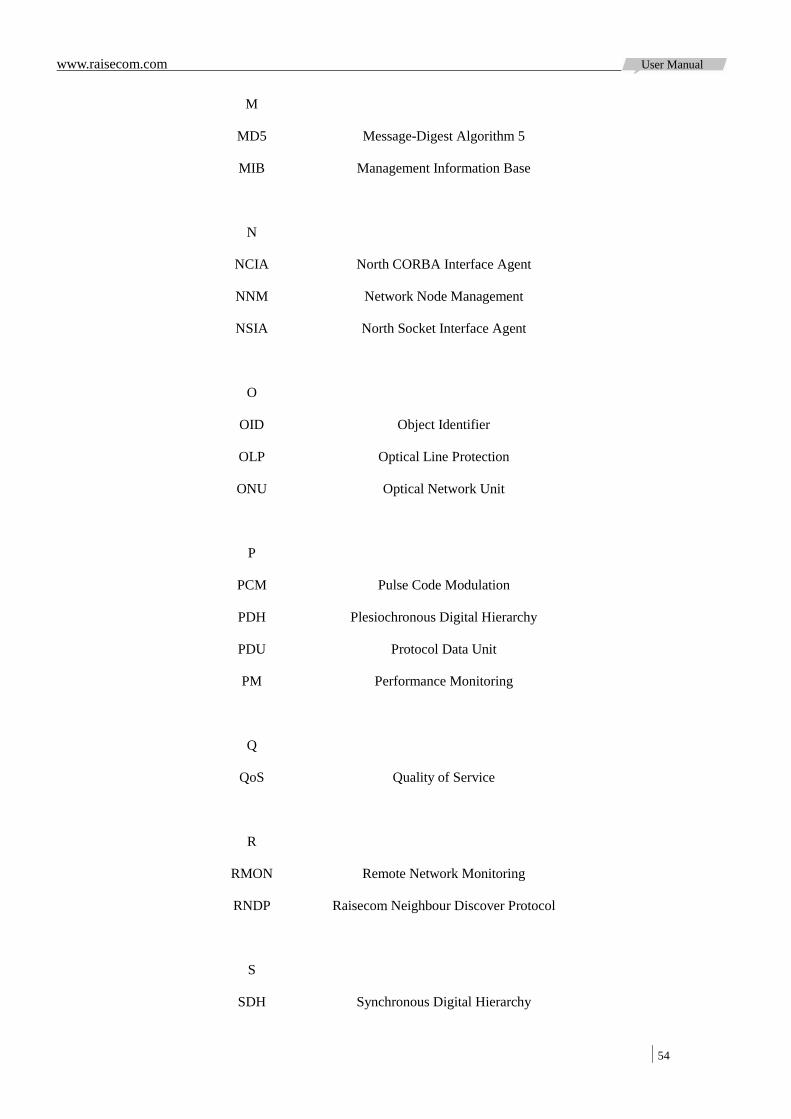
www.raisecom.com User Manual
54
M
MD5 Message-Digest Algorithm 5
MIB Management Information Base
N
NCIA North CORBA Interface Agent
NNM Network Node Management
NSIA North Socket Interface Agent
O
OID Object Identifier
OLP Optical Line Protection
ONU Optical Network Unit
P
PCM Pulse Code Modulation
PDH Plesiochronous Digital Hierarchy
PDU Protocol Data Unit
PM Performance Monitoring
Q
QoS Quality of Service
R
RMON Remote Network Monitoring
RNDP Raisecom Neighbour Discover Protocol
S
SDH Synchronous Digital Hierarchy

www.raisecom.com User Manual
55
SHA Secure Hash Algorithm
SLA Service Level Agreement
SMTP Simple Mail Transfer Protocol
SNMP Simple Network Management Protocol
U
UDP User Datagram Protocol
V
VLAN Virtual Local Area Network
VoIP Voice over IP
X
XML Extensible Mark-up Language

Address: Building 2, No. 28 of the Shangdi 6th Street, Haidian District, Beijing. Postcode: 100085 Tel: +86-10-82883305 Fax: +86-10-82883056 Email: [email protected] http://www.raisecom.com