numerical evaluation of francis turbine test rig at
TRANSCRIPT

Int.J.Curr.Microbiol.App.Sci (2020) 9(7): 1020-1036
1020
Original Research Article https://doi.org/10.20546/ijcmas.2020.907.120
Numerical Evaluation of Francis Turbine Test Rig at Different Loads
Satyam Murari* and Sudarshan Prasad
College of Agricultural Engineering, Dr. Rajendra Prasad Central Agricultural University,
Pusa (Bihar), India
*Corresponding author
A B S T R A C T
Introduction
Due to increasing human population, use of
water for various purposes such as domestic,
industrial development, hydropower generat-
ion, agriculture and environmental services
has increased considerably over time. Water
use for irrigation for instance, accounts for
about 70 to 80% of the total freshwater
available worldwide and irrigation has been
ranked as one of the activities that utilize
huge amounts of fresh water in many
countries and in the near future, less water
will be available for agricultural production
due to competition with other sectors. At the
same time, food production will have to be
increased to feed the growing world
population estimated at 81 million persons per
year (UN, 2013) or about 9 billion people by
2050.
In order to provide adequate amount of water
to meet out the demand of water requirement
of all crops, adequate design of a water
pumping plant operated either by engine or
electric motor is required for which constant
International Journal of Current Microbiology and Applied Sciences ISSN: 2319-7706 Volume 9 Number 7 (2020) Journal homepage: http://www.ijcmas.com
The lab experiment was carried out to study the performance and characteristics of a Francis turbine
test rig, in the Hydraulics Lab of the College Agricultural Engineering under Dr. Rajendra Prasad
Central Agricultural University, Pusa (Bihar) India. The performance of the rig was evaluated at
various loads ranging from 0 to 7.0 kg at a constant head of 7.68 m, 0 to 5.0 kg at a constant head of
9.09 m and 0 to 4.0 kg at a constant head of 10.22 m of water, respectively. Results showed that as
the loads applied increases, the water flow rate and input power to the rig increases, reaches up to the
peak and then decreases at constant heads. Inverse relationship was observed between the torque
developed due to the loads applied and the speed of the runner of the turbine operating at a constant
head. The excellent correlation between the torque generated and the speed were found to be 99.87
% at constant heads of 7.68 m and 9.09 m; and 99.80 % at constant head of 10.22 m of water. As the
load applied increases, the torque developed increases but at the same time speed of the runner of the
turbine decreases. The output power developed by the rig increases with increase in load applied and
reaches up to the peak values of 0.212 HP at load of 4.0 kg, 0.534 HP at load of 5.0 kg and 0.277 HP
at load of 3.0 kg at constant heads of 7.68 m, 9.09 m and 10.22 m of water, respectively and then
decreases. The efficiency of the rig increases and reaches up to the maximum values of 32.23 %,
39.09 % and 37.56 % at the same value of load of 4.0 kg and at constant heads of 7.68 m, 9.09 m and
10.22 m of water, respectively and then decreases.
K e y w o r d s
Francis turbine test
rig, energy, unit
discharge, unit
speed, unit power,
efficiency
Accepted:
11 June 2020
Available Online: 10 July 2020
Article Info

Int.J.Curr.Microbiol.App.Sci (2020) 9(7): 1020-1036
1021
and high voltage of electric energy is
required. The hydraulic turbine contributes
the main function in supplying the electric
energy to the agricultural pumping set and
water pumping plant for domestic water
supply in urban and rural areas as well as
agricultural sector.
Hydroelectric energy is a domestic source of
energy, allowing each state to produce their
own energy without being reliant to others.
The energy generation can be seen as
essential to India’s ability to raise living
standards across the country, with 400 million
citizens currently living without access to it
(Mishra et al., 2015). National demand was
predicted to grow from 250,000 MW in 2015
to 800,000 MW in 2031-32 (Mishra et al.,
2015). Francis turbines are the most preferred
hydraulic turbines which is used to generate
electricity using flowing water in River to
meet out the human requirements for the
survival and making the life comfortable. It is
an inward-flow reaction turbine that combines
radial and axial flow concepts. Francis
turbines are the most common water turbine
in use today. The aim for turbine design is to
increase the efficiency and avoid cavitation.
The main components of the turbines are
spiral case, stay vanes, guide vanes, turbine
runner and the draft tube whose dimensions
are dependent mainly on the design discharge,
head and the speed of the rotor of the
generators. The design process starts with the
selection of initial dimensions, iterates to
improve the overall hydraulic efficiency and
obtain the detailed description of the final
geometry for manufacturing with complete
visualization of the computed flow field.
Water enters into the turbine through the outer
periphery of the runner in the radial direction
and leaves the runner in the axial direction,
and hence it is also known as mixed flow
turbine. Turbines are subdivided into impulse
and reaction machines. In the impulse
turbines, the total head available i.e.
hydroenergy is converted into the kinetic
energy. In the reaction turbines, only some
part of the available total head of the fluid is
converted into kinetic energy so that the fluid
entering into the runner has pressure energy
as well as kinetic energy. The pressure energy
is then converted into kinetic energy in the
runner and further converted into mechanical
energy that was used as prime mover for a
generator attached axially with the turbine.
James B. Francis, in the year of 1848while
working as head engineer of the Locks and
Canals Company in the water-powered
factory city of Lowell, Massachusetts,
improved the designs to create a turbine with
90% efficiency. He applied scientific
principles and testing methods to produce a
very efficient turbine design. More
importantly, his mathematical and graphical
calculation methods improved turbine design
and engineering.
Christophe et al., (2004) stated that the phase
shift analysis of the measured pressure
fluctuations in the draft tube at this frequency
points out a pressure source located in the
inner part of the draft tube elbow. They
showed that there is energy uniformly
distributed in the range 0 to 7 fn during
spectral analysis of the pressure signal at the
location. They calculated the wave speed
along the draft tube using the experimental
results of the phase shifts and allows
modeling the entire test rig with SIMSEN.
They provided the Eigen frequencies of the
full hydraulic system during the simulation of
the hydro acoustic behavior of the entire test
rig, including the scale model and the piping
system, and considering white noise
excitation at the pressure source location.
They identified an Eigen frequency at 2.46 fn
and the corresponding mode shape agrees
well with the experimental results. They
concluded that this excitation represents the
synchronous part of the vortex rope excitation
and the energy provided by the impacts on the

Int.J.Curr.Microbiol.App.Sci (2020) 9(7): 1020-1036
1022
draft tube wall. They showed the significant
pressure amplitude mainly at 2.46 fn, which
evidences the excitation mechanism during
the analysis of the resulting pressure
fluctuation in the entire test rig shows.
Lewis et al., (2014) mentioned that the
process of arriving at the design of the
modern Francis runner lasted from 1848 to
approximately 1920. They further advocated
that though the modern Francis runner has
little resemblance to the original turbines
designed by James B. Francis in 1848, it
became known as the Francis turbine around
1920, in honor of his many contributions to
hydraulic engineering analysis and design.
They stated that the modern Francis turbine is
the most widely used turbine design today,
particularly for medium head and large flow
rate situations, and can achieve over 95%
efficiency.
Aakti et al., (2015) performed the fully 360
degrees transient and steady-state simulations
of a Francis turbine at three operating
conditions, namely at part load (PL), best
efficiency point (BEP), and high load (HL),
using different numerical approaches for the
pressure-velocity coupling. They simulated
the spiral casing with stay and guide vanes,
the runner and the draft tube. They included
the numerical prediction of the overall
performance of the high head Francis turbine
model as well as local and integral quantities
of the complete machine in different
operating conditions. They compared the
results with experimental data published by
the workshop organization. They showed that
the overall performance is well captured by
the simulations. They concluded that the axial
velocity is better estimated than the
circumferential component at the local flow
distributions within the inlet section of the
draft-tube. Foroutan and Yavuzkurt (2015)
studied the flow in the draft tube of a Francis
turbine operating under various conditions
using computational fluid dynamics (CFD).
They considered the four operating points
with the same head and different flow rates
corresponding to 70%, 91%, 99%, and 110%
of the flow rate at the best efficiency point.
They performed the unsteady numerical
simulations using a recently developed
partially averaged Navier–Stokes (PANS)
turbulence model. They compared the results
obtained during experiment with the
numerical results of the traditionally used
Reynolds-Averaged Navier–Stokes (RANS)
models. They investigated the several
parameters including the pressure recovery
coefficient, mean velocity, and time-averaged
and fluctuating wall pressure. They showed
that RANS and PANS both can predict the
flow behaviour close to the BEP operating
condition.
They concluded that the RANS results deviate
considerably from the experimental data as
the operating condition moves away from the
BEP. They found that the pressure recovery
factor predicted by the RANS model shows
more than 13%and 58% over prediction when
the flow rate decreases to 91% and 70% of the
flow rate at BEP, respectively. They stated
that the predictions can be improved
significantly using the present unsteady
PANS simulations. They predicted the
pressure recovery factor by less than 4 % and
6% deviation for these two operating
conditions.
Guo, et al., (2017) analysed the formation and
inevitability of diversified hydraulic
phenomena on model efficiency hill chart for
typical head range. They discussed and
summarized characteristics and commonness
toward the curves by comparing.
Furthermore, they presented the hydraulic
performance and geometric features by
analysing the efficiency hill charts. They
summarised that the inherent characteristics
of Francis turbine is expressed by all kinds of

Int.J.Curr.Microbiol.App.Sci (2020) 9(7): 1020-1036
1023
curves on the model efficiency hill charts, and
these curves can be adjusted and moved in a
small range but cannot be removed out. They
observed the incipient cavitation curve on
suction side due to wide range of unit speed in
terms of medium-low-head hydraulic turbines
and they recommended to position close to
the operation zone. They concluded that the
blade channel vortex curves are in the vicinity
of optimum region for low-head hydraulic
turbines, while high-head shows reverse
trend. They inferred that the interaction
between zero incidence angle and zero
circulation curve has a significant influence
on iso-efficiency circles.
Shanab et al., (2017) carried out the
performance test on the test rig of a Francis
turbine for various gate opening of the turbine
in the Fluid Mechanics laboratory at
Mechanical Engineering Department
manufactured by Gilbert Gilkes and Gordon
Ltd, representing a Francis turbine hydro
power plant model. They concentrated their
study with focus on the characteristics of the
Francis turbine model. They numerical
implemented the results for the test rig to get
dedicated values of the six partial coefficients
of the Francis Turbine test rig that used for
control studies. They compared the partial
coefficients with ideal model values. They
upgraded the manual test rig to control the
measurements automatically. They developed
the variables measurement technology of the
turbine and implemented by using Lab VIEW
software interface.
Teressa et al., (2018) conducted test on
Francis turbine to know their dead-on
behaviour under varying conditions in Fluid
Mechanics and Hydraulics Machines
Laboratory, Koneru Lakshmaih Education
Foundation, India. They plotted the results
obtained graphically and developed the
constant head or constant speed
characteristics curve. They focused mainly on
the experimental analysis to get actual
performance characteristics curves. They
carried out the entire experiment in the
Laboratory maintaining the constant head and
gate opening. They measured the BHP
automatically by eddy dynamometer. They
plotted the curves between unit discharge and
unit speed for Francis turbine. They found the
rising curves between unit discharge and unit
speed. They observed the increasing
discharge with the increase in speed. Finally,
they calculated overall efficiency of turbine
along with percentage of full load.
Abas and Kumar (2019) performed the in-situ
calibration of different measuring instruments
viz. flow meter, measuring tank load cells,
calibrator tank load cell, shaft
torque transducer, friction torque load cell and
speed transducer used in turbine model testing
and derived the calibration equations from
their calibration curves. They adopted the
gravimetric approach using the flying start
and stop method for flow calibration in
present study.
They evaluated the Type A and Type B
uncertainties of weighing balance and flow
diverter has been evaluated and conducted the
performance test on the model and efficiency
as well as others flow parameters viz.
discharge, head, speed and torque have been
obtained at 16 different operating points
including finding out Type A uncertainty in
efficiency measurement. They calculated the
regression error for Type A and Type B
uncertainties at each operating point in order
to find out total uncertainty of flow and
performance parameters. They found out
minimum of total uncertainty in flow
measurement and efficiency measurement at
the best efficiency point when compared with
other operating points. They developed a
correlation for the estimation of uncertainty in
the efficiency measurement with an error of
± 9 %.

Int.J.Curr.Microbiol.App.Sci (2020) 9(7): 1020-1036
1024
Materials and Methods
Experimental site and setup
The experiment was conducted in the
Hydraulic Lab of the College of Agricultural
Engineering, Dr. Rajendra Prasad Central
Agricultural University, Pusa. The place,
Pusa is situated on the bank of the river
BurhiGandak in the Samastipur district of
North Bihar, India. It has a latitude of 25o
29'
North, a longitude of 83o 48' East and situated
at an altitude of 53.0 meter above mean sea
level. Pusa is endowed with fair climate
having average annual rainfall of around 1200
mm.
The set up consists a centrifugal pump in built
with the rig, a venturimeter attached in
concentric with the discharge pipe, turbine
unit and sump tank arranged in such a way
that the whole unit works as re-circulating
water system. The centrifugal pump supplies
water from the sump to the turbine through
the venturimeter unit.
The load of the turbine was achieved by rope
brake drum connected with weight balance.
The flow of water through the pipe line that
creates pressure for the turbine, was measured
with the help of the venturimeter unit (Fig. 1).
Components of the francis turbine test rig
prime mover
A centrifugal pump attached with a 5 HP
electric motor as prime mover, supplies water
for the turbine at a rated pressure head of 18.0
m and at a speed of 2870 RPM.
Venturimeter
A venturimeter of size 40 mm is fitted
concentric with the discharge pipe of 80 mm
size that carries water to the turbine, was used
to measure the water flow rate. The pressure
drop across the venturimeter was measured
with the help of a U-tube differential
manometer, attached with the rig.
Butterfly valve
A Butterfly valve fitted in pipeline of the rig
was used to stop, regulate, and start the flow
in the pipeline. The valve has a disc which is
mounted on a rotating shaft. When the
butterfly valve is fully closed, the disk
completely blocks the line and vice-versa.
Pressure gauge and vacuum gauge
Mechanical pressure gauge and vacuum
gauge fitted at inlet and outlet side of the
turbine, respectively were used to measure the
pressure head of water flow. Both the
mechanical and vacuum gauges are capable to
record the pressure up to 4.0 Kg/cm2 and 1.03
Kg/cm2
(760 mm of Hg), respectively.
Break drum
A break drum of 200 mm size mounted on the
runner’s shaft of the turbine was used to
develop torque on the turbine. A spring
balance, a type of weighing scale connected
with one end of a 10 mm round size of a rope
was used to measure the load applied on the
runner. A hanger of 0.5 Kg connected with
the other end of the rope was used to measure
the load applied on the runner.
Spiral casing
The water enters from the penstock (pipeline
leading to the turbine from the reservoir at
high altitude) to a spiral casing called volute
which completely surrounds the runner of the
turbine fitted horizontally. The cross-sectional
area of this casing decreases uniformly along
the circumference to keep the fluid velocity
constant in magnitude along its path towards
the stay vane.

Int.J.Curr.Microbiol.App.Sci (2020) 9(7): 1020-1036
1025
This is so because the rate of flow along the
fluid path in the volute decreases due to
continuous entry of the fluid to the runner
through the openings of the stay vanes.
Stay vanes
Water flow is directed toward the runner by
the stay vanes as it moves along the spiral
casing, and then it passes through the wicket
gates where a part of pressure energy is
converted into kinetic energy. The wicket
gates impart a tangential velocity and hence
an angular momentum to the water before its
entry to the runner.
Runner
It is the main part of the turbine that has
blades on its periphery. During operation,
runner rotates and produces power. The flow
is inward, i.e. from the periphery towards the
centre. The main direction of flow changes as
water passes through the runner and is finally
turned into the axial direction while entering
the draft tube.
Draft tube
The draft tube is a conduit which connects the
runner exit to the tail race where the water is
finally discharged to the sump tank from the
turbine. The primary function of the draft tube
is to reduce the velocity of the discharged
water to minimize the loss of kinetic energy at
the outlet. After passing through the runner,
the flow of water at high speed enters an
expanding area (diffuser) called draft tube,
which slows down the flow speed, while
increasing the pressure prior to discharge into
the downstream water.
Determination of water flow rate
The flow rate of water, Q (m3/sec) through the
pipe line into the turbine was determined with
the help of venturimeter by using following
equation :
… (1)
Where, Cd is the co-efficient of discharge(0.96
for venturimeter), a1 is the cross sectional
area of pipeline (m2),a2 is the cross sectional
area of throat of the venturimeter (m2), g is
the acceleration due to gravity(9.8 m/sec2)
and h is the pressure difference between the
throat of the venturimeter and the pipe line
which was computed as follows :
… (2)
Where, h is the pressure drop across the
venturimeter (m of water), y is equal to h1 –
h2 (m of mercury), SHg is the specific gravity
of mercury and SW is the specific gravity of
water.
Determination of total head
The available total head, H (m of water) for
the turbine was determined after the losses in
pressure when water flow through the
waterways using the following equation :
… (3)
Where, P is the turbine inlet gauge pressure
(kg/cm2) and V is the turbine vacuum
gauge pressure (kg/ cm2)
Computation of input power
The input power supplied at the inlet of
turbine was determined by using the equation
mentioned as under:
… (4)

Int.J.Curr.Microbiol.App.Sci (2020) 9(7): 1020-1036
1026
Where, PI is the input power available to run
the turbine (HP), H is the total head(m)and
is the density of water (1000 at normal
temperature).
Calculation of torque
The torque applied on the runner of the
turbine through the break drum was
determined with the help of the equation
given below :
T = (T0 + T1 - T2) × D … (5)
… (6)
Where, T is the torque applied on the turbine
(N m),T0 is the weight of hanger (Kg), T1 is
the weight applied on hanger (Kg), T2 is the
spring load (Kg), d1 is the diameter of break
drum (m), d2 is the diameter of rope (m) and
D is the equivalent diameter (m).
Determination of output power
The output power, Po (HP) developed by the
turbine was computed using the equation
mentioned below :
… (7)
Where, N is the revolution of the turbine per
minute (RPM) which was measured by using
the digital tachometer operated with 9 volt
DC battery.
Computation of efficiency
The ability of the hydraulic turbine to transmit
the potential energy by rotation is known as
the efficiency of the turbine, (per cent)
which was computed as:
… (8)
Computation of unit discharge, unit speed
and unit power
If a turbine is working under different heads,
the behaviour of the turbine can be
characterised easily from the unit quantities
such as unit discharge (QU), unit speed (NU)
and unit power(PU)of the turbine which
provide the speed, discharge and power for a
Francis turbine under a pressure head of 1
meter assuming the same efficiency. These
unit quantities can be expressed as follows :
…(9)
… (10)
… (11)
Results and Discussion
Computation of discharge and input power
developed at different loads and heads
The Francis turbine was operated at constant
heads of 7.68 m, 9.09 m and 10.22 m of water
and at applied loads ranging from 0 to 7.0 kg,
0 to 5.0 kg and 0 to 4.0 kg, respectively. The
constant heads at particular loads applied to
develop the torque on the runner of the
turbine were maintained through the gate
valve during the operation of the turbine. The
pressure drop across the venturimeter was
recorded with the help of U-tube manometer.
Thus, the water flow rate through the pipe line
and the input power developed by the turbine
at various loads and constant head of 7.68 m
of water were computed with the help of Eq.
Nos. (1) and (4), respectively and presented in
Table 1 which clearly shows that at no load
and maximum applied load of 7.0 kg, the

Int.J.Curr.Microbiol.App.Sci (2020) 9(7): 1020-1036
1027
water flow rate of 4.80 × 10⁻³
m3/sec and
5.185 × 10⁻³
m3/sec, respectively were
observed while the highest water flow rate of
6.500 × 10⁻³
m3/sec at applied load of 3.0 kg
and 4.0 kg was found at constant head of 7.68
m of water. On the other hand, the input
power of 0.524 HP at no load and that of
0.485 HP at maximum applied load of 7.0 kg
were noticed whereas the maximum input
power of 0.656 HP at applied loads of 3.0 kg
and 4.0 kg were found during the operation of
the turbine at constant head of 7.68 m of
water. Table 1 also reveals that the pressure
drop across the venturimeter fitted in
concentric with the pipe line was recorded as
0.756 m of water at no load and 0.882 m of
water at maximum load of 7.0 kg whereas it
was observed to be maximum of 1.386 m of
water at loads of 3.0 kg and 4.0 kg at constant
head of 7.68 m of water.
Similarly, the water flow rate and the input
power developed by the turbine at various
loads ranging from 0 to 5.0 kg at constant
head of 9.09 m and from 0 to 4.0 kg at
constant head of 10.22 m of water were
computed and presented in tables 2 and 3,
respectively. Table 2 depicts that the
minimum discharge of 4.80 × 10⁻³
m3/sec and
that of 6.040 × 10⁻³
m3/sec were observed at
no load and maximum load of 5.0 kg,
respectively however, the maximum
discharge of 6.646 × 10⁻³
m3/sec was found at
applied load of 3.0 kg and at constant head of
9.09 m of water.
Table 2 also shows the input power of 0.574
HP and 0.722 HP at no load and at maximum
applied load of 5.0 kg, respectively while the
maximum input power of 0.794 HP was
obtained at applied load of 3.0 kg during the
operation of the turbine at a constant head of
9.09 m of water. The pressure drop of 0.756
m and 1.197 m of water at no load and at
maximum load of 5.0 kg, respectively were
depicted whereas it was maximum of 1.386 m
of water at load of 4.0 kg at constant head of
9.09 m of water. Similar trend of water flow
rate through the pipe line of the turbine,
pressure drop across the venturimeter and
input power of the turbine were observed at
constant head of 10.22 m of water.
The pressure drop was found to be 0.756 m
and 0.907 m of water at no load and at
maximum load of 4.0 kg, respectively
whereas the maximum pressure drop of 1.134
m of water at applied load of 3.0 kg was
observed at constant head of 10.22 m of
water. Moreover, at no load and maximum
applied load of 4.0 kg, the water flow rate of
4.80 × 10⁻³
m3/sec and 5.259 × 10
-3 m
3/sec,
and the input power of 0.645 HP and 0.707
HP, respectively were observed however, at
applied load of 3.0 kg the maximum
discharge of 5.879 × 10⁻³
m3/sec and the
maximum input power of 0.790 HP were
observed at constant head of 10.22 m of water
(Table 3).
The water flow rate through the pipe line of
the turbine at different loads applied and at
constant heads of 7.68 m, 9.09 m and 10.22 m
of water were graphically presented in Fig. 2.
Fig. 2 distinctly shows the variation in water
flow rate with the loads applied at constant
heads of 7.68 m, 9.09 m and 10.22 m of
water. Peak value of water flow rate was
observed between 3.0 kg and 4.0 kg of loads
applied while minimum value of water flow
rate was found at both the end i.e. at no load
and at maximum load of 7.0 kg at constant
head of m7.68 m of water. Similar trend in
water flow rate at applied loads from 0 to 5.0
kg at constant head of 9.09 m and that from 0
to 4.0 kg at constant head of 10.22 m of water
was observed (Fig. 2).
Tables 1, 2 and 3 and Fig. 2 infer that the
minimum water flow rate of 4.80 × 10⁻³
m3/sec through the pipe line of the turbine
were found at no load operating under

Int.J.Curr.Microbiol.App.Sci (2020) 9(7): 1020-1036
1028
constant head of 7.68 m of water. However,
peak discharge of 6.500 × 10⁻³
m3/sec at
constant head of 7.68 m, 6.646 × 10⁻³
m3/sec
at constant head of 9.09 m and 5.879 × 10⁻³
m3/sec at constant head of 10.22 m of water
operating under same applied load of 3.0 kg
were achieved. Tables and figure depicted the
highest input power of 0.656 HP, 0.794 HP
and 0.790 HP of the turbine operating at the
same applied load of 3.0 kg at constant heads
of 7.68 m, 9.09 m and 10.22 m of water,
respectively. It was observed that as the loads
applied increases, the water flow rate and
input power of the turbine increases and
reaches up to the peak and then decreases at
constant head of the turbine.
Determination of turbine characteristics at
different loads and constant heads
The loads were applied to develop the torque
on the runner of the turbine during its
operation. The torques, output power and
efficiency of the turbine at various loads
applied ranging from 0 to 7.0 kg at constant
head of 7.68 m, 0 to 5.0 kg at constant head of
9.09 m and 0 to 4.0 kg at constant head of
10.22 m of water were determined with the
help of Eq. Nos. (5), (7) and (8), and
presented in Tables 4, 5 and 6, respectively.
Table 4 distinctly shows the minimum torque
of 0.033 kg-m and maximum of 0.66 kg-m at
no load and at maximum applied load of 7.0
kg, respectively. The speed of the runner of
the turbine was found to be maximum (1222
RPM) and minimum (30 RPM) at no load and
at maximum applied load of 7.0 kg,
respectively. The minimum output power of
0.028 HP followed by 0.082 HP were
developed by the turbine at no load and at
applied load of 6.0 kg, respectively while
maximum power of 0.212 HP was found at
applied load of 4.0 kg. As far as the efficiency
of the turbine is concerned, it was minimum
of 2.64 % at applied load of 7.0 kg followed
by 5.82 % at no load applied whereas it was
maximum of 32.23 % at applied load of 4.0
kg on the runner of the turbine at constant
head of 7.68 m of water (Table 4).
Similarly, the minimum and maximum torque
of 0.033 kg-m and 0.534 kg-m were observed
at no load and at maximum applied load of
5.0 kg whereas maximum speed of 1400 RPM
at no load and minimum speed (620 RPM) of
the runner of the turbine at maximum load of
5.0 kg were recorded. The output power
developed by the turbine was found to be
minimum of 0.033 HP at no load and
maximum of 0.534 HP at maximum applied
load of 5.0 kg at constant head of 9.09 m of
water. As far as the efficiency of the turbine is
concerned, the maximum efficiency was
observed to be 39.09 % at applied load of 4.0
kg whereas that of minimum was found to be
5.18 % at no load and at constant head of 9.09
m of water (Table 5).
Table 6 shows that the minimum and
maximum torque developed were found to be
0.033 kg-m at no load and 0.451 kg-m at
maximum applied load of 4.0 kg whereas the
maximum and minimum speed of the runner
of the turbine were observed to be 1750 RPM
at no load and 900 RPM at maximum applied
load of 4.0 kg and at constant head of 10.22 m
of water. However, the minimum and
maximum output power developed by the
turbine and its efficiency were computed as
0.042 HP and 6.56 % at no load and 0.266 HP
and 37.56 % at full load of 4.0 kg and at
constant head of 10.22 m of water (Table 6).
The torque developed on the runner of the
turbine and it speed were graphically
presented in Fig, 3 to show the relationship
between torque and speed of the runner of the
turbine. Fig. 3 distinctly shows the inverse
relationship i.e. negative trend between the
torque and speed of the runner at constant
head of 7.07 m, 9.09 m and 10.22 m of water.
The excellent correlation between torque

Int.J.Curr.Microbiol.App.Sci (2020) 9(7): 1020-1036
1029
generated by the loads applied on the runner
of the turbine and its speed were found to be
99.87 % at constant head of 7.68 m and 9.09
m of water and 99.80 % at constant head of
10.22 m of water.
Table 4, 5, 6 and Fig. 3 distinctly revealed the
inverse relationship between the torque
developed due to the application of loads and
the speed of the runner of the turbine
operating at constant head. The excellent
correlation between torque generated and
speed were found to be 99.87 % at constant
head of 7.68 m and 9.09 m of water and 99.80
% at constant head of 10.22 m of water. It
was observed that as the load applied
increases the torque developed increases but
at the same time speed of the runner of the
turbine decreases. Tables show that as the
application of loads increases, the output
power developed by the turbine increases and
reaches up to the peak values of 0.212 HP at
load 4.0 kg, 0.534 HP at load 5.0 kg and
0.277 HP at load 3.0 kg at constant heads of
7.68 m, 9.09 m and 10.22 m of water,
respectively and then decreases. Similarly, as
loads applied increases, the efficiency of the
turbine increases and reaches up to the
maximum values of 32.23 %, 39.09 % and
37.56 at the same value of load 4.0 kg and at
constant heads of 7.68 m, 9.09 m and 10.22 m
of water, respectively and then decreases.
Unit quantities and characteristics of the
francis turbine
The unit quantities such as unit discharge,
unit power and unit speed were calculated
with the help of eqs. (9), (10) and (11),
respectively to study the behaviour of the
turbine working under different heads and
presented in Table 7 which clearly indicates
that the minimum unit discharge of 1.732 ×
10-3
followed by 1.871 × 10⁻³
m3/sec per
meter head of water at no load and at
maximum load were detected while the
maximum and the minimum unit speed of the
runner of 441 RPM and 11 RPM per meter
head of water were observed at no load and
full load, respectively.
However, the maximum unit discharge of
2.345 × 10⁻³
m3/sec per meter head of water
was found at applied load of 4.0 kg at
constant head of 7.68 m of water. The
minimum unit power of 0.132 HP per m head
at no load was found while the maximum unit
power of 0.996 HP per m head of water at a
load of 4.0 kg was observed at constant head
of 7.68 m of water (Table 7). Similarly, the
minimum values of unit discharge of 1.592 ×
10-3
and 1.501 × 10⁻³
m3/sec per meter head at
no load and at constant head of 9.09 m and
10.22 m of water, respectively were observed
whereas the maximum values of unit
discharge of 2.204 × 10⁻³
and 1.839 × 10⁻³
m3/sec per meter head at a load of 3.0 kg and
at constant head of 9.09 m and 10.22 m of
water, respectively were detected. However,
the minimum input power of 0.120 HP and
0.153 HP per m head of water at no load were
obtained while the maximum power of 1.948
HP at full load and 1.011 HP per m head at
load of 3.0 kg were observed at constant head
of 9.09 m and 10.22 m of water, respectively
(Table.7).
The scatter plots between the unit discharge
and the unit speed at constant heads of 7.68
m, 9.09 m, and 10.22 m of water were plotted
and shown in Fig. 4.
The Fig 4 depicts that the unit discharge
increases and reaches up to a peak then
decreases with increasing values of unit speed
at constant head of 7.68 m of water. Similar
trend following the parabolic line was
observed at constant head of 9.09 m and
10.22 of water. The scatter plot between the
unit power and unit speed and the efficiency
and unit speed of the turbine operating at
constant heads of 7.68 m, 9.09 m, and 10.22

Int.J.Curr.Microbiol.App.Sci (2020) 9(7): 1020-1036
1030
m of water were plotted and shown in Figs. 5
and 6, respectively. The Fig 5 shows the
increasing trend of unit power with increasing
values of unit speed at constant heads of 7.68
m, 9.09 m, and 10.22 m of water. After
reaching up to maximum unit power of 0.010
HP and 0.011 HP at unit speed of 279 RPM
and 231 RPM at constant head of 7.68 m and
9.09 m of water, respectively it start declining
following a parabolic line.
Maximum unit power was obtained at
constant head of 10.22 m while the minimum
power was found at constant head of 9.09 m
of water (Fig 5). Similarly, Fig. 6 showed the
increasing trend of efficiency (%) with
increasing unit speed (RPM) but after
reaching maximum efficiency it started
decreasing with increasing unit speed
following the similar pattern of parabolic line.
The maximum efficiency obtained was 32.23
% at unit head of 231 RPM and at constant
head of 9.09 m however it was maximum of
39.09 % at unit speed of 279 RPM and at
constant head of 9.09 m of water. Whereas,
the maximum efficiency of 37.00 % at unit
speed of 281 RPM and at constant head of
10.22 m of water was observed (Fig. 6).
The characteristics curves of the test rig to
study the behaviour and performance
characteristics of the rig working at various
loads under constant head of 7.68 m of water
were prepared and presented in Fig. 7. The
discharge and torque of the rig was plotted on
primary ordinate and the efficiency and power
developed at secondary ordinate while speed
was taken on abscissa. The efficiency and the
power of the rig increases with increase in
speed and after reaching up to maximum it
decreases with further increase in speed
following a parabolic pattern. Although, the
torque was found to be inversely related with
speed of the turbine. It decreases with
increase in speed of the turbine. Increasing
trend in water flow rate through the pipe line
of the rig was observed at constant head of
7.68 m of water.
Table.1 Computation of water flow rate and input power of the rig operating at different loads
and constant head of 7.68 m
Load
applied
(Kg)
Level of water in
manometer (m)
Pressure drop
(m of water)
Discharge(×10-3
)
(m3/ sec)
Input
power
(HP) Left limb Right limb
0.0 0.190 0.130 0.756 4.800 0.524
1.0 0.187 0.120 0.844 5.073 0.524
2.0 0.190 0.110 1.008 5.543 0.574
3.0 0.200 0.090 1.386 6.500 0.656
4.0 0.200 0.090 1.386 6.500 0.656
5.0 0.187 0.103 1.058 5.680 0.560
6.0 0.180 0.110 0.882 5.185 0.512
7.0 0.180 0.110 0.882 5.185 0.485

Int.J.Curr.Microbiol.App.Sci (2020) 9(7): 1020-1036
1031
Table.2 Computation of water flow rate and input power of the rig operating at different loads
and constant head of 9.09 m
Load
applied
(Kg)
Level of water in
manometer (m)
Pressure drop
(m of water)
Discharge(×10-3
)
(m3/ sec)
Input
power
(HP) Left limb Right limb
0.0 0.190 0.130 0.756 4.800 0.574
1.0 0.190 0.120 0.882 5.190 0.620
2.0 0.190 0.110 1.008 5.543 0.662
3.0 0.210 0.095 1.449 6.646 0.794
4.0 0.210 0.100 1.386 6.500 0.777
5.0 0.200 0.105 1.197 6.040 0.722
Table.3 Computation of water flow rate and input power of the rig operating at different loads
and constant head of 10.22 m
Load applied
(Kg)
Level of water in
manometer (m)
Pressure drop
(m of water)
Discharge(×10-3
)
(m3/ sec)
Input
power
(HP)
Left limb Right limb
0.0 0.170 0.110 0.756 4.800 0.645
1.0 0.180 0.116 0.806 4.958 0.667
2.0 0.200 0.114 1.084 5.747 0.773
3.0 0.200 0.110 1.134 5.879 0.790
4.0 0.190 0.118 0.907 5.259 0.707
Table.4 Computation of rig characteristics at different loads and constant head of 7.68 m
Load applied
(kg)
Spring load
(kg)
Torque
(kg-m)
Speed
(RPM)
Output power
(HP)
Efficiency
(%)
0.000 0.200 0.033 1222 0.028 5.82
1.000 0.250 0.138 1065 0.102 19.96
2.000 0.300 0.242 870 0.174 31.16
3.000 0.350 0.347 740 0.206 31.34
4.000 0.450 0.446 640 0.212 32.23
5.000 1.400 0.451 450 0.183 31.96
6.000 1.450 0.556 190 0.082 15.56
7.000 1.500 0.660 30 0.138 2.64

Int.J.Curr.Microbiol.App.Sci (2020) 9(7): 1020-1036
1032
Table.5 Computation of rig characteristics at different loads and constant head of 9.09 m
Load applied
(kg)
Spring load
(kg)
Torque
(kg-m)
Speed
(RPM)
Output power
(HP)
Efficiency
(%)
0.0 0.200 0.033 1400 0.033 5.18
1.0 0.250 0.138 1280 0.123 19.84
2.0 0.300 0.242 1160 0.242 30.23
3.0 0.350 0.347 1050 0.347 31.08
4.0 0.450 0.446 840 0.446 39.09
5.0 0.650 0.534 620 0.534 32.00
Table.6 Computation of rig characteristics at different loads and constant head of 10.22 m
Load applied
(kg)
Spring load
(kg)
Torque
(kg-m)
Speed
(RPM)
Output power
(HP)
Efficiency
(%)
0.0 0.200 0.033 1750 0.042 6.56
1.0 0.250 0.138 1540 0.155 23.21
2.0 0.300 0.242 1370 0.216 27.89
3.0 0.350 0.347 1145 0.277 35.05
4.0 0.400 0.451 900 0.266 37.56
Table.7 Determination of unit quantities of the rig at different loads and constant head
Load
Applied
(kg)
Constant Head of
7.68 m
Constant Head of
9.09 m
Constant Head of
10.22 m
QU* IPU** NU*** QU* IPU** NU*** QU* IPU** NU***
No load 1.732 0.133 441 1.592 0.109 464 1.501 0.130 547
1.000 1.830 0.481 384 1.592 0.449 425 1.551 0.473 482
2.000 2.000 0.820 314 1.839 0.731 385 1.797 0.659 428
3.000 2.345 0.966 267 2.205 0.901 348 1.839 0.848 358
4.000 2.345 0.994 231 2.156 1.108 279 1.645 0.812 281
5.000 2.050 0.861 162 2.004 0.843 206 ˗ ˗ ˗
6.000 1.871 0.383 69 ˗ ˗ ˗ ˗ ˗ ˗
7.000 1.871 0.065 11 ˗ ˗ ˗ ˗ ˗ ˗
* Unit discharge (× 10-3
), m3/sec per m of head, ** Unit input power (× 10
-2), HP per m of head
*** Unit speed, RPM per m of head

Int.J.Curr.Microbiol.App.Sci (2020) 9(7): 1020-1036
1033
Fig.1 The schematic diagram of complete set-up of Francis turbine test rig
Fig.2 Water flow rate through the pipe line of the rig at different loads and heads of water
Fig.3 Variation in torque and speed of the test rigat different loads and heads of water

Int.J.Curr.Microbiol.App.Sci (2020) 9(7): 1020-1036
1034
Fig.4 Variation in unit discharge and unit speed of rig at different loads and constant heads
Fig.5 Variation in unit power and unit speed of the rig at different loads and constant heads
Fig.6 Variation in efficiency and unit speed of the rig at different loads and constant head
Int.J.Curr.Microbiol.App.Sci (2020) 9(7): 1020-1036
1035
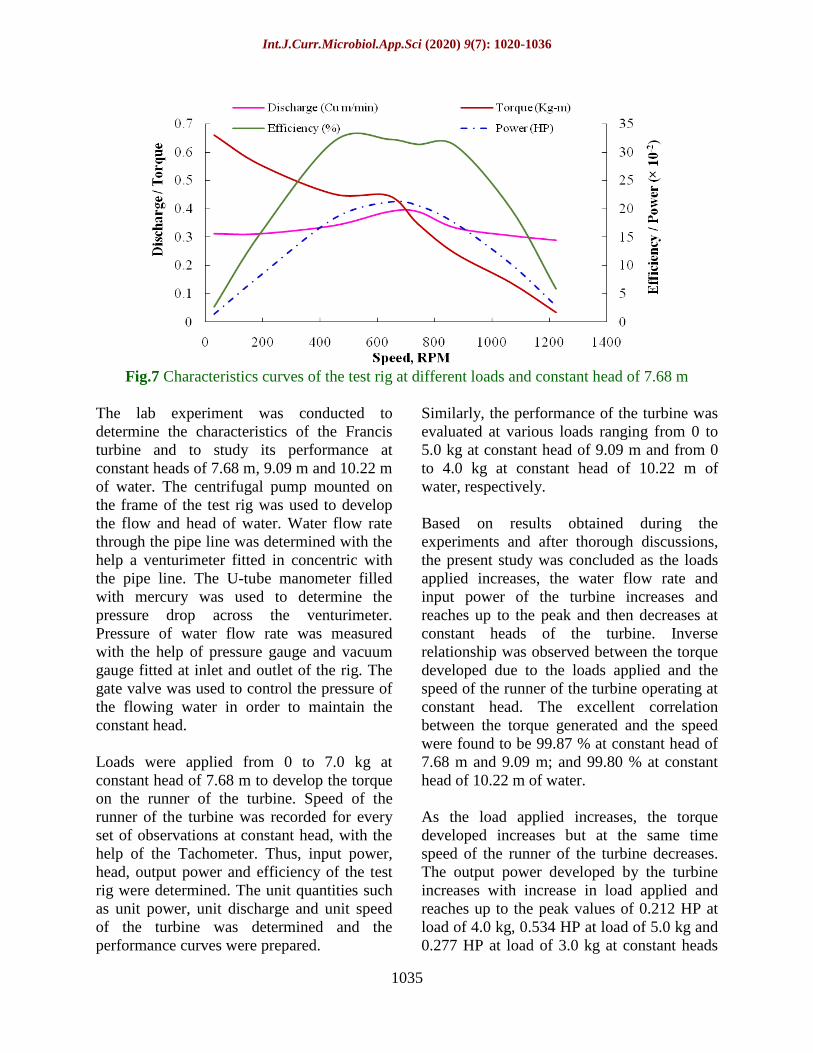
Fig.7 Characteristics curves of the test rig at different loads and constant head of 7.68 m
The lab experiment was conducted to
determine the characteristics of the Francis
turbine and to study its performance at
constant heads of 7.68 m, 9.09 m and 10.22 m
of water. The centrifugal pump mounted on
the frame of the test rig was used to develop
the flow and head of water. Water flow rate
through the pipe line was determined with the
help a venturimeter fitted in concentric with
the pipe line. The U-tube manometer filled
with mercury was used to determine the
pressure drop across the venturimeter.
Pressure of water flow rate was measured
with the help of pressure gauge and vacuum
gauge fitted at inlet and outlet of the rig. The
gate valve was used to control the pressure of
the flowing water in order to maintain the
constant head.
Loads were applied from 0 to 7.0 kg at
constant head of 7.68 m to develop the torque
on the runner of the turbine. Speed of the
runner of the turbine was recorded for every
set of observations at constant head, with the
help of the Tachometer. Thus, input power,
head, output power and efficiency of the test
rig were determined. The unit quantities such
as unit power, unit discharge and unit speed
of the turbine was determined and the
performance curves were prepared.
Similarly, the performance of the turbine was
evaluated at various loads ranging from 0 to
5.0 kg at constant head of 9.09 m and from 0
to 4.0 kg at constant head of 10.22 m of
water, respectively.
Based on results obtained during the
experiments and after thorough discussions,
the present study was concluded as the loads
applied increases, the water flow rate and
input power of the turbine increases and
reaches up to the peak and then decreases at
constant heads of the turbine. Inverse
relationship was observed between the torque
developed due to the loads applied and the
speed of the runner of the turbine operating at
constant head. The excellent correlation
between the torque generated and the speed
were found to be 99.87 % at constant head of
7.68 m and 9.09 m; and 99.80 % at constant
head of 10.22 m of water.
As the load applied increases, the torque
developed increases but at the same time
speed of the runner of the turbine decreases.
The output power developed by the turbine
increases with increase in load applied and
reaches up to the peak values of 0.212 HP at
load of 4.0 kg, 0.534 HP at load of 5.0 kg and
0.277 HP at load of 3.0 kg at constant heads

Int.J.Curr.Microbiol.App.Sci (2020) 9(7): 1020-1036
1036
of 7.68 m, 9.09 m and 10.22 m of water,
respectively and then decreases. The
efficiency of the turbine increases and reaches
up to the maximum values of 32.23 %, 39.09
% and 37.56 % at the same value of load of
4.0 kg and at constant heads of 7.68 m, 9.09
m and 10.22 m of water, respectively and then
decreases.
Acknowledgement
Authors thankfully acknowledged the College
of Agricultural Engineering, Pusa, 848125,
Dr.Rajendra Prasad Central Agricultural
University, Pusa, (Bihar) India.
References
Aakti, B., Amstutz, O., Casartelli, E.,
Romanelli, G. and Mangani, L. (2015).
On the performance of a high head
Francis turbine at design and off-design
conditions. Journal of Physics:
Conference Series579 :012010
(doi:10.1088/1742-6596/579/1/012010).
Abas, A. and Kumar, Anil (2019). Evaluation
of uncertainty in flow and performance
parameters in Francis turbine test
rig.Flow Measurement and
Instrumentation. 65 : 297 – 308.
Christophe, N., Jorge, A. and François, A.
(2004). Identification and modeling of
pressure fluctuations of a Francis
turbine scale model at part load
operation. Proceedings of the 22nd
IAHR Symposium on Hydraulic
Machinery and Systems, Stockholm,
Sweden, 1, 1-17.
(https://infoscience.epfl.ch/record/5906
1?ln=en).
Foroutan, H. and Yavuzkurt, S. (2015).
Unsteady numerical simulation of flow
in draft tube of a hydro-turbine
operating under various conditions
using a partially averaged Navier–
Stokes model. Journal of Fluids
Engineering, 137 : 1-13 (DOI:
10.1115/1.4029632).
Lewis, B.J., Cimbala, J.M. and Wouden,
A.M. (2014). Major historical
developments in the design of water
wheels and Francis hydroturbines. 27th
IAHR Symposium on Hydraulic
Machinery and Systems (IAHR 2014).
(doi:10.1088/1755-1315/22/1/012020).
Mishra, M.K., Khare, N. and Agrawal, A.B.
(2015). Small hydro power in India:
Current status and future
perspectives, Renewable and
Sustainable Energy Reviews, 51 : 101-
115.
Shanab, B.H., Elrefaie, M.E. and El-Badawy,
A.A. (2017). Francis turbine prototype
testing and generation of performance
curves. Journal of Al Azhar University
Engineering Sector, 12 (45): 1341-
1350.
Teressa, T., Visal, G.G., Ram, P.S. and
Kumar, M.S. (2018). Experimental
analysis on Francis turbine at full load
to determine the performance
characteristics curves. International
Journal of Mechanical Engineering and
Technology, 9 (2) : 663–669.
How to cite this article:
Satyam Murari and Sudarshan Prasad. 2020. Numerical Evaluation of Francis Turbine Test Rig
at Different Loads. Int.J.Curr.Microbiol.App.Sci. 9(07): 1020-1036.
doi: https://doi.org/10.20546/ijcmas.2020.907.120