not your grandfather’s
TRANSCRIPT

Not Your Grandfather’s MPO
Steve HemingerExecutive Director, MTC
Transportation Research BoardADA 20 Committee, Metropolitan Policy,
Planning and Processes
January 2015

Image Source: http://www.flickr.com/photos/mikebehnken/5114308350/sizes/l/
Metropolitan Transportation Commission
Metropolitan Planning Organization for the San Francisco Bay Area 9 counties, 12 urbanized areas,
101 cities and towns
Population ~7 million
Served by 27 independent transit operators
2

Three Agencies in One
MTC — Created by the Legislature in 1971. Planner, coordinator, manager and banker. Administers over $2 billion per year in local, state and federal funds for transportation projects and services.
SAFE — Created by the Legislature in 1988. Oversees the region’s network of call boxes and the Freeway Service Patrol. Partners with Caltrans and CHP on Freeway Incident Management.
BATA — Created by the Legislature in 1998, BATA is responsible for managing and investing the toll revenues from the seven state-owned toll bridges. BATA also has joint oversight of the Toll Bridge Seismic Retrofit Program (with Caltrans and the California Transportation Commission).
3

One Bay Area Grants Overview:
Funded by STP/CMAQ
Incentive-based program to reward jurisdictions that produce housing near transit and create healthy communities
Uses federal transportation dollars to reward jurisdictions that accept and produce housing
Provides more flexibility on how money can be spent
4

One Bay Area Grant Distribution Formula:FY2012-13 through FY2015-16
5
* RHNA 2014-2022** Housing Production Report 1999-2006, ABAG

Leveraging Flexible Funds: Transit Oriented Affordable Housing Program (TOAH)
$100 million for affordable transit-oriented development
10-year Fund; 5-year origination period
Revolving loan fund for affordable housing, community facilities in Priority Development Areas
MTC investment of $20 million leverages $80 million in funding from foundations, other lenders
6

MTC’s Evolving Operations RoleR
egio
nal P
lann
er
1970s
1990
Regional Services Provider 2000
Ope
ratio
ns P
rogr
am M
anag
erFuture?
Inte
rage
ncy
Coo
rdin
ator
Funder
7

511 Traveler Information
Real-time and predicted traffic
Real-time and static transit
Ridesharing
Bicycling
Real-time and static parking
Breaking news, emergency, and planned event information
8

# Toll Tags / Cards in Circulation 1.8 M 1.7 M
Average Monthly:Calls to CustomerService Center
125,000 29,600
Toll / Transit Revenue Collected $31 M $29 M
Average Weekday Saturation 65% 46%
Average monthly data from January to June 2012
Electronic Payment Program Usage
9

Bay Area Toll AuthoritySeven-Bridge System
Benicia-Martinez BridgeOpened 1962 Widened 1991
Second spanOpened in 2007
10
Antioch BridgeOpened 1926Replaced 1978
San Mateo-Hayward BridgeOpened 1929Replaced 1967Widened 2003
Dumbarton Bridge
Opened 1927 Replaced 1984
CarquinezBridge
Opened 1927, 1958 and 2003
San Francisco-Oakland Bay
Bridge
Opened 1936
New East Span Opened 2013
Richmond-San Rafael
Bridge
Opened 1956

Bay Area Express Lanes
270 miles: 150 miles converted
HOV
120 miles new
11
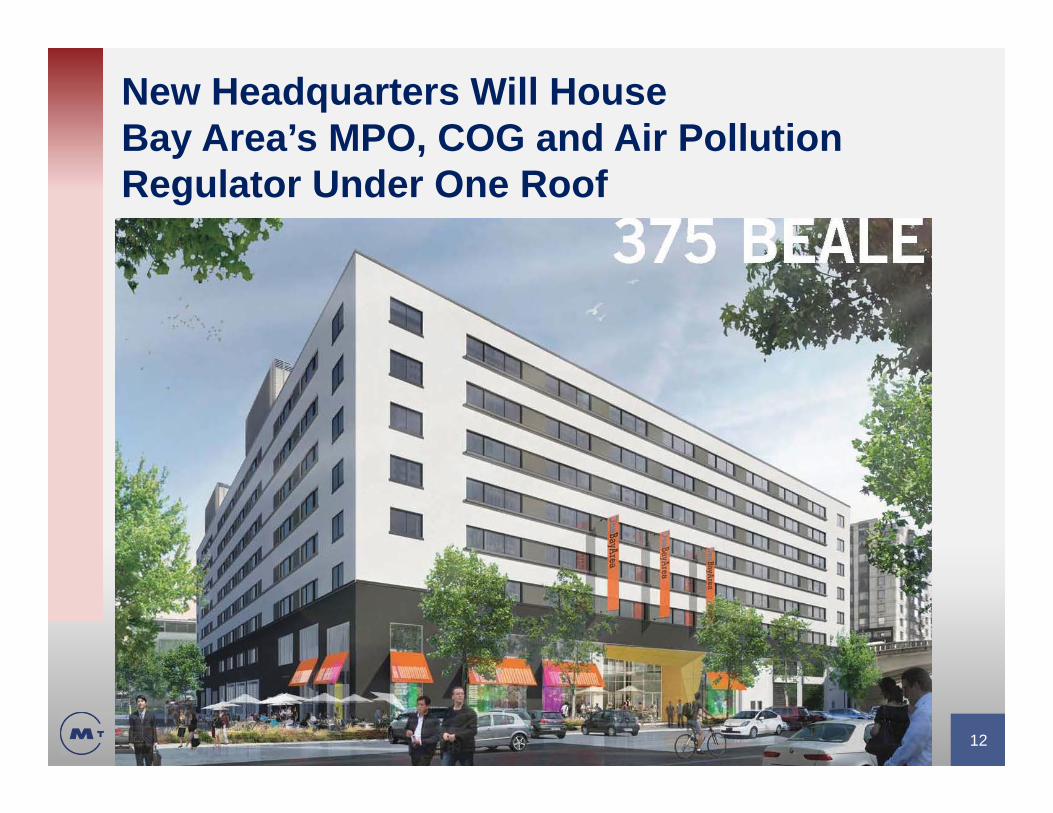
New Headquarters Will House Bay Area’s MPO, COG and Air Pollution Regulator Under One Roof
12