advanced fixed income - etf · advanced fixed income: not your grandfather’s bonds. originally...
TRANSCRIPT

Sponsored by …
Advanced Fixed Income:Not Your Grandfather’s Bonds
Originally PresentedJuly 30, 2009

Sponsored by …
Advanced Fixed Income
Matt HouganEditor‐in‐ChiefIndexUniverse.comETFR
The Myths
The Alternatives
The Opportunities

Sponsored by …
Our Panelists
Tom AndersonHead of Strategy and ResearchState Street Global Advisors
Tim AndersonPartnerChief Fixed Income OfficerRiverfront Investment Group

Sponsored by …
What Is Fixed Income?
Steady Returns
Stable Income
Not Risk Free

Sponsored by …
Fixed Income Is Everywhere
Source: ICI, Bespoke Investment Group
$0
$1,000
$2,000
$3,000
$4,000
$5,000
$6,000
$7,000
1984 2008
$US, Billions
US Mutual Fund Assets by Category (End of Year)
Equity
Money Market
BondHybrid

Sponsored by …
Fixed Income Is Misunderstood
Large‐Cap
Mid‐Cap
Small‐Cap
Growth
Value Intl.
Em. Mkts
Bonds
The Typical View

Sponsored by …
All Bonds Are Not Created Equal
Large‐Cap
Mid‐CapSmall‐Cap
Growth
Value
Intl.
Em. Mkts
US Treasuries
Corporate Bonds
ABS
TIPS
Zero Coupon
Munis
Intl. Bonds
The Real World

Sponsored by …
Broad‐Based Can Be Broad
U.S. Treasury
FNMA
FHLMCUS Agencies
Corp (Industrial)
Corp (Financial)
GNMAOther
Asset Breakdown
0‐1 Year
1‐5 Years
5‐10 Years
Long
Maturity
Inside AGG (6/30/09)

Sponsored by …
All Bonds Are Not Created Equal
Sources: Merrill Lynch, Barclays Capital, Bespoke Investment Group
‐20
0
20
40
60
80
100
120
J‐99 J‐09
Return (%
)
ML U.S. Treasuries, 7‐10 Yrs
BarCap Lehman Aggregate Bond Index
ML Global Government Bond Index II
ML U.S. Corporate Master

Sponsored by …
All Bonds Are Not Created Equal
Index Yield: 6/30/09 ML US High Yield Master II Index 13.06
ML Global Emerging Markets Sovereign & Credit 9.53
ML US ABS & CMBS Index 7.35
ML US Corporate Master 6.15
ML Global Broad Market Corporate Index 5.54
Barclays Capital Aggregate Bond Index 4.16
ML Municipal Master Index 4.13
ML Mortgage Master Index 3.79
ML US Treasuries, 7‐10 Yrs 3.42
ML Global Government Bond Index II 2.36
ML US Treasuries, Inflation‐Linked 1.63
ML Global Governments, Inflation‐Linked 1.57
Sources: Merrill Lynch, Barclays Capital, Bespoke Investment Group

Sponsored by …
5‐Year Risk/ReturnIndex Total Return
Std Dev Monthly Returns
ML Global Emerging Markets Sovereign & Credit 49.64 3.70
ML US Treasuries, 7‐10 Yrs 34.30 1.98
ML Mortgage Master Index 33.88 0.86
Barclays Capital Aggregate Bond Index 27.72 1.05
ML US Treasuries, Inflation‐Linked 27.27 2.11
ML Global Governments, Inflation‐Linked 26.60 1.78
ML Municipal Master Index 23.80 1.43
ML Global Government Bond Index II 22.35 0.88
ML US High Yield Master II Index 22.23 3.72
ML US Corporate Master 19.66 2.03
ML Global Broad Market Corporate Index 16.82 1.41
MSCI EAFE 12.09 5.61
ML US ABS & CMBS Index ‐7.29 1.67
S&P 500 ‐10.72 4.48
S&P GSCI Commodities Index ‐16.09 8.48
Sources: Merrill Lynch, Bloomberg, Bespoke Investment Group

Sponsored by …
Diversification: It Does Exist
Sources: Merrill Lynch, MSCI, Bespoke Investment Group
S&P 500 S&P GSCIBarCap
Agg. Bond
ML US CorporateMaster
ML GlobalGov. Bond
II
ML MunicipalMaster
ML US ABS & CMBS
ML US Treas,
Inflation‐Linked
ML Global Gov,
Inflation‐Linked
S&P 500 1.00 0.60 ‐0.09 0.57 ‐0.30 0.23 0.92 0.07 0.08
S&P GSCI Commodities 0.60 1.00 ‐0.06 0.36 ‐0.21 0.07 0.52 0.26 0.24
Barclays Capital Agg. Bond ‐0.09 ‐0.06 1.00 0.66 0.96 0.90 ‐0.42 0.93 0.93
ML US Corporate Master 0.57 0.36 0.66 1.00 0.47 0.82 0.32 0.76 0.75
ML Global Gov. Bond II ‐0.30 ‐0.21 0.96 0.47 1.00 0.80 ‐0.60 0.84 0.87
ML Municipal Master 0.23 0.07 0.90 0.82 0.80 1.00 ‐0.08 0.87 0.90
ML US ABS & CMBS 0.92 0.52 ‐0.42 0.32 ‐0.60 ‐0.08 1.00 ‐0.26 ‐0.24
ML US Treas, Inflation‐Linked 0.07 0.26 0.93 0.76 0.84 0.87 ‐0.26 1.00 0.98
ML Global Gov, Inflation‐Linked
0.08 0.24 0.93 0.75 0.87 0.90 ‐0.24 0.98 1.00
Sponsored by …
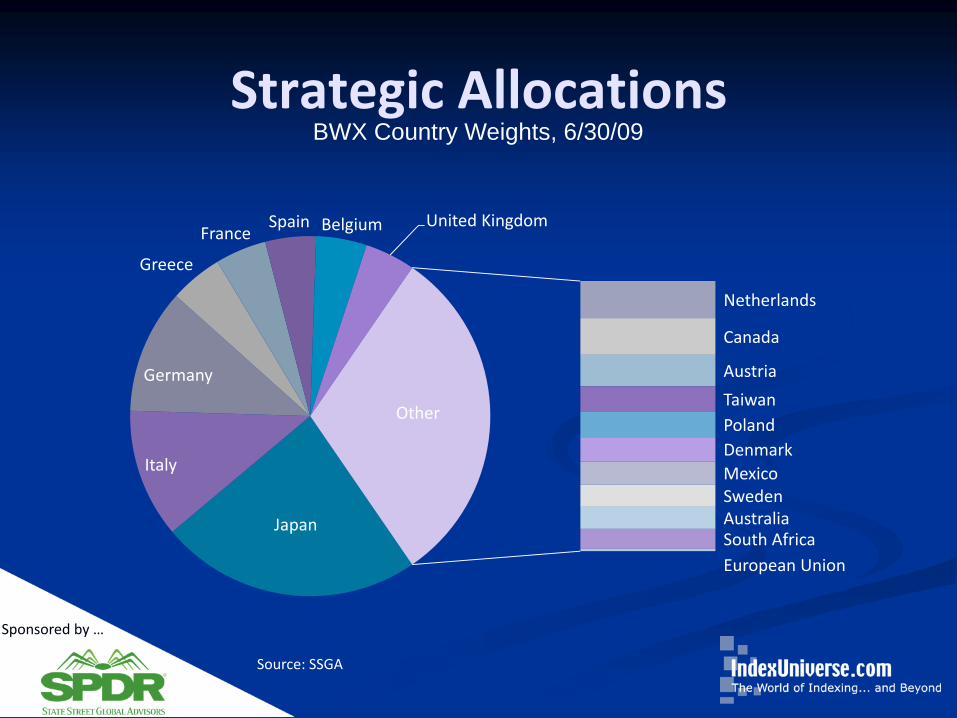
Strategic Allocations
Source: SSGA
BWX Country Weights, 6/30/09
Japan
Italy
Germany
Greece
FranceSpain Belgium United Kingdom
Netherlands
Canada
Austria
TaiwanPolandDenmarkMexicoSwedenAustraliaSouth AfricaEuropean Union
Other

Sponsored by …
International Diversification
ETF Total Return 2009 (Through 6/30)
PowerShares Emerging Mkt Sov Debt (PCY) 21.25
SPDR Barclays Intl Treasury Bond (BWX) 0.95
iShares S&P/Citi Intl Treasury (IGOV) 0.92
iShares Barclays 20+ Year Treas Bond (TLT) ‐19.59
Source: Bespoke Investment Group

Sponsored by …
The Currency EffectImpact of Currency on German Bond Returns for US Investors
YearLocal MarketReturn (%)
Local Currency Appreciation/Depreciation
vs. US Dollar (%)Return to USInvestors (%)
1994 ‐1.8 11.8 10.0
1995 16.3 9.6 25.9
1996 7.3 ‐7.7 ‐0.4
1997 6.2 ‐15.2 ‐9.0
1998 10.9 8.9 19.8
1999 ‐2.1 ‐14.3 ‐16.4
Source: Salomon Smith Barney

Sponsored by …
The Rate Effect
Sources: Merrill Lynch, Bespoke Investment Group
0
1
2
3
4
5
6
7
8
6/30/04 6/30/05 6/30/06 6/30/07 6/30/08 6/30/09
Effective Yield (%
)
US
Australia
UK
Japan
1‐3 Year Treasuries Effective Yield

Sponsored by …
Country Default Risk
Sources: Bloomberg, Bespoke Investment Group
0
100
200
300
400
500
600
700
800
12/31/07 6/30/09
BPS
5‐Year CDS Prices on Sovereign Debt
RussiaChinaUKUSJapanGermany

Sponsored by …
US vs. International Bonds
‐20
0
20
40
60
80
100
120
4/1/01 4/1/02 4/1/03 4/1/04 4/1/05 4/1/06 4/1/07 4/1/08 4/1/09
Return (%
)
Citi Intl Treasury Bond: 109.82%
ML 7 ‐ 10 Year US Treasury: 64.78%
Source: Bespoke Investment Group

Sponsored by …
Correlation To Stocks
ML US Treasuries, 7‐10 Yrs
S&P/Citigroup Intl Treasury Bond Fund S&P 500 MSCI EAFE
ML US Treasuries, 7‐10 Yrs 1.00 0.89 ‐0.32 ‐0.08
S&P/Citigroup Intl Treasury Bond Fund
0.89 1.00 ‐0.02 0.21
S&P 500 ‐0.32 ‐0.02 1.00 0.96
MSCI EAFE ‐0.08 0.21 0.96 1.00
Monthly, 5‐year
Sources: Merrill Lynch, S&P, MSCI, Bespoke Investment Group

Sponsored by …
Risk Management, And Returns
Sources: Merrill Lynch, Bloomberg, Bespoke Investment Group
Selected Performance: April 2001 – June 2009
‐40
‐30
‐20
‐10
0
10
20
30
40
50
60
70
4/2/01 4/2/02 4/2/03 4/2/04 4/2/05 4/2/06 4/2/07 4/2/08 4/2/09
Return (%
)
50 S&P/10 AGG/10 IGOV/10 HY/10 Global Gvt/10 EM Liquid
50 S&P/50 AGG
80 S&P/20 AGG
100 S&P 500

Sponsored by …
Cushion From A Fall
Total Return of Other Fixed‐Income ETFs (%)
Month Ending
Total Return (%) BSV ITR TLO TIP WIP TLT IGOV BWX PCY
10/31/08 ‐2.28 ‐2.01 ‐4.20 ‐3.47 ‐8.10 ‐12.54 ‐1.86 ‐4.90 ‐5.04 ‐26.26
1/30/09 ‐1.99 ‐1.09 1.16 ‐8.37 ‐0.04 ‐5.41 ‐13.07 ‐6.04 ‐6.71 9.37
9/30/08 ‐1.76 ‐0.23 ‐5.90 0.67 ‐4.02 ‐9.56 1.47 ‐2.36 ‐2.25 ‐8.06
5/30/08 ‐1.26 ‐0.76 ‐0.66 ‐2.15 0.11 0.25 ‐2.69 ‐1.41 ‐1.50 0.40
2/27/09 ‐1.06 ‐0.98 ‐1.35 ‐1.13 ‐2.20 ‐3.85 ‐1.54 ‐2.32 ‐3.34 ‐5.04
Five Worst Months for AGG: 6/30/06 – 6/30/09
Source: Bespoke Investment Group

Sponsored by …
Slices Of The Yield Curve
Sources: Merrill Lynch, Bespoke Investment Group
Three‐Year Total Return
Municipal 1‐10 Year 17.27
Municipal 10+ Year 7.13
Corporate 1‐10 Year 13.19
Corporate 10+ Year 12.35
Government 1‐10 Year 22.58
Government 10+ Year 28.22

Sponsored by …
Fixed Income Allocation
The Old Way
Bond Allocation
=
Age

Sponsored by …
Fixed Income: Risk ManagementS&P 500 and BarCap Aggregate Bond Index Portfolios: 8/29/08 ‐ 3/31/09
Sources: Bloomberg, Merrill Lynch, Bespoke Investment Group
‐40
‐30
‐20
‐10
0
10
8/29/08 3/31/09
Return (%
)
AGG: 3.29%
50 AGG/50 S&P: ‐17.2%
20 AGG/80 S&P: ‐29.1%

Sponsored by …
Fixed Income = Strong Returns
0.1
1.0
10.0
100.0
1,000.0
1801 1821 1841 1861 1881 1901 1921 1941 1961 1981 2001
Stock vs Bond, Cumulative Relative Performance, 1801‐2008
Equity vs 20‐Year Bond Rel Rtn
Last High Water Mark
68‐Year Span,1803‐71,
Bonds Beat Stocks
20‐Year Span,1929‐49,
Bonds Beat Stocks 40‐Year Span,
1969‐2009,Bonds Match
Stocks
Source: Research Affiliates, LLC

Sponsored by …
Wall Street Gives Notice “This year’s going to be a good one for credit.” – Societe Generale
“We still believe there is significant opportunity in high‐quality investment grade corporate bonds.” – PIMCO, July 2009
“Even against the backdrop of contracting GDP, rising default rates and uncertainty around price inflation, investment grade corporate credit at current income levels is clearly a great place to be.”
– Neuberger Berman, May 2009
“We believe investors should focus on senior corporate bonds and senior secured bank loans over equities, and the senior‐most mortgage and structured credit assets.” – Goldman Sachs, Q1 2009

Sponsored by …
Shift Of Premium?
Sources: Merrill Lynch, Bloomberg, Bespoke Investment Group
‐50
‐40
‐30
‐20
‐10
0
10
8/29/08 6/29/09
Return (%
)
ML US Corporate Master
S&P 500

Sponsored by …
Opportunities In Fixed Income
Sources: Merrill Lynch, Bloomberg, Bespoke Investment Group
“Municipal bonds, in particular, have become a more dynamic area of focus because the sector was hammered heavily last year, making them cheap and attractive.”
– Steve Rodosky, PIMCO, in Wall Street Journal, July 9
20
30
40
50
60
70
80
90
100
110
7/1/08 6/30/09
Basis Po
ints Over Treasuries

Sponsored by …
Not Your Grandfather’s Bonds
Sponsored by …
Accessing The Market
Bonds
vs.
Bond Funds

Sponsored by …
Active Vs. PassivePercentage of Fixed‐Income Funds Outperformed By Benchmark
Fund Category Index 1‐Year 3‐Year 5‐Year
Govt Long Funds Barclays Long Government 89.8 93.3 92.7
Govt ST Funds Barclays 1‐3 Year Govt 84.2 91.4 91.4
Inv‐Grade Long Funds Barclays Long Govt/Credit 94.8 94.7 100.0
Inv‐Grade Short Funds Barclays 1‐3 Year Govt/Credit 98.7 100.0 100.0
High‐Yield Funds Barclays High Yield 37.0 43.8 52.3
MBS Funds Barclays MBS 93.7 100.0 100.0
Global Income Funds Barclays Global Aggregate 78.1 86.4 79.1
Emerging Mkts Debt Funds Barclays Em Mkts 65.2 68.8 62.5
General Muni Debt Funds S&P National Muni Bond 80.6 84.7 95.9
Source: Standard & Poor’s

Sponsored by …
Bond ETFs Vs. Bond Mutual Funds
ETF Pros• Liquid• Transparent• Tax Efficient• Low Cost
ETF Cons• Trading costs• Bid/ask spreads can mean overpayment• Can trade at discount/premium

Sponsored by …
Growth Of Fixed‐Income ETFs
Source: State Street Global Advisors
•Bond ETFs represent 12.6% of total ETF assets•71% asset growth in 2007 •62% asset growth in 2008•31% asset growth YTD
$0
$10
$20
$30
$40
$50
$60
$70
$80
0
10
20
30
40
50
60
70
2002 2003 2004 2005 2006 2007 2008 5/31/2009
$US, Billions
# of ETFs
Assets
# of ETFs

Sponsored by …
Diversification Of Bond ETFs
Source: IndexUniverse.com
Total Market 5 Money Market 3
Total Market ‐ ST 2
Total Market ‐ Int 4 Treasuries 11
Total Market ‐ LT 2 Treasuries ‐ ST 3
Treasuries ‐ Int 4
MBS 3 Treasuries ‐ LT 4
Muni Bonds ‐ Natl 3 TIPS 2
Muni Bonds ‐ ST 5
Muni Bonds ‐ Other 3 Intl Treasuries ‐ ST 2
Muni Bonds ‐ Calif 3 Intl Treasuries 3
Muni Bonds ‐ NY 3 Emerg. Market Treasuries 2
Corp General 2
Corp High Yield 3
Corp Convert. 1

Sponsored by …
Bond ETFs: Choice, SelectioniShares iBoxx $ Investment Grade Corporate Bond Fund
iShares Barclays Credit
iShares iBoxx $ HiYld Corp
PowerShares High Yield Corporate Bond Portfolio
SPDR BarCap High Yield
SPDR Barclays Capital Convertible Bond
iShares S&P National Municipal Bond Fund
PowerShares Insured National Municipal Bond Fund
SPDR BarCap Municipal Bond ETF
iShares S&P Short‐Term National Municipal Bond
Market Vectors LB AMT‐Free Short Municipal
Market Vectors Pre‐Refunded Municipal Index
PowerShares VRDO Tax‐Free Weekly Portfolio
SPDR BarCap Short‐Term Municipal Bond
Market Vectors LB AMT‐Free Intermediate Municipal Index
Market Vectors LB AMT‐Free Long Municipal Index ETF
Market Vectors High Yield Municipal Bond
iShares S&P California Municipal Bond ETF
PowerShares Insured CA Municipal Bond
SPDR BarCap California Municipal Bond
iShares S&P New York Municipal Bond ETF
PowerShares Insured New York Municipal Bond
SPDR BarCap New York Municipal Bond
iShares Barclays 1‐3 Year Treasury
iShares Barclays Short Treasury
SPDR BarCap 1‐3 Month T‐Bill
iShares Barclays 3‐7 Year Treasury
iShares Barclays 7‐10 Year Treasury
PowerShares 1‐30 Laddered Treasury
SPDR BarCap Intermediate‐Term Treasury
iShares Barclays 10‐20 Year Treasury
iShares Barclays 20+ Year Treasury
SPDR BarCap Long Term Treasury
Vanguard Extended Duration Treasury ETF
iShares Barclays TIPS Bond
SPDR Barclays Capital TIPS
iShares S&P/Citi 1‐3 Intl
SPDR BarCap S/T Intl Treasury
iShares S&P/Citi International Treasury
SPDR BarCap Intl Treasury Bond ETF
SPDR DB International Government Inflation Protected Bond
iShares JPMorgan USD Emerging Markets Bond Fund
PowerShares Emerging Markets Debt
Claymore US Capital Markets Bond
iShares Barclays Aggregate
iShares Barclays Government/Credit
SPDR BarCap Aggregate Bond
Vanguard Total Bond Market
Vanguard Short‐Term Bnd ETF
iShares Barclays 1‐3 Credit
iShares Barclays Intermediate Government/Credit
Vanguard Intermediate‐Term Bond ETF
iShares Barclays Intermediate‐Term Credit
SPDR Barclays Capital Intermediate‐Term Credit
Vanguard Long‐Term Bond
SPDR BarCap Long Credit
Claymore US Capital Markets Micro‐Term Fixed Income
PowerShares Active Low Duration Fund
WisdomTree US Current Income

Sponsored by …
Bond ETFs Compared: Broad‐Based
Ticker
AUM$US, MM
Exp Ratio
12‐Month 3‐Year 5‐Year
Claymore US Capital Markets Bond UBD 5.1 0.27 ‐1.12 N/A N/A
iShares Barclays Aggregate AGG 9,748.0 0.20 6.36 6.47 4.93
iShares Barclays Government/Credit GBF 113.0 0.20 5.56 N/A N/A
SPDR Barclays Capital Aggregate Bond LAG 196.2 0.13 7.03 N/A N/A
Vanguard Total Bond Market BND 4,399.3 0.11 6.59 N/A N/A
Vanguard Short‐Term Bnd ETF BSV 1,894.7 0.10 5.71 N/A N/A
iShares Barclays Intermediate Government/Credit GVI 341.8 0.20 5.50 N/A N/A
Vanguard Intermediate‐Term Bond ETF BIV 849.3 0.11 5.65 N/A N/A
Vanguard Long‐Term Bond BLV 140.2 0.11 5.71 N/A N/A
Sponsored by …
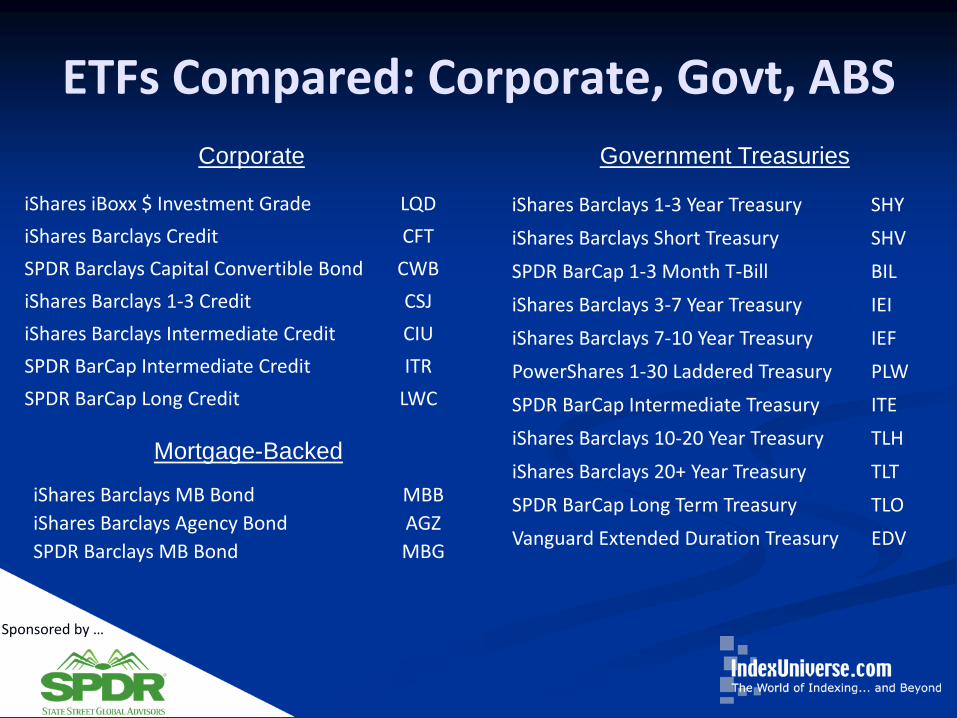
ETFs Compared: Corporate, Govt, ABSCorporate Government Treasuries
Mortgage-Backed
iShares Barclays 1‐3 Year Treasury SHY
iShares Barclays Short Treasury SHV
SPDR BarCap 1‐3 Month T‐Bill BIL
iShares Barclays 3‐7 Year Treasury IEI
iShares Barclays 7‐10 Year Treasury IEF
PowerShares 1‐30 Laddered Treasury PLW
SPDR BarCap Intermediate Treasury ITE
iShares Barclays 10‐20 Year Treasury TLH
iShares Barclays 20+ Year Treasury TLT
SPDR BarCap Long Term Treasury TLO
Vanguard Extended Duration Treasury EDV
iShares Barclays MB Bond MBBiShares Barclays Agency Bond AGZSPDR Barclays MB Bond MBG
iShares iBoxx $ Investment Grade LQD
iShares Barclays Credit CFT
SPDR Barclays Capital Convertible Bond CWB
iShares Barclays 1‐3 Credit CSJ
iShares Barclays Intermediate Credit CIU
SPDR BarCap Intermediate Credit ITR
SPDR BarCap Long Credit LWC

Sponsored by …
Bond ETFs Compared: International
Ticker
AUM($US, MM) Exp Ratio 12‐Month
iShares S&P/Citi 1‐3 Intl ISHG 20.2 0.35 N/A
SPDR BarCap S/T Intl Treasury BWZ 10.5 0.35 N/A
iShares S&P/Citi International Treasury IGOV 19.9 0.35 N/A
SPDR BarCap International Treasury Bond BWX 1,091.8 0.50 1.46
SPDR DB International Government Inflation Protected Bond WIP 395.6 0.50 ‐10.93
iShares JPMorgan USD Emerging Markets Bond Fund EMB 267.0 0.60 1.33
PowerShares Emerging Markets Sov. Debt PCY 205.0 0.50 2.27

Sponsored by …
Bond ETFs Compared: MunisNational MunisNew York Munis
Calif. Munis
iShares S&P National Municipal MUB
PowerShares Insured National Municipal PZA
SPDR BarCap Municipal Bond TFI
iShares S&P Short‐Term National Municipal SUB
Market Short Term Municipal SMB
Market Vectors Pre‐Refunded Municipal PRB
PowerShares VRDO Tax‐Free Weekly PVI
SPDR BarCap Short‐Term Municipal SHM
Market Vectors Intermediate Municipal Index ITM
Market Vectors Long Municipal Index ETF MLN
Market Vectors High Yield Municipal HYD
iShares S&P California Municipal Bond CMF
PowerShares Insured CA Municipal Bond PWZ
SPDR BarCap California Municipal Bond CXA
iShares S&P New York Municipal Bond NYF
PowerShares Insured HY Municipal Bond PZT
SPDR BarCap NY Municipal Bond INY

Sponsored by …
Bond ETFs Compared: High Yield
TickerAUM
($US, MM) Exp Ratio 12‐Month
iShares iBoxx $ HiYld Corp HYG 3,340.0 0.50 ‐5.4
PowerShares High Yield Corporate Bond Portfolio PHB 110.7 0.50 ‐18.8
SPDR BarCap High Yield JNK 1,895.8 0.40 ‐8.1

Sponsored by …
Bond ETFs in Illiquid Markets
AuthorizedParticipant
Market
IBM
MSFT
AAPL
CAT
CSCO
SecurityBasketETF Shares
Premiums & Discounts
100k Shares $ $25

Sponsored by …
Bond ETFs In Illiquid Markets
‐10%
‐5%
0%
5%
10%
15%
J‐08 A‐08 S‐08 O‐08 N‐08 D‐08 J‐09 F‐09 M‐09 A‐09 M‐09 J‐09
Prem
ium (%
)
HYG Premium/Discount

Sponsored by …
ConclusionA Balanced Approach
‐40
‐30
‐20
‐10
0
10
20
30
40
50
60
70
4/01 4/02 4/03 4/04 4/05 4/06 4/07 4/08 4/09
Return (%
)
50 S&P/10 AGG/10 IGOV/10 HY/10 Global Gvt/10 EM Liquid
50 S&P/50 AGG
80 S&P/20 AGG
100 S&P 500
Sources: Merrill Lynch, Bloomberg, Bespoke Investment Group

Sponsored by …
Our Panelists
Tom AndersonHead of Strategy and ResearchState Street Global Advisors
Tim AndersonPartnerChief Fixed Income OfficerRiverfront Investment Group

Sponsored by …
Thank You
For more information:
www.IndexUniverse.comwww.spdrs.com