northeast group, llc led and smart... · northeast group, llc!! global led and smart street...
TRANSCRIPT
northeast group, llc
Global LED and Smart Street Lighting: Market Forecast (2015 – 2025)
Volume II April 2015 | www.northeast-group.com

© 2015 Northeast Group, LLC
Global LED and Smart Street Lighting: Market Forecast (2015 – 2025)
There are currently 304 million total streetlights in the world. This number will grow to 352 million total streetlights by 2025. The public outdoor lighting market is currently undergoing a period of change where legacy streetlights are being replaced with new and more efficient LED, or solid-state lighting technology. Taking this new technology a step further, these LED streetlights are also being networked together with communications to become “smart” streetlights. This study analyzes and forecasts the global market for both LED and smart street lighting through 2025.
LED streetlights will transform cities and municipalities across the globe over the next decade. LEDs offer longer lifetimes, lower energy consumption, and reduced maintenance costs when compared with legacy streetlight technologies. In most developed countries, LEDs are already an economically beneficial alternative to existing streetlights over the lifetime of the light when energy savings are considered, despite their higher upfront cost. But within a few years, LED streetlights are expected to reach cost parity with legacy technologies, making their benefits to costs immediately positive. At this point, they will make economic sense as replacements in almost all countries. Furthermore, with many emerging market countries rapidly urbanizing and in need of improved urban infrastructure, this creates an enormous market opportunity. From 2015 to 2025, countries are expected to invest $53.7 billion in LED street lighting.
But LED luminaires are not the sole element in modernized public outdoor lighting. Networked “smart” streetlights help cities further reduce costs through off-peak dimming and reduced maintenance expenditures. As the costs for networked streetlights also rapidly decline, these smart streetlights will find a growing role in cities and municipalities across the globe. In many developed countries, they will serve as part of larger “smart city” concepts, where
communications networks can be used to link items such as power and water meters, traffic lights, and parking meters. Smart streetlights also greatly improve safety conditions in a city by reducing the “down time” of streetlights. As soon as lamps expire, officials are notified, so streets rarely go without lighting. In many emerging market metropolises that are managing rising street crime, this will be a particularly strong benefit.
2015
2016
2017
2018
2019
2020
2021
2022
2023
2024
2025
LED streetlights value ($M) Smart streetlight systems value ($M)
# Smart streetlights # LED streetlights
Tota
l val
ue ($
M) Total streetlights
Source: Northeast Group
Cumulative investment in LED and smart streetlights (including installation value)
GermanyGermany: key data
Total streetlights (2014)
Socket type
Electricity price
Notable projects:• Leipzig;• Lemgo;• Schorndorf;• Stuttgart;• Wipperfürth.
2015
2016
2017
2018
2019
2020
2021
2022
2023
2024
2025
LED streetlights value ($M)Smart streetlight systems value ($M)# Smart streetlights# LED streetlights
Mixed ownership:• XX% city-owned; • XX% cooperative utility-owned;• XX% private utility-owned.
Germany: LED and smart streetlight forecast
Ownership information
Lemgo
Leipzig
Stuttgart
Schorndorf
Wipperfürth
© 2015 Northeast Group, LLC
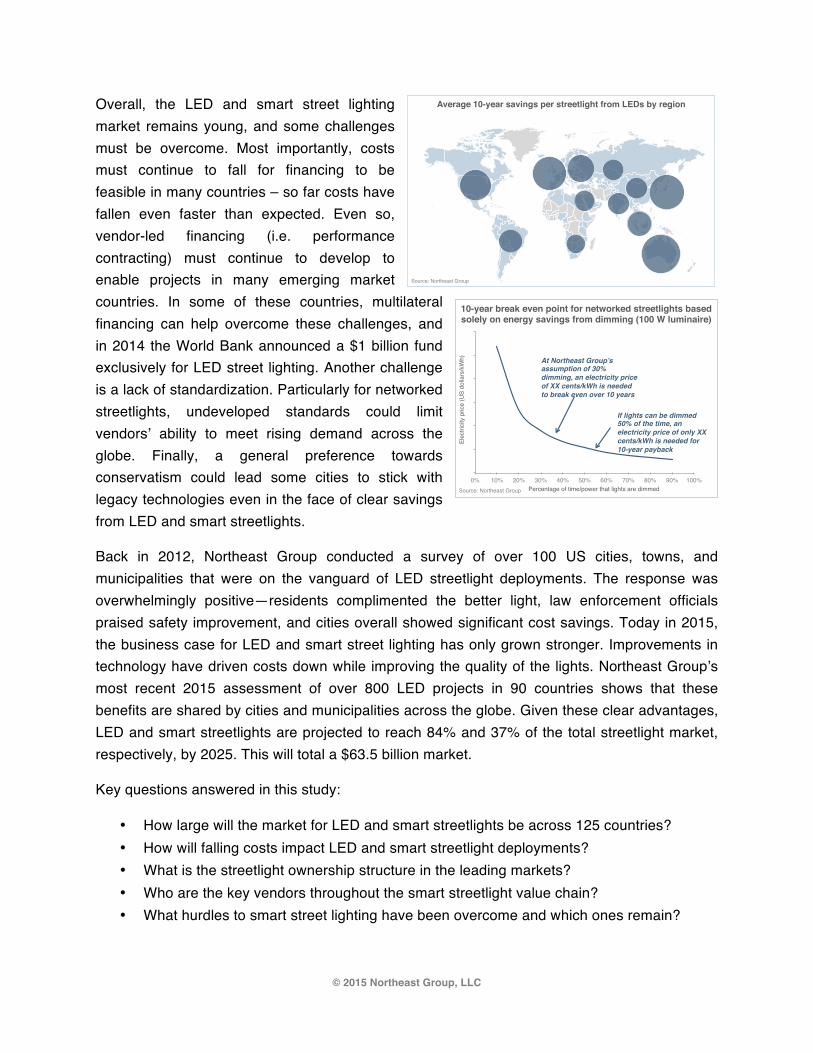
Overall, the LED and smart street lighting market remains young, and some challenges must be overcome. Most importantly, costs must continue to fall for financing to be feasible in many countries – so far costs have fallen even faster than expected. Even so, vendor-led financing (i.e. performance contracting) must continue to develop to enable projects in many emerging market countries. In some of these countries, multilateral financing can help overcome these challenges, and in 2014 the World Bank announced a $1 billion fund exclusively for LED street lighting. Another challenge is a lack of standardization. Particularly for networked streetlights, undeveloped standards could limit vendors’ ability to meet rising demand across the globe. Finally, a general preference towards conservatism could lead some cities to stick with legacy technologies even in the face of clear savings from LED and smart streetlights.
Back in 2012, Northeast Group conducted a survey of over 100 US cities, towns, and municipalities that were on the vanguard of LED streetlight deployments. The response was overwhelmingly positive—residents complimented the better light, law enforcement officials praised safety improvement, and cities overall showed significant cost savings. Today in 2015, the business case for LED and smart street lighting has only grown stronger. Improvements in technology have driven costs down while improving the quality of the lights. Northeast Group’s most recent 2015 assessment of over 800 LED projects in 90 countries shows that these benefits are shared by cities and municipalities across the globe. Given these clear advantages, LED and smart streetlights are projected to reach 84% and 37% of the total streetlight market, respectively, by 2025. This will total a $63.5 billion market.
Key questions answered in this study:
• How large will the market for LED and smart streetlights be across 125 countries? • How will falling costs impact LED and smart streetlight deployments? • What is the streetlight ownership structure in the leading markets? • Who are the key vendors throughout the smart streetlight value chain? • What hurdles to smart street lighting have been overcome and which ones remain?
Average 10-year savings per streetlight from LEDs by region
Source: Northeast Group
0% 10% 20% 30% 40% 50% 60% 70% 80% 90% 100%
10-year break even point for networked streetlights based solely on energy savings from dimming (100 W luminaire)
At Northeast Group’s assumption of 30% dimming, an electricity price of XX cents/kWh is needed to break even over 10 years
If lights can be dimmed 50% of the time, an electricity price of only XX cents/kWh is needed for 10-year payback
Elec
trici
ty p
rice
(US
dolla
rs/k
Wh)
Percentage of time/power that lights are dimmedSource: Northeast Group

© 2015 Northeast Group, LLC
Table of Contents
i. Executive Summary 1
i.i What’s new in 2015? 5
ii. Methodology 13
1. Introduction 16
1.1 What makes infrastructure “smart?” 16
1.2 Smart infrastructure applications 19
1.3 How do smart infrastructure applications build on each other? 24
2. Overview of LED and smart streetlight benefits 26
2.1 Background of LED streetlights and comparison with other lighting technologies 26
2.2 Cost savings potential of LEDs 32
2.3 Advanced “smart” street lighting features 36
3. Challenges for LED and smart streetlight systems 45
3.1 Financing challenges 45
3.2 Non-financial hurdles 49
4. Case studies 58
4.1 Characteristics of LED and smart streetlight projects 58
4.2 Madrid, Spain 61
4.3 Florida, US 62
4.4 San José, US 63
4.5 Chattanooga, US 65
4.6 São Paulo, Brazil 68
4.7 South Korea (nationwide) 69
4.8 Buenos Aires, Argentina 70
4.9 Copenhagen, Denmark 72
4.10 Bratislava, Slovakia 73
4.11 Almaty, Kazakhstan 74
4.12 Abu Dhabi, UAE 76
4.13 Durban, South Africa 77
4.14 Kolkata, India 79
4.15 Dongguan, China 81
4.16 Hanoi, Vietnam 83
© 2015 Northeast Group, LLC
Table of Contents (cont.)
5. Market forecast 85
5.1 Total number of streetlights 85
5.2 LED and smart streetlight pace 87
5.3 Cost of LED and smart streetlight deployments 88
5.4 LED streetlight market forecast 90
5.5 Smart streetlight market forecast 94
6. Leading markets 97
6.1 United States 98
6.2 China 98
6.3 Japan 99
6.4 Germany 99
6.5 Brazil 100
6.6 India 100
6.7 Mexico 101
6.8 France 101
6.9 United Kingdom 102
6.10 Turkey 102
6.11 South Korea 103
6.12 Italy 103
7. Vendors 104
7.1 Market trends 104
7.2 Leading LED and smart streetlight vendors 107
8. Appendix 127
8.1 List of projects assessed in this study 127 153
8.2 List of abbreviations 139
8.3 List of companies mentioned in this study 140
List of Figures, Boxes, and Tables
Global LED and smart street lighting: key takeaways 4 Average cost per streetlight of smart LED projects 5 Cumulative per-streetlight savings of LED luminaires in Brazil by year 6
© 2015 Northeast Group, LLC
List of Figures, Boxes, and Tables (cont.)
Combined cumulative LED and networked streetlight value by year 6 Difference between 2014 and 2015 cumulative LED streetlight forecasts 7 Difference between 2014 and 2015 cumulative smart streetlight forecasts 7 Global identified LED streetlight projects 8 New LED streetlight projects in 2015 8 Case study examples in this study 9 Snapshots of leading LED and smart streetlight markets 9 Annual combined LED and smart streetlight value in leading markets 10 Locations of smart streetlight vendors 10 Smart streetlight value chain 11 Smart street lighting vendors 12 LED and smart streetlight forecast methodology 14 Table 1.1: Smart infrastructure market segments 17 Figure 1.1: Smart infrastructure overview 19 Table 1.2: Communications technologies 20 Figure 1.2: Smart grid value chain 21 Table 2.1: LED streetlight benefits 26 Figure 2.1: Streetlight directional control 27 Figure 2.2: Response to LED streetlights in Northeast Group’s US survey 28 Table 2.2: Different types of streetlight luminaires 28 Figure 2.3: Types of streetlights in Brazil 31 Table 2.3: HPS to LED wattage cross-reference 32 Figure 2.4: Comparison of savings percentages in Sri Lanka and Ukraine 33 Table 2.4: Estimate of payback on LED streetlights in Sri Lanka 34 Figure 2.5: Payback on replacement LED streetlights in Sri Lanka 34 Table 2.5: Estimate of payback on LED streetlights in Ukraine 34 Figure 2.6: Payback on replacement LED streetlights in Ukraine 35 Table 2.6: Estimate of payback on LED streetlights in Germany 35 Figure 2.7: Payback on replacement LED streetlights in Germany 35 Figure 2.8: Average 10-year savings per streetlight from LEDs by region 36 Figure 2.9: Smart streetlight model with different communications systems 38 Figure 2.10: Cost breakdown of smart LED installation with PLC 40 Figure 2.11: Global average savings from smart streetlights based on networking costs 41 Figure 2.12: 10-year breakeven point for networked streetlights based solely on dimming 41
© 2015 Northeast Group, LLC
List of Figures, Boxes, and Tables (cont.)
Figure 2.13: Average electricity prices by region 42 Figure 2.14: Average payback on networked streetlights 42 Table 2.7: Estimate of payback on networked streetlights 42 Table 2.8: Summary of cost-benefit analysis examples 43 Table 3.1: Streetlight financing in Europe 46 Table 3.2: Streetlight ownership models 49 Figure 3.1: Countries with only state-owned utilities 50 Figure 3.2: Streetlight ownership in Brazil 51 Figure 3.3: Legal framework for assessing liability of streetlights 54 Table 3.3: Dimming criteria for the standard IESNA RP-8-05 55 Figure 3.4: Countries with NEMA sockets 56 Figure 4.1: Locations of reporting LED and smart streetlight projects 58 Figure 4.2: LED and smart streetlight projects by region 59 Table 4.1: Noteworthy LED and smart streetlight projects in 2014-15 60 Figure 4.3: Case study examples in this study 61 Table 5.1: Total number of streetlights 85 Table 5.2: Cumulative investment in LED and smart streetlights 86 Figure 5.1: Cumulative investment in LED and smart streetlights 86 Figure 5.2: Global LED and smart streetlight penetration rate 87 Figure 5.3: Common types of LED streetlight fixtures 88 Figure 5.4: Average cost per streetlight of smart LED projects 88 Table 5.3: LED and smart streetlight market drivers and barriers 89 Figure 5.5: LED streetlight forecast by lamp type 91 Table 5.4: LED streetlight forecast data by type 91 Figure 5.6: LED streetlight forecast with installation separate 92 Figure 5.7: Regional LED streetlight forecast 92 Table 5.5: LED streetlight forecast data by region 93 Figure 5.8: Regional LED streetlight forecast (simplified) 93 Table 5.6: Smart streetlight forecast data 94 Figure 5.9: Smart streetlight forecast 94 Figure 5.10: Regional smart streetlight forecast 95 Table 5.7: LED streetlight forecast data, networking value only 95 Figure 5.11: Regional smart streetlight forecast (simplified) 96 Figure 6.1: Annual combined LED and smart streetlight value in leading markets 97
© 2015 Northeast Group, LLC
List of Figures, Boxes, and Tables (cont.)
Leading markets snapshots United States 98 China 98 Japan 99 Germany 99 Brazil 100 India 100 Mexico 101 France 101 United Kingdom 102 Turkey 102 South Korea 103 Italy 103 Figure 7.1: Relative manufacturing costs of LED chip components 104 Figure 7.2: Smart lighting value chain 105 Figure 7.3: Locations of smart streetlight vendors 106 Table 7.1: Streetlight vendor partnerships 107 Table 7.2: LED chip vendors 108 Table 7.3: LED wafer vendors 108 Table 7.4: LED phosphor vendors 108 Table 7.5: LED driver vendors 108 Table 7.6: General LED lighting vendors 114 Table 7.7: Streetlight network and control vendors 119 Table 7.8: Streetlight communications vendors 122 Figure 7.4: Dominant smart meter communications types by country 123

By purchasing this report I agree to abide by the following terms and conditions: 1. Single-user license - use of this report is restricted to one individual. 2. Enterprise license – use of this report is restricted to individuals within a single enterprise or organization. I agree not to forward or share this report to others who have not paid for its use.
Order Form – Global LED and Smart Street Lighting: Market Forecast (2015 - 2025)
Pricing
Single user – $3,750 | Enterprise license – $5,400 | Bundle with dataset (excel) - $7,995 (includes data for 125 individual countries)
Clients purchasing a single user license are limited to one user for this report. The enterprise license allows all employees within a single organization to view the report. Any forwarding or sharing of the report to others who have not paid for it is strictly forbidden.
Email orders: Fill out and scan the sheet below. Please email orders to [email protected]
Telephone: We can be reached at +1.202.538.0848. Please have all of the information below ready for your order.
Customer information
NAME POSITION COMPANY
ADDRESS
CITY STATE POSTAL CODE COUNTRY
TELEPHONE EMAIL
Credit card information Card type:
CARD NUMBER EXPIRATION DATE CV CODE
CARDHOLDER’S NAME SIGNATURE DATE
BILLING ADDRESS
CITY STATE POSTAL CODE COUNTRY
MASTERCARD AMERICAN
EXPRESS
DISCOVERVISA
SINGLE USER ENTERPRISE LICENSE