sioux city of sioux city diocese of sioux city proposed northeast deanery data report april, 2016...
TRANSCRIPT

DIOCESE OF Sioux City
Diocese of Sioux City Proposed Northeast Deanery Data Report
April, 2016
Report created by PartnersEdge, LLC
PartnersEdge, LLC is a collaborative effort between
TeamWorks International, Inc. and Catholic Finance Corporation
TeamWorks International, Inc.
7037 20th Avenue S. Centerville, MN 55038
(651) 429-7340 www.teamworksintl.net
Catholic Finance Corporation
5826 Blackshire Path Inver Grove Heights, MN 55076
(651) 389-1070 www.catholicfinance.org

TABLE OF CONTENTS
INTRODUCTION ........................................................................................................................................................................................................................................... 1
U.S. CENSUS DEMOGRAPHICS – RACE & ETHNICITY............................................................................................................................................................ 3
U.S. CENSUS DEMOGRAPHICS - AGE……………………………………………………………………………………………………………..18
U.S. CENSUS DEMOGRPAHICS - INCOME……………………………………………………………………………………………………….28
CATHOLICITY DEMOGRAPHICS………………………………………………………………………………………………………………….31
MASS ATTENDANCE ANALYSIS…………………………………………………………………………………………………………………...35
PASTORAL LEADERSHIP ANALYSIS ................................................................................................................................................................................................ 38
WEEKEND MASS & SACRAMENTAL LOAD ANALYSIS ........................................................................................................................................................... 40
CATHOLIC SCHOOL ENROLLMENT PROJECTIONS & RELIGIOUS EDUCATION PARTICIPATION ANALYSIS…………………45
U.S. CENSUS DEMOGRAPHICS – SCHOOL AGE CHILDREN .............................................................................................................................................. 50
POTENTIAL STUDENT YIELD INDEX MAPPING .................................................................................................................................................................... 57

1 Diocese of Sioux City – Proposed Northeast Deanery Data Report
INTRODUCTION The Diocese of Sioux City is currently engaged in the Ministry 2025 Pastoral Planning process to:
• Energize and enliven our parishes and schools, • Best utilize priest resources, • Provide for specialized ministries, • Integrate projected demographic trends, • Provide stability in parish structure through 2025
Ministry 2025 Pastoral Planning process involves the restructuring of parish clusters and deanery boundaries to:
• 4 deaneries • 31 parish clusters with 73 parishes and 40 oratories • 23 Catholic schools
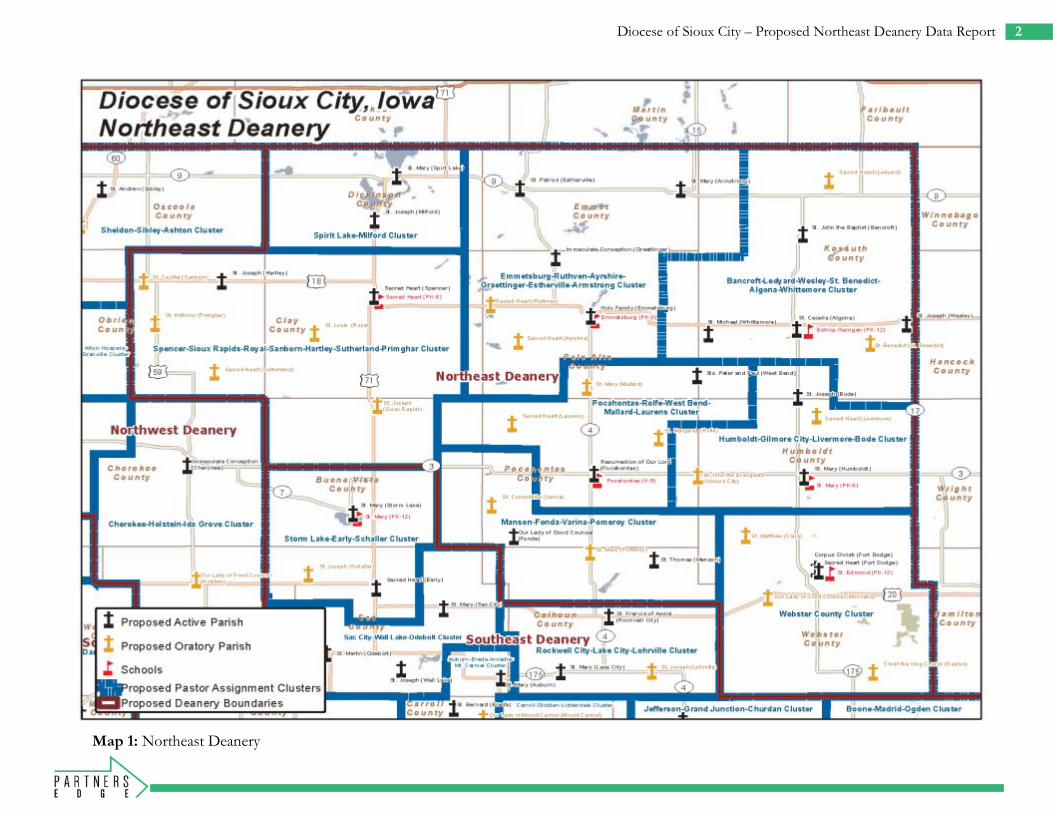
Map 1 reflect the proposed parish clusters and proposed deanery boundary for the Northeast Deanery. The new design includes 8 parish clusters with 20 parishes and 19 oratories, and 6 Catholic schools. Parish cluster boundaries were created by examining the Catholic household distribution for each parish in each cluster. The goal was to capture greater than 80% of all registered households for each parish in the cluster within the parish cluster boundaries. The proposed deanery boundaries were then created based on the parish cluster boundaries. Refinements were then made to both the deanery and parish cluster boundaries so that boundary lines were fit to certain physical features such as roads. In addition, both the Emmetsburg-Ruthven-Ayrshire-Graettinger-Estherville-Armstrong and Webster County parish clusters were designated as Hispanic shared associations. The purpose of these associations is to allow parishes within each cluster to share pastors and other resources for the needs of the growing Hispanic Catholic population residing here.
The Diocese of Sioux City has requested PartnersEdge, LLC to provide a detailed, deanery-wide data analysis for the region. For this analysis we combine external demographic data with internal data and information provided by the Diocese to give a more robust analysis. The external data outlined in this report includes:
• U.S. census population data • U.S. census race and ethnicity data • U.S. census age data • U.S. census income data
The external demographic includes population, age, race/ethnicity, and income data collected during the 2010 U.S. Census. In addition, external sources of data are utilized to estimate current (2015) and 5-year projected (2020) demographic data. These external sources include county-to-county migration data obtained from the Internal Revenue Service, building permits and housing start information, residential postal delivery counts obtained from the U.S. Postal Service, as well as data obtained from other ancillary sources. Demographic data displayed on individual maps is reported at the census block group level. A census block group is the smallest geographic unit used by the United States Census Bureau to report demographic data. In addition, internal data is reported and integrated into the analysis as well. This data was obtained from the Diocese of Sioux City and includes the following information:
• Priest data • Registered Catholic household data • Sacrament data • Mass attendance data • Catholic student & religious education enrollment data
2 Diocese of Sioux City – Proposed Northeast Deanery Data Report
Map 1: Southwest Deanery
Map 1: Northeast Deanery

3 Diocese of Sioux City – Proposed Northeast Deanery Data Report
U.S. CENSUS DEMOGRAPHICS – RACE & ETHNICITY Key Findings
• Between 2010 and 2015 the total population across the Deanery declined by 0.4%
• By 2020 the total population is expected to grow 0.5% • Between 2010 and 2015 the total population of whites declined
by 2.0% • In 2015 whites comprised 92.4% of the total population • By 2020 the total population of whites is expected to decline
another 1.6% where they will comprise 90.9% of the total population
• Between 2010 and 2015 the total population of persons of color grew by 25.2%
• In 2015 persons of colors comprised 7.6% of the total population
• By 2020 the total population of persons of color is expected to grow another 20.5% where they will comprise 9.1% of the total population
• Between 2010 and 2015 the total Hispanic population grew by 29.4%
• In 2015, Hispanics comprised 3.9% of the total population • By 2020, the total Hispanic population is expected to grow
another 23.0% where they will comprise 4.8% of the total population
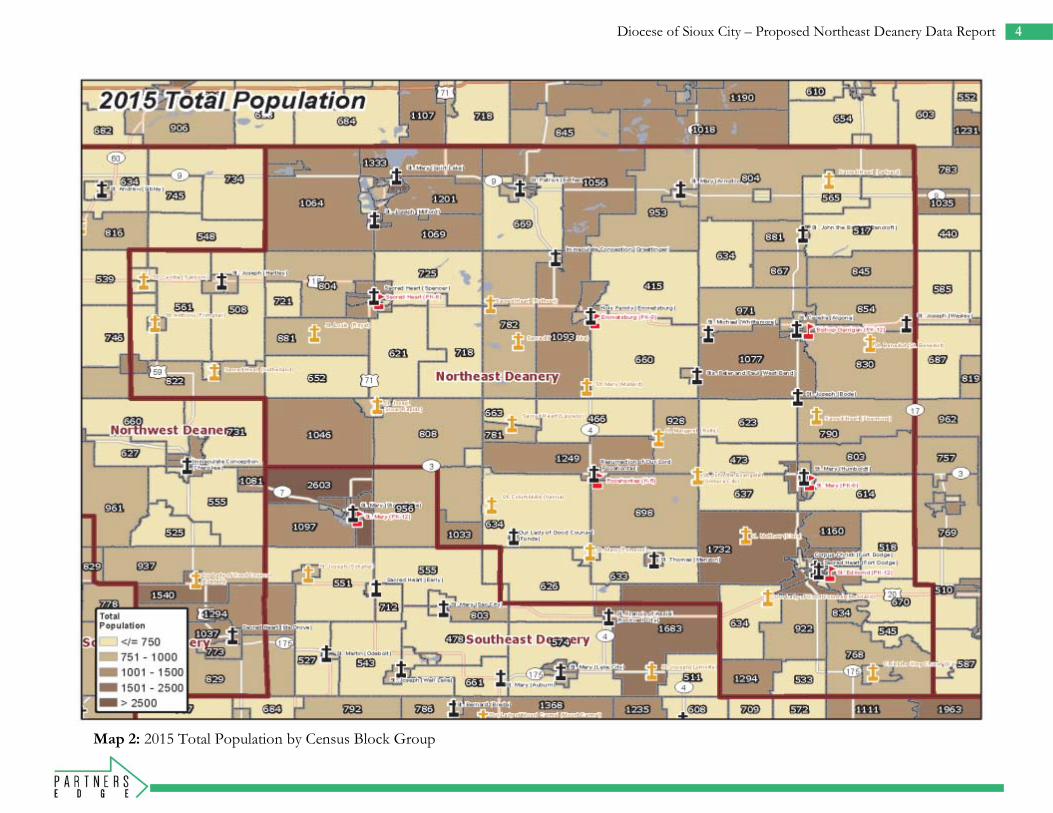
Table 1 summarizes the total population residing within the deanery boundary by race and ethnicity. In 2015, the total population living here was 138,461 (Map 2). The total population has declined 0.4% since 2010, and is expected to remain virtually flat, growing very slightly by 0.1% to 138,537 by 2020 (Map 3). In 2015, the total population of
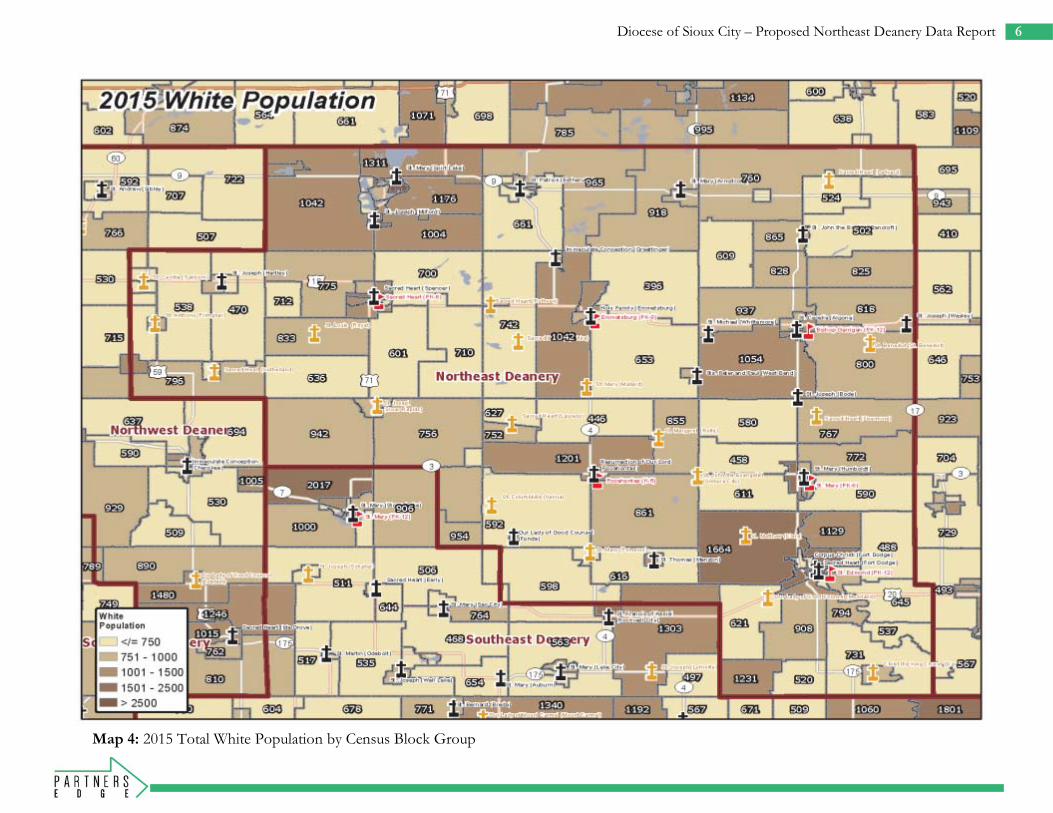
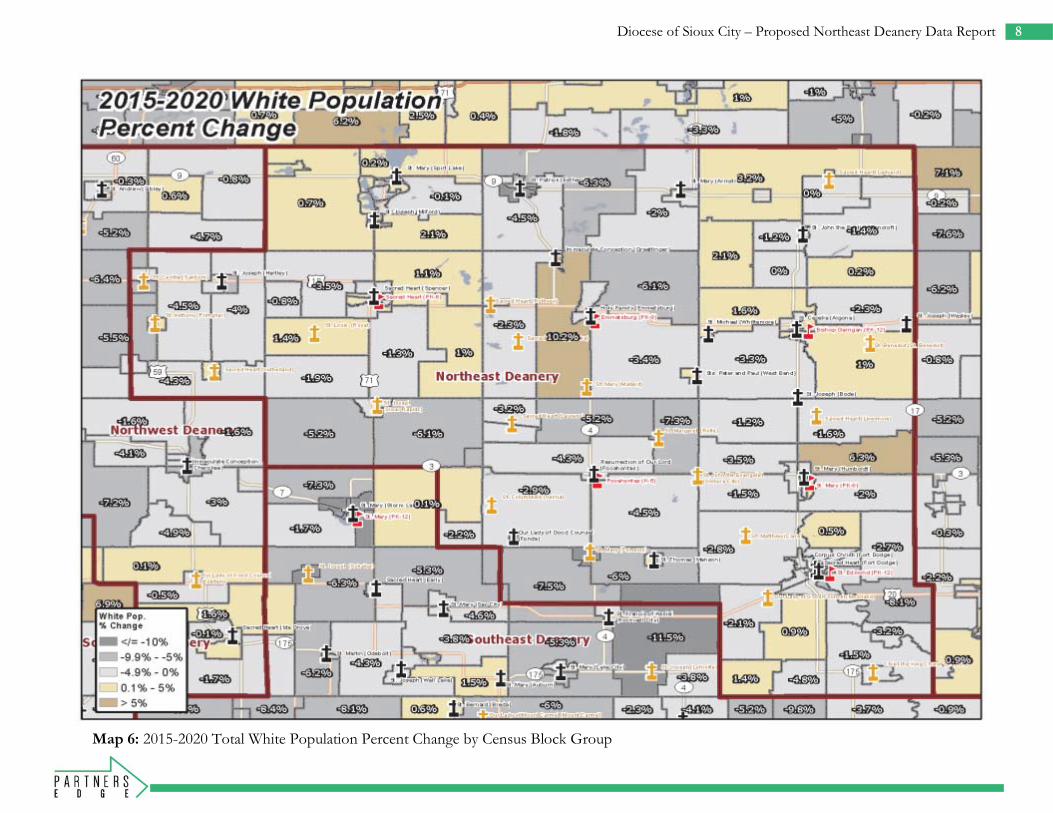
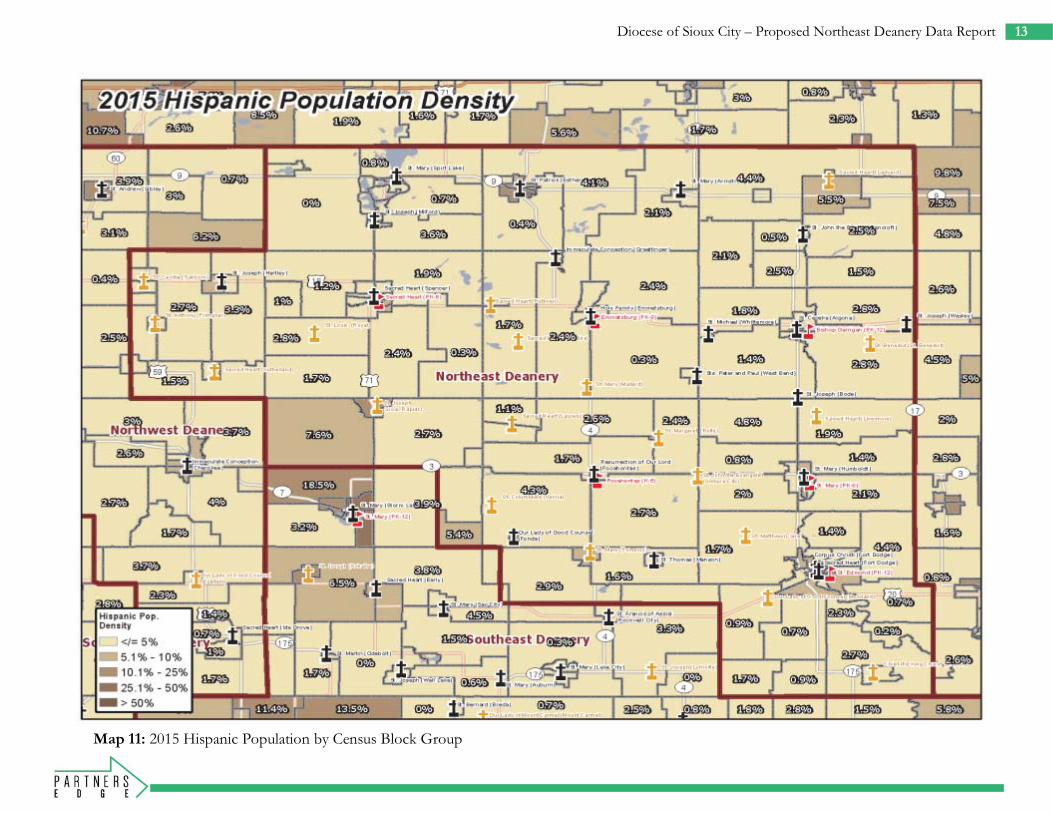
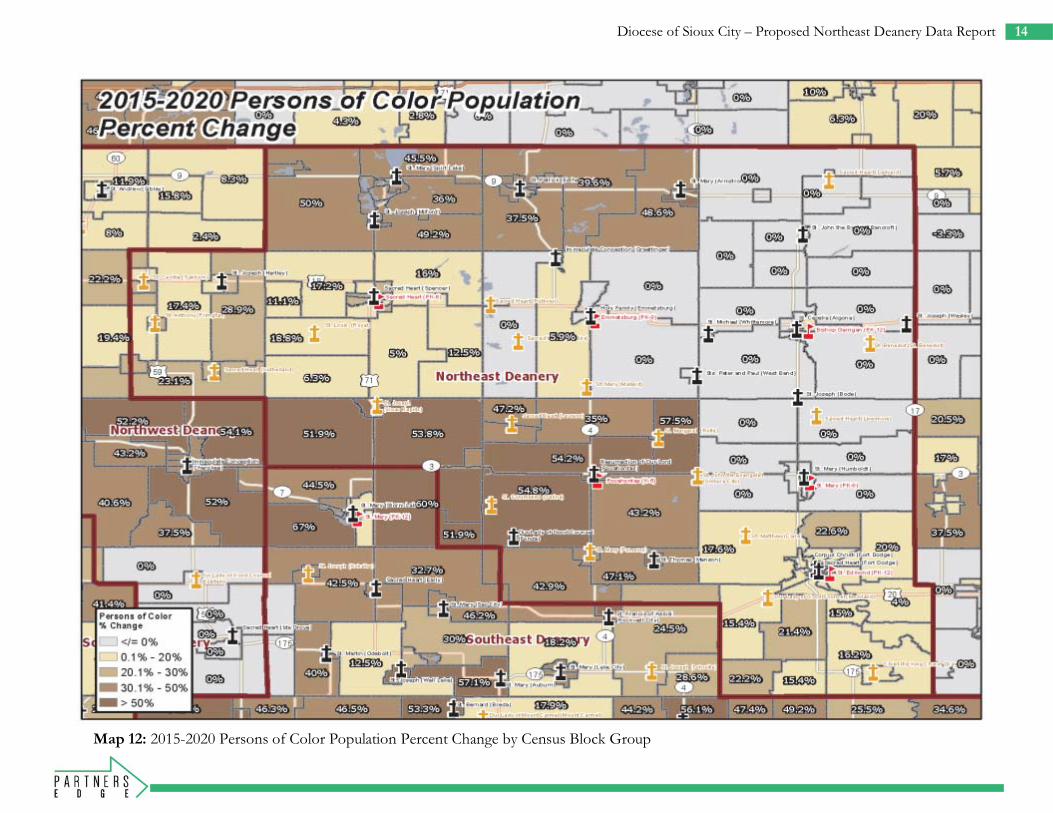
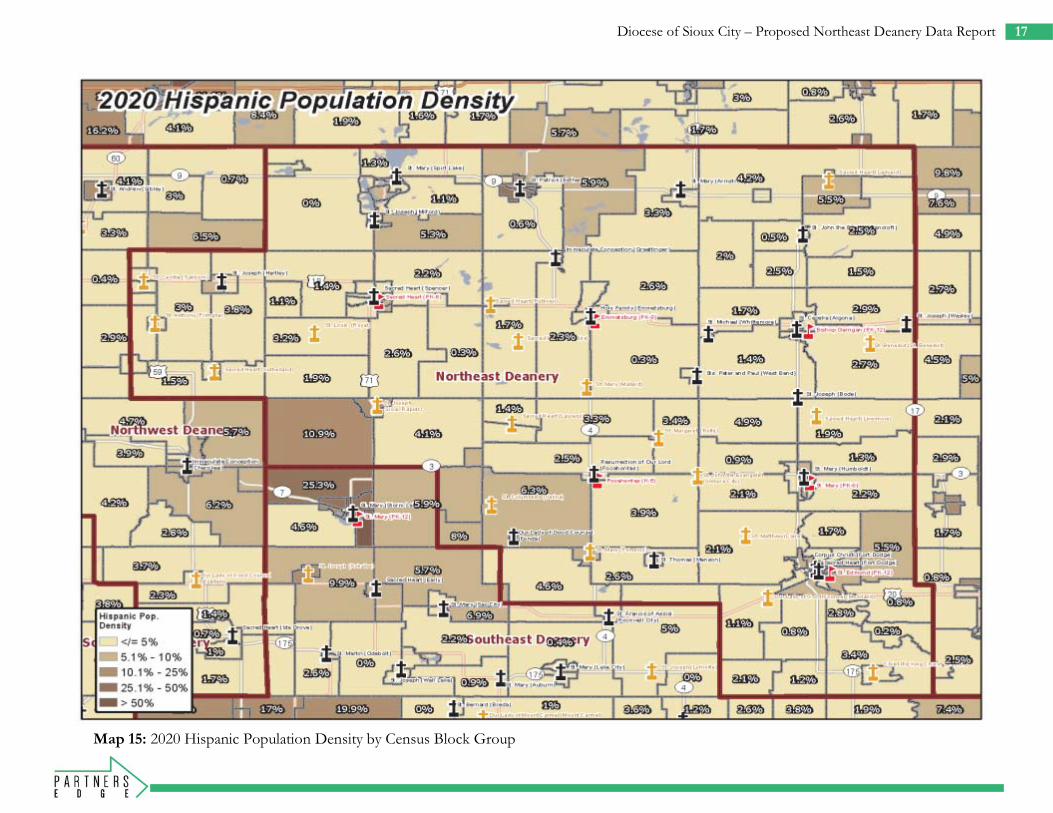
whites was 127,982, which represents 92.4% of the total population (Maps 4 & 5). Since 2010, the total population of whites declined by 2.0%. By 2020, the total population of whites is projected to decline another 1.6% to 125,914, which will represent 90.9% of the total population (Maps 6 & 7). Since 2010, the total number of persons of color has increased by 25.2% from 8,371 to 10,479. In 2015 persons of color accounted for 7.6% of the total population (Maps 8 & 9). Hispanics were the largest group, comprising 3.9% of the total population in 2015 (Maps 10 & 11). Hispanics were followed by blacks (1.6%), other races (1.2%), Asians (0.6%), and American Indians (0.2%). By 2020, the total number of persons of color is expected to grow 20.5% to 12,623 and will account for 9.1% of the total population (Maps 12 & 13). In the same time period, Hispanics are projected to grow 23.0%, where they will comprise 4.8% of the total population (Maps 14 & 15). In addition, growth is projected among blacks (15.9%), American Indians (14.7%), Asians (21.3%), and other races (18.8%). (Note – other races are those persons who identify as a race other than those listed, two or more races, or as Hawaiian/Pacific Islanders).
4 Diocese of Sioux City – Proposed Northeast Deanery Data Report
Map 3: 2015 Total Population by Census Block Group Map 2: 2015 Total Population by Census Block Group

5 Diocese of Sioux City – Proposed Northeast Deanery Data Report
Map 3: 2015-2020 Total Population Percent Change by Census Block Group
6 Diocese of Sioux City – Proposed Northeast Deanery Data Report
Map 5: 2015 Total White Population by Census Block Group Map 4: 2015 Total White Population by Census Block Group

7 Diocese of Sioux City – Proposed Northeast Deanery Data Report
Map 5A: 2015 Total White Population by Census Block Group Map 5: 2015 White Population Density by Census Block Group
8 Diocese of Sioux City – Proposed Northeast Deanery Data Report
Map 7: 2015-2020 Total White Population Percent Change by Census Block Group Map 6: 2015-2020 Total White Population Percent Change by Census Block Group

9 Diocese of Sioux City – Proposed Northeast Deanery Data Report
Map 7A: 2015-2020 Total White Population Percent Change by Census Block Group Map 7: 2020 White Population Density by Census Block Group

10 Diocese of Sioux City – Proposed Northeast Deanery Data Report
Map 9: 2015 Total Persons of Color Population by Census Block Group k
Map 8: 2015 Total Persons of Color Population by Census Block Group

11 Diocese of Sioux City – Proposed Northeast Deanery Data Report
Map 9A: 2015 Total Persons of Color Population by Census Block Group k
Map 9: 2015 Persons of Color Population Density by Census Block Group

12 Diocese of Sioux City – Proposed Northeast Deanery Data Report
Map 11: 2015 Hispanic Population by Census Block Group
Map 10: 2015 Hispanic Population by Census Block Group
13 Diocese of Sioux City – Proposed Northeast Deanery Data Report
Map 12: 2015 Hispanic Population Density by Census Block Group
Map 11: 2015 Hispanic Population by Census Block Group
14 Diocese of Sioux City – Proposed Northeast Deanery Data Report
Map 13: 2015-2020 Persons of Color Population Percent Change by Census Block Group
Map 12: 2015-2020 Persons of Color Population Percent Change by Census Block Group

15 Diocese of Sioux City – Proposed Northeast Deanery Data Report
Map 13A: 2015-2020 Persons of Color Population Percent Change by Census Block Group
Map 13: 2020 Persons of Color Population Density by Census Block Group

16 Diocese of Sioux City – Proposed Northeast Deanery Data Report
Map 15: 2015-2020 Hispanic Population Percent Change by Census Block Group k
Map 14: 2015-2020 Hispanic Population Percent Change by Census Block Group
17 Diocese of Sioux City – Proposed Northeast Deanery Data Report
Map 16: 2020 Hispanic Population Density by Census Block Group k
Map 15: 2020 Hispanic Population Density by Census Block Group k
18 Diocese of Sioux City – Proposed Northeast Deanery Data Report
U.S. CENSUS DEMOGRAPHICS – AGE
Key Findings • The fastest growing age cohort across the Deanery are those
ages 65 and older • Between 2010 and 2015 the total population of those aged 65
and older grew by 6.5% • By 2020 the total population of those aged 65 and older is
expected to grow another 14.2% • Currently, the largest generational group in the Deanery are the
Baby Boomers who comprise 28.0% of the total population • By 2020, the Baby Boomers will still be the largest generational
group in the Deanery and comprise 28.2% of the total population
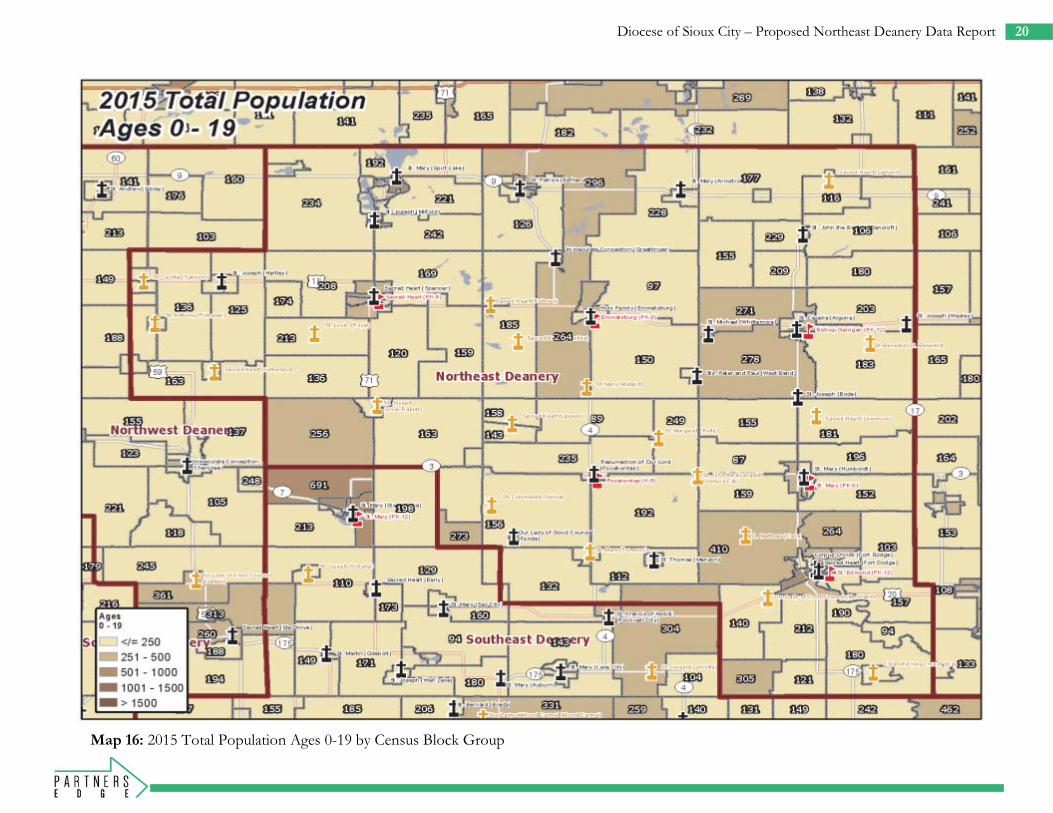
Table 2 summarizes the total population residing within the Deanery by different age groups. If we summarize this data even further into 4 separate age groups of 0–19 year olds, 20–44 year olds, 45-64 year olds, and those ages 65 and older, we find that the total population for these particular groups in 2015 was 32,305; 37,297; 39,705; and 29,154, respectively (Maps 16-19). Thus, 45-64 year olds made up the largest share of the current population (28.7%) followed by 20-44 and 0-19 year olds who comprise 26.9% and 23.3% of the population, respectively. Those ages 65 and older make up the remaining 21.1% of the current population. Since 2010, the total populations of those ages 0-19 and 45-64 have declined by 6.5% and 1.8%, while those ages 20-44 and 65 and older grew by 1.9% and 6.5%, respectively. Five-year projections show that those ages 0-19, 20-44 and 45-64 will decline (0.9%, 1.6% and 8.1%, respectively), while those aged 65 and older are projected to grow (14.2% – Maps 20-23).
Those aged 65 and older is the only age group that will see an increase in the overall share of the total population between 2015 and 2020. By 2020,
those 65 and older will comprise 24.0% of the total population – up from 21.1% in 2015. Meanwhile, those ages 0-19 will comprise a smaller share of the total population (23.1% from 23.3% in 2015), as will 20-44 year olds (26.5% from 26.9%), and 45-64 year olds (26.3% from 28.7%). Further, the median age has been steadily increasing within the Deanery. In 2010 the overall median age stood at 43.9. In 2015 the median age was 44.7, and by 2020 it is expected to increase 1.6% to 45.4. These trends reflect the overall trends seen throughout the rest of the country as the nation’s baby boom generation enters into retirement years.
Another way of examining population age dynamics is by grouping different age ranges by their generational category. In general, each generation has different likes, dislikes, and attributes. A person’s birth date may not always be indicative of their generational characteristics, but as a common group they have similarities. In the United States there are currently 6 living generations categorized by birth date. Here, we combined the oldest 2 generations into 1 category to form 5 generational groups using birth dates and names as recognized by most demographers. Other common names are given in parentheses. Table 3 summarizes the total population residing within the Archdiocese by these different generational groups. The birth dates and names of each generational group reported on in this analysis are as follows:
2000-Present: Generation Z (New Silent Generation) 1980-2000: Generation Y (Millennials) 1965-1979: Generation X 1946-1964: Baby Boomers 1900-1945: G.I./Silent Generation (Greatest Generation)

19 Diocese of Sioux City – Proposed Northeast Deanery Data Report
20 Diocese of Sioux City – Proposed Northeast Deanery Data Report
Map 16: 2015 Total Population Ages 0-19 by Census Block Group Bl k G

21 Diocese of Sioux City – Proposed Northeast Deanery Data Report
Map 18: 2015 Total Population Ages 20-44 by Census Block Group Bl k G
Map 17: 2015 Total Population Ages 20-44 by Census Block Group Bl k G

22 Diocese of Sioux City – Proposed Northeast Deanery Data Report
Map 19: 2015 Total Population Ages 45-64 by Census Block Group Bl k G
Map 18: 2015 Total Population Ages 45-64 by Census Block Group k

23 Diocese of Sioux City – Proposed Northeast Deanery Data Report
Map 20: 2015 Total Population Ages 65 & Older by Census Block Group Bl k G
Map 19: 2015 Total Population Ages 65 & Older by Census Block Group k

24 Diocese of Sioux City – Proposed Northeast Deanery Data Report
Map 21: 2015-2020 Total Population Percent Change (Ages 0-19) by Census Block Group Bl k G
Map 20: 2015-2020 Total Population Percent Change (Ages 0-19) by Census Block G

25 Diocese of Sioux City – Proposed Northeast Deanery Data Report
Map 22: 2015-2020 Total Population Percent Change (Ages 20-44) by Census Block Group G
Map 21: 2015-2020 Total Population Percent Change (Ages 20-44) by Census Block Group k

26 Diocese of Sioux City – Proposed Northeast Deanery Data Report
Map 23: 2015-2020 Total Population Percent Change (Ages 45-64) by Census Block Group
Map 22: 2015-2020 Total Population Percent Change (Ages 45-64) by Census Block Group G

27 Diocese of Sioux City – Proposed Northeast Deanery Data Report
Map 24: 2015-2020 Total Population Percent Change (Ages 65 & Older) by Census Block Grou G
Map 23: 2015-2020 Total Population Percent Change (Ages 65 & Older) by Census Block G

28 Diocese of Sioux City – Proposed Northeast Deanery Data Report
U.S. CENSUS DEMOGRAPHICS – INCOME
Key Findings • In 2015, the median household income across the Deanery was
$47,599 • By 2020, the median household income is projected to grow
12.3% to $54,208
Table 4 summarizes the total number of households residing in the deanery boundary by different median household income ranges. It should be noted that the median household income range does not reflect the actual income of specific households, but instead is based on the particular geographic region in which each household resides. In this case the income data is summarized by census block groups. Thus, each household residing in a particular census block group is assigned the same median household income value. In addition, the U.S. census defines a household as all people who occupy a housing unit regardless of relationship. Thus, a household may consist of a person living alone or multiple unrelated individuals or families living together, whereas a family is defined as two or more people (one of whom is the householder) related by birth, marriage, or adoption residing in the same housing unit. In 2015, the total number of households residing within the deanery boundary was 59,677. The median household income among these households was $47,599 (Map 24). By 2020, it is projected that the total number of households residing within the deanery boundary will grow 0.6% to 60,027. In the same time period the median household income will grow 13.9% to $54,208 (Map 25).

29 Diocese of Sioux City – Proposed Northeast Deanery Data Report
Map 24: 2015 Median Household Income by Census Block Group

30 Diocese of Sioux City – Proposed Northeast Deanery Data Report
Map 26: 2015-2020 Median Household Income Percent Change by Census Block Group
Map 25: 2015-2020 Median Household Income Percent Change by Census Block Group

31 Diocese of Sioux City – Proposed Northeast Deanery Data Report
CATHOLICITY DEMOGRAPHICS
Key Findings • Between 2008 and 2015 the total number of Catholic
households registered at parishes across the Deanery has declined 8.6% from 9,608 to 8,777
• In 2015, approximately 97.7% of all registered Catholic households reside within the Deanery boundary
• In 2015 the percentage of Catholic households residing within the Deanery boundary is approximately 14.5%
Since 2008, the total number of Catholic households registered at parishes located within the Deanery has declined from 9,608 to 8,777 (Chart 1 & Table 5). This represents an overall decline rate of 8.6%. This decline rate contradicts that experienced by the overall population reported by the U.S. Census for the Deanery in the same time period (0.4% decrease in the overall population). It should be noted that for this analysis we use the term ‘household’ rather than ‘family’ as they are defined by the U.S. Census Bureau. The U.S. Census defines a household as “all people who occupy a housing unit regardless of relationship. A household may consist of a person living alone or multiple unrelated individuals or families living together”, whereas a family is defined as “two or more people related by birth, marriage, or adoption residing in the same housing unit.” Thus, by these definitions, a family is always counted as a household but a household is not necessarily counted as a family.
In 2015, there were 8,777 Catholic households registered at parishes throughout the Deanery. By performing a spatial analysis in a Geographic Information System (GIS), it was determined that 8,571 out of the 8,777 current registered Catholic households affiliated with a parish in the Deanery reside within the Deanery boundary (Map 26). This represents 97.7% of all registered Catholic households. Further,
there are an additional 83 registered Catholic households residing within the Deanery boundary who are registered with a parish in the Diocese that is outside of this Deanery. Thus, there are a total of 8,654 registered Catholic households residing within the Deanery boundary. In 2015 the U.S. Census reported a total of 59,677 households living within the Deanery boundary. If we compare U.S. census figures with all registered Catholic households we calculate the percentage of Catholic households living within the Deanery boundary to be approximately 14.5% (Map 27).
9,608
9,390
9,1199,096
8,996 9,085
8,9188,777
8,200
8,400
8,600
8,800
9,000
9,200
9,400
9,600
9,800
Chart 1 - Historical Registered Catholic Households

32 Diocese of Sioux City – Proposed Northeast Deanery Data Report

33 Diocese of Sioux City – Proposed Northeast Deanery Data Report
Map 26: 2015 Registered Catholic Household Distribution

34 Diocese of Sioux City – Proposed Northeast Deanery Data Report
Map 28: 2015 Percent Registered Catholics by Census Block Group Map 27: 2015 Percent Registered Catholics by Census Block Group

35 Diocese of Sioux City – Proposed Northeast Deanery Data Report
MASS ATTENDANCE ANALYSIS
Key Findings • Mass attendance has declined -31.2% between 2008 and 2015,
while the total number of registered Catholic households have declined -8.6% in the same time period
• Mass attendance has decreased as a percentage of the total number of attendees versus the total number of registered parishioners from 62.5% in 2008 to 47.1% in 2015
• Spanish Mass attendees comprised approximately 1.3% of all mass attendees across the Deanery in 2015
• In 2015, Spanish Mass attendees were most prominent in the following parish(es) (as a % of all mass attendees in the parish): o St. Patrick (Estherville) – 6.8% o Holy Trinity (Webster County) – 5.1%
Table 6 reflects the historical weekend mass attendance figures across the Deanery. The weekend mass attendance figures reported here were collected for the entire month of November between the years 2008 and 2015. This data is represented by both the total number of weekend mass attendees for the month, as well as by the total number of attendees as a percentage of the total number of registered parishioners. The tables are organized by the proposed parish cluster design. The total number of individual, registered parishioners was calculated by multiplying the total number of registered Catholic households by the average household size as reported by the U.S. Census Bureau for this region. In this case, the average household size is 2.39 individuals per household. Mass attendance figures and registered Catholic household data were obtained from the Diocese of Sioux City.

36 Diocese of Sioux City – Proposed Northeast Deanery Data Report

37 Diocese of Sioux City – Proposed Northeast Deanery Data Report
38 Diocese of Sioux City – Proposed Northeast Deanery Data Report
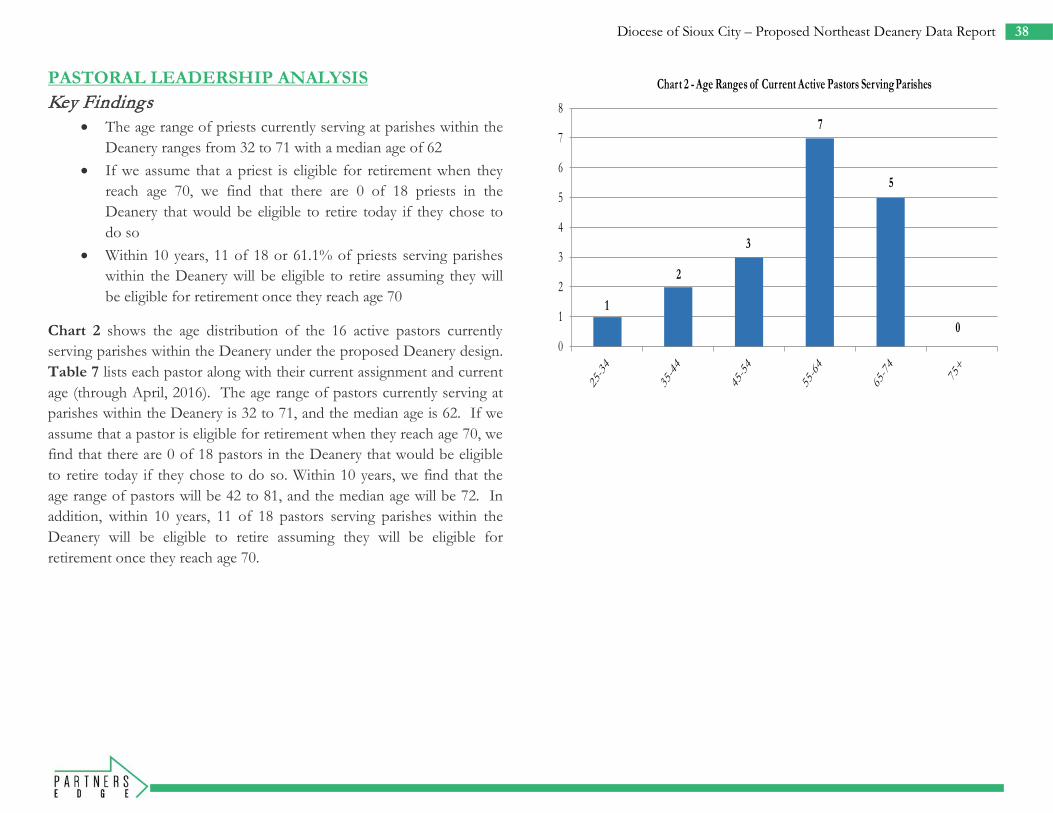
PASTORAL LEADERSHIP ANALYSIS Key Findings
• The age range of priests currently serving at parishes within the Deanery ranges from 32 to 71 with a median age of 62
• If we assume that a priest is eligible for retirement when they reach age 70, we find that there are 0 of 18 priests in the Deanery that would be eligible to retire today if they chose to do so
• Within 10 years, 11 of 18 or 61.1% of priests serving parishes within the Deanery will be eligible to retire assuming they will be eligible for retirement once they reach age 70
Chart 2 shows the age distribution of the 16 active pastors currently serving parishes within the Deanery under the proposed Deanery design. Table 7 lists each pastor along with their current assignment and current age (through April, 2016). The age range of pastors currently serving at parishes within the Deanery is 32 to 71, and the median age is 62. If we assume that a pastor is eligible for retirement when they reach age 70, we find that there are 0 of 18 pastors in the Deanery that would be eligible to retire today if they chose to do so. Within 10 years, we find that the age range of pastors will be 42 to 81, and the median age will be 72. In addition, within 10 years, 11 of 18 pastors serving parishes within the Deanery will be eligible to retire assuming they will be eligible for retirement once they reach age 70.
1
2
3
7
5
00
1
2
3
4
5
6
7
8
Chart 2 - Age Ranges of Current Active Pastors Serving Parishes

39 Diocese of Sioux City – Proposed Northeast Deanery Data Report

40 Diocese of Sioux City – Proposed Northeast Deanery Data Report
WEEKEND MASS & SACRAMENTAL LOAD ANALYSIS Key Findings
• Between 2012 and 2014 the total number of sacraments administered across the Deanery declined 1.0% from 1,517 to 1,502
• Declines in sacraments were seen among first communions 12.6% and weddings 0.8%, while the total number of first communions, confirmations and funerals grew by 4.0%, 5.2% and 1.3%, respectively
• In 2010 the baptism to funeral ratio was 0.93, and in 2014 it was 0.96
Chart 3 and Table 8 shows the total number of sacraments received at parishes across the Deanery from 2012 through 2014. The sacraments reported here include Baptisms, First Communions, Confirmations, Weddings and Funerals. In 2012 the total sacraments received at all parishes was 1,517, and in 2014 the total number of sacraments received was 1,502. Thus, the total number of sacraments administered remained virtually flat. Deanery-wide, declines were seen in first communions 12.6% and weddings 0.8%, while the total number of first communions, confirmations and funerals grew by 4.0%, 5.2% and 1.3%, respectively. A revealing statistic is the ratio of the total number of baptisms to the total number of funerals. This ratio is a rough indicator of the parishioner household demographic patterns of a particular parish, deanery or diocese. Ideally a parish, deanery or diocese would like to see this figure greater than one, and in most cases, much greater than one. Deanery-wide in 2012 this ratio was 0.93. In 2014 this ratio was 0.96.
In addition, sacrament and mass loading index scores were created based on a sacramental loading analysis. The sacrament and mass loading analysis ranks sacraments and weekend masses on a diocesan basis to estimate and compare the amount of time each priest(s) spends on administering sacraments and masses annually, thus creating a process for measuring sacrament load. Weekend masses and sacraments were evaluated by the typical number of hours spent performing and preparing for each service and a formula was created to create a sacramental loading index score. This value was then divided by the total number of full time equivalents (FTE’s) for each parish or set of parishes. This score was then normalized on a scale of 0 to 100, and a map of proportional symbols were developed to better represent the number of hours each parish spends performing sacraments and holding weekend mass (Table 8 & Map 28).
348
297
36238
2
343
334
290 33
9
305
123 140
122
374
359 37
9
050
100150200250300350400450
Chart 3 - Historical SacramentsBaptisms First Communions Confirmations Weddings Funerals

41 Diocese of Sioux City – Proposed Northeast Deanery Data Report
It should be noted that the sacramental loading scores calculated here were based on the total number of sacraments administered over the past 3 years for each pastor assignment cluster. Also, full time equivalents for each parish cluster were based on the total number of pastors, administrators, and parochial vicars assigned to each cluster (as reported in Table 4) with the assumption that each of these positions corresponds to 1 FTE.
The typical number of hours spent preparing for each sacrament and weekend mass was integrated into the analysis as such:
• Weekend Masses – 3 hours • Weddings – 13 hours • Funerals – 12 hours • Baptisms – 2 hours • Communions - 1 hour (per individual) • Confirmations – 1 hour (per individual)
The highest score in the Diocese was assigned to the Carroll-Glidden-Lidderdale cluster in the Southeast Deanery.

42 Diocese of Sioux City – Proposed Northeast Deanery Data Report

43 Diocese of Sioux City – Proposed Northeast Deanery Data Report

44 Diocese of Sioux City – Proposed Northeast Deanery Data Report
Map 28: Weekend Mass & Sacramental Loading Scores

45 Diocese of Sioux City – Proposed Northeast Deanery Data Report
CATHOLIC SCHOOL ENROLLMENT PROJECTIONS & RELIGIOUS EDUCATION PARTICIPATION ANALYSIS
Key Findings • Between school year 2010/2011 and 2015/2016, total PK-12
Catholic school enrollment declined 5.8% from 1,961 to 1,847 • Student enrollment declined among grades K-8 (2.9%) and
grades 9-12 (20.6%) • By school year 2020/2021, total PK-12 Catholic school
enrollment is projected to decline 4.1% from 1,847 to 1,771 • Student enrollment is estimated to decline in grades K-8 (3.2%)
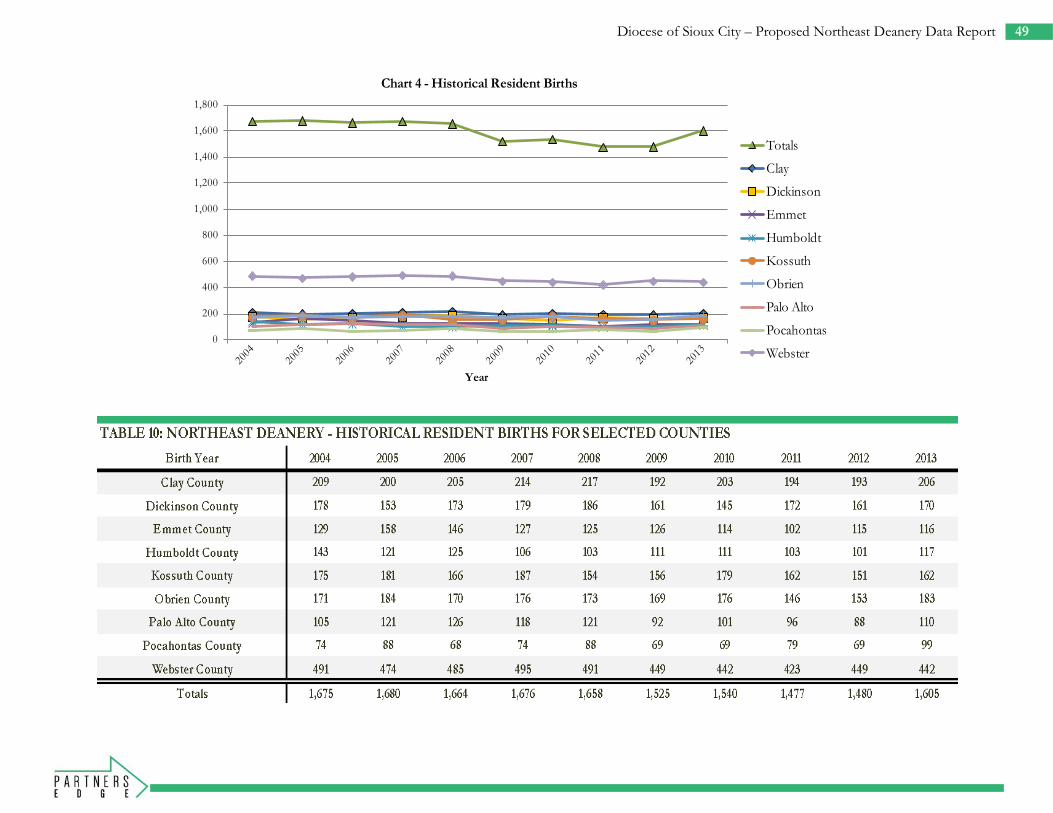
and grades 9-12 (7.1%) • Between 2004 and 2013, the total number of resident births in
selected counties across the Deanery declined by 4.2% from 1,675 to 1,605
• Between 2004 and 2013 births declined across Clay (1.4%), Dickinson (4.5%), Emmet (10.1%), Humboldt (18.2%), Kossuth (7.4%), and Webster (10.0%) Counties, while births grew across Obrien (7.0%), Palo Alto (4.8%) and Pocahontas (33.8%) Counties
• In 2014, approximately 17.8% of all 6 – 18 year olds across the Deanery are enrolled in Catholic schools or participate in religious education programs
This analysis reports historical and projected student enrollments for Catholic Schools located within the Deanery including:
• Bishop Garrigan (Algona) • Emmetsburg Catholic (Emmetsburg) • St. Edmond (Fort Dodge) • St. Mary (Humboldt)
• Pocahontas (Pocahontas) • Sacred Heart (Sacred Heart)
Historical enrollment data was obtained from the Diocese of Sioux City. Five-year enrollment projections for Prekindergarten and Kindergarten were derived by utilizing resident birth data obtained from the Iowa Department of Public Health Bureau of Health Statistics. Projected enrollments for grades 1 through 12 were then calculated by employing a cohort survival methodology. With this method, survival ratios were calculated based on historical student enrollments by dividing the total number of students per grade in a given year by the total number of students in the preceding grade in the previous year. An average of long-term and short-term survival ratios was then utilized to project future 1st through 12th graders. In the school year 2015-2016, there were 1,847 total students in grades PK - 12 enrolled at Catholic schools located within the Deanery (Map 29 & Table 9). In addition, the total K-8 enrollment was 1,282, and total high school enrollment was 336. Since school year 2010-2011, overall PK-12 enrollment at has declined 5.8% from 1,961 to 1,847. In the same time period declines were seen among grades K-8 (2.9%) and grades 9-12 (20.6%). By employing the student projection methodology described previously, it is estimated that the total PK-12 enrollment across the Deanery will decline 4.1% from 1,847 to 1,771 by school year 2020-2021. K-8 enrollment is expected to decline 3.2% from 1,282 to 1,241, while grades 9-12 are projected to decline 7.1% from 336 to 312. The total number of births in a particular region is a strong indicator of future prekindergarten and kindergarten enrollment. Table 10 & Chart 4 reports resident births from 2004 through 2013 for selected counties across the Deanery. the total number of resident births in selected counties across the Deanery declined by 4.2% from 1,675 to

46 Diocese of Sioux City – Proposed Northeast Deanery Data Report
1,605.. Between 2004 and 2013 births declined across Clay (1.4%), Dickinson (4.5%), Emmet (10.1%), Humboldt (18.2%), Kossuth (7.4%), and Webster (10.0%) Counties, while births grew across Obrien (7.0%), Palo Alto (4.8%) and Pocahontas (33.8%) Counties.
This fluctuation in births had a significant impact on Catholic student enrollments, and will most likely continue to do so in the near future.
Table 11 reports 2014 religious education participation figures for all parishes in the Deanery. Thus, if we factor in the total number of Catholic students we find that the total number of students either enrolled in Catholic school or participating in religious education programs in 2014 was 3,730. If we relate this to school-age census data (6 – 18 year olds), we find that the Deanery market share capture of 6 – 18 year olds in 2014 was approximately 17.8%.

47 Diocese of Sioux City – Proposed Northeast Deanery Data Report
Map 29: Catholic Student Distribution

48 Diocese of Sioux City – Proposed Northeast Deanery Data Report
49 Diocese of Sioux City – Proposed Northeast Deanery Data Report
0
200
400
600
800
1,000
1,200
1,400
1,600
1,800
Year
Chart 4 - Historical Resident Births
Totals
Clay
Dickinson
Emmet
Humboldt
Kossuth
Obrien
Palo Alto
Pocahontas
Webster

50 Diocese of Sioux City – Proposed Northeast Deanery Data Report
U.S. CENSUS DEMOGRAPHICS – SCHOOL AGE CHILDREN Key Findings
• Currently, 0-14 year olds comprise 17.3% of the total population in the Deanery
• Since 2010, the total number of 0 -14 year olds has declined 4.8%, where all school-age groups have experienced declines (0-4, 5-9, and 10-14 year olds declined 6.0%, 2.7% and 5.8%, respectively)
• By 2020, it is estimated that 0-14 year olds will decline another 1.1%
• By 2020, declines are projected for 0-4 year olds (3.0%) and 5-9 year olds (4.4%), while 10-14 year olds are projected to grow (4.2%)
• By 2020 it is estimated that 0-14 year olds will comprise 17.1% of the total population in the Deanery, down from 17.3% in 2015
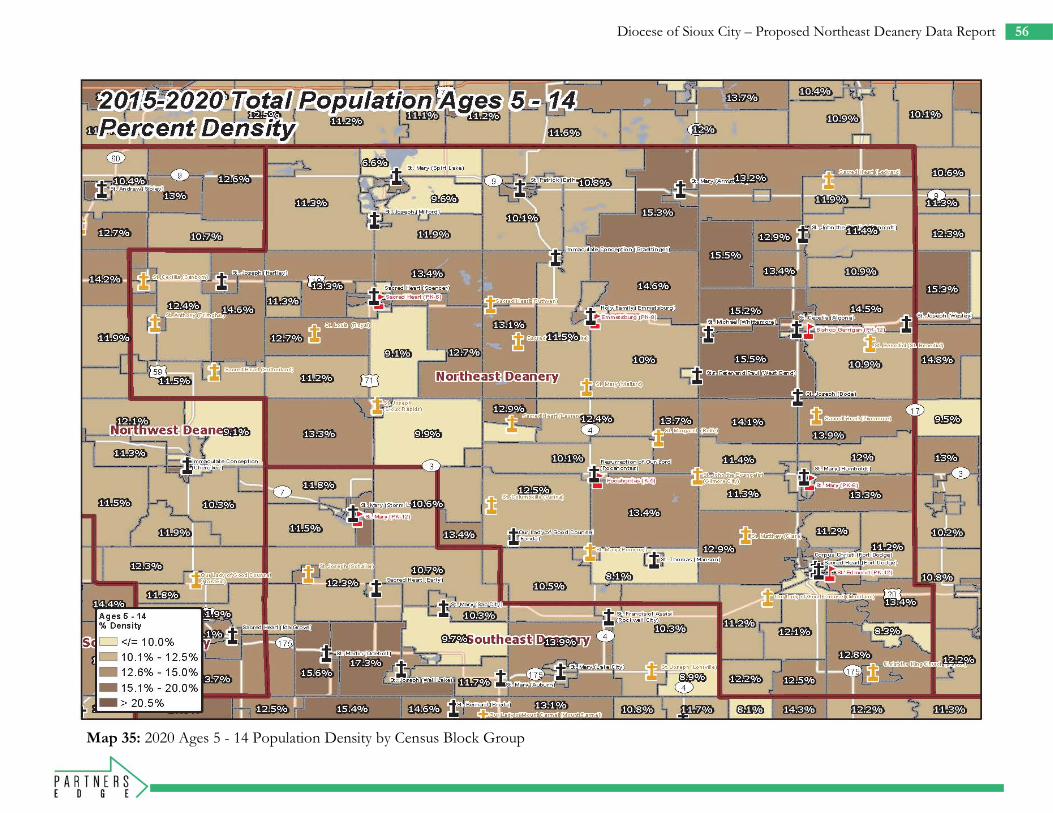
Table 12 summarizes the total population of school-age children residing within the Deanery into 3 separate age groups of 0–4 year olds, 5-9 year olds, and 10-14 year olds. Those ages 0 – 4 represent future students, as well as potential prekindergarten students. Those age 5 – 14 generally correlate with kindergarten through 8th graders. In 2015, the total population for 0-4, 5-9, and 10-14 year olds was 7,764, 8,148, and 8,001; respectively (Maps 30-31). Currently, 0-14 year olds comprise 17.3% of the total population in the Deanery, where 0-4, 5-9, and 10-14 year olds comprise 5.6%, 5.9% and 5.8%, respectively. Since 2010, the total number of 0 -14 year olds has declined 4.8%, where all school-age groups have experienced declines (0-4, 5-9, and 10-14 year olds declined 6.0%, 2.7% and 5.8%, respectively). By 2020, it is estimated that 0-14 year olds will decline by 1.1% (Maps 32-33).
Declines are projected for 0-4 year olds (3.0%) and 5-9 year olds (4.4%), while 10-14 year olds are projected to grow (4.2%). In addition, by 2020 it is estimated that 0-14 year olds will comprise 17.1% of the total population in the Deanery, down slightly from 17.3% in 2015 (Maps 34-35). Declines in the overall share of the population are projected for 0-4 year olds (5.4% from 5.6% in 2015) and 5-9 year olds (5.6% from 5.9% in 2015), while the overall share of 10-14 year olds is projected to increase (6.0% from 5.8% in 2015).

51 Diocese of Sioux City – Proposed Northeast Deanery Data Report
Map 30: 2015 Total Population Ages 0 - 4 by Census Block Group k

52 Diocese of Sioux City – Proposed Northeast Deanery Data Report
Map 31A: 2015 Total Population Ages 0 - 4 by Census Block Group k
Map 31: 2015 Total Population Ages 5 - 14 by Census Block Group k

53 Diocese of Sioux City – Proposed Northeast Deanery Data Report
Map 32A: 2015 Total Population Ages 5 - 14 by Census Block Group k
Map 32: 2015-2020 Total Population Ages 0 - 4 Percent Change by Census Block Group k

54 Diocese of Sioux City – Proposed Northeast Deanery Data Report
Map 33A: 2015-2020 Total Population Ages 0 - 4 Percent Change by Census Block Group k
Map 33: 2015-2020 Total Population Ages 5 - 14 Percent Change by Census Block Group k

55 Diocese of Sioux City – Proposed Northeast Deanery Data Report
Map 34A: 2015-2020 Total Population Ages 5 - 14 Percent Change by Census Block
Map 34: 2020 Ages 0 - 4 Population Density by Census Block Group k
56 Diocese of Sioux City – Proposed Northeast Deanery Data Report
Map 35A: 2020 Ages 0 - 4 Population Density by Census Block Group k
Map 35: 2020 Ages 5 - 14 Population Density by Census Block Group Bl k G

57 Diocese of Sioux City – Proposed Northeast Deanery Data Report
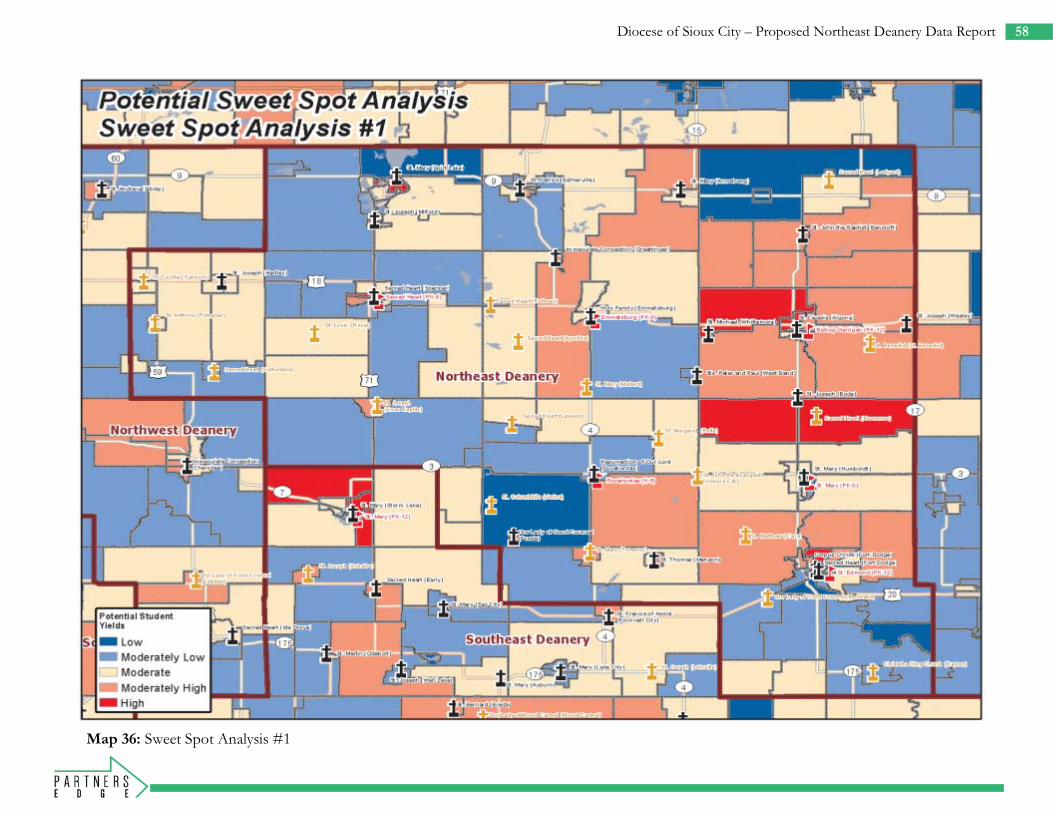
POTENTIAL STUDENT YIELD INDEX MAPPING It is the intention of the Diocese of Sioux City to increase Catholic student enrollment and religious education participation in the future. In order to do this it is useful to analyze, identify and target future geographic areas that will most likely produce high student yields. A potential student yield index analysis based on projected demographic patterns was performed for the Deanery. By appending demographic census data and catholicity data at the block group level in the Deanery, individual indices were created at the block group level for each of the following variables: projected median household income, percent catholicity, projected age under 5 population, and projected age 5-14 population. The index values ranged from 1-5 and each variable was assigned to the appropriate range; 1 indicating the least likely range to yield students, and 5 indicating the most likely. These variables were then overlaid and geospatially added together using a geographical information system (GIS) to create a spatial layer with index values ranging from 4 - 20 (see inset to the right). This new layer was then re-classified into 5 new ranges. Low index values were assigned to a low and moderately low potential classification, middle index values were grouped into a moderate potential classification, and high index values were grouped into a moderately high and high potential classification. This layer was then mapped (Map 36) to reflect the spatial representation or ‘Sweet-Spot Analysis’ of the 5 new classes. Map 37 is similar to that of Map 36; however, Map 37 was based on patterns of projected populations of 0-4 and 5-14 year olds only. The sweet-spot analysis reveals that future Catholic, student populations will most likely come from those areas in light red and red.
Those areas in beige will most likely produce moderate student yields, while those areas in light blue and blue will most likely result in lower student yields.
58 Diocese of Sioux City – Proposed Northeast Deanery Data Report
Map 36: Sweet Spot Analysis #1 k

59 Diocese of Sioux City – Proposed Northeast Deanery Data Report
Map 38A: Sweet Spot Analysis #2 k
Map 37A: Sweet Spot Analysis #1 Bl k G
Map 37: Sweet Spot Analysis #2 k