niang et al 2014
TRANSCRIPT

Reproductive Isolation among Sympatric MolecularForms of An. gambiae from Inland Areas of South-Eastern SenegalEl Hadji Amadou Niang1,2, Lassana Konate2, Mawlouth Diallo1, Ousmane Faye2, Ibrahima Dia1*
1 Unite d’Entomologie Medicale, Institut Pasteur de Dakar, Dakar, Senegal, 2 Laboratoire d’Ecologie Vectorielle et Parasitaire, Universite Cheikh Anta Diop de Dakar, Dakar,
Senegal
Abstract
The Anopheles gambiae species complex includes at least seven morphologically indistinguishable species, one of which,Anopheles gambiae sensu stricto, is the primary mosquito vector responsible for the transmission of malaria across sub-Saharan Africa. Sympatric ecological diversification of An. gambiae s.s. is in progress within this complex, leading to theemergence of at least two incipient species (the M and S molecular forms now recognized as good species and named An.coluzzii and An. gambiae respectively) that show heterogeneous levels of divergence in most parts of Africa. However, thisprocess seems to have broken down in coastal areas of West Africa at the extreme edge of the distribution. We undertook alongitudinal study to describe An. gambiae s.s. populations collected from two inland transects with different ecologicalcharacteristics in south-eastern Senegal. Analysis of samples collected from 20 sites across these two transects showed theM and S molecular forms coexisted at almost all sampled sites. Overall, similar hybridization rates (2.16% and 1.86%) wererecorded in the two transects; sites with relatively high frequencies of M/S hybrids (up to 7%) were clustered toward thenorth-western part of both transects, often near urban settings. Estimated inbreeding indices for this putative speciationevent varied spatially (range: 0.52–1), with hybridization rates being generally lower than expected under panmicticconditions. Such observations suggest substantial reproductive isolation between the M and S molecular forms, and furthersupport the ongoing process of speciation in these inland areas. According to a recent reclassification of the An. gambiaecomplex, the M and S molecular forms from this zone correspond to An. coluzzii and An. gambiae, respectively. There isconsiderable evidence that these molecular forms differ in their behavioural and ecological characteristics. Detailed study ofthese characteristics will allow the development and implementation of better insect control strategies for combatingmalaria.
Citation: Niang EHA, Konate L, Diallo M, Faye O, Dia I (2014) Reproductive Isolation among Sympatric Molecular Forms of An. gambiae from Inland Areas ofSouth-Eastern Senegal. PLoS ONE 9(8): e104622. doi:10.1371/journal.pone.0104622
Editor: Basil Brooke, National Institute for Communicable Diseases/NHLS, South Africa
Received April 15, 2014; Accepted July 11, 2014; Published August 6, 2014
Copyright: � 2014 Niang et al. This is an open-access article distributed under the terms of the Creative Commons Attribution License, which permitsunrestricted use, distribution, and reproduction in any medium, provided the original author and source are credited.
Data Availability: The authors confirm that all data underlying the findings are fully available without restriction. All relevant data are within the paper and itsSupporting Information files.
Funding: This study was funded by the EU project INFRAVEC (Research capacity for the implementation of genetic control of Mosquitoes); funded by theEuropean Commission’s Seventh Framework Research Programme under the grant agreement 228421). The funders had no role in study design, data collectionand analysis, decision to publish, or preparation of the manuscript.
Competing Interests: The authors have declared that no competing interests exist.
* Email: [email protected]
Introduction
Members of the Anopheles gambiae complex are the main
vectors of malaria in most parts of Africa. This complex is made
up of at least seven closely related species that cannot be
distinguished using classic taxonomic methods [1]. Across their
range, these species show different ecological and behavioural
characteristics and include two of the most efficient human
malaria vectors worldwide: An. arabiensis and An. gambiae sensu
stricto that have the widest distribution of species in the complex
[2].
Earlier studies addressing gene flow within the complex showed
that An. gambiae s.s. is divided into reproductively isolated sub-
populations. Five chromosomal forms were initially identified
(Forest, Savanna, Bamako, Mopti, and Bissau), based on their
patterns of chromosome 2 inversions [1,3]. Studies to determine
the taxonomic status of these chromosomal variants revealed that
An. gambiae s.s. contains two molecular forms, M and S, which
are recognizable by differences in their rDNA sequences [4,5].
The S form is distributed widely throughout the An. gambiaespecies range, whereas the M form is restricted to western parts of
Africa, where it is common. Hybridization between them is rare in
most areas of sympatry [6]; extensive studies conducted through-
out areas of sympatric distribution showed variable but restricted
gene flow between the M and S forms [2,6,7]. This has resulted in
the two forms being recognized as good species named An. coluzziiand An. gambiae respectively [8]. However, studies in coastal areas
at the western extreme of the geographical range found a higher
than expected hybridization rate. In areas surrounding The
Gambia, high levels of M/S hybrids were reported at sites near the
west coast (3% at Dielmo, Senegal [9]; 7% at Njabakunda, The
Gambia [10]; and 24% at Antula, Guinea-Bissau [11]). More
recently, Nwakanma et al. [12] reported high frequencies (5–42%)
of M/S hybrid forms at 12 sites in the four contiguous countries of
PLOS ONE | www.plosone.org 1 August 2014 | Volume 9 | Issue 8 | e104622
The Gambia, Senegal, Guinea-Bissau and Republic of Guinea.
However, in other coastal areas of Africa the observed frequency
of M/S hybrids did not exceed 0.2% [7,13] and so it is unknown
whether this phenomenon is specific to the westernmost areas of
West Africa, including Senegambia. We undertook a longitudinal
study within two transects under differential insecticide pressure in
inland areas in south-eastern Senegal to (i) study the distribution
patterns of the M and S molecular forms, (ii) estimate the
frequencies of M/S hybrids in these sites, and (iii) use our
observations to determine the extent of ongoing speciation in these
inland areas.
Materials and Methods
Ethics statementNo specific permission was required for work in each of the
selected villages. After explaining the purpose of this study, verbal
consent was obtained from the village chief as well as from heads
of households. The study did not involve endangered or protected
species.
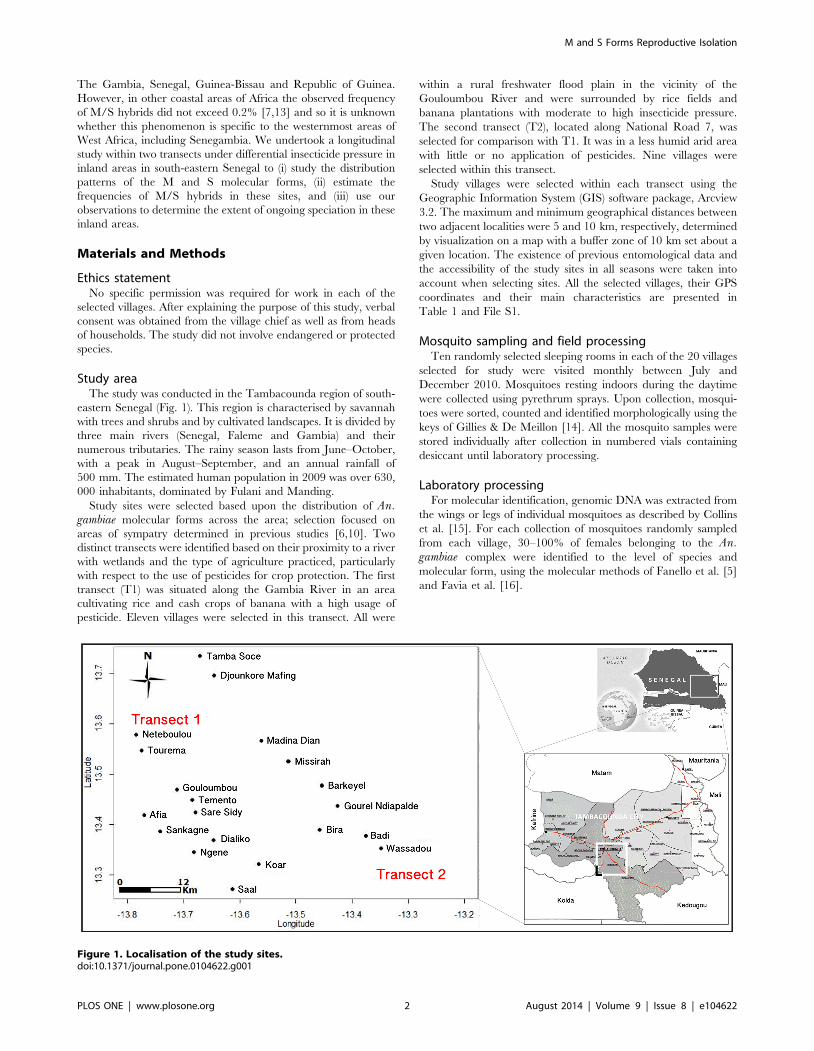
Study areaThe study was conducted in the Tambacounda region of south-
eastern Senegal (Fig. 1). This region is characterised by savannah
with trees and shrubs and by cultivated landscapes. It is divided by
three main rivers (Senegal, Faleme and Gambia) and their
numerous tributaries. The rainy season lasts from June–October,
with a peak in August–September, and an annual rainfall of
500 mm. The estimated human population in 2009 was over 630,
000 inhabitants, dominated by Fulani and Manding.
Study sites were selected based upon the distribution of An.gambiae molecular forms across the area; selection focused on
areas of sympatry determined in previous studies [6,10]. Two
distinct transects were identified based on their proximity to a river
with wetlands and the type of agriculture practiced, particularly
with respect to the use of pesticides for crop protection. The first
transect (T1) was situated along the Gambia River in an area
cultivating rice and cash crops of banana with a high usage of
pesticide. Eleven villages were selected in this transect. All were
within a rural freshwater flood plain in the vicinity of the
Gouloumbou River and were surrounded by rice fields and
banana plantations with moderate to high insecticide pressure.
The second transect (T2), located along National Road 7, was
selected for comparison with T1. It was in a less humid arid area
with little or no application of pesticides. Nine villages were
selected within this transect.
Study villages were selected within each transect using the
Geographic Information System (GIS) software package, Arcview
3.2. The maximum and minimum geographical distances between
two adjacent localities were 5 and 10 km, respectively, determined
by visualization on a map with a buffer zone of 10 km set about a
given location. The existence of previous entomological data and
the accessibility of the study sites in all seasons were taken into
account when selecting sites. All the selected villages, their GPS
coordinates and their main characteristics are presented in
Table 1 and File S1.
Mosquito sampling and field processingTen randomly selected sleeping rooms in each of the 20 villages
selected for study were visited monthly between July and
December 2010. Mosquitoes resting indoors during the daytime
were collected using pyrethrum sprays. Upon collection, mosqui-
toes were sorted, counted and identified morphologically using the
keys of Gillies & De Meillon [14]. All the mosquito samples were
stored individually after collection in numbered vials containing
desiccant until laboratory processing.
Laboratory processingFor molecular identification, genomic DNA was extracted from
the wings or legs of individual mosquitoes as described by Collins
et al. [15]. For each collection of mosquitoes randomly sampled
from each village, 30–100% of females belonging to the An.gambiae complex were identified to the level of species and
molecular form, using the molecular methods of Fanello et al. [5]
and Favia et al. [16].
Figure 1. Localisation of the study sites.doi:10.1371/journal.pone.0104622.g001
M and S Forms Reproductive Isolation
PLOS ONE | www.plosone.org 2 August 2014 | Volume 9 | Issue 8 | e104622
Data analysisThe proportions of each species and molecular form were
estimated and their means compared between study sites and
transects by ANOVA. Prior to comparison, the constancy of
variance (homoscedasticity) was checked using Bartlett and Fligner–
Killeen tests. The frequencies of M/S hybrids were compared with
Hardy-Weinberg expectations using the exact test procedures
implemented in GENEPOP software (version 3.4) [17]. Moran’s Istatistic [18] was used to determine spatial autocorrelation by
measuring the correlation among neighbouring sites, to find the
patterns and the levels of spatial clustering (i.e., clustered, dispersed,
or random). The first step in the analysis is to construct a spatial
weight matrix that contains information about the neighbourhood
structure for each site. Adjacency is defined as immediately
neighbouring sites, inclusive of the site itself. Non-neighbouring sites
are given a weight of zero. The sites with high and low clustering
were identified using the Getis-Ord Gi* statistic ([19] and File S2).
Statistically significant (at a level of 0.05) clusters of sites with high
M/S frequencies were identified with Z scores .1.96. Clustered sites
with low M/S frequencies were identified with Z scores ,–1.96.
The Moran scatterplot was used to classify local clustering
further into four classes by comparing the frequency of M/S
hybrids at each sampling site with that at neighbouring sites. All
analyses were performed using R software (version 3.0.2).
Results
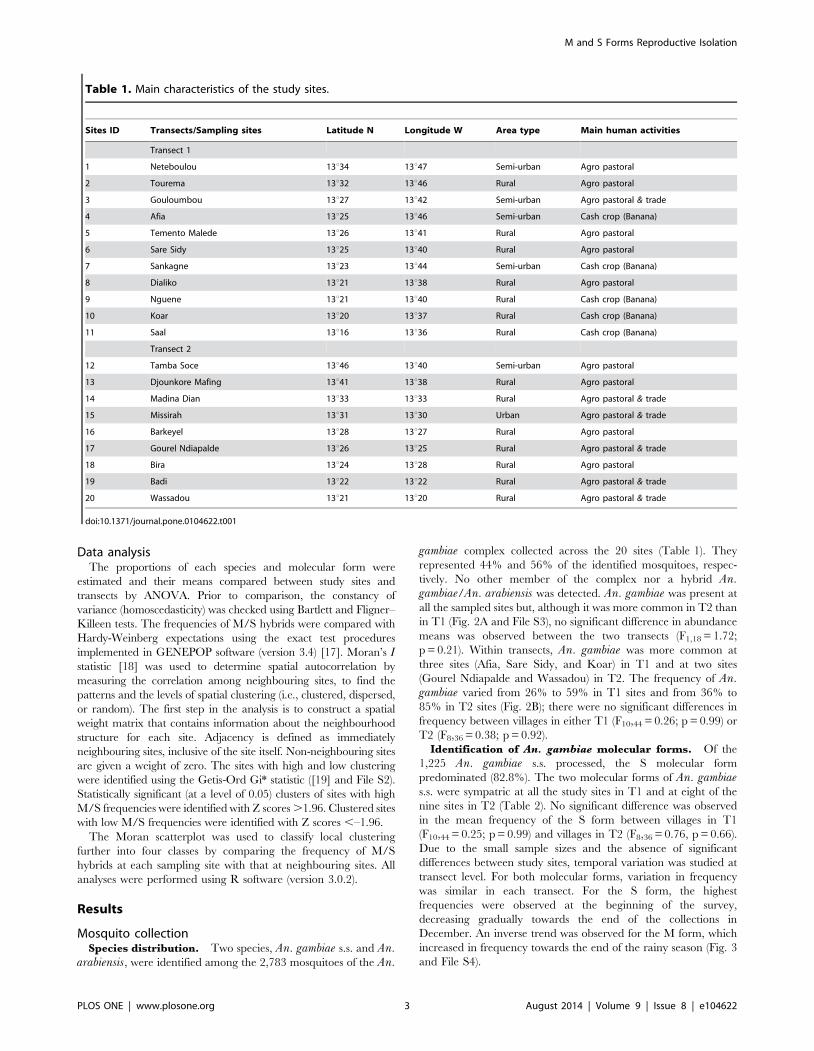
Mosquito collectionSpecies distribution. Two species, An. gambiae s.s. and An.
arabiensis, were identified among the 2,783 mosquitoes of the An.
gambiae complex collected across the 20 sites (Table 1). They
represented 44% and 56% of the identified mosquitoes, respec-
tively. No other member of the complex nor a hybrid An.gambiae/An. arabiensis was detected. An. gambiae was present at
all the sampled sites but, although it was more common in T2 than
in T1 (Fig. 2A and File S3), no significant difference in abundance
means was observed between the two transects (F1,18 = 1.72;
p = 0.21). Within transects, An. gambiae was more common at
three sites (Afia, Sare Sidy, and Koar) in T1 and at two sites
(Gourel Ndiapalde and Wassadou) in T2. The frequency of An.gambiae varied from 26% to 59% in T1 sites and from 36% to
85% in T2 sites (Fig. 2B); there were no significant differences in
frequency between villages in either T1 (F10,44 = 0.26; p = 0.99) or
T2 (F8,36 = 0.38; p = 0.92).
Identification of An. gambiae molecular forms. Of the
1,225 An. gambiae s.s. processed, the S molecular form
predominated (82.8%). The two molecular forms of An. gambiaes.s. were sympatric at all the study sites in T1 and at eight of the
nine sites in T2 (Table 2). No significant difference was observed
in the mean frequency of the S form between villages in T1
(F10,44 = 0.25; p = 0.99) and villages in T2 (F8,36 = 0.76, p = 0.66).
Due to the small sample sizes and the absence of significant
differences between study sites, temporal variation was studied at
transect level. For both molecular forms, variation in frequency
was similar in each transect. For the S form, the highest
frequencies were observed at the beginning of the survey,
decreasing gradually towards the end of the collections in
December. An inverse trend was observed for the M form, which
increased in frequency towards the end of the rainy season (Fig. 3
and File S4).
Table 1. Main characteristics of the study sites.
Sites ID Transects/Sampling sites Latitude N Longitude W Area type Main human activities
Transect 1
1 Neteboulou 13u34 13u47 Semi-urban Agro pastoral
2 Tourema 13u32 13u46 Rural Agro pastoral
3 Gouloumbou 13u27 13u42 Semi-urban Agro pastoral & trade
4 Afia 13u25 13u46 Semi-urban Cash crop (Banana)
5 Temento Malede 13u26 13u41 Rural Agro pastoral
6 Sare Sidy 13u25 13u40 Rural Agro pastoral
7 Sankagne 13u23 13u44 Semi-urban Cash crop (Banana)
8 Dialiko 13u21 13u38 Rural Agro pastoral
9 Nguene 13u21 13u40 Rural Cash crop (Banana)
10 Koar 13u20 13u37 Rural Cash crop (Banana)
11 Saal 13u16 13u36 Rural Cash crop (Banana)
Transect 2
12 Tamba Soce 13u46 13u40 Semi-urban Agro pastoral
13 Djounkore Mafing 13u41 13u38 Rural Agro pastoral
14 Madina Dian 13u33 13u33 Rural Agro pastoral & trade
15 Missirah 13u31 13u30 Urban Agro pastoral & trade
16 Barkeyel 13u28 13u27 Rural Agro pastoral
17 Gourel Ndiapalde 13u26 13u25 Rural Agro pastoral & trade
18 Bira 13u24 13u28 Rural Agro pastoral
19 Badi 13u22 13u22 Rural Agro pastoral & trade
20 Wassadou 13u21 13u20 Rural Agro pastoral & trade
doi:10.1371/journal.pone.0104622.t001
M and S Forms Reproductive Isolation
PLOS ONE | www.plosone.org 3 August 2014 | Volume 9 | Issue 8 | e104622
Spatial analysis of M/S hybrid distributionOverall, the frequency of M/S hybrids was estimated at 2.16%
in T1 (range: 0–6.7%) and 1.86% in T2 (range: 0–5.3%). The
highest frequencies were observed in the north-western parts of
both transects (Fig. 4A). Analysis of M/S hybrid frequencies
showed significant deviations from the Hardy-Weinberg equilib-
rium in all samples, except for that collected in the village of
Tamba Soce (Table 2).
Spatial analysis indicated positive spatial autocorrelation or
clustering for M/S hybrids (Moran’s I value = 0.38; Z
score = 0.002; p = 0.03). The resultant Z scores for the Getis-Ord
Gi* hot spot analysis (using inverse-distance weighting) indicated
the presence of spatial clusters of M/S hybrid frequencies. The
clustering trends are shown in Fig. 4A. For T1, seven locations,
predominantly in the north-eastern part, had positive Z scores
(ranging from 0.03–2.22), while the remaining four locations,
predominately in the south-western part, had negative Z scores
(ranging from –1.94–1.04). For T2, two locations in the north-
eastern part with high frequencies of M/S hybrids clustered
significantly (Z scores.1.96), whereas five locations in the south-
western part had negative Z scores (ranging from –1.76–1.09).
On the Moran scatter plot of M/S hybrid frequencies, sampling
units at the site level were distributed in the four quadrants of the
scatter plot, and all four types of association between spatial units
(High-High, High-Low, Low-High, Low-Low) were represented
(Fig. 4B). The dominant types of association were represented by
Low-Low (cold spots) and High-High (hot spots) with four sites for
both types in T1 and two cold spots and five hot spots in T2. Two
sampling sites (both located in T1) with high influence on the
global autocorrelation were identified (Afia in the Low-High and
Sankagne in the High-High quadrants). In both transects, the
mean M/S frequencies differed significantly between High-High
and Low-Low clusters (Table 3).
Discussion
These results provide a spatial and temporal picture of the
distribution of species and molecular forms of An. gambiae in an
inland area of eastern Senegal, as well as the variation in the
frequency of M/S forms. The absence of An. melas from our
samples is most likely due to our sampling sites being situated far
from coastal regions. Unlike previous entomological studies
conducted in the southern zone of Senegal [6,20,21], we found
that An. arabiensis was more common than An. gambiae. It is
possible, given the zoo-anthropophilic and exophilic behaviour of
this species, that collection methodology biased the sampling;
however, as we used the same collection methods as previous
studies, the difference in our results may result from an increase in
the use of insecticides in this zone to control endophagic vectors
since the earlier studies were conducted. Our current observations
support recent results indicating that An. gambiae s.s. is the
prevailing species in coastal regions of The Gambia and
surrounding areas in Senegal, whilst its sibling species, An.arabiensis, is more common in inland areas [10,11]. Similar
observations were also made by Onyabe and Conn [22] and
Kristan et al. [23], who found An. arabiensis more abundant in
the Guinean region in the south of Nigeria. These results indicate
that An. arabiensis is extending its range southwards, from drier
savannah into humid forest habitats. Such a process could result
from drought and/or human activity (deforestation and urbani-
zation), as suggested by Lindsay and Martens [24]. We note,
however, that in our study An. arabiensis was more abundant in
inland areas along the same latitudinal line and, thus, the causes of
the extended range of An. arabiensis may result from other as yet
unidentified factors. These might include the types of breeding
sites provided by marshes and rice fields, which are more prevalent
habitats in areas with the highest densities of An. gambiae [10,25].
The S molecular form was prevalent in almost all our study sites
throughout the study period. This is consistent with previous
observations that the S form is more common than the M form in
Figure 2. Variations of the mean frequencies of An. arabiensis and An. gambiae. A: between transects, bars represent standard errors. B:within villages in each transect (Transect 1 = T1, Transect 2 = T2).doi:10.1371/journal.pone.0104622.g002
M and S Forms Reproductive Isolation
PLOS ONE | www.plosone.org 4 August 2014 | Volume 9 | Issue 8 | e104622

Ta
ble
2.
Fre
qu
en
cie
so
fsp
eci
es
wit
hin
An
op
hel
esg
am
bia
eco
mp
lex
and
of
mo
lecu
lar
form
so
fA
no
ph
eles
ga
mb
iae
s.s.
inth
etw
otr
anse
cts.
Tra
nse
cts/
Sa
mp
lin
gsi
tes
Co
lle
cte
dS
ibli
ng
spe
cie
sid
en
tifi
cati
on
Mo
lecu
lar
form
sid
en
tifi
cati
on
NA
n.
arab
ien
sis
An
.g
amb
iae
s.s.
NM
-fo
rmS
-fo
rmM
/Sh
yb
rid
s
%%
%%
Ob
s.E
xp
.F
is
Tra
nse
ct1
Ne
teb
ou
lou
16
61
46
60
.33
9.7
58
19
.07
9.3
1.7
31
.8+0
.95
To
ure
ma
23
11
46
73
.32
6.7
39
23
.07
4.4
2.6
36
.9+0
.93
Go
ulo
um
bo
u4
35
30
06
1.0
39
.01
17
16
.27
8.6
5.2
30
.5+0
.83
Afi
a1
24
94
45
.75
4.3
51
11
.88
6.2
2.0
22
.2+0
.91
Te
me
nto
Mal
ed
e3
62
15
67
3.7
26
.34
11
9.5
78
.02
.53
2.9
+0.9
3
Sare
Sid
y2
05
10
44
6.2
53
.85
67
.18
9.3
3.6
16
.3+0
.78
San
kag
ne
37
71
74
74
.12
5.9
45
26
.76
6.6
6.7
42
.0+0
.84
Dia
liko
12
61
20
50
.84
9.2
59
22
.07
8.0
0.0
34
.4+1
Ng
ue
ne
41
61
59
61
.03
9.0
62
21
.07
9.0
0.0
33
.1+1
Ko
ar3
10
25
64
1.0
59
.01
51
15
.98
3.4
0.7
27
.2+0
.98
Saal
32
41
65
62
.43
7.6
62
30
.66
9.4
0.0
42
.5+1
Tra
nse
ct2
Tam
ba
Soce
50
48
60
.43
9.6
19
0.0
94
.75
.35
.1–
0.0
3*
Djo
un
kore
Maf
ing
35
62
13
50
.24
9.8
10
62
.89
2.5
4.7
9.8
+0.5
2
Mad
ina
Dia
n6
96
66
3.6
36
.42
48
.38
7.5
4.2
18
.7+0
.78
Mis
sira
h1
41
46
4.3
35
.75
20
.08
0.0
0.0
32
.0+1
Bar
keye
l1
80
88
62
.53
7.5
33
12
.18
7.9
0.0
21
.3+1
Go
ure
lN
dia
pal
de
10
08
51
5.3
84
.77
25
.69
3.0
1.4
11
.7+0
.88
Bir
a7
46
14
1.0
59
.03
65
.69
4.4
0.0
10
.5+1
Bad
i3
31
22
66
2.4
37
.68
52
9.4
70
.60
.04
1.5
+1
Was
sad
ou
34
81
62
35
.86
4.2
10
46
.79
2.3
1.0
13
.4+0
.93
%=
Pe
rce
nta
ge
,O
bs.
=o
bse
rve
d,
Exp
.=e
xpe
cte
d,
Fis
=in
bre
ed
ing
coe
ffic
ien
tca
lcu
late
dac
cord
ing
toW
eir
and
Co
cke
rham
[37
],Fi
s,0
ind
icat
ean
exc
ess
of
he
tero
zyg
ote
s,Fi
s.0
de
no
teh
ete
rozy
go
tes
de
fici
en
cy,
*no
sig
nif
ican
td
evi
atio
nfr
om
Har
dy–
We
inb
erg
exp
ect
atio
ns
(P.
0.0
5).
do
i:10
.13
71
/jo
urn
al.p
on
e.0
10
46
22
.t0
02
M and S Forms Reproductive Isolation
PLOS ONE | www.plosone.org 5 August 2014 | Volume 9 | Issue 8 | e104622

eastern Senegal [6,11]. In West Africa, the two forms are
frequently found in sympatry from the Sudan–Guinea savannahs,
below 13u N, to the more humid and forested areas, above 4u S,
including Senegal [6].
Several studies suggest that the nature of larval habitats is the
principal ecological factor responsible for divergence between
molecular forms within the An. gambiae complex [26,27,28,29]. In
rural sites situated within freshwater floodplains, the presence of
numerous rain-dependent breeding habitats in the form of
temporary water bodies such as puddles, tyre tracks and animal
footprints may produce conditions more favourable to the S form.
This idea is supported by the more frequent presence of the M
form in areas with a greater number of permanent breeding sites
[30] and by studies showing its increased abundance in arid areas
and during the dry season, when only permanent oviposition sites
are available [28]. We also observed higher frequencies of the M
form towards the end of the rainy season (November–December),
when permanent breeding sites become more prevalent; however,
a similar ecological division is absent from Central Africa,
emphasizing the difficulty in generalizing putative phenotypic
differences from studies conducted in a single area [27]. Local
adaptation within forms may be common, as extensive genetic
studies highlighted genetic subdivision within the M form
Figure 3. Temporal variations of the mean frequencies of M and S forms in each of the two transects from July to December 2010.Bars represent standard errors. For each period, collections took place from the last week of a given month to the first week of the following month.doi:10.1371/journal.pone.0104622.g003
M and S Forms Reproductive Isolation
PLOS ONE | www.plosone.org 6 August 2014 | Volume 9 | Issue 8 | e104622

[31,32,33,34], and such differences may explain the observed
patterns of distribution.
We identified and genotyped 1,207 An. gambiae s.s. and found
M/S hybrids were present at frequencies of up to 7%. This is a
relatively high rate of hybridization in comparison with the 1%
heterogamous insemination recorded in several west African
populations [2,6,35], but low when compared with populations
from ‘‘far-west’’ Africa [10,11,12]. Therefore, the breakdown in
reproductive isolation observed in coastal areas of The Gambia,
Senegal and Guinea-Bissau is not observed in this inland zone.
However, in our study, sites with relatively high hybridization rates
clustered near urban settings in the north-western part of both
transects; thus, the high hybridization rates could result from
anthropogenic impacts. This is consistent with the results of
Kamdem et al. [36] who showed in a central African rainforest the
presence of M/S hybrids only in a peri-urban zone of sympatry
and that the pattern of occurrence of molecular forms was spatially
structured, and that the frequency of each form within a locality
was not independent of the frequencies in surrounding sites. In our
sampling plan, distances between collection sites were set at 5–
10 km, and so non-independence of samples may account in part
for the observed patterns of clustering in these areas.
We found substantial reproductive isolation between the M and
S forms in many sites, adding further support to the proposition
that a speciation process is currently underway in An. gambiae.
However, the results also indicate that the breakdown of this
Figure 4. Spatial distribution of M/S hybrids frequencies. Spatial clustering trends (A). Significance of clustering was analysed using the Getis-Ord Gi* statistic [19]. (Z scores.0 indicates a clustering trend of high MS hybrids frequencies and Z scores,0 indicates a clustering trend of low MShybrids frequencies. Significant Z scores (p,0.05) are in red. Moran scatter plots at site level (B). The names of the sites with large contributions toautocorrelation are displayed.doi:10.1371/journal.pone.0104622.g004
Table 3. Characteristics of clusters classes.
Transects Characteristics Clusters classes
of clusters High-High High-Low Low-High Low-Low
Transect 1 MS range 2.5–7.14 2.63 1.75–2.00 0–0.67
Mean MS6SE 4.6961.01a 2.63a, b 1.8860.12a, b 0.1760.17b
Sampling sites 4 1 2 4
Transect 2 MS range 4.95–5.55 4.35 0 0–1.41
Mean MS6SE 5.2560.30a 4.35a 0b 0.47–0.30b
Sampling sites 2 1 1 5
MS = MS hybrids frequencies.For the different clusters, means with different letters are significantly different (p,0.05).doi:10.1371/journal.pone.0104622.t003
M and S Forms Reproductive Isolation
PLOS ONE | www.plosone.org 7 August 2014 | Volume 9 | Issue 8 | e104622
process seen in coastal areas [12] is absent from inland sites. The
M and S molecular forms in the present study correspond to An.coluzzii Coetzee & Wilkerson sp.n. and An. gambiae Giles,
respectively, as described in a recent reclassification of the An.gambiae species complex [8]. The application of whole-genome
studies should further provide more information about the extent
of the genetic isolation. From applications perspective, future
scaling up of insect control strategies based on insecticide-
impregnated materials and indoor residual spraying will need to
take into account the mounting evidence that molecular forms
differ in their utilization of breeding sites and their response to
environmental change. Therefore, further detailed study of these
behavioural and ecological characteristics will allow the develop-
ment and implementation of better control strategies for malaria.
Supporting Information
File S1 Table, Detailed characteristics of the studiedvillages.
(PDF)
File S2 Text, Estimation of Global Moran’s I statisticand Local Gi*(d) statistic. Table, Z scores for each of the 20
sites.
(PDF)
File S3 Figures, Temporal variations of the frequenciesof An. arabiensis and An. gambiae in each of the twotransects from July to december 2010. Table, Comparison
of the mean frequencies of An. gambiae and An. arabiensisbetween the two transects.
(PDF)
File S4 Figures. Temporal variations of the M/S hybrids
frequencies in each of the two transects. Table. Comparison of
mean M/S hybrids frequencies between the two transects.
(PDF)
Author Contributions
Conceived and designed the experiments: EAN MD ID. Performed the
experiments: EAN ID. Analyzed the data: EAN MD ID. Contributed
reagents/materials/analysis tools: LK OF MD ID. Contributed to the
writing of the manuscript: EAN MD ID.
References
1. Coluzzi M, Petrarca V, Di Deco MA (1985) Chromosomal inversion
intergradation and incipient speciation in Anopheles gambiae. Boll Zool 52:45–63.
2. della Torre A, Costantini C, Besansky NJ, Caccone A, Petrarca V, et al. (2002)
Speciation within Anopheles gambiae–the glass is half full. Science 298: 115–117.
3. Toure YT, Petrarca V, Traore SF, Coulibaly A, Maiga HM, et al. (1998) Thedistribution and inversion polymorphism of chromosomally recognized taxa of
the Anopheles gambiae complex in Mali, West Africa. Parassitologia 40: 477–
511.
4. Favia G, della Torre A, Bagayoko M, Lanfrancotti A, Sagnon N, et al. (1997)Molecular identification of sympatric chromosomal forms of Anopheles gambiaeand further evidence of their reproductive isolation. Insect Mol Biol 6: 377–383.
5. Fanello C, Santolamazza F, della Torre A (2002) Simultaneous identification ofspecies and molecular forms of the Anopheles gambiae complex by PCR-RFLP.
Med Vet Entomol 16: 461–464.
6. della Torre A, Tu Z, Petrarca V (2005) On the distribution and geneticdifferentiation of Anopheles gambiae s.s. molecular forms. Insect Biochem Mol
Biol 35: 755–769.
7. Djogbenou L, Pasteur N, Bio-Bangana S, Baldet T, Irish SR, et al. (2010)
Malaria vectors in the Republic of Benin: distribution of species and molecularforms of the Anopheles gambiae complex. Acta Trop 114: 116–122.
8. Coetzee M, Hunt RH, Wilkerson R, Della Torre A, Coulibaly MB, et al. (2013)
Anopheles coluzzii and Anopheles amharicus, new members of the Anophelesgambiae complex. Zootaxa 3: 246–274.
9. Ndiath MO, Brengues C, Konate L, Sokhna C, Boudin C, et al. (2008)
Dynamics of transmission of Plasmodium falciparum by Anopheles arabiensisand the molecular forms M and S of Anopheles gambiae in Dielmo, Senegal.Malar J 7: 136.
10. Caputo B, Nwakanma D, Jawara M, Adiamoh M, Dia I, et al. (2008) Anophelesgambiae complex along The Gambia river, with particular reference to themolecular forms of An. gambiae s.s. Malar J 7: 182.
11. Oliveira E, Salgueiro P, Palsson K, Vicente JL, Arez AP, et al. (2008) High levels
of hybridization between molecular forms of Anopheles gambiae from GuineaBissau. J Med Entomol 45: 1057–1063.
12. Nwakanma DC, Neafsey DE, Jawara M, Adiamoh M, Lund E, et al. (2013)
Breakdown in the Process of Incipient Speciation in Anopheles gambiae. Genetics
193: 1221–1231.
13. de Souza D, Kelly-Hope L, Lawson B, Wilson M, Boakye D (2010)Environmental factors associated with the distribution of Anopheles gambiaes.s in Ghana; an important vector of lymphatic filariasis and malaria. PLoS One5: e9927.
14. Gillies MT, De Meillon B (1968) The Anophelinae of Africa south of the Sahara.
Johannesburg. Pub South Afr Inst Med Res 343 p.
15. Collins FH, Finnerty V, Petrarca V (1988) Ribosomal DNA-probes differentiate
five cryptic species in the Anopheles gambiae complex. Parassitologia 30: 231–240.
16. Favia G, Lanfrancotti A, Spanos L, Siden-Kiamos I, Louis C (2001) Molecular
characterization of ribosomal DNA polymorphisms discriminating amongchromosomal forms of Anopheles gambiae s.s. Insect Mol Biol 10: 19–23.
17. Raymond M, Rousset F (1995) GENEPOP Version 1.2: population genetics
software for exact tests and ecumenicism. J Hered 86: 248–249.
18. Moran PAP (1948) The interpretation of statistical maps. J R Stat SocSeries B Stat Methodol 10: 243–251.
19. Getis A, Ord JK (1992) The analysis of spatial association by use of distance
statistics. Geogr Anal 24: 189–206.
20. Dia I, Diop T, Rakotoarivony I, Kengne P, Fontenille D (2003) Bionomics of
Anopheles gambiae Giles, An. arabiensis Patton, An. funestus Giles and An. nili(Theobald) (Diptera: Culicidae) and transmission of Plasmodium falciparum in a
Sudano-Guinean zone (Ngari, Senegal). J Med Entomol 40: 279–283.
21. Fontenille D, Faye O, Konate L, Sy N, Collins FH (1993) [Comparison of PCR
and cytogenetic methods for the identification of mosquito species of the
Anopheles gambiae complex in Senegal]. Ann Parasitol Hum Comp 68: 239–
240.
22. Onyabe DY, Conn JE (2001) The distribution of two major malaria vectors,
Anopheles gambiae and Anopheles arabiensis, in Nigeria. Mem Inst Oswaldo
Cruz 96: 1081–1084.
23. Kristan M, Fleischmann H, della Torre A, Stich A, Curtis CF (2003) Pyrethroid
resistance/susceptibility and differential urban/rural distribution of Anophelesarabiensis and An. gambiae s.s. malaria vectors in Nigeria and Ghana. Med Vet
Entomol 17: 326–332.
24. Lindsay SW, Martens WJ (1998) Malaria in the African highlands: past, present
and future. Bull World Health Organ 76: 33–45.
25. Bogh C, Clarke SE, Jawara M, Thomas CJ, Lindsay SW (2003) Localized
breeding of the Anopheles gambiae complex (Diptera: Culicidae) along the River
Gambia, West Africa. Bull Entomol Res 93: 279–287.
26. Costantini C, Ayala D, Guelbeogo WM, Pombi M, Some CY, et al. (2009)
Living at the edge: biogeographic patterns of habitat segregation conform to
speciation by niche expansion in Anopheles gambiae. BMC Ecol 9: 16.
27. Simard F, Ayala D, Kamdem GC, Pombi M, Etouna J, et al. (2009) Ecological
niche partitioning between Anopheles gambiae molecular forms in Cameroon:
the ecological side of speciation. BMC Ecol 9: 17.
28. Diabate A, Dabire RK, Kim EH, Dalton R, Millogo N, et al. (2005) Larval
development of the molecular forms of Anopheles gambiae (Diptera: Culicidae)
in different habitats: a transplantation experiment. J Med Entomol 42: 548–553.
29. Gimonneau G, Pombi M, Choisy M, Morand S, Dabire RK, et al. (2012) Larval
habitat segregation between the molecular forms of the mosquito Anophelesgambiae in a rice field area of Burkina Faso, West Africa. Med Vet Entomol 26:
9–17.
30. Edillo FE, Toure YT, Lanzaro GC, Dolo G, Taylor CE (2002) Spatial and
habitat distribution of Anopheles gambiae and Anopheles arabiensis (Diptera:
Culicidae) in Banambani village, Mali. J Med Entomol 39: 70–77.
31. Lee Y, Cornel AJ, Meneses CR, Fofana A, Andrianarivo AG, et al. (2009)
Ecological and genetic relationships of the Forest-M form among chromosomal
and molecular forms of the malaria vector Anopheles gambiae sensu stricto.
Malar J 8: 75.
32. Slotman MA, Tripet F, Cornel AJ, Meneses CR, Lee Y, et al. (2007) Evidence
for subdivision within the M molecular form of Anopheles gambiae. Mol Ecol 16:
639–649.
33. Pinto J, Egyir-Yawson A, Vicente JL, Gomes B, Santolamazza F, et al. (2013)
Geographic population structure of the African malaria vector Anophelesgambiae suggests a role for the forest-savannah biome transition as a barrier to
gene flow. Evol Appl 6: 910–924.
34. Turner TL, Hahn MW (2007) Locus- and population-specific selection and
differentiation between incipient species of Anopheles gambiae. Mol Biol Evol 24:
2132–2138.
M and S Forms Reproductive Isolation
PLOS ONE | www.plosone.org 8 August 2014 | Volume 9 | Issue 8 | e104622

35. della Torre A, Fanello C, Akogbeto M, Dossou-yovo J, Favia G, et al. (2001)
Molecular evidence of incipient speciation within Anopheles gambiae s.s. in West
Africa. Insect Mol Biol 10: 9–18.
36. Kamdem C, Tene Fossog B, Simard F, Etouna J, Ndo C, et al. (2012)
Anthropogenic habitat disturbance and ecological divergence between incipientspecies of the malaria mosquito Anopheles gambiae. PLoS One 7: e39453.
37. Weir BS, Cockerham CC (1984) Estimating F-statistics for the analysis of
population structure. Evolution 38: 1358–1370.
M and S Forms Reproductive Isolation
PLOS ONE | www.plosone.org 9 August 2014 | Volume 9 | Issue 8 | e104622