next generation rainfall data
TRANSCRIPT

Next Generation Rainfall Data1
Brian C. Hoblit (1), David C. Curtis, Ph.D. (2) (1) NEXRAIN Corporation, 9477 Greenback Lane Suite 523A, Folsom, CA 95630; PH (916)
988-2771; FAX (916) 988-2769; e-mail: [email protected]; Associate Member A.S.C.E. (2) NEXRAIN Corporation; email: [email protected]; Member A.S.C.E.
Abstract
Traditional approaches to spatially weigh rainfall totals such as Thiessen polygons or inverse distance squared do not always produce an accurate estimation of the total volume of water falling over a particular area. Recent advances in weather radar technology have allowed for the estimation of rainfall rates on a rainfall grid as small as 2 km by 2 km, in 15-minute time increments. When the radar data are adjusted with the local rain gage network, volume estimates over the areas of interest have been greatly improved.
Gage-adjusted radar rainfall data has numerous applications in operations and water resources management. The data are currently being used for real-time local flood prediction and large-scale operations management. The data will be useful for real-time water allocation decision support and dam operation.
Introduction
The traditional approach of using Thiessen (1911) polygons or inverse distance squared to spatially weigh rainfall amounts does not always produce accurate volume estimates over an area. Anyone who has stood in the sunshine on one side of the road and seen rain falling on the other side knows this is true. Rainfall does not fall in unifrom rates in the shape of a polygon. In the past, the only way engineers and hydrologists could get a better estimate of the true volume of rainfall was to add more gages. Unfortunately, this alternative is often cost prohibitive.
The recent deployment of the WSR-88D weather radar by the National Weather Service in 1992 has created the possibility for improving the spatial estimation of rainfall depths. The WSR-88D, or NEXRAD radar (for Next Generation Radar), sends out a radio signal and measures the reflectivity (reflected signal) off of falling raindrops. Similar to the functions of radar at an airport, the NEXRAD radar can chart the location and direction of the rainfall. Just as the airport radar estimates the size of incoming aircraft, NEXRAD can measure the amount of rainfall falling over a particular location based on the value of the reflected signal. Each NEXRAD radar can measure reflectivity out to a distance of 230 km at high resolution, giving the radar the necessary range to measure and characterize large rainfall cells and incoming storms as they approach the area of interest (Fulton et al. 1998 and Hoblit et al. 1999).
Radar Rainfall Background
Shortly after it was discovered in World War II that pulsed radar could be used to detect and locate aircraft in three-dimensional space (Doviak and Zrnic 1993), precipitation was observed as noise on the radar returns. At the time, this was considered a nuisance, but soon meteorologists began to use the radar specifically for the detection of weather phenomenon.
1 Presented at the ASCE Watershed and Operations Management 2000 Conference, Ft. Collins, CO, June 22, 2000.
IN 2003, NEXRAIN BECAME ONERAIN INCORPORATED (ONERAIN.COM)
2
Thus, the initial effort to reduce and quantify radar noise, which limited the effectiveness of the radar to detect aircraft, lead to the beginning of radar meteorology (Atlas 1964).
Weather radar such as the WSR-88D, unfortunately, does not and cannot directly measure rainfall rates. The radar can, however, measure the reflected signal off of falling raindrops, and then estimate the rainfall rate from this return. The rainfall rates are proportional to the sum of the sixth power of the diameters in a given volume. If one can estimate the drop-size distribution in the given volume, then the radar can measure rainfall rates.
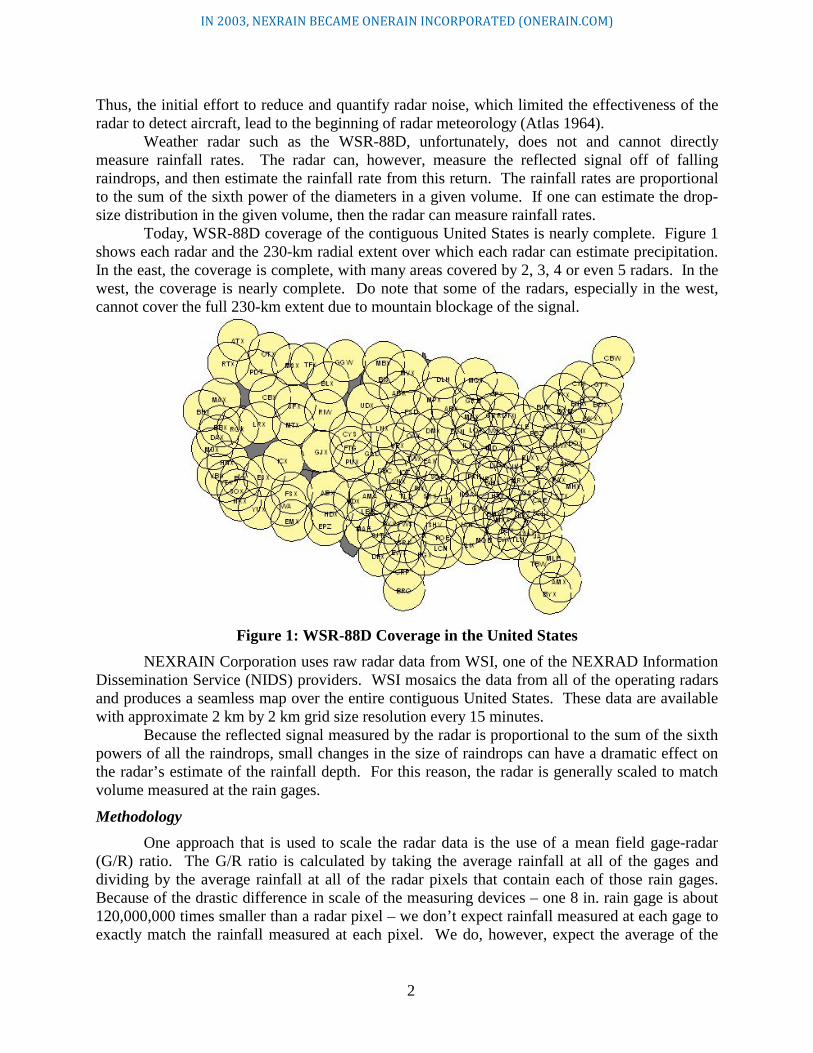
Today, WSR-88D coverage of the contiguous United States is nearly complete. Figure 1 shows each radar and the 230-km radial extent over which each radar can estimate precipitation. In the east, the coverage is complete, with many areas covered by 2, 3, 4 or even 5 radars. In the west, the coverage is nearly complete. Do note that some of the radars, especially in the west, cannot cover the full 230-km extent due to mountain blockage of the signal.
Figure 1: WSR-88D Coverage in the United States
NEXRAIN Corporation uses raw radar data from WSI, one of the NEXRAD Information Dissemination Service (NIDS) providers. WSI mosaics the data from all of the operating radars and produces a seamless map over the entire contiguous United States. These data are available with approximate 2 km by 2 km grid size resolution every 15 minutes.
Because the reflected signal measured by the radar is proportional to the sum of the sixth powers of all the raindrops, small changes in the size of raindrops can have a dramatic effect on the radar’s estimate of the rainfall depth. For this reason, the radar is generally scaled to match volume measured at the rain gages.
Methodology
One approach that is used to scale the radar data is the use of a mean field gage-radar (G/R) ratio. The G/R ratio is calculated by taking the average rainfall at all of the gages and dividing by the average rainfall at all of the radar pixels that contain each of those rain gages. Because of the drastic difference in scale of the measuring devices – one 8 in. rain gage is about 120,000,000 times smaller than a radar pixel – we don’t expect rainfall measured at each gage to exactly match the rainfall measured at each pixel. We do, however, expect the average of the
IN 2003, NEXRAIN BECAME ONERAIN INCORPORATED (ONERAIN.COM)

3
two devices to be nearly equal, if there are a large number of gages. Once the G/R ratio is determined, the ratio is multiplied by the raw radar field to create a gage-adjusted radar rainfall estimate at each time step. This ensures that the average rainfall measured at the gages matches the average rainfall measured at the radar pixels containing those gages. In addition, the gage-adjusted radar rainfall data set contains information about the rainfall depths between the gages. Prior to the use of radar, this was not possible and engineers had to spatially assign rainfall depths using either Thiessen polygons or inverse distance squared weighting.
For a number of areas and for a number of storms, the basin average rainfall using gage data spatially weighted using Thiessen polygons was compared to using the higher resolution basin average rainfall from the gage-adjusted radar rainfall estimates. Again, the radar data has already been scaled to match the gage data at known points, so any difference in the estimates is attributable to increase in rainfall resolution.
Basin Average Rainfall Results
NEXRAIN recently completed a long-term study of gage-adjusted radar rainfall estimates over Vallejo, California. The 125 sq mi. study area contained seven gages. January 1998 through April 1999 were chosen for study, although the months of June through October were excluded because the area receives little or no rainfall during the time period. Below is Figure 2, a graphic showing the difference in spatial resolution from the gages and from the radar for February 1998, the month which received the greatest amount of rainfall during the study period.
Figure 2: Gage Rainfall Using Thiessen Polygons and Gage-Adjusted
Radar Rainfall Estimates for Vallejo for February 1998
IN 2003, NEXRAIN BECAME ONERAIN INCORPORATED (ONERAIN.COM)
4
The basin average rainfall measured by the gages was 10.69 in., compared to 10.54 in. by the radar, a difference of 1.4%. The results from the others months were not always as good. Table 1 shows the summary of the basin average rainfall comparison between the rain gages using Thiessen polygon weighting and the estimates using the gage-adjusted radar rainfall. Estimation by the rain gages for three of the eleven months was off by greater than 5%, whereas the storm total analysis show much higher errors. The storms listed ranged in duration from a few hours to a few days. In an extreme case, the gages using Thiessen polygon weighting, overestimated the rainfall total for the storm by 27%.
Table 1: Basin-Average Rainfall for Vallejo, California
Gages Radar Diff Gage Radar Diff Jan ‘98 6.24 6.04 3.2% Storm 1 3.16 2.84 11.1% Feb ‘98 10.69 10.54 1.4% Storm 2 0.99 0.78 26.9% Mar ‘98 2.09 2.14 -2.7% Storm 3 0.35 0.33 5.7% Apr ‘98 1.56 1.58 -0.7% Storm 4 0.49 0.46 5.9% May ‘98 2.28 2.22 2.4% Storm 5 0.68 0.63 9.0% Nov ‘98 3.47 3.52 -1.4% Storm 6 2.04 1.89 7.9% Dec ‘98 0.67 0.63 5.1% Storm 7 1.25 1.21 3.6% Jan ‘99 2.76 2.57 7.4% Storm 8 1.08 0.96 12.0% Feb ‘99 5.73 5.45 5.1% Mar ‘99 1.78 1.72 3.6% Apr ‘99 2.12 2.06 3.1%
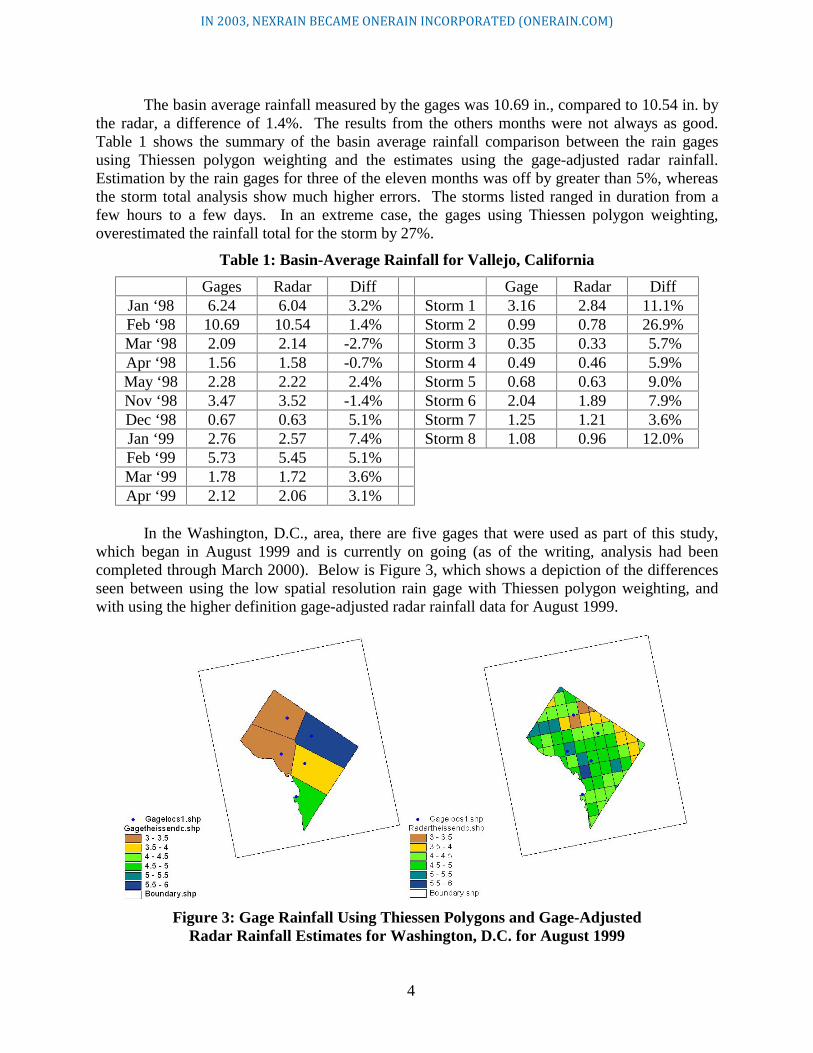
In the Washington, D.C., area, there are five gages that were used as part of this study,
which began in August 1999 and is currently on going (as of the writing, analysis had been completed through March 2000). Below is Figure 3, which shows a depiction of the differences seen between using the low spatial resolution rain gage with Thiessen polygon weighting, and with using the higher definition gage-adjusted radar rainfall data for August 1999.
Figure 3: Gage Rainfall Using Thiessen Polygons and Gage-Adjusted
Radar Rainfall Estimates for Washington, D.C. for August 1999
IN 2003, NEXRAIN BECAME ONERAIN INCORPORATED (ONERAIN.COM)

5
The difference between the basin average rainfall estimates for August 1999 was 10.7%. Table 2 shows the summary of the basin average rainfall comparison between the rain gages using Thiessen polygon weighting and the estimates using the gage-adjusted radar rainfall for the D.C. area. The rain gages either over or underestimated in four of the eight months by greater than 10%. Analysis of storm totals was not performed for Washington, D.C., but there is no reason that the results for a storm total comparison would be different than the results from Vallejo, which indicated an increase in the error for shorter events.
Table 2: Basin-Average Rainfall for Washington, D.C.
Gages Radar Diff Aug ‘99 4.33 4.85 -10.7% Sep ‘99 11.62 12.03 -3.5% Oct ‘99 2.29 2.19 4.8% Nov ‘99 1.81 1.98 -8.4% Dec ‘99 2.75 2.50 10.2% Jan ‘00 2.76 2.51 10.0% Feb ‘00 2.01 2.25 -10.3% Mar ‘00 4.24 4.24 -0.1%
Figure 4 shows the results for a similar analysis over Austin, Texas, for April 2000.
Because the area covers a much larger area (almost 2000 sq mi), with a larger number of gages (65), it is a little easier to see the dramatic differences inferred by using the two rainfall estimation methods. On the figure on the right, one can detect the possible southwest to northeast track that many storms make over the Austin region; this is not evident at all in the Thiessen analysis graphics. Also, because the areal extent reaches beyond the city limits of Austin, operations managers would be able to quantify incoming rainfall using gage-adjusted radar-rainfall analysis.
Figure 4: Gage Rainfall Using Thiessen Polygons and Gage-Adjusted
Radar Rainfall Estimates for Austin, Texas, for April 2000
IN 2003, NEXRAIN BECAME ONERAIN INCORPORATED (ONERAIN.COM)
6
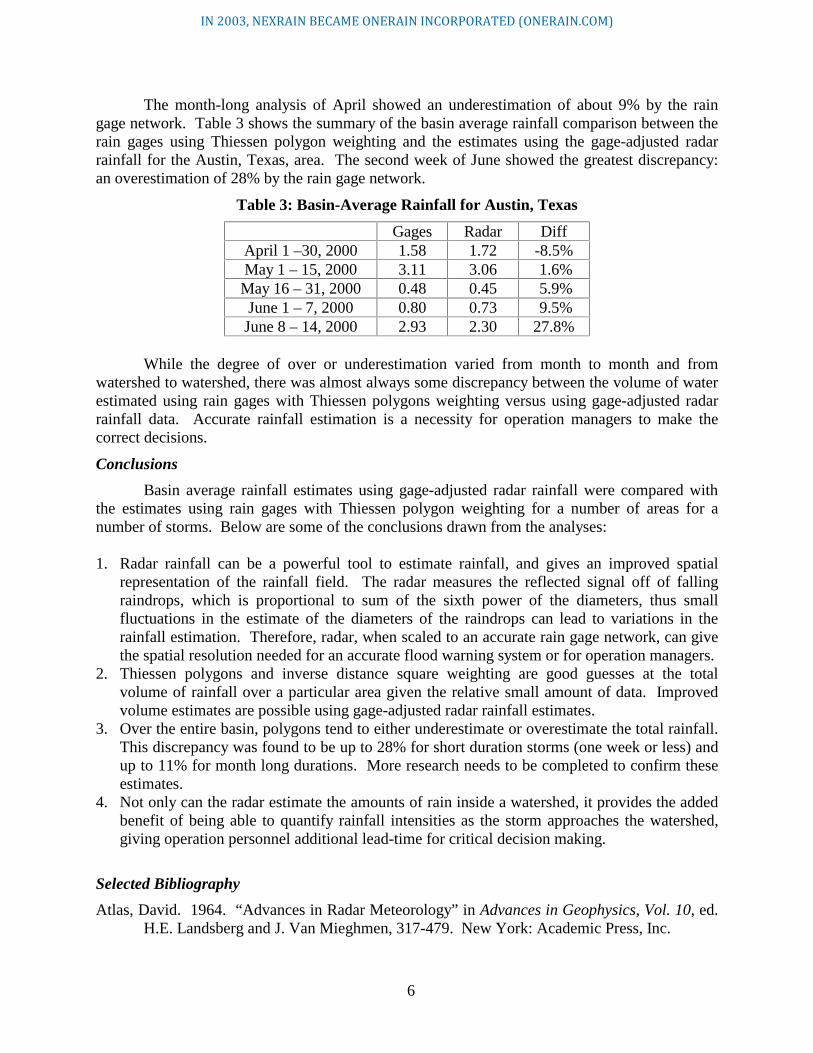
The month-long analysis of April showed an underestimation of about 9% by the rain gage network. Table 3 shows the summary of the basin average rainfall comparison between the rain gages using Thiessen polygon weighting and the estimates using the gage-adjusted radar rainfall for the Austin, Texas, area. The second week of June showed the greatest discrepancy: an overestimation of 28% by the rain gage network.
Table 3: Basin-Average Rainfall for Austin, Texas
Gages Radar Diff April 1 –30, 2000 1.58 1.72 -8.5% May 1 – 15, 2000 3.11 3.06 1.6% May 16 – 31, 2000 0.48 0.45 5.9% June 1 – 7, 2000 0.80 0.73 9.5% June 8 – 14, 2000 2.93 2.30 27.8%
While the degree of over or underestimation varied from month to month and from
watershed to watershed, there was almost always some discrepancy between the volume of water estimated using rain gages with Thiessen polygons weighting versus using gage-adjusted radar rainfall data. Accurate rainfall estimation is a necessity for operation managers to make the correct decisions.
Conclusions
Basin average rainfall estimates using gage-adjusted radar rainfall were compared with the estimates using rain gages with Thiessen polygon weighting for a number of areas for a number of storms. Below are some of the conclusions drawn from the analyses:
1. Radar rainfall can be a powerful tool to estimate rainfall, and gives an improved spatial
representation of the rainfall field. The radar measures the reflected signal off of falling raindrops, which is proportional to sum of the sixth power of the diameters, thus small fluctuations in the estimate of the diameters of the raindrops can lead to variations in the rainfall estimation. Therefore, radar, when scaled to an accurate rain gage network, can give the spatial resolution needed for an accurate flood warning system or for operation managers.
2. Thiessen polygons and inverse distance square weighting are good guesses at the total volume of rainfall over a particular area given the relative small amount of data. Improved volume estimates are possible using gage-adjusted radar rainfall estimates.
3. Over the entire basin, polygons tend to either underestimate or overestimate the total rainfall. This discrepancy was found to be up to 28% for short duration storms (one week or less) and up to 11% for month long durations. More research needs to be completed to confirm these estimates.
4. Not only can the radar estimate the amounts of rain inside a watershed, it provides the added benefit of being able to quantify rainfall intensities as the storm approaches the watershed, giving operation personnel additional lead-time for critical decision making.
Selected Bibliography
Atlas, David. 1964. “Advances in Radar Meteorology” in Advances in Geophysics, Vol. 10, ed. H.E. Landsberg and J. Van Mieghmen, 317-479. New York: Academic Press, Inc.
IN 2003, NEXRAIN BECAME ONERAIN INCORPORATED (ONERAIN.COM)
7
Doviak, Richard J. and Dusan S. Zrnic. 1993. Doppler Radar and Weather Observations. San Diego: Academic Press, Inc.
Fulton, Richard A., Jay P. Briendenbach, Dong-Jun Seo, Dennis A. Miller, and Timothy O’Bannon. 1998. “The WSR-88D Rainfall Algorithm.” Weather and Forecasting 13: 377-395.
Hoblit, Brian, Baxter Vieux, Anthony Holder, and Philip Bedient. 1999. “Predicting with Precision.” Civil Engineering Magazine 69(11): 40-43.
Thiessen, Alfred H. 1911. “Precipitation Averages for Large Areas.” Monthly Weather Review 39(7): 1082-1089.
IN 2003, NEXRAIN BECAME ONERAIN INCORPORATED (ONERAIN.COM)

LEARN MORE
OneRain Incorporated 1531 Skyway Drive, Unit D
Longmont, Colorado 80504, USA
+1-303-774-2033 www.onerain.com