newmont’s reserve history on the carlin trend 1965-2001
TRANSCRIPT

7/27/2019 NEWMONT’S RESERVE HISTORY ON THE CARLIN TREND 1965-2001
http://slidepdf.com/reader/full/newmonts-reserve-history-on-the-carlin-trend-1965-2001 1/1135
Reserve History
ABSTRACT
Northeastern Nevada’s Carlin trend contains one of the richest
gold endowments in North America. Newmont Mining
Corporation has explored and produced gold from this region
since discovering the Carlin Mine in 1961. Newmont’s Carlin
trend gold reserves have grown from an initial 3.5-million-
ounce (110-t [metric ton]) reserve in 1965 to nearly 12 million
ounces (373 t) in 1998. Over the same period, Newmont
produced 27.3 million ounces (849 t) of gold. Reserve additions
have come from systematic surface and underground
exploration and expansion of more than 30 deposits, through
new metallurgical processes and changing mining methods.
INTRODUCTION
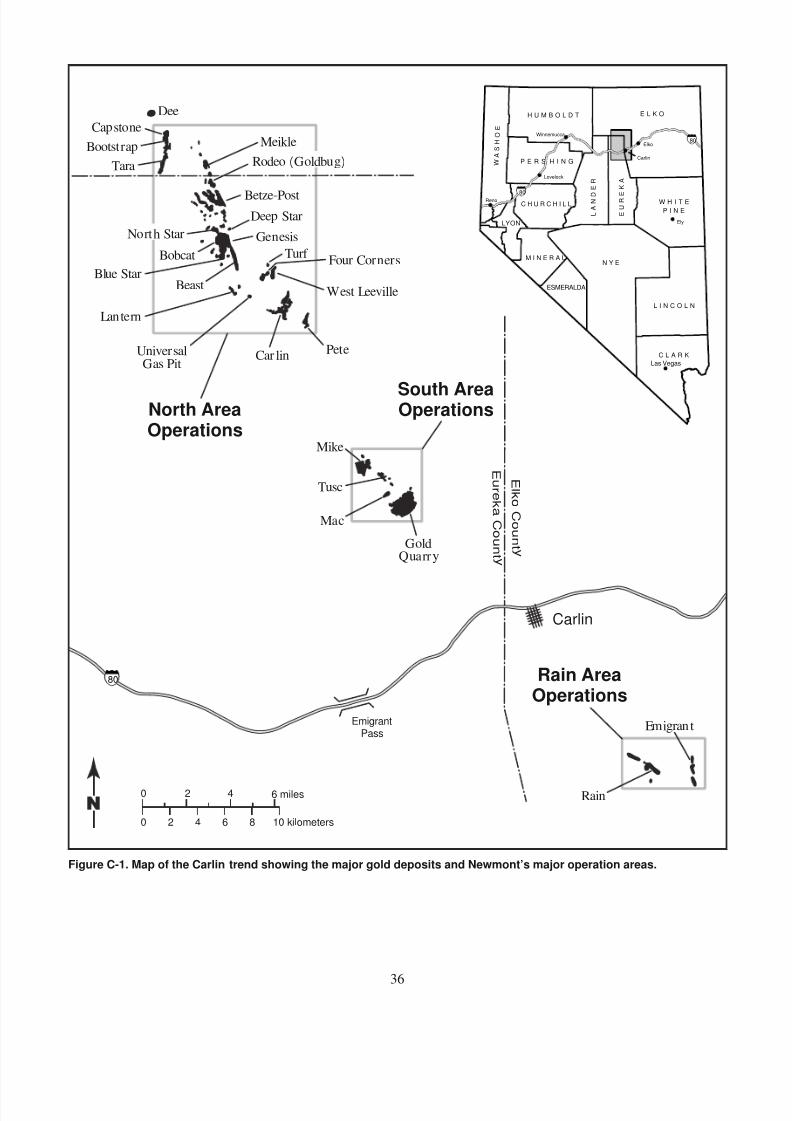
The central part of the Carlin trend is a 38-mile (60-km) long
alignment of gold deposits in Eureka and Elko Counties,
Nevada, extending from the Rain Mine on the south to the Dee
Mine on the north (fig. C-1). Newmont and other companies
have discovered over 40 gold deposits along this trend. The
Carlin trend is one of the largest concentrations of gold deposits
in North America, estimated to contain over 100 million ounces
(3,110 t) of gold including past production, reserves, and
resources (Teal and Jackson, 1997b).
This paper provides a summary of exploration,
metallurgical developments, changing mining methods, and
their relation to Newmont’s reserve history on the Carlin trend.The reserve history is broken down into three periods starting
with the Early Years from 1965 to 1981 centered on mining of
the Carlin deposit and the early expansion to other deposits.
The Growth Years chronicle the meteoric growth of Newmont’s
reserves in the 1980s and the Going Deeper Years focus on the
development of deeper, higher-grade deposits that have been
developed by or led to the onset of underground mining.
EARLY YEARS 1965–1981
Gold was first mined on the Carlin trend from small placers
located in Maggie Creek, east of the Gold Quarry Mine, in the
1880s (Ryneer, 1985). However, it wasn’t until the 1960s that
modern exploration began to uncover the real potential of this
productive gold trend. Newmont began exploration on the
Carlin trend in 1961 when geologists Alan Coope and John
Livermore began investigating the Blue Star Mine and Maggie
Creek claims (Coope, 1991). After a three-week examination
of Blue Star, a recommendation was made to acquire the
property, but Newmont was unable to negotiate a deal with the
landowner (Coope, 1991). Using the experience gained at Blue
NEWMONT’S RESERVE HISTORY ON THE CARLIN TREND
1965–2001
Dean G. Heitt1
Star, exploration focused on jasperoid outcrops located 2 l
34
l
34 l
34
l
34
l
34
miles (4.5 km) southeast of Blue Star, leading to discovery of the Carlin deposit in late 1961 (fig. C-2). Development drilling
between 1962 and 1965 proved up a reserve of 11 million short
tons (10 Mt) grading 0.320 opt (troy ounces per short ton; 11.0
g/t) gold for a total of 3.5 million ounces (110 t).
Early exploration and development focused around the
Carlin deposit because only high-grade ore was economic at a
fixed gold price of $35.00 per ounce (fig. C-3). With the demise
of the Bretton Woods Monetary Agreement in 1971 and the
subsequent rise in gold price, Newmont began acquiring other
properties in the area. In 1972, the Blue Star and Bootstrap
deposits were acquired and, in 1977, the North Star deposit
was discovered north of Blue Star. Intermittent exploration in
the Maggie Creek claim area, from 1962 to 1979, led to
development of a 359,000-ounce (11-t) reserve in 1979 (Rota
and Ekburg, 1988). Figure C-4 shows the location of new
deposits added to reserves during this period.
The 1965 pre-mine reserve of 3,520,000 ounces (109 t)
steadily decreased to a low of 765,600 ounces (24 t) in 1973 as
mining depleted the Carlin deposit reserves (fig. C-5). By 1981,
new discoveries increased Newmont’s Carlin trend reserve to
1.15 million ounces (36 t). Average grade of the reserves
decreased as higher gold prices made lower grade material
economic (fig. C-6). The average reserve grade of 0.165 opt
(5.6 g/t) gold in 1981 was approximately half of the 1965 grade.
Newmont’s first mill was commissioned in 1965 to processoxide ore from the Carlin Mine (fig. C-7). Mill #1, as it became
known, later processed ore from other deposits until it was
decommissioned in September 1994. Increasing carbonaceous
ore from Carlin led to the addition of a flash chlorination circuit
in 1971 to pretreat ore prior to cyanidation. A double oxidation
process, added in 1977 to process sulfidic-carbon ores, allowed
the conversion of 285,000 ounces (8.8 t) from waste to ore.
Newmont’s first leach facility began at Bootstrap in 1979
processing ore averaging 0.028 opt (1.0 g/t) gold stockpiled
during mining. Heap leaching using reusable asphalt pads
began at Maggie Creek in 1981. Large-scale leaching having
been proved economic, leach-grade ore would contribute
significantly to Newmont’s reserves in the future.
Production decreased steadily during the Early Years, as
the Carlin Mine was depleted and lower grade ore from new
deposits was processed, reaching a low of 110,000 ounces (3.4
t) in 1980 (fig. C-8). Ironically, this is the same year gold hit
$800 per ounce and averaged over $600 per ounce (fig. C-3).
From 1965 to 1981, Newmont produced 3,291,700 ounces
(102.4 t) from the Carlin trend, the vast majority coming from
the Carlin Mine (fig. C-9).
1Newmont Mining Corporation
7/27/2019 NEWMONT’S RESERVE HISTORY ON THE CARLIN TREND 1965-2001
http://slidepdf.com/reader/full/newmonts-reserve-history-on-the-carlin-trend-1965-2001 2/11
36
South AreaOperations
Rain AreaOperations
North AreaOperations
Winnemucca
Elko
Carlin
Ely
Reno
Lovelock
Las Vegas
80
80
H U M B O L D T E L K O
N Y EM I N E R A L
ESMERALDA
LYON
L I N C O L N
C L A R K
P E R S H I N G
C H U R C H I L L W H I T E
P I N E E
U
R
E
K
A
L A
N D
E
R
W
A S H O E
80
80
80
EmigrantPass
GoldQuarry
M ac
Tusc
PeteCarlinUniversal
Gas Pit
Lantern
BeastBlue Star
Bobcat
North Star
W est Leevil le
Four CornersTurf
Genesis
Deep Star
Betze-Post
Rodeo (Goldbug)
Meikle
Dee
Capstone
Bootstrap
Tara
Rain
Emigrant
Carlin
E u r
e k
a C
o u
n t y
E l k
o C
o u
n t y
Mike
0 2 4 6 miles
0 42 6 8 10 kilometers
Figure C-1. Map of the Carlin trend showing the major gold deposits and Newmont’s major operation areas.

7/27/2019 NEWMONT’S RESERVE HISTORY ON THE CARLIN TREND 1965-2001
http://slidepdf.com/reader/full/newmonts-reserve-history-on-the-carlin-trend-1965-2001 3/11
37
Reserve History
TailingsFacility
Popovich Hill
Mill 1
Figure C-2. A 1966 view of the Carlin Mine and Mill complex, looking east.
Photo courtesy of Newmont Mining Corporation.
U . S .
d o l l a r s
1 9 6 6
$0
$100
$200
$300
Year
$400
$500
$600
$700
1 9 9 8
2 0 0 0
1 9 6 8
1 9 7 0
1 9 7 2
1 9 7 4
1 9 7 6
1 9 7 8
1 9 8 0
1 9 8 2
1 9 8 4
1 9 8 6
1 9 8 8
1 9 9 0
1 9 9 2
1 9 9 4
1 9 9 6
159
612
317
387
273
35
Figure C-3. London yearly average gold price from 1965 to 2001. Source: www.kitco.com.

7/27/2019 NEWMONT’S RESERVE HISTORY ON THE CARLIN TREND 1965-2001
http://slidepdf.com/reader/full/newmonts-reserve-history-on-the-carlin-trend-1965-2001 4/11
38
Winnemucca
Elko
Carlin
Ely
Reno
Lovelock
Las Vegas
80
80
H U M B O L D T E L K O
N Y EM I N E R A L
ESMERALDA
LYON
L I N C O L N
C L A R K
P E R S H I N G
C H U R C H I L L W H I T E
P I N E E
U
R
E
K
A
L A
N
D
E
R
W
A S H O E
80
80
80
EmigrantPass
M aggieCreek
Carlin
Blue Star
North Star
Bootstrap
Carlin
E u
r e k a
C o u
n t
y
E l k
o C
o u n
t y
0 2 4 6 miles
0 42 6 8 10 kilometers
Figure C-4. Location of deposits added to gold reserves during the Early Years (1965–1981).

7/27/2019 NEWMONT’S RESERVE HISTORY ON THE CARLIN TREND 1965-2001
http://slidepdf.com/reader/full/newmonts-reserve-history-on-the-carlin-trend-1965-2001 5/11
39
Reserve History
M i l l i o n s o u n c e s o f g o l d
1 9 6 6
0
5
10
15
20
25
30
1 9 9 8
2 0 0 0
1 9 6 8
1 9 7 0
1 9 7 2
1 9 7 4
1 9 7 6
1 9 7 8
1 9 8 0
1 9 8 2
1 9 8 4
1 9 8 6
1 9 8 8
1 9 9 0
1 9 9 2
1 9 9 4
1 9 9 6
Early Years
Growth Years
Going Deeper Years, Open Pit
Going Deeper Years, Underground
3 , 5
2 0 , 0
0 0
7 6 5 , 6 0
0
1 , 1
5 3
, 0 2 0
9 , 8
3 9 , 8
0 9
2 0 , 6
8 4 , 0
0 0
2 3 , 3
3 5 , 0
0 0
1 5 , 9
6 3 , 0
0 0
1 1 , 8
4 1 , 0
0 0
Year-end
T
r o y o u n c e s o f g o l d p e r s h o r t t o n
1 9 6 6
0
0.05
0.10
0.20
0.15
0.30
0.25
0.35
1 9 9 8
2 0 0 0
1 9 6 8
1 9 7 0
1 9 7 2
1 9 7 4
1 9 7 6
1 9 7 8
1 9 8 0
1 9 8 2
1 9 8 4
1 9 8 6
1 9 8 8
1 9 9 0
1 9 9 2
1 9 9 4
1 9 9 6
Early Years
Growth Years
Going Deeper Years
0 . 3 2 0
0 . 1
6 5
0 . 0
5 1
0 . 1
0 0
Year-end
Figure C-5. Total Newmont reserve ounces of gold on the Carlin trend from 1965 to 2001.
Source: Newmont Mining Corporation and Newmont Gold Company Annual Reports.
Figure C-6. Average grade (opt) of Newmont gold reserves on the Carlin trend from 1965 to 2001.
Source: Newmont Mining Corporation and Newmont Gold Company Annual Reports.

7/27/2019 NEWMONT’S RESERVE HISTORY ON THE CARLIN TREND 1965-2001
http://slidepdf.com/reader/full/newmonts-reserve-history-on-the-carlin-trend-1965-2001 6/11
40
Thickener Tanks Mill Building
Figure C-7. A view of Mill #1 from Popovich Hill in 1968, looking west. Outcrops in the foreground
are Popovich jasperoids. Photo courtesy of Newmont Mining Corporation.
T h o u s a n d o u n c e s o f g o l d
1 9 6 6
0
200
400
600
1,400
1,200
1,000
800
1,800
1,600
2,000
2,200
1 9 9 8
2 0 0 0
1 9 6 8
1 9 7 0
1 9 7 2
1 9 7 4
1 9 7 6
1 9 7 8
1 9 8 0
1 9 8 2
1 9 8 4
1 9 8 6
1 9 8 8
1 9 9 0
1 9 9 2
1 9 9 4
1 9 9 6
Early Years
Growth Years
Going Deeper Years
1 2 8 , 5
0 0 3
3 7 , 0 0
0
1 1 0 , 0
0 0
1 , 4
6 7 , 8
0 0
1 , 8
6 6 , 0
0 0
Year
Figure C-8. Newmont’s total annual gold production (ounces) from the Carlin trend from 1965 to 2001.
Source: Newmont Mining Corporation and Newmont Gold Company Annual Reports.

7/27/2019 NEWMONT’S RESERVE HISTORY ON THE CARLIN TREND 1965-2001
http://slidepdf.com/reader/full/newmonts-reserve-history-on-the-carlin-trend-1965-2001 7/11
41
Reserve History
GROWTH YEARS 1982–1989
During the 1980s exploration focused on discovery of large,oxide gold deposits amenable to open-pit mining and met with
great success. Twelve new deposits were added to reserves
during the period, nine of them between 1985 and 1988 (fig.
C-10). Geologic mapping, soil and rock chip geochemistry
combined with drilling proved to be the best exploration tools
during this period. Many of the deposits discovered during
the 1980s cropped out at the surface.
The dramatic rise in reserves began with the discovery of
the Gold Quarry and Rain deposits in 1980. Gold Quarry was
discovered approximately 1,000 feet (300 m) east of the
Maggie Creek Mine when drilling encountered gold
mineralization below 250 feet (75 m) of postmineral Tertiary
Carlin Formation (fig. C-11) (Rota and Ekburg, 1988). At about
the same time, Newmont geologists also began investigating
the Rain claims located 12 miles (19 km) south of the town of
Carlin (Knutsen and West, 1984). Although the discovery was
originally staked for barite by local prospector Price “Turk”
Montrose, jasperoid rock chip samples from the discovery
assayed up to 0.480 opt (16.5 g/t) gold (Thoreson, 1988). Gold
Quarry and Rain were classified as reserves in 1982.
Purchase of the TS Ranch in 1982 from Charles Thorton
and Roy Ash was a major milestone in Newmont’s
development of the Carlin trend. Acquisition of these lands
provided Newmont with a substantial private land holding on
the Carlin trend and allowed geologists to explore in areas
previously unavailable.Reserves increased dramatically during the Growth Years
from 1.15 million ounces (36 t) in 1981 to over 20.68 million
ounces (643 t) in 1989 with additions coming from new
discoveries and expansion of existing deposits (fig. C-5). Gold
prices ranging from a high of $460 per ounce in 1982 to a low
of $317 per ounce in 1985 (fig. C-3) meant that lower grade
ore could be included in the reserves. Consequently, the average
grade of 0.051 opt (1.7 g/t) gold in 1982 was a third of the
1981 grade of 0.165 opt (5.7 g/t) gold (fig. C-6). Gold reserves
added throughout the Growth Years averaged approximately
0.050 opt (1.7 g/t) (fig. C-6).
During the 1980s, new mines were developed over nearly
the entire length of the trend. These new mines, combined with
increased production from existing operations, required new
process facilities to be located closer to the operation areas
than during the Early Years when all of the mill-grade ore was
shipped to Mill #1. To meet these needs, Newmont
commissioned its second oxide mill (Mill #2) at Gold Quarry
in 1985 followed by Mill #3 at Rain and Mill #5 at Gold Quarry
in 1988, and Mill #4 in the North Area in 1989 (fig. C-1). New
oxide leach pads were constructed at Rain, Gold Quarry, and
the North Area to treat the increased amount of low-grade ore
developed during this time.
C u m u
l a t i v e p r o
d u c
t i o n
( m i l l i o n o u n c e s o
f g o
l d )
Year 1 9 6 6
0
5
10
15
20
25
30
1 9 9 8
2 0 0 0
1 9 6 8
1 9 7 0
1 9 7 2
1 9 7 4
1 9 7 6
1 9 7 8
1 9 8 0
1 9 8 2
1 9 8 4
1 9 8 6
1 9 8 8
1 9 9 0
1 9 9 2
1 9 9 4
1 9 9 6
3 , 2
9 1
, 7 0 0
7 , 4
0 1
, 2 2 0
2 7
, 3 2 1
, 7 6 7
Figure C-9. Newmont’s cumulative gold production (ounces) from the Carlin trend from 1965 to 2001.Source: Newmont Mining Corporation and Newmont Gold Company Annual Reports.

7/27/2019 NEWMONT’S RESERVE HISTORY ON THE CARLIN TREND 1965-2001
http://slidepdf.com/reader/full/newmonts-reserve-history-on-the-carlin-trend-1965-2001 8/11
42
Winnemucca
Elko
Carlin
Ely
Reno
Lovelock
Las Vegas
80
80
H U M B O L D T E L K O
N Y EM I N E R A L
ESMERALDA
LYON
L I N C O L N
C L A R K
P E R S H I N G
C H U R C H I L L W H I T E
P I N E E
U
R
E
K
A
L
A
N
D
E
R
W
A S H O E
80
80
80
EmigrantPass
GoldQuarry
M ac
Tusc
Pete
Lantern
Bobcat
Genesis
Post(Newmont Portion)
Capstone
Rain
Emigrant
Carlin
E u r e
k a
C o u
n
t y
E l k o
C o u
n t y
0 2 4 6 miles
0 42 6 8 10 kilometers
SM Z
Figure C-10. Location of deposits added to reserves during the Growth Years (1982–1989).

7/27/2019 NEWMONT’S RESERVE HISTORY ON THE CARLIN TREND 1965-2001
http://slidepdf.com/reader/full/newmonts-reserve-history-on-the-carlin-trend-1965-2001 9/11
43
Reserve History
Production rose dramatically from 136,600 ounces (4.25 t)
in 1981 to 1,467,800 ounces (45.5 t) in 1989 (fig. C-8). In 1988,
Newmont became the largest gold producer in North America
(Newmont Gold Company, 1988). Between 1965 and 1989,
Newmont produced 7,407,220 ounces (230.4 t) from the Carlin
trend (fig. C-9).
GOING DEEPER 1990–1998
During the late 1980s exploration and development drilling
began focusing on higher-grade, refractory deposits as near
surface discoveries were exhausted. Refractory material contains
organic carbon and/or unoxidized sulfides and requires
pretreatment of the ore prior to cyanide gold recovery.
Newmont’s first deep discoveries were the Deep Post and Gold
Bug deposits in 1988 near the Post deposit (fig. C-12). The firstdrill hole at Deep Post encountered 470 feet (143 m) averaging
0.930 opt (32 g/t) gold, substantially higher-grade than the typical
oxide deposit discovered in the 1980s. While both Deep Post
and Goldbug would eventually become underground mines, both
were planned originally as open-pit mines.
Barrick Gold Corporation’s 1989 discovery of what would
become the Deep Star deposit started Newmont on the road to
underground mining. Newmont’s first hole intersected 195 feet
(58 m) grading 2.058 opt (70.6 g/t) gold beginning at 1,295
feet (388 m) and subsequent development drilling indicated a
1992 pre-mine reserve of 789,000 ounces (25 t) grading 0.929
opt (31.9 g/t) gold. Early feasibility studies indicated that twin
shafts were the best option for accessing the deposit but startupwas delayed in 1993. Underground mining engineers then
began to evaluate other projects at the Carlin and Rain Mines.
Newmont’s first foray into underground mining had been at
Carlin in 1974 and 1975 when a 2,500-foot (750-m) adit was
driven as a drill platform into the north wall of the pit to test
the down-dip potential of the Main and East orebodies (Kuehn,
1989). Forty-three holes were drilled, and the results justified
an additional layback to the open pit. Underground mining at
Rain was first proposed by Thoreson in 1990 to access high-
grade ore that would have been left in the ultimate pit wall.
Both the Carlin and Rain underground mines began
development in late 1993 with production commencing in 1994
(fig. C-13). Success of both of these projects led to a redesignof the Deep Star Mine from twin shafts to twin declines to
access the deposit. Development for Deep Star began from the
active Genesis open-pit mine in 1994 with production
beginning in 1996 (Clode and others, this volume).
Exploration for deeper, typically blind deposits required
different techniques than those used in the 1980s. High-grade
gold in the northern Carlin trend is hosted in the lower units of
the Devonian Popovich limestone or in the upper units of the
underlying Devonian-Silurian Roberts Mountains Formation.
Drilling targeted these units below weak geochemical
Maggie Creek
Leach Facility
Gold Quarry
Maggie Creek
Mine
Figure C-11. Aerial view (looking east) of the Maggie Creek Mine and exploration for the Gold Quarry deposit,1982. Photo by Galen Knutsen.

7/27/2019 NEWMONT’S RESERVE HISTORY ON THE CARLIN TREND 1965-2001
http://slidepdf.com/reader/full/newmonts-reserve-history-on-the-carlin-trend-1965-2001 10/11
44
Winnemucca
Elko
Carlin
Ely
Reno
Lovelock
Las Vegas
80
80
H U M B O L D T E L K O
N Y EM I N E R A L
ESMERALDA
LYON
L I N C O L N
C L A R K
P E R S H I N G
C H U R C H I L L W H I T E
P I N E E
U
R
E
K
A
L
A
N
D
E
R
W
A S H O E
80
80
80
EmigrantPass
Hardie Footwall
Beast
Four Corners
W est Leevil le
Deep Star
Goldbug
Tara
RainUnderground
Carlin
E u r e
k a
C o u
n t y
E l k
o C
o u n
t y
0 2 4 6 miles
0 42 6 8 10 kilometers
Chukar Footwall
Figure C-12. Location of deposits added to reserves during the Going Deeper Years (1990–2001).

7/27/2019 NEWMONT’S RESERVE HISTORY ON THE CARLIN TREND 1965-2001
http://slidepdf.com/reader/full/newmonts-reserve-history-on-the-carlin-trend-1965-2001 11/11
45
Reserve History
anomalies and/or favorable structures found in the overlying
barren Ordovician Vinini Formation (D. Groves, 1999, personal
commun.). This exploration method led to the discovery of
the West Leeville deposit in 1994 on lands joint-ventured with
High Desert Mineral Resources about 1.5 miles (2.5 km) north
of the Carlin Mine (Jackson and others, 1997). The West
Leeville deposit lies 1,600 to 1,800 feet (480–540 m) below
the surface and contains a drill-indicated resource of 3.2 million
ounces (100 t) at an average grade of 0.436 opt (15.0 g/t) gold(Jackson and others, 1997a). While most of the exploration
emphasis was on deep deposits, several small, oxide deposits
including Tara and Beast were discovered (fig. C-12).
Newmont’s metallurgical research and development group
played a significant role in increasing reserves during this
period. The Refractory Ore Treatment Plant (Mill #6) was
commissioned in 1994 to roast high sulfide and carbonaceous
refractory ores from all its active operations. Most of
Newmont’s underground ore and a significant portion of the
remaining open-pit ore is refractory and requires pre-treatment
prior to gold extraction. Also in 1994, Newmont began a 3-
year commercial demonstration of its patented bioleaching
technique to process low-grade refractory ore. Bioleaching usesbacteria to oxidize sulfides prior to gold extraction with cyanide
or ammonium thiosulfate. In 1994, Newmont added 2.0 million
ounces (62 t) of Gold Quarry bioleach ore to reserves. In 1999,
bioleach processing was deemed uneconomic due to the low
gold price. Currently only bio-milling ore, which is a
combination of bioleach pretreatment and processing through
an oxide mill, is now included in Newmont’s reserves.
Newmont’s reserves reached a high in 1996 of 23,335,000
ounces (723 t). Figure C-5 illustrates the rising importance of
the underground reserves beginning in 1994. The higher-grade
underground ore has slowly increased the average grade of the
reserves to 0.100 opt (3.4 g/t) gold in 2001 (fig. C-6). Depletionand the revaluing of the reserves at a lower gold price has led
to declining reserves since 1996 (fig. C-7).
Gold production remained relatively constant in the 1990s
reaching a high of 1,866,000 ounces (58 t) in 2000 (fig. C-8).
Between 1965 and 2001, Newmont produced 27,321,767
ounces (849.8 t) from the Carlin trend.
FUTURE
Newmont is confident of continuing to add quality reserves to
its Carlin trend operations in the future. Development is
ongoing to convert known resources into reserves and
exploration continues to look for the next big deposit in thisproductive area. Ongoing metallurgical research of new
processes continues to allow material once considered waste
to be mined and processed economically.
Figure C-13. A 1998 view of the Carlin East underground portal area, looking north. The portal is located in the north
wall of the Carlin East pit. Photo by Matt Breitrick.
Carlin East Portal
BatchPlant