exploration success and resource growth at newmont’s ... · exploration success and resource...
TRANSCRIPT

Exploration Success and Resource Growth at Newmont’s Tanami Operations, Northern Territory
Matthew Baggott, Shaun Schmeider, Chris Robinson

Exploration Success and Resource Growth at Newmont’s Tanami Operations, Northern Territory Matthew Baggott, Shaun Schmeider, Chris Robinson | AGES | March 15th, 2016

Newmont Mining Corporation I AGES I Slide 3 March 2016
Cautionary statement
Cautionary statement regarding forward looking statements, including outlook: This presentation contains “forward-looking statements” within the meaning of Section 27A of the Securities Act of 1933, as amended, and Section 21E of the Securities Exchange Act of 1934, as amended, and are intended to be covered by the safe harbor provided for under such sections. Such forward-looking statements may include, without limitation: (i) estimates of future production and sales; (ii) estimates of future All-in sustaining costs; (iii) estimates of future capital expenditures; (iv) our efforts to continue delivering reduced costs and efficiency; and (v) expectations regarding the development, growth and future potential at Tanami. Estimates or expectations of future events or results are based upon certain assumptions, which may prove to be incorrect. Such assumptions, include, but are not limited to: (i) there being no significant change to current geotechnical, metallurgical, hydrological and other physical conditions; (ii) permitting, development, operations and expansion of the Company’s operations and projects being consistent with current expectations and mine plans; (iii) political developments in any jurisdiction in which the Company operates being consistent with its current expectations; (iv) certain exchange rate assumptions for the Australian dollar to the U.S. dollar, as well as other the exchange rates being approximately consistent with current levels; (v) certain price assumptions for gold, copper and oil; (vi) prices for key supplies being approximately consistent with current levels; (vii) the accuracy of our current mineral reserve and mineralized material estimates; and (viii) other assumptions noted herein. Where the Company expresses an expectation or belief as to future events or results, such expectation or belief is expressed in good faith and believed to have a reasonable basis. However, such statements are subject to risks, uncertainties and other factors, which could cause actual results to differ materially from future results expressed, projected or implied by the “forward-looking statements”. Such risks include, but are not limited to, gold and other metals price volatility, currency fluctuations, increased production costs and variances in ore grade or recovery rates from those assumed in mining plans, political and operational risks, community relations, conflict resolution and outcome of projects or oppositions and governmental regulation and judicial outcomes. For a more detailed discussion of such risks and other factors, see the Company’s 2015 Annual Report on Form 10-K, filed on February 17, 2016, with the Securities and Exchange Commission (the “SEC”). The Company does not undertake any obligation to release publicly revisions to any “forward-looking statement,” including, without limitation, outlook, to reflect events or circumstances after the date of this presentation, or to reflect the occurrence of unanticipated events, except as may be required under applicable securities laws. Investors should not assume that any lack of update to a previously issued “forward-looking statement” constitutes a reaffirmation of that statement. Continued reliance on “forward-looking statements” is at investors' own risk.
U.S. investors are reminded that reserves were prepared in compliance with Industry Guide 7 published by the SEC. Whereas, the term resource, measured resource, indicated resources‖ and inferred resources‖ are not SEC recognized terms. Newmont has determined that such resources would be substantively the same as those prepared using the Guidelines established by the Society of Mining, Metallurgy and Exploration and defined as Mineral Resource. Estimates of resources are subject to further exploration and development, are subject to additional risks, and no assurance can be given that they will eventually convert to future reserves. Inferred resources, in particular, have a great amount of uncertainty as to their existence and their economic and legal feasibility. Investors are cautioned not to assume that any part or all of the inferred resource exists, or is economically or legally mineable. Estimates of resources are subject to further exploration and development, are subject to additional risks, and no assurance can be given that they will eventually convert to future reserves. Inventory and potential upside referenced in certain graphics used herein have a greater amount of uncertainty. Investors are reminded that even if significant mineralization is discovered and converted to reserves, during the time necessary to ultimately move such mineralization to production the economic and legal feasibility of production may change. As such, investors are cautioned against relying upon those estimates. For more information regarding the Company’s reserves, see the Company’s Annual Report filed with the SEC on February 17, 2016 for the Proven and Probable Reserve tables prepared in compliance with the SEC’s Industry Guide 7, which is available at www.sec.gov or on the Company’s website. Investors are further reminded that the reserve and resource estimates used in this presentation are estimates as of December 31, 2015.

Newmont Mining Corporation I AGES I Slide 4 March 2016
Agenda
• 2013 – 2015 – a period of transformation
• Location
• Regional and local geology
• Mineralization, reserves and resources
• Discovery history
• New targeting strategy and outcomes
• Translation of discovery into value
• Recognizing the district potential

Newmont Mining Corporation I AGES I Slide 5 March 2016
Acknowledgement of Country
Newmont Tanami Operations is located on Aboriginal Freehold Land. We respectfully wish to acknowledge the past and present elders and traditional owners of the land on which we operate, the Warlpiri people.

Newmont Mining Corporation I AGES I Slide 6 March 2016
Largest gold producer in Australia
1000km

Newmont Mining Corporation I AGES I Slide 7 March 2016
2013 – 2015 – period of transformation
Growth 3.2Moz1 of R&R discovered, equal to ~25% of the ~13Moz endowment
Production from the mine more than doubled from 183koz to 436koz
Cost Average discovery cost per reserve ounce US$11.5
Average AISC/oz2 reduced by more than two thirds from US$2,294 to US$724
Future Significant exploration potential recognised at both deposit and district levels
Assessment of potential for next phase of mine expansion underway

Newmont Mining Corporation I AGES I Slide 8 March 2016
Location
Newmont Tanami Operations
• The Granites historic mine, operational process plant and camp
• Dead Bullock Soak underground mine
• ~540km from Alice Springs
• ~900km from Darwin
Newmont Mining Corporation I AGES I Slide 9 March 2016
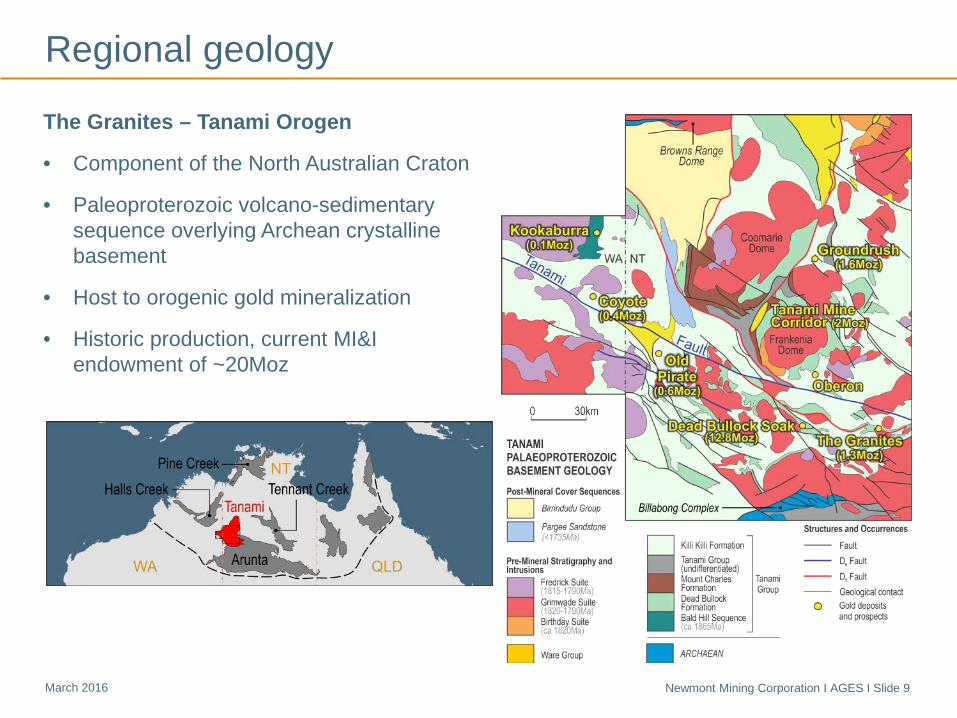
Regional geology
The Granites – Tanami Orogen
• Component of the North Australian Craton
• Paleoproterozoic volcano-sedimentary sequence overlying Archean crystalline basement
• Host to orogenic gold mineralization
• Historic production, current MI&I endowment of ~20Moz

Newmont Mining Corporation I AGES I Slide 10 March 2016
Local geology
Mine stratigraphy, structure and mineralization
• Massive to bedded or laminated siltstone and sandstone, overlain by chert-bearing, locally carbonaceous iron-rich siltstones and shale
• Mine stratigraphy tightly folded in moderately ESE plunging anticlinorium ~2km wide
• Gold hosted by swarm of 70 ° 160° cm-scale sheeted veins and enclosing structural corridor

Newmont Mining Corporation I AGES I Slide 11 March 2016
Controls on mineralization
Structurally controlled, stratabound lodes
• Form at intersection between structural corridors and prospective host lithologies
‒ Minor mineralization associated with sulfides in most Fe-rich rocks
‒ Most gold deposited as a result of a phase separation of the ore fluid

Newmont Mining Corporation I AGES I Slide 12 March 2016
Reserves and resources (R&R)
Key metrics
• At December 31st, 2015:
‒ Total R&R: 5.6Moz
‒ Reserves: 3.46Moz (18.7Mt @ 5.76g/t)
‒ Historic production: 7.2Moz
• Since December 31st, 2012:
‒ Total R&R added: 3.2Moz
‒ Reserves added: 2.6Moz
‒ Discovery cost: US$11.5/oz
‒ % endowment defined: 23%
Deposit endowment (Moz Au)

Newmont Mining Corporation I AGES I Slide 13 March 2016
1989 discovery of economic mineralisation
Initial discovery
• North Flinders Mines drawn to DBS in 1988 by reported gold occurrences and similar geology to The Granites
• Initial discovery in resistant Fe-rich siltstones and cherts on topographic highs
• Maiden MI&I – 600kt @ 3.3g/t for 64koz Au

Newmont Mining Corporation I AGES I Slide 14 March 2016
1991 discovery of Villa and Callie
Under cover – the bigger prizes
• Good understanding of the target mineral system drove exploration westward, down onto the sand plain
‒ comparison of stratigraphy to The Granites
‒ key role of folds in directing fluid flow
• 7.3Moz Callie deposit defined by narrow >50ppb Au contour, with modest As
‒ buried beneath <5m of aeolian sand
‒ best assay from vacuum drilling 8m @ 2.2g/t Au

Newmont Mining Corporation I AGES I Slide 15 March 2016
2007 discovery of Auron
Re-application of a proven strategy
• Rising costs demanded innovation after 14 years of mining down-plunge on Callie
• First hole drilled down stratigraphy from Callie into core of anticlinorium returned:
‒ 7m @ 8.6g/t, 1m @ 368g/t, 1m @ 50g/t and 1m @ 408g/t
‒ Patchy high grades occurred in laminated siltstones akin to Callie Host
Auron drill intercepts typically vary in thickness from 5 to 80 meters with grades of 5 to 100 grams of gold per tonne; select intercepts at Callie and Auron shown on this slide

Newmont Mining Corporation I AGES I Slide 16 March 2016
0
10
20
30
40
50
60
0
100
200
300
400
500
600
700
59150.0 59200.0 59250.0 59300.0 59350.0 59400.0 59450.0 59500.0 59550.0 59600.0 59650.0 59700.0 59750.0 59800.0 59850.0 59900.0 59950.0 60000.0 60050.0 60100.0 60150.0 60200.0 60250.0 60300.0 60350.0 60400.0 60450.0 60500.0 60550.0 60600.0 60650.0 60700.0 60750.0 60800.0 60850.0 60900.0 60950.0 61000.0 61050.0 61100.0 61150.0 61200.0 61250.0 61300.0 61350.0 61400.0
Dril
ling
(km
)
Endo
wm
ent (
koz)
Measured and Indicated Inferred Inventory Drilling
2013-2015 development of new targeting strategy
Drivers of accelerated growth
• Gold price demanded improved efficiency
• Analysis of endowment distribution showed south dipping fold limbs to be under-explored
• Numerous new targets generated
• Additional resource ounces delivered
See cross section for illustration Callie UG endowment by mine easting
Easting

Newmont Mining Corporation I AGES I Slide 17 March 2016
2013-2015 Federation and Liberator discoveries
Lateral vision • Federation discovery in Callie Host outside
main mineralized corridor ‒ >650koz of new resource at ~6.5g/t Au
• Liberator discovery in Auron Host below Federation
Federation drill intercepts typically vary in thickness from 2 to 35 meters with grades of 2 to 200 grams of gold per tonne; select intercepts shown on this slide

Newmont Mining Corporation I AGES I Slide 18 March 2016
2015 departure from the norm in Auron West
Application of concept
• Overlap between south dipping fold limb and main mineralised corridor at Auron West
• Change in geometry of mineralization predicted by new targeting model
• Relatively shallow, higher margin ounces
Auron West drill intercepts typically vary in thickness from 2 to 30 meters with grades of 2 to 200 grams of gold per tonne; select intercepts shown on this slide

Newmont Mining Corporation I AGES I Slide 19 March 2016
Significant remaining exploration potential
• Only 70% Inventory converted to Reserve and Resource
• Mineralization remains open at Callie, Auron, Federation and Liberator
• Soolin Footwall (up to 20m @ 8.6 g/t Au) – significant potential west of the known ore body
• Repeats – resource potential already demonstrated, current limitation is drill platforms
• Cavalon – Callie Host beneath up to 16m @ 14.7 g/t Au in overlying less prospective rocks
• Jenna – potential for an additional stacked ore body beneath Auron

Newmont Mining Corporation I AGES I Slide 20 March 2016
Improved costs enabling exploration and discovery
• DD has more than doubled in the last three years with cost / metre reduction of ~ 45%.
• Drill productivity improvements and increase in drill fleet from 6 to10 UG drills.
• Cost savings through program efficiencies and throughput enabling more exploration.

Newmont Mining Corporation I AGES I Slide 21 March 2016
0
500
1000
1500
2000
2500
0
50
100
150
200
250
300
350
400
450
500
2012 2013 2014 2015
Production AISC (US$/oz)
Translation of discovery into value
Mine production vs AISC over the period 2012 - 2015
• Mine production increase of 138%
• Reduction in All-in Sustaining Cost per ounce of production by 68%
• Sustainable, and can be built upon
183koz
323koz 345koz
436koz
$2,294
$1,163 $1,038
$724

Newmont Mining Corporation I AGES I Slide 22 March 2016
Capitalizing on value through expansion
Cripple Creek & Victor
Production To 425 – 475 Koz AISC ~$50/oz lower Capital $100 – $120M First production 2017
Production and AISC calculated as first full five year average for Tanami, including the expansion
Tanami Expansion, approved October 2015
• Maximizes IRR, cash flow and value
• Improves costs and mine life
• Assessment of next expansion underway

Newmont Mining Corporation I AGES I Slide 23 March 2016
Recognizing the district potential
Province-wide challenges and upside
• More than half of Granites-Tanami Orogen covered by transported material
• Exercising competitive advantage through deployment of proprietary Deep Sensing Geochemistry
• Newmont maintains ~4,000km2 of tenure with numerous exciting prospects and the right tools to explore them

Newmont Mining Corporation I AGES I Slide 24 March 2016
Endnotes
Investors are encouraged to read the information contained in this presentation in conjunction with the following notes, the Cautionary Statement on slide 2 and the factors described under the “Risk Factors” section of the Company’s Form 10-K, filed with the SEC on or about February 17, 2016, and disclosure in the Company’s recent SEC filings. (1) R&R refers to reserve and resource estimates as of December 31, 2015. The “reserves” disclosed in this presentation have been prepared in compliance with Industry
Guide 7 published by the SEC. As used herein, the term “reserve” means that part of a mineral deposit that can be economically and legally extracted or produced at the time of the reserve determination. The term “economically,” as used in this definition, means that profitable extraction or production has been established or analytically demonstrated in a feasibility study to be viable and justifiable under reasonable investment and market assumptions. The term “legally,” as used in this definition, does not imply that all permits needed for mining and processing have been obtained or that other legal issues have been completely resolved. However, for a reserve to exist, Newmont must have a justifiable expectation, based on applicable laws and regulations, that issuance of permits or resolution of legal issues necessary for mining and processing at a particular deposit will be accomplished in the ordinary course and in a timeframe consistent with Newmont’s current mine plans. Reserves referenced herein are aggregated from the Proven and Probable classes.
The terms “resources” and “Measured, Indicated and Inferred resources” or “MI&I” are used in this presentation. Investors are advised that the SEC does not recognize these terms. Newmont has determined that such “resources” would be substantively the same as those prepared using the Guidelines established by the Society of Mining, Metallurgy and Exploration (SME) and defined as “Mineral Resource”. Estimates of resources are subject to further exploration and development, are subject to additional risks, and no assurance can be given that they will eventually convert to future reserves. Inferred Resources, in particular, have a great amount of uncertainty as to their existence and their economic and legal feasibility. Investors are cautioned not to assume that any part or all of the Inferred Resource exists, or is economically or legally mineable. Also, disclosure of contained ounces is permitted under the SME Guideline and other regulatory guidelines, such as Canada’s NI 43-101 and Australia’s JORC. However, the SEC generally requires mineral resource information in SEC-filed documents to be reported only as in-place tonnage and grade. Inventory, preliminary drilling results and potential upside referenced in certain graphics used herein have a greater amount of uncertainty. Investors are reminded that even if significant mineralization is discovered and converted to reserves, during the time necessary to ultimately move such mineralization to production the economic feasibility of production may change. See the Company’s Annual Report for the “Proven and Probable Reserve” and “Mineralized Material” tables prepared in compliance with the SEC’s Industry Guide 7, available at http://www.newmont.com/our-investors/financial-reporting/sec-filings and on www.sec.gov.
(2) All-in sustaining cost is a non-GAAP metric. As used in this presentation, All-in sustaining cost is defined as the sum of cost applicable to sales (including all direct and
indirect costs related to current gold production incurred to execute on the current mine plan), remediation costs (including operating accretion and amortization of asset retirement costs), G&A, exploration expense, advanced projects and R&D, treatment and refining costs, other expense, net of one-time adjustments and sustaining capital. For a reconciliation of AISC to the CAS, please see the Company’s Form 10-K beginning on page 83 thereof available at http://www.newmont.com/our-investors/financial-reporting/sec-filings and on www.sec.gov.
(3) Investors are cautioned that drill hole results illustrated in certain graphics in this presentation are not necessarily indicative of future results or future production.