a water audit of newmont’s tanami goldmine operation,...
TRANSCRIPT
A WATER AUDIT OF NEWMONT’S TANAMI GOLDMINE OPERATION 123
IntroductionThe aim of this paper is to generate a portable andtransferable framework of water auditing measures. Theauditing methods promoted in this paper will underpin thedelivery of a self-managed system of quantifying mine-water sources and usage. This is supported by a quantitativeanalysis of fit for purpose water use that represents a qualityassessment on various water uses and suitability. The wateraudit domain is represented by four water sources and wateroutflow from two discharge outlets. The general aim of thispaper lays the groundwork for the application of materialsand methods required for water auditing in hydrometallurgyand mining. The specific objectives include:
• Developing a pre-audit water circuit schematic• Outlining the materials and methods required to
conduct a mine site water audit• Describing the operation of ultrasonic testing
equipment • Conducting a water audit and formulating a results
table• Provide a site water quality analysis and non-audit
water flow data to format a results table• Describe the process of data logging water flows and
produce a line graph for analysis• Contribute to a generic water quality and percentage
usage table• Tabulate a step-by-step framework of a water audit
procedure• Develop a water management strategy. This paper generates a background of water use data that
will provide water security when operating a remote areagoldmine in a water scarce desert region. It will establishthe framework of a water management strategy required forsite-wide water uses while maintaining sustainable waterstocks.
Background and site descriptionThe Granites Tanami Operation sits within the Killi-Killigeological formation where gold mineralisation occursalong the ‘Tanami Corridor’ in quartz veins withinturbiditic sediments. Throughout this recent geologicalformation (Wygralak 2005), siltstones and sandstonedominate the geology with banded iron and dolerite sillsintruding the upper sediments. Much weathering hasoccurred and the topography is subdued, consisting of flatto undulating sand plains and broad drainage depressionsassociated with palaeochannels (NTG 2005). There is ageneral lack of well-defined surface drainage channelshowever; palaeo-alluvial valley sediments provide ashallow overland flow of rain-driven water, generallymoving in a southward direction (Wygralak 2005). Theaverage annual rainfall is 475mm of which 90% fallsbetween November to April and provides an aquiferrecharge necessary to sustain the 1500 Mega-Litres (ML) ofbore-water abstracted for the Tanami operations (Newmont2009).
Process descriptionThe unit operations included a three phase gold-orecrushing system installation (CSI), a ball mill, hydro-cyclones, an underflow stream reporting to spiralconcentrators, an overflow stream reporting to a carbon inleach process (CIL), a reverse osmosis filtration system andfinal concentration of gold and silver in the acid washingand elution process. Unit operations are highlighted andwater quality is classified within the framework of a wateraudit process (Sturman 2004). Approximately 3.0 Mega-Tonnes per Annum (MTPA) of gold ore is extracted ofwhich ~0.2 MTPA is stockpiled waste material and 2.8MTPA is process/treated. Bore water is abstracted and isclassed as either fresh (<1 500 mg/L total dissolved solids -
COCKS, R.J., HO, G.E. and ANDA, M. A water audit of Newmont’s Tanami Goldmine Operation, N.T. Australia. World Gold Conference 2009, TheSouthern African Institute of Mining and Metallurgy, 2009.
A water audit of Newmont’s Tanami Goldmine Operation,N.T. Australia
R.J. COCKS*, G.E. HO, and M. ANDAUNEP IETC Environmental Technology Centre, Murdoch University, Perth
Water auditing and water efficient practices are evolving as the quantitative tools for waterbalance reporting in the mining and minerals processing sector. This paper was written to describethe process of water auditing in a gold mining environment. It will contribute towards building anappropriate water management framework for The Cooperative Research Centre (CRC) forsustainable resource processing (CSRP). The research assists with the assessment of waterbalances in mining and hydrometallurgical processes and provides, on the ground, steady-statedata for ongoing probabilistic modeling underway at most of Newmont’s gold mine operations.Five Newmont case study mine sites including the Tanami Granites Goldmine are central to thisPhD water project study. The function of the Tanami-Granites water audit exercise was tomeasure a controlled flow of various water quality types and set a framework to establish furtherresearch for water efficiencies and water conservation in mining.
Paper 38:text 10/16/09 8:57 AM Page 123
WORLD GOLD CONFERENCE 2009124
TDS) or brackish (1 500 to 15 000 mg/L TDS) water ofwhich fresh water makes up 1.5% of the total water usagevolume. The Granites Gold Plant CSI blends and processessoft oxide material and harder underground ore, a Ball Millthat grinds the crushed ore with a water feed rate ofapproximately 350 wet tonnes per hour. The feed-water issourced from either (raw) brackish borewater or tailingsdecant return water, otherwise referred to as process-water.Course ground material is recycled back into the mill toallow for regrinding and acceptable passing grades forreporting to the hydro-cyclones that separate various gradesof material. This results in concentrated product spilling toan underflow stream from one of the cyclones leading to thegravity circuit. The overflow slurry enters the CIL circuitconsisting of 4 leach tanks and 7 absorption tanks. Thegravity circuit is made up of spirals, tables and an AcaciaReactor to produce concentrated (pregnant) eluate forelectrowinning. From the CIL circuit, acid washing andelution further concentrate gold and silver in solution. Thisis recovered in stainless steel cathodes attached to anodesand the process of electrowinning. Barren slurry from theCIL process reports to the tails thickener and barren eluateis re-used and pumped to milling (Newmont 2009).
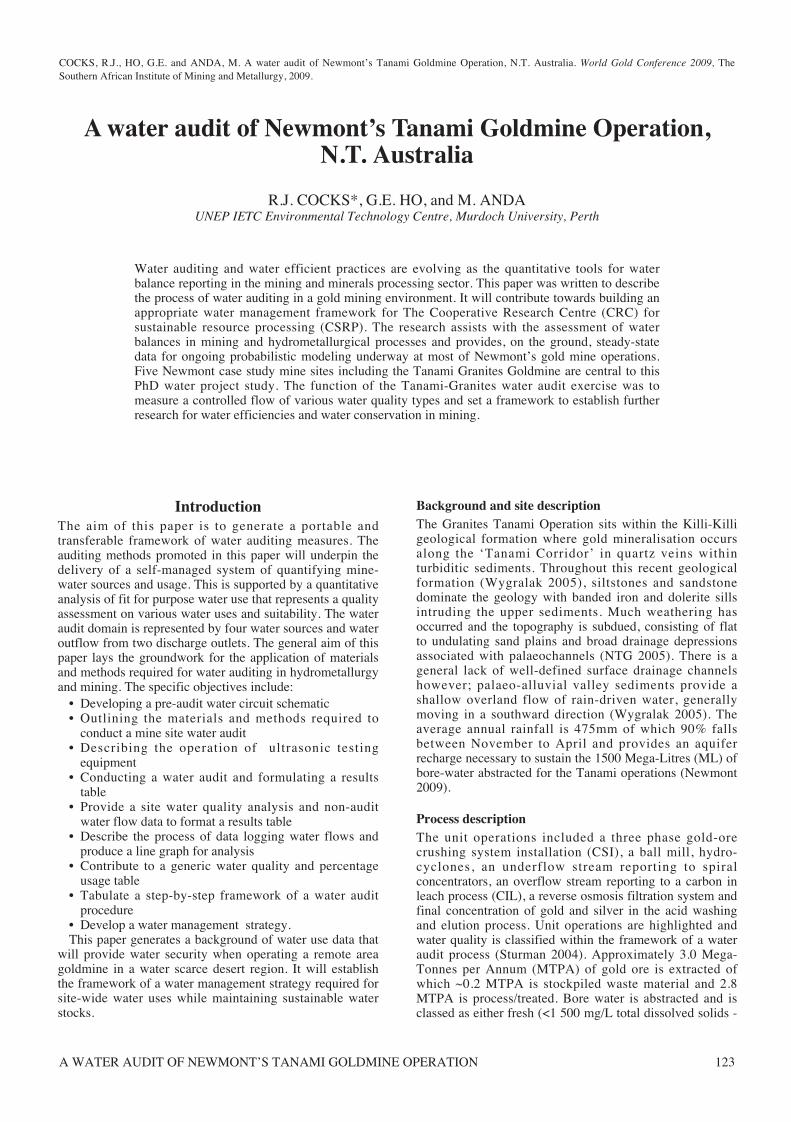
The water audit domain is contained within the prescribedunit operations (Figure 1). The water audit boundary alsoincludes the potable water outflow from the potable watertank facility. Potable water supplied from storage isrequired for elution and the final stages of gold recovery. Asimplified diagram was compiled to highlight the wateraudit domain ( Figure 1).
As specified, the water audit domain was bounded by thesupply side of water storage vessels and input of moisturecontained in crushed gold ore. The discharge side of thedomain included raw water pumped to the CSI for dustsuppression and spent tailings pumped from CIL to the inletside of the tails thickener. Within the audit boundary, waterhas several functions including dust suppression, rheology(transport of slurry), re-used water (barren eluate) cycledback into milling and process water used for plant andequipment wash-downs which is collected at sump pointsand pumped back into the system. During the audit verylittle evaporation occurred within the domain and minimalwater was lost to ground. Therefore water movement andmonitoring was kept to a controlled process of directmeasurement other than ore moisture inputs and watercalculated within the solids flux of discharged slurry(Newmont 2009).
Figure 1. Granites goldmine water audit domain
Table IGranites water audit: audit preparation materials and methods
Equipment Process water Raw water Potable (RO) Tails waterUltrasonic thickness gauge Measure pipe wall thickness Measure pipe wall thickness Measure pipe wall thickness Measure pipe wall thicknessElectronic calipers Measure pipe outside Measure pipe outside Measure pipe outside Measure pipe outside
diameter diameter diameter diameterSandpaper/cleaning cloth/ Prepare pipe wall for Prepare pipe wall for Prepare pipe wall for Prepare pipe wall forcoupler gel transducers transducers transducers transducersUltrasonic Meter Calibrate to pipe Calibrate to pipe Calibrate to pipe Calibrate to pipe
specifications specifications specifications specificationsMagnetic clamp-on or Monitor and record main Monitor and record main Monitor and record RO Monitor and record tailselectrical tie-on supply flow rate supply and CSI flow rates supply to elution flow rate thickener overflow to process
water flow rateHM transducersHS transducersAqua conductivity meter/ Collect sample and record Collect sample and record Collect sample and record Collect sample and record beaker TDS TDS TDS TDSpH meter/beaker Collect sample and record pH Collect sample and record pH Collect sample and record pH Collect sample and record pHLaptop computer Hoboware Attach data logger to (meter)software program for RO water supply-Pendant data logger underground mine services
Paper 38:text 10/16/09 8:57 AM Page 124
A WATER AUDIT OF NEWMONT’S TANAMI GOLDMINE OPERATION 125
Methodology
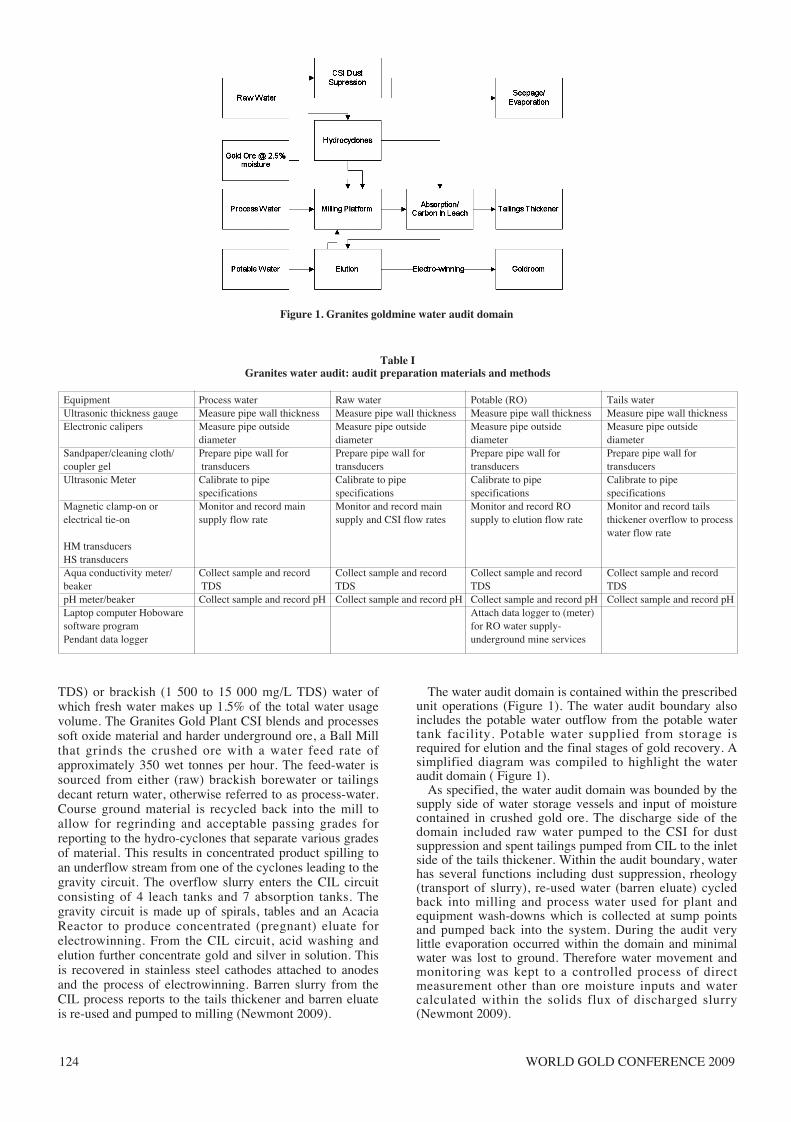
The water auditThe water audit team consisted of the water auditor(author), a graduate metallurgist and a process operator.The audit was initiated by a synchronized recording ofmeter readings at a set time on day one of the exercise. Thereadings were transferred onto an excel spreadsheet used todocument all parameters within the water audit domain.The configuration of flow meters, pipe-work, valves andpumps varied considerably from one unit operation toanother (see Table I). This included meter types, flowmeasurement, flow rates, pipe material, pipe specifications,valves and pumping regimes. For example; process water ismeasured in m³/hr and raw water is monitored in L/s. Othervariations throughout the water circuit included potablewater pumped via a Grundfos centrifugal pump servicingeither small bore polyethylene or carbon steel pipes. Watermeters ranged from radio-active densimeters (tails-slurry)and rotary turbine loggers (small bore) to electro-magnetic-flow (magflow) meters for larger water transfer pipes.Magflow meters are displayed electronically and totalisedat base-stations around site. During the water auditingperiod an ultrasonic meter (see Figure 2) was employed toassess the accuracy of on-site water metering within the
audit domain. The water audit meter calibration exercisecommenced by using an ultrasonic thickness gauge andelectronic calipers to measure water pipe wall thicknessesand outside diameters respectively. Where pipe outsidediameter (OD) exceeded 120 mm a tape measure was usedto measure OD and information was gathered from pipesuppliers and site project records to confirm pipespecifications where possible.
A water pipe’s sound fluid velocity was measuredthrough a transducer array that was clamped on after pipedimensions were fed into the hand held meter to set thecalibrations for accurately recording the water flow- rate.Once the data was displayed on the ultrasonic meter screena comparison was recorded from the site water meter beingtested. In some instances mechanical barrel type metersdisplayed a totaliser function rather than a water flow ratedisplay. To compensate for this, a time interval stopwatchover the number of litres counted was used to calculate andcompare L/s or kL/hr flow rates. Table I describes thematerials and methods used in the water-audit.
The transducers came in two sets; one labeled HS was forsmall-bore pipes up to 120mm outside diameter. The HMunit clamped on (magnetically) to pipes ranging from120mm to 500mm OD (Figure. 2). Electrical tie straps wereused to secure transducers on polyethylene pipes. Once pipe
Figure 2. Ultrasonic meter and transducers
Table IITM-100 Ultrasonic clamp-on water meter - audit preparation
Water type Unit operation Pipe material Pipe outside Pipe wall thickness- Transducer spacing- Meter typeAudit diameter- Ultrasonic gauge (large HM)
Electronic calipers (small HS)Process Milling/CIL Carbon steel 250 mm 9 mm HM-237 mm ABB magflowRaw CSI Polyethylene 90 mm 8 mm HS-71 mm Elster bulk flowPotable Elution Carbon steel 90 mm 5.4 mm HS-87 mm DaviesShephardRaw Hydrocyclones Carbon steel 200 mm 9 mm HM-188 mm ABB magflowNon-audit -------- ------- ------- ------- ------- ----------Potable RO to decline DBS PVC 20 mm 1 mm HS-1 mm Elster volumetric
M26Bore-water Jumbuck Bore Polyethylene 110 mm 11 mm HS-92 mm ABB telemetricSeepage recovery Bunkers TSF Bore Carbon steel 60 mm 3.7 mm HS-39 mm Elster bulk flow
M3Raw Raw bleed to process Polyethylene 100 mm 5.8 mm HS-79.2 mm Not metered
waterRaw To RO Polyethylene 90 mm 4 mm HS-69 mm Elster bulk flowPotable RO product Carbon steel 60 mm 3.3 mm HS-50 mm DaviesShephardDecant Bunkers to PW Polyethylene 225 mm 4 mm HM-175 mm ABB magflow
Paper 38:text 10/16/09 8:57 AM Page 125

WORLD GOLD CONFERENCE 2009126
specifications had been entered into the ultrasonic meter thetransducer spacing figure was calculated and displayed onthe menu list. Other factors to be entered were pipematerial; carbon steel, PVC or polyethylene, fluid type,pipe-liner (yes/no) and flow rate (kL/hr, L/m or L/s). Thesignal detection (sound fluid velocity) was either weak orstrong depending on the degree of transducer contact. Thiswas improved by pipe wall preparation including the use ofsand paper to clear debris, a clean wiping cloth to removeresidues and a thick application of coupler gel.
The measurement of water quality was recorded by aconductivity and pH test kit and carried out on potable, rawand process water. Process water included the make-up oftailings storage facilities (TSF) decant return-water and tailsthickener water overflow. Raw water make-up consisted ofvarious bore water locations pumped in to the main rawwater holding tank. Reverse osmosis (RO) filtration drawswater off the raw water tank and processes potable water atan efficiency of approximately 50%. The waste brine wateroff RO filtration reports to the process water tank and ROproduct water is stored in the potable water tank. The auditconcluded by recording all water meter readings on a settime after five days of operations. The exercise wasfinalized by calculating the differences of meter readings ofinflows of water tabulated against outflows of water.
Results The Tanami/Granites water audit revealed several
anomalies that affected the outcome of the water audit andthese issues are discussed along with the data that wasrecorded during the auditing exercise. Results outlined arethe water audit findings including a comparative graph offlow rate calibration using a hand-held ultrasonic meter, awater audit results table, a non-audit table of water flow-rates and water quality and record of potable water used atthe Dead Bullock Soak underground services in the CalliePit. A water classification table is represented as a summaryof all of the mine site case studies and a comparison istabled as to the range of water quality present at theTanami/Granites operation. The gold mining operation hasbeen producing gold for twenty years and is now one ofAustralia’s biggest gold producers (Newmont 2009). Due tochanges in company ownership and restructuring of waterservices over the years there is a lack of archival datarelating to pipe specifications and historic record of watersources, uses and discharges. During the water auditexercise an ultrasonic meter was deployed as a means tocalibrate pipe specifications, non-metered flows and keymetering points around site. The ultrasonic meter or handheld computer receives all water flow characteristics viaclamp-on transducers once pipe dimensions andcorresponding transducer spacing have been recorded andapplied. Apart from the lack of site data, several obstaclesrelating to calibrating flow-rates in carbon steel and oldpolyethylene pipe-work were experienced. The aim of thecalibration exercise was to highlight areas deficient in waterflow-rate accuracy as a means to report areas needingattention. These locations were revealed as a result ofrepetitive measuring and attempts to calibrate particularlyprocess water and bore-water delivery/discharge pipe-workand meters.
Accuracy of measurementsThe site recognizes that over time, carbon steel pipe-workaccumulates salt build-up on the inside of the pipe walls.
The accumulated calcite forms a substrate inside the pipethat counters the effectiveness of ultrasonic wavelengthsreporting water flows to set parameters for display andmeasurement of water movement. Furthermore, oldpolyethylene pipe- work on site has been degraded by yearsof exposure to sunlight and mechanically impacted bycontinual moving and restructuring of the water deliveryand discharge circuits. Therefore, the ultrasonicmeasurement of pipe wall thickness and lack of site data onold polyethylene pipe work proved to be a barrier tomeasurement of water flow compared to calibrating in-situwater meters attached to dated polyethylene pipe work. Inthese identified problem areas of the water audit domain thegreatest differences of flow measurements were recorded.That is, the greatest margin of error in process watertransfers and site meter read-outs compared to theultrasonic metering data. Figure 3 highlights thesedifferences whereas potable and raw water flow rate testingwas accurate to within 2%.
The calibration exercise is a necessary support function ofa mine water audit. A water audit can be conducted overshort term durations however, a five day period wasrecognised as a suitable timeframe to ensure the water auditcalibration exercise could be completed along with waterquality analysis during the water audit process. The build-up of calcite material from saline water in pipe work andmeters affected the accuracy of ultrasonic measurement.Therefore adjustments were made to pipe wall thicknessinputs to the ultrasonic meter to allow for calcite build-up.The water auditor overcame this obstacle and continuedobtaining sets of data that were maintained while auditingsite-metered flow rates of feed and discharge water. Furthertesting and analysis should be carried out on plant-meteraccuracy prior to any structural changes to the water circuitto ensure water flow measurement precision.
The water audit ceased prematurely due to anunscheduled mill shut down for maintenance and repairs.The water audit was due to be closed off four hours laterthan the ‘shut’ although this did not affect the ability of theauditor to record flow rates and finalise the water audit withall resources on hand. The auditor concluded the wateraudit by utilising mine staff in order to record flow rates atkey points in a synchronised procedure. Plant metertotaliser displays were recorded, ore moisture through-putand barren slurry (solids) discharge water analysis wasretrieved from the site laboratory. A theoretical water auditclosure was achieved however; the results were notconclusive due to several barriers experienced during theexercise. From the outset is was assumed that within thewater audit domain a closed water circuit consisting of
Figure 3. Plant meters vs. ultrasonic meter
Paper 38:text 10/16/09 8:57 AM Page 126
A WATER AUDIT OF NEWMONT’S TANAMI GOLDMINE OPERATION 127
milling, concentration, leaching, absorption and elution hadlittle to zero water losses. Therefore, in areas that could notbe audited and for example; the CIL barren slurry dischargeto the tailings thickener were established from laboratoryanalysis of the solids fluxes.
A framework was established to lay the groundwork forfuture water audits including meter calibration, waterquality analysis and the categorisation of water used forvarious unit operations in mining processes (Sturman2004). Table IV contributes to the overall water auditfunction and towards building a framework that can beadapted to future mine site water audits in order to establishfit for purpose mine water usage. (see Table V).
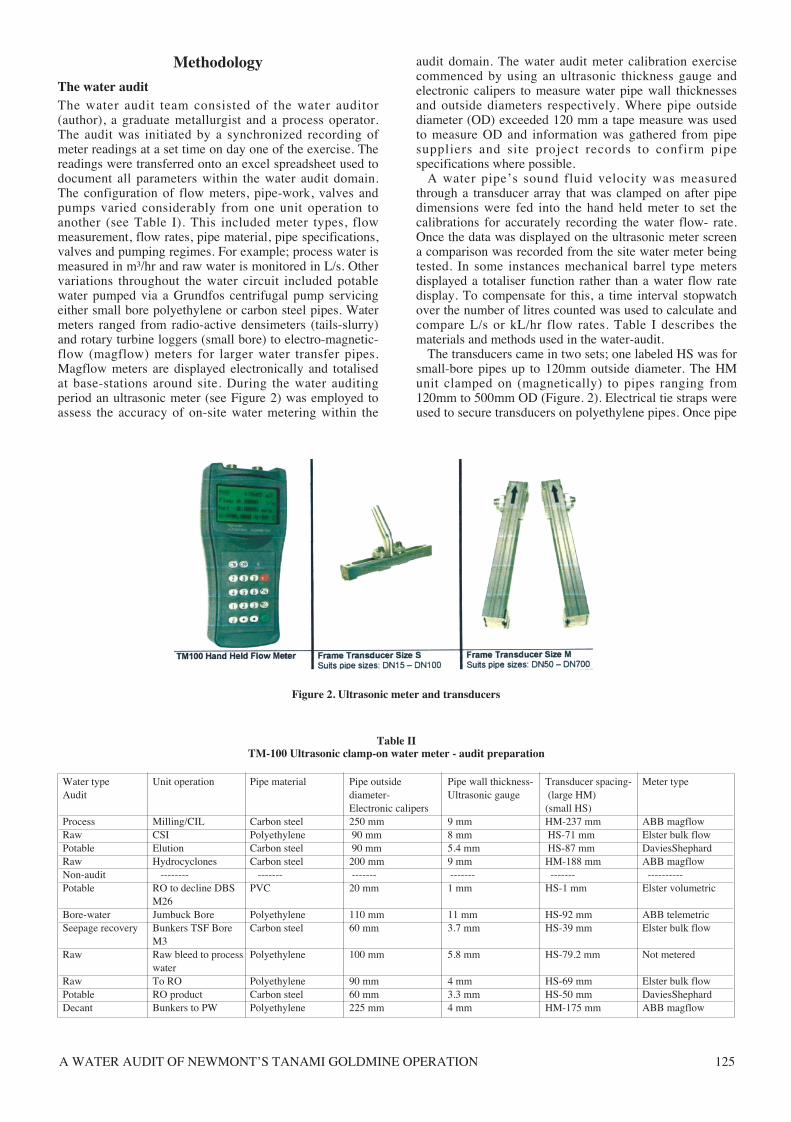
Table III includes ultrasonic meter results that can becorroborated with the meter calibration results in Figure 3.The greatest margin of 22% is indicated with process waterflows and even though raw water had the same meteringand steel pipe work, a 2% error margin in most calibrationsconfirms the effectiveness of an ultrasonic meteringapplication for site-meter calibration. The potable waterfeed to elution was measured by an electro-magnetic flow-meter (magflow) that displayed a totalised figure whereasprocess and raw water meters displayed kL/hr and L/srespectively. Therefore, the potable feed could not becompared using the ultrasonic meter. In Table III a gain of0.4% indicates water closure where -/+ 10% is generally anacceptable error margin to achieve water audit closure(Sturman 2004). However, the result is an assumptionbased on the fact that during the audit procedure, no water
was lost. This was based on communication with staff andchecking through daily reporting logs to confirm all waterremained within the water flow circuit over the water auditduration. During the water audit a number of non-auditwater outlets were examined both for water quality andflow rate measurement. For water quality, pH and salinity(TDS) were tested using a hand held conductivity meter.The flow rates were calculated using a water measuringcup, existing plant meters or the ultrasonic meter.
Table IV is a snapshot of water values and classificationsthat when analysed can be incorporated into the overallwater hierarchy of water use across the 5 Newmont casestudy mine sites displayed in Table V. These and otherconsiderations relating to water efficiencies leading towater conservation will be explored further in the summarysection of the Tanami/Granites water audit paper.
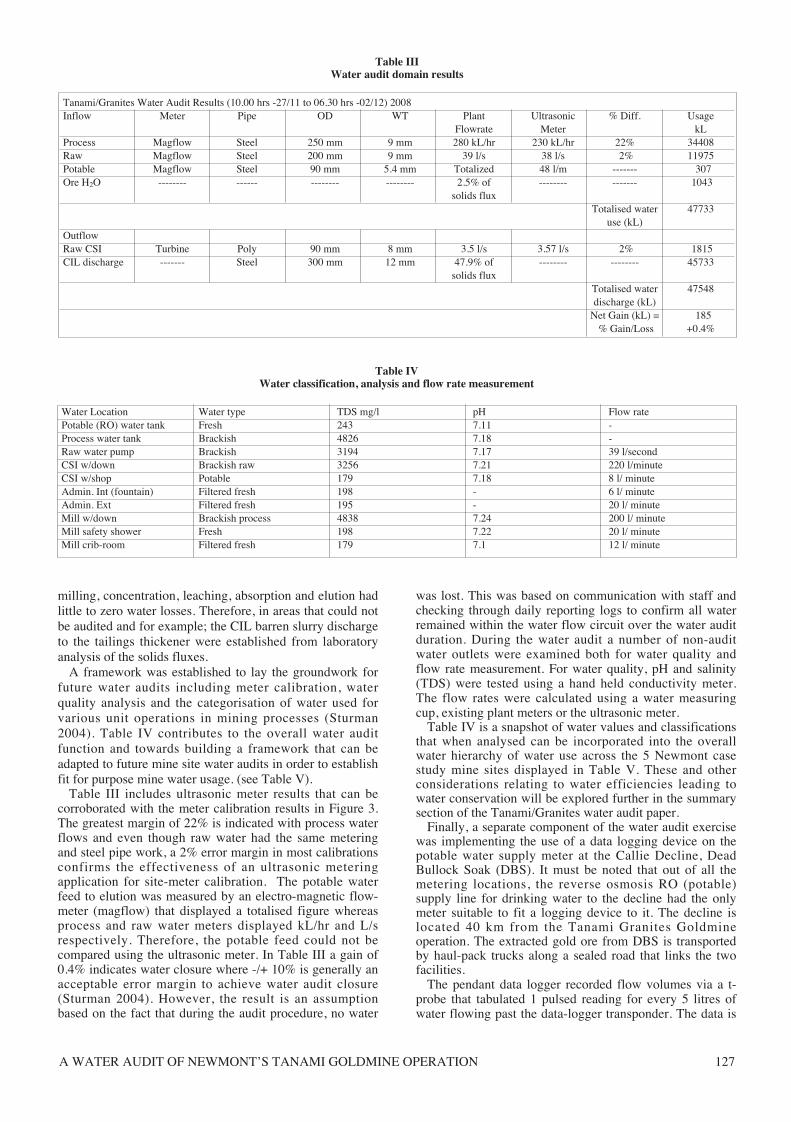
Finally, a separate component of the water audit exercisewas implementing the use of a data logging device on thepotable water supply meter at the Callie Decline, DeadBullock Soak (DBS). It must be noted that out of all themetering locations, the reverse osmosis RO (potable)supply line for drinking water to the decline had the onlymeter suitable to fit a logging device to it. The decline islocated 40 km from the Tanami Granites Goldmineoperation. The extracted gold ore from DBS is transportedby haul-pack trucks along a sealed road that links the twofacilities.
The pendant data logger recorded flow volumes via a t-probe that tabulated 1 pulsed reading for every 5 litres ofwater flowing past the data-logger transponder. The data is
Table IIIWater audit domain results
Tanami/Granites Water Audit Results (10.00 hrs -27/11 to 06.30 hrs -02/12) 2008Inflow Meter Pipe OD WT Plant Ultrasonic % Diff. Usage
Flowrate Meter kLProcess Magflow Steel 250 mm 9 mm 280 kL/hr 230 kL/hr 22% 34408Raw Magflow Steel 200 mm 9 mm 39 l/s 38 l/s 2% 11975Potable Magflow Steel 90 mm 5.4 mm Totalized 48 l/m ------- 307Ore H2O -------- ------ -------- -------- 2.5% of -------- ------- 1043
solids fluxTotalised water 47733
use (kL)OutflowRaw CSI Turbine Poly 90 mm 8 mm 3.5 l/s 3.57 l/s 2% 1815 CIL discharge ------- Steel 300 mm 12 mm 47.9% of -------- -------- 45733
solids fluxTotalised water 47548 discharge (kL)
Net Gain (kL) = 185 % Gain/Loss +0.4%
Table IVWater classification, analysis and flow rate measurement
Water Location Water type TDS mg/l pH Flow ratePotable (RO) water tank Fresh 243 7.11 -Process water tank Brackish 4826 7.18 -Raw water pump Brackish 3194 7.17 39 l/secondCSI w/down Brackish raw 3256 7.21 220 l/minuteCSI w/shop Potable 179 7.18 8 l/ minuteAdmin. Int (fountain) Filtered fresh 198 - 6 l/ minuteAdmin. Ext Filtered fresh 195 - 20 l/ minuteMill w/down Brackish process 4838 7.24 200 l/ minuteMill safety shower Fresh 198 7.22 20 l/ minuteMill crib-room Filtered fresh 179 7.1 12 l/ minute
Paper 38:text 10/16/09 8:57 AM Page 127

WORLD GOLD CONFERENCE 2009128
recorded by the pendant device and at the end of the trial itwas de-activated and removed from the in-line meter. Thedata was then loaded into a laptop via an attached basestation. The software program stores and displays waterflow volumes and trends. In this case, Figure 4 highlightsthe total volume of potable water that was pumped to thedecline, and over the 65 hour logging period a flow rate of11.5 L/m was calculated. The benefit of logging a watersupply assists with the evaluation of water requirementsduring a fixed time of observation. Considering the fact thatno more than 100 personnel were underground on any oneshift, the findings highlighted a possible loss of waterdownstream due to an obvious oversupply of water forpersonal use.
DiscussionAs mentioned the Tanami/Granites operation has beenrunning for 20 years and many structural changes haveoccurred (Newmont 2009). This includes water deliverycircuits that have been interrupted and re-routed or blockedoff where no flow is present. In most mine sites, watercircuits are constructed to ensure water either returns to itsholding reservoir or is delivered on demand at appropriateoutlets. This is especially critical to enabling fresh ambientwater to be delivered for human consumption whether it isfor drinking, showering or safety wash-down and flushingstations. During the water analysis and flow measurementexercise several anomalies were discovered. Even thoughthe results indicate even distribution of TDS and pHaccording to the water type, turbid water was present at theCSI workshop and safety wash stations sprayed hot water
heated by water standing in the delivery pipe. Therefore,active flowing water circuits are required for delivery ofpotable water to drinking and safety wash-down outlets.
In Table V the water classifications are a guide toapplying varying water qualities to unit operations whileconducting either a controlled (contained) or site-widewater audit. Raw water quality differs considerablybetween one Newmont mine site to another and in somecases not much separates the quality of raw water comparedto process water. In the case of Tanami/Granites, thepressure on bore water abstraction can be alleviated, byincreasing the flow of discharged treated wastewater fromvillage accommodation into tailings storage. Further waterconservation could include an increase in tails thickeneroverflow back into the milling circuit. Overall mine waterquality is maintained through increased storm watercollection and greater settling and clarifying of TSF water.
Table V is a generic classification of water types and ‘fitfor purpose’ use in the utilisation of water for humanconsumption, dust control and hydrometallurgical processesacross the 5 case study mine sites. Water quality of watersources and uses within the scope of the Tanami/Graniteswater audit were included into the overall water hierarchyframework detailed in Table V. That is, results based datafrom Table IV collated into the overall water hierarchy ofgeneric minewater use.
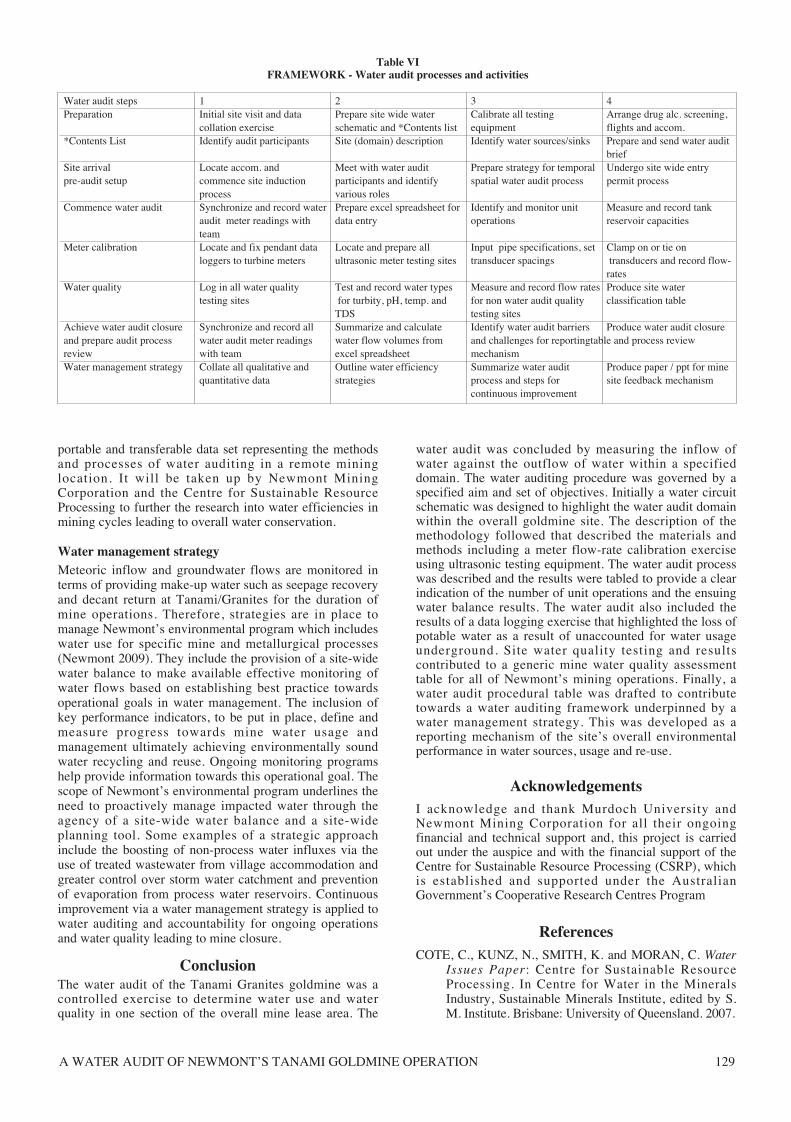
Table VI represents a procedural framework of adevelopmental process towards water auditing within amine site’s environmental program. It contributes towards awater accounting process that is both transferable andtransparent in its content and applicable to a gold miningoperation. Evidence supporting a water audit closure isrevealed in a results outcome based report and underpins aguarantee that minimal water losses are incurred through anaccountable raft of data and findings. A diagrammaticoverview is produced and summarised by a final phase ofwater audit reporting. This may include reporting via afeedback mechanism and liaison with the water audit teamfollowed up by a summary and recommendations of waterefficiencies and conservation. The final outcome is apresentation of findings and appropriate closure formatdirected to the client/auditee. This would include a watermanagement strategy that underpins a reporting mechanismtowards continuous improvement in water allocationcompliance and water use analysis. This results section hasprovided an insight into the processes of water auditing andwater quality analysis. It contributes to the delivery of a
Figure 4. Data logging using Hoboware programme
Table VHierarchical water classification
Water source TDS Mine function Approximate usage Classification Potable < 1,500 mg/l Accom ops Elution 1% SchemeBore potable < 1,500 mg/l Accom opsRO Elution 5% Fresh FilteredBore brackish 1,500 to 15,000 mg/l Hydrocyclones 20% Raw Barren Eluate <15,000 mg/l Sag Ball mills Up to 6 cycles of re use Re-used Process Meteoric Variable Tailings damWater storage Variable Raw Tailings decant 15,000 to 35,000 mg/l Sag Ball mills Up to 60% of raw water inflow Recycled Process Bore saline <35,000 mg/l SAG Ball mills 20% Process
Dust controlPaleo channel 35,000 to 120,000 mg/l Dust control Variable Non ProcessHyper saline Treated wastewater <15,000 mg/l Revegetation Tailings dam < 1% Recycled
Paper 38:text 10/16/09 8:57 AM Page 128
A WATER AUDIT OF NEWMONT’S TANAMI GOLDMINE OPERATION 129
portable and transferable data set representing the methodsand processes of water auditing in a remote mininglocation. It will be taken up by Newmont MiningCorporation and the Centre for Sustainable ResourceProcessing to further the research into water efficiencies inmining cycles leading to overall water conservation.
Water management strategyMeteoric inflow and groundwater flows are monitored interms of providing make-up water such as seepage recoveryand decant return at Tanami/Granites for the duration ofmine operations. Therefore, strategies are in place tomanage Newmont’s environmental program which includeswater use for specific mine and metallurgical processes(Newmont 2009). They include the provision of a site-widewater balance to make available effective monitoring ofwater flows based on establishing best practice towardsoperational goals in water management. The inclusion ofkey performance indicators, to be put in place, define andmeasure progress towards mine water usage andmanagement ultimately achieving environmentally soundwater recycling and reuse. Ongoing monitoring programshelp provide information towards this operational goal. Thescope of Newmont’s environmental program underlines theneed to proactively manage impacted water through theagency of a site-wide water balance and a site-wideplanning tool. Some examples of a strategic approachinclude the boosting of non-process water influxes via theuse of treated wastewater from village accommodation andgreater control over storm water catchment and preventionof evaporation from process water reservoirs. Continuousimprovement via a water management strategy is applied towater auditing and accountability for ongoing operationsand water quality leading to mine closure.
ConclusionThe water audit of the Tanami Granites goldmine was acontrolled exercise to determine water use and waterquality in one section of the overall mine lease area. The
water audit was concluded by measuring the inflow ofwater against the outflow of water within a specifieddomain. The water auditing procedure was governed by aspecified aim and set of objectives. Initially a water circuitschematic was designed to highlight the water audit domainwithin the overall goldmine site. The description of themethodology followed that described the materials andmethods including a meter flow-rate calibration exerciseusing ultrasonic testing equipment. The water audit processwas described and the results were tabled to provide a clearindication of the number of unit operations and the ensuingwater balance results. The water audit also included theresults of a data logging exercise that highlighted the loss ofpotable water as a result of unaccounted for water usageunderground. Site water quality testing and resultscontributed to a generic mine water quality assessmenttable for all of Newmont’s mining operations. Finally, awater audit procedural table was drafted to contributetowards a water auditing framework underpinned by awater management strategy. This was developed as areporting mechanism of the site’s overall environmentalperformance in water sources, usage and re-use.
AcknowledgementsI acknowledge and thank Murdoch University andNewmont Mining Corporation for all their ongoingfinancial and technical support and, this project is carriedout under the auspice and with the financial support of theCentre for Sustainable Resource Processing (CSRP), whichis established and supported under the AustralianGovernment’s Cooperative Research Centres Program
ReferencesCOTE, C., KUNZ, N., SMITH, K. and MORAN, C. Water
Issues Paper: Centre for Sustainable ResourceProcessing. In Centre for Water in the MineralsIndustry, Sustainable Minerals Institute, edited by S.M. Institute. Brisbane: University of Queensland. 2007.
Table VIFRAMEWORK - Water audit processes and activities
Water audit steps 1 2 3 4Preparation Initial site visit and data Prepare site wide water Calibrate all testing Arrange drug alc. screening,
collation exercise schematic and *Contents list equipment flights and accom.*Contents List Identify audit participants Site (domain) description Identify water sources/sinks Prepare and send water audit
briefSite arrival Locate accom. and Meet with water audit Prepare strategy for temporal Undergo site wide entrypre-audit setup commence site induction participants and identify spatial water audit process permit process
process various rolesCommence water audit Synchronize and record water Prepare excel spreadsheet for Identify and monitor unit Measure and record tank
audit meter readings with data entry operations reservoir capacitiesteam
Meter calibration Locate and fix pendant data Locate and prepare all Input pipe specifications, set Clamp on or tie onloggers to turbine meters ultrasonic meter testing sites transducer spacings transducers and record flow-
ratesWater quality Log in all water quality Test and record water types Measure and record flow rates Produce site water
testing sites for turbity, pH, temp. and for non water audit quality classification tableTDS testing sites
Achieve water audit closure Synchronize and record all Summarize and calculate Identify water audit barriers Produce water audit closureand prepare audit process water audit meter readings water flow volumes from and challenges for reportingtable and process reviewreview with team excel spreadsheet mechanismWater management strategy Collate all qualitative and Outline water efficiency Summarize water audit Produce paper / ppt for mine
quantitative data strategies process and steps for site feedback mechanismcontinuous improvement
Paper 38:text 10/16/09 8:57 AM Page 129
WORLD GOLD CONFERENCE 2009130
COTE, C. and MORAN, C. J., et al. Systems Modelling forWater Management in Mining and Minerals-BowenBasin Coal. Water in Mining (14 to 16 November):11. 2006.
KRACMAN, B. Water for Mining issues of supply. WaterJournal of the Australian Water Association(February). 2007.
MCA. Enduring Value – The Australian Minerals IndustryFramework for Sustainable Development, edited byMCA. Melbourne: Minerals Council of Australia,2004.
MUDD, G.M. From Production to Sustainable Reporting-Towards Quantifying Sustainable Gold Mining. InWorld Gold 2007. Cairns Queensland: The AusIMM.2007.
Newmont The Gold Company Tanami Granites Goldmine.[cited 10/01/09. Available from www.newmont.com/en/operations/australianz/tanami/index.asp. 2009
NORGATE, T.E .and LOVEL, R.R. Sustainable water usein minerals and metal production. AUSimm GreenProcessing: 2006. pp. 133–141.
NTG, Survey. Geoscience Maps in PDF, edited by N. T.Geological. Darwin NT Ringwood, K 2006. The truevalue of water in mining. Waste and EnvironmentalManagement, vol. 17, no. 11, 2005. pp. 31–32.
RINGWOOD, K. The true value of water in mining. Wasteand Environmental Management. vol. 17, no. 11,2006. pp. 31–32.
RINGWOOD, K. and BALFE, M. Strategic watermanagement in the minerals industry: A framework,edited by U. O. Printers. Canberra. 2007.
STURMAN, J., HO, G. and MATHEW, K. Water Auditingand Water Conservation. London: IWA Publishing.2004.
VAN DER MERWE, A. Water Management. Water SouthAfrica vol. 28, no. 3. 2002.
WYGRALAK, A.S., MERNAGH, T.P., HUSTON, D.L.and AHMED, M. Gold Mineral System of the TanamiRegion. Darwin NT: Northern Territory GeologicalSurvey. 2005.
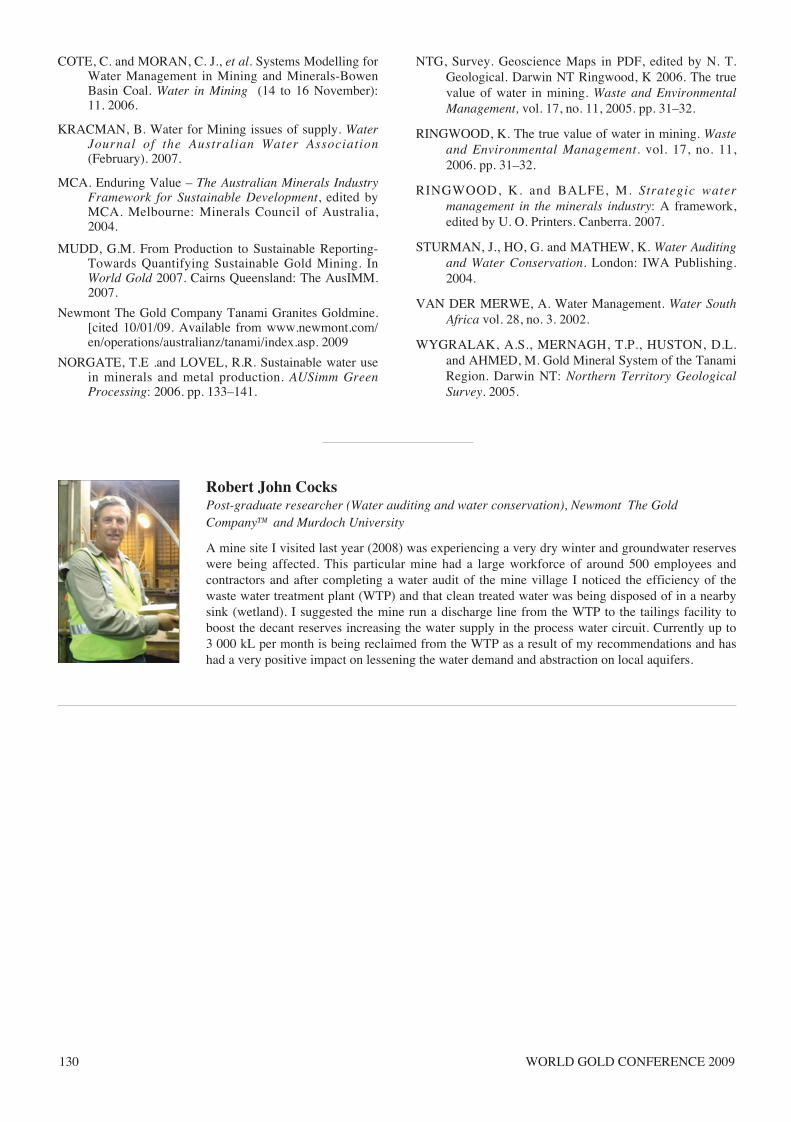
Robert John CocksPost-graduate researcher (Water auditing and water conservation), Newmont The GoldCompany™ and Murdoch University
A mine site I visited last year (2008) was experiencing a very dry winter and groundwater reserveswere being affected. This particular mine had a large workforce of around 500 employees andcontractors and after completing a water audit of the mine village I noticed the efficiency of thewaste water treatment plant (WTP) and that clean treated water was being disposed of in a nearbysink (wetland). I suggested the mine run a discharge line from the WTP to the tailings facility toboost the decant reserves increasing the water supply in the process water circuit. Currently up to3 000 kL per month is being reclaimed from the WTP as a result of my recommendations and hashad a very positive impact on lessening the water demand and abstraction on local aquifers.
Paper 38:text 10/16/09 8:57 AM Page 130