netflix annual report
DESCRIPTION
This is a school project from graduate graphic design program at Academy Art University, spring 2016TRANSCRIPT

5
V
2014 Netflix
annual report

c o n t e n t s
Intro
One. Business
One A. Risk Factors
Two. Properties
Three.
Market for Registrant’s Common
Equity, Related Stockholder Mat-
ters and Issuer Purchases of Equity
Securities
1
3
9
14
16
c o n - -

NETFLIX, INC.
Four. Selected Financial Data
20 46
25
Five. Management’s Discussion and
Analysis of Financial Condition and
Results of Operations
Six. Notes To Consolidated
Financial
c o n t e n t snt t se-
Netflix, Inc. (“Netflix”, “the Company”, “we”,
or “us”) is the world’s leading Internet televi-
sion network with more than 44 million
streaming members in over 40 countries enjoy-
ing more than one billion hours of TV shows and
movies per month, including original series. Our
members can watch as much as they want,
anytime, anywhere, on nearly any Internet-
connected screen. Members can play, pause
and resume watching, all without commercials
or commitments. Additionally, in the United
States (“U.S.”), our members can receive DVDs
delivered quickly to their homes.
Intro

1
We are a pioneer in the Internet delivery of TV
shows and movies, launching our streaming
service in 2007. Since this launch, we have
developed an ecosystem for Internet-connected
devices and have licensed increasing amounts
of content that enable consumers to enjoy TV
shows and movies directly on their TVs, comput-
ers and mobile devices. As a result of these
efforts, we have experienced growing consumer
acceptance of and interest in the delivery of
TV shows and movies directly over the Internet.
Our core strategy is to grow our streaming
subscription business domestically and interna-
tionally. We are continuously improving our
members’ experience—expanding our stream-
ing content, with a focus on programming
an overall mix of content that delights our
customers, enhancing our user interface and
extending our streaming service to even more
Internet-connected devices while staying
within the parameters of our consolidated net
income (loss) and operating segment contribu-
tion profit (loss) targets.
NETFLIX, INC.
We are continuing to grow our streaming
service both domestically and internationally.
We began our international expansion with
Canada in 2010 and have since launched our
service in Latin America and several European
territories. We anticipate a substantial expan-
sion of our service in Europe in late 2014. We
have also expanded our streaming content
offering to include more exclusive and origi-
nal programming, including several Emmy
and Golden Globe nominated original series
in 2013.

2
1.Business
1.

NETFLIX, INC.
3
Business
Prior to July 2011, in the U.S., our streaming
and DVD-by-mail operations were combined and
members could receive both streaming content
and DVDs under a single “hybrid” plan. In July
2011, we separated the combined plans, making
it necessary for members who wish to receive
both DVDs-by-mail and streaming content to
have two separate membership plans.

4
This Annual Report on Form 10-K contains
forward-looking statements within the mean-
ing of the federal securities laws.
These forward-looking statements include, but
are not limited to, statements regarding: our
core strategy; the growth of Internet delivery of
content; the growth in our streaming member-
ships; the decline in our DVD memberships and
the resources allocated to our DVD segment;
the market opportunity for streaming content;
contribution margins; contribution profits
(losses); liquidity; free cash flows; revenues;
net income; legal costs; operating cash flows;
stock price volatility; obtaining additional
capital; our content library and marketing
investments, including investments in original
programming; significance of future contractual
obligations; realization of deferred tax assets;
seasonality; method of content delivery; and
international expansion. These forward-looking
statements can be identified by our use of
words such as “expects”, “will”, “anticipate”,
“may”, “could”, “would”, “should”, “intend”,
“continue”, and derivatives thereof. These for-
ward-looking statements are subject to risks
and uncertainties that could cause actual
results and events to differ.
A detailed discussion of these and other risks
and uncertainties that could cause actual
results and events to differ materially from such
forward-looking statements is included through-
out this filing and particularly in Item 1A: “Risk
Factors” section set forth in this Annual Report
on Form 10-K.
All forward-looking statements included in this
document are based on information available to
us on the date hereof, and we assume no obli-
gation to revise or publicly release any revision
to any such forward-looking statement, except
as may otherwise be required by law.
Forward-
Looking Statements

NETFLIX, INC.
5
6
Business Segments
The Company has three operating segments:
Domestic streaming, International streaming
and Domestic DVD. The Domestic and
International streaming segments derive reve-
nues from monthly membership fees for
services consisting solely of streaming content.
The Domestic DVD segment derives revenues
from monthly membership fees for services con-
sisting solely of DVD-by-mail. For additional
information regarding our segments, including
information about our financial results by
geography, see Note 12 of Item 8, Financial
Statements and Supplementary Data.
Seasonality
The market for entertainment video is intensely
competitive and subject to rapid change. Many
consumers maintain simultaneous relationships
with multiple entertainment video providers
and can easily shift spending from one provider
to another. Our principal competitors vary by
geographic region and include multichannel
video programming distributors providing free
on demand content through authenticated
Internet applications, Internet-based movie and
TV content providers, including both those
that provide legal and illegal (or pirated) enter-
tainment video content, DVD rental outlets
and kiosk services and entertainment video
retail stores.
Competition
Our member growth exhibits a seasonal pattern
that reflects variations when consumers buy
Internet-connected devices and when they tend
to increase their viewing. Our domestic member
growth is generally greatest in our fourth and
first quarters (October through March), slowing
in our second quarter (April through June) and
then accelerating in our third quarter (July
through September). We expect each market in
our international segment to demonstrate more
predictable seasonal patterns as our service
offering in each market becomes more estab-
lished and we have a longer history to assess
such patterns. Additionally, the variable
expenses associated with shipments of DVDs
are highest in the first quarter due to the sea-
sonal nature of DVD usage.
Intellectual Property
We regard our trademarks, service marks, copy-
rights, patents, domain names, trade dress,
trade secrets, proprietary technologies and
similar intellectual property as important to our
success. We use a combination of patent,
trademark, copyright and trade secret laws and
confidential agreements to protect our propri-
etary intellectual property. Our ability to protect
and enforce our intellectual property rights is
subject to certain risks and from time to time we
encounter disputes over rights and obligations
concerning intellectual property. We cannot
provide assurance that we will prevail in any
intellectual property disputes.
NETFLIX, INC.
7
Employees
As of December 31, 2013, we had 2,022 full-
time employees. We also utilize part-time and
temporary employees, primarily in our DVD
fulfillment operations, to respond to the fluctu-
ating demand for DVD shipments. As of
December 31, 2013, we had 305 part-time and
temporary employees. Our employees are
not covered by a collective bargaining agree-
ment, and we consider our relations with our
employees to be good.
Other Information
We were incorporated in Delaware in August
1997 and completed our initial public offering
in May 2002. Our principal executive offices are
located at 100 Winchester Circle, Los Gatos,
California 95032, and our telephone number is
408-540-3700.
We maintain a Web site at www.netflix.com.
The contents of our Web site are not incorpo-
rated in, or otherwise to be regarded as
part of, this Annual Report on Form 10-K. In this
Annual Report on Form 10-K, “Netflix,” the
“Company,” “we,” “us,” “our” and the “regis-
trant” refer to Netflix, Inc. We make available,
free of charge on our web site, access to
our annual report on Form 10-K, our quarterly
reports on Form 10-Q, our current reports on
Form 8-K and amendments to those reports
filed or furnished pursuant to Section 13(a) or
15(d) of the Securities Exchange Act of 1934,
as amended (the “Exchange Act”), as soon
as reasonably practicable after we file or fur-
nish them electronically with the Securities and
Exchange Commission (“SEC”).
Investors and others should note that we
announce material financial information to our
investors using our investor relations website
(http://ir.netflix.com), SEC filings, press releases,
public conference calls and webcasts. We use
these channels as well as social media to
communicate with our members and the public
about our company, our services and other
issues. It is possible that the information we
post on social media could be deemed to
be material information. Therefore, we encour-
age investors, the media, and others interested
in our company to review the information we
post on the social media channels listed on our
investor relations website.

8
Risk Factors
1A.1A.
8

NETFLIX, INC.
9
Risk Factors
9
If any of the following
risks actually occurs,
our business,
financial condition and
results of operations could
be harmed,
In that case,
the trading price of our
common stock could decline,
and you could lose all or
part of your investment,

10
Risks Related to Our Business
If our efforts to attract and retain members
are not successful, our business will be
adversely affected.
We have experienced significant member
growth over the past several years. Our ability
to continue to attract members will depend
in part on our ability to consistently provide
our members with a valuable and quality expe-
rience for selecting and viewing TV shows and
movies. Furthermore, the relative service
levels, content offerings, pricing and related
features of competitors to our service may
adversely impact our ability to attract and
retain members.
Competitors include multichannel video
programming distributors providing free on
demand content through authenticated
Internet applications, Internet-based movie
and TV content providers, including both those
that provide legal and illegal (or pirated)
entertainment video content, DVD rental outlets
and kiosk services and entertainment video
retail stores. If consumers do not perceive our
service offering to be of value, or if we introduce
new or adjust existing features or change the
mix of content in a manner that is not favorably
received by them, we may not be able to attract
and retain members. In addition, many of our
members are rejoining our service or originate
from word-of-mouth advertising from existing
members. If our efforts to satisfy our existing
members are not successful, we may not
be able to attract members, and as a result, our
ability to maintain and/or grow our business
will be adversely affected.
NETFLIX, INC.
11
Members cancel our service for many reasons,
including a perception that they do not use the
service sufficiently, the need to cut household
expenses, availability of content is unsatisfac-
tory, competitive services provide a better value
or experience and customer service issues are
not satisfactorily resolved. We must continually
add new members both to replace members
who cancel and to grow our business beyond
our current member base. If too many of our
members cancel our service, or if we are unable
to attract new members in numbers sufficient to
grow our business, our operating results will
be adversely affected.
If we are unable to successfully compete with
current and new competitors in both retaining
our existing members and attracting new
members, our business will be adversely
affected. Further, if excessive numbers of mem-
bers cancel our service, we may be required
to incur significantly higher marketing expendi-
tures than we currently anticipate to replace
these members with new members.
If we are unable to compete effectively, our
business will be adversely affected.
The market for entertainment video is intensely
competitive and subject to rapid change. New
technologies and evolving business models for
delivery of entertainment video continue to
develop at a fast pace. The growth of Internet-
connected devices, including TVs, computers
and mobile devices has increased the consumer
acceptance of Internet delivery of entertainment
video. Through these new and existing distribu-
tion channels, consumers are afforded various

12
means for consuming entertainment video.
The various economic models underlying these
differing means of entertainment video
delivery include subscription, transactional,
ad-supported and piracy-based models.
All of these have the potential to capture mean-
ingful segments of the entertainment video
market. Several competitors have longer oper-
ating histories, large customer bases, strong
brand recognition and significant financial, mar-
keting and other resources. They may secure
better terms from suppliers, adopt more
aggressive pricing and devote more resources
to technology, fulfillment, and marketing. New
entrants may enter the market with unique ser-
vice offerings or approaches to providing
entertainment video and other companies also
may enter into business combinations or alli-
ances that strengthen their competitive
positions. If we are unable to successfully or
profitably compete with current and new com-
petitors, programs and technologies, our
business will be adversely affected, and we may
not be able to increase or maintain market
share, revenues or profitability.
The long-term and fixed cost nature of our
content licenses may limit our operating flexi-
bility and could adversely affect our liquidity
and results of operation.
In connection with obtaining streaming content,
we typically enter into multi-year licenses with
studios and other content providers, the pay-
ment terms of which are not tied to member
usage or the size of our member base (“fixed
cost”) but which may be tied to such factors as
titles licensed and/or theatrical exhibition
receipts. Such commitments are included in the
Contractual Obligations section of Item 7
Management’s Discussion and Analysis of
Financial Condition and Results of Operations.
Given the multiple-year duration and largely
fixed cost nature of content licenses, if member
acquisition and retention do not meet our
expectations, our margins may be adversely
impacted. Payment terms for streaming licenses,
especially programming that is initially available
in the applicable territory on our service (“origi-
nal programming”) or that is considered output
content, will typically require more up-front
cash payments than other licensing agreements.
To the extent member and/or revenue growth
do not meet our expectations, our liquidity
and results of operations could be adversely
affected as a result of content licensing
commitments and accelerated payment require-
ments of certain licenses. In addition, the
long-term and fixed cost nature of our content
licenses may limit our flexibility in planning for,
or reacting to changes in our business and
the market segments in which we operate.
As we expand internation-ally, we must license content in advance of entering into a new geographical market. If we license content that is not favorably
received by consumers in the applicable
territory, acquisition and retention may be
adversely impacted and given the long-term
and fixed cost nature of our content licenses,
we may not be able to adjust our content
offering quickly and our results of operation
may be adversely impacted.

NETFLIX, INC.
13
If we are not able to manage change
and growth, our business could be
adversely affected.
We are expanding our operations internationally,
scaling our streaming service to effectively and
reliably handle anticipated growth in both
members and features related to our service, as
well as continuing to operate our DVD service
within the U.S. As we expand internationally, we
are managing our business to address varied
content offerings, consumer customs and prac-
tices, in particular those dealing with
e-commerce and Internet video, as well as dif-
fering legal and regulatory environments. As we
scale our streaming service, we are developing
technology and utilizing third-party Internet-
based or “cloud” computing services. If we are
not able to manage the growing complexity of
our business, including improving, refining or
revising our systems and operational practices
related to our streaming operations, our busi-
ness may be adversely affected.
If our efforts to build strong brand identity and
improve member satisfaction and loyalty are
not successful, we may not be able to attract
or retain members, and our operating results
may be adversely affected.
We must continue to build and maintain
strong brand identity. We believe that strong
brand identity will be important in attracting
and retaining members who have a number of
choices from which to obtain entertainment
video. To build a strong brand we believe we
must continue to offer content and service
features that our members value and enjoy.

14
2.Properties.
250,000ft²Los Gatos, CaliforniaGlobal streaming corporate office, general and
administrative, marketing and technology and
development
Lease Expiration Date: August 2018
23,000 ft²Santa Clara, CaliforniaGlobal streaming customer service center
Lease Expiration Date: October 2016
57,000ft²Fremont, CaliforniaDomestic DVD corporate office, general and
administrative and technology and development
Lease Expiration Date: March, 2019
2.

NETFLIX, INC.
15
79,000ft²Beverly Hills, CaliforniaGlobal content acquisition, marketing and gen-
eral and administrative
Lease Expiration Date: Augest, 2018
90,000 ft²Columbus, OhioDomestic DVD receiving and storage cen-
ter, processing and shipping center for the
Columbus area
Lease Expiration Date: August 2018
49,000ft²Hillsboro, OregonDomestic streaming and Domestic DVD cus-
tomer service center
Lease Expiration Date: April 2016
We do not own any real estate. The following
table sets forth the location, approximate
square footage, lease expiration and the pri-
mary use of each of our principal properties:
We operate a nationwide network of distri-
bution centers for the U.S. These fulfillment
centers are under lease agreements that leased
third-party facility in Santa Clara, California.
In the third quarter of 2013, the Company
entered into lease square feet, not reflected in
the table above, with 124 month lease 2015.
We believe that our current space will be ade-
quate or that additional space will be available
on commercially reasonable terms for the fore-
seeable future.

16
Market for Registrant’s
Common Equity, Related
Stockholder Matters and
Issuer Purchases of
Equity Securities
3.
Market Information
Our common stock is traded on the NASDAQ
Global Select Market under the symbol “NFLX”.
The following table sets forth the intraday high
and low sales prices per share of our common
stock for the periods indicated, as reported by
the NASDAQ Global Select Market.
3

NETFLIX, INC.
17
3.3Holders
As of January 30, 2014, there were approximately 215 stock holders of
record of our common stock, although there is a significantly larger num-
ber of beneficial owners of our common stock.
Dividends
We have not declared or paid any cash dividends, and we have no pres-
ent intention of paying any cash dividends in the foreseeable future.
0
100
200
300
400
$
High
Low
High
Low
4th
QTR
3rd2ed1st
2013
2012

18
Stock Performance Graph
$1,400.00
$1,200.00
$1,000.00
Do
llars
$800.00
$600.00
$400.00
$200.00
$0.00
Netflix
NASDAQ Composite Index
S&P North American Technology Internet Index
S&P 500 Index
12/31/0912/31/08 12/31/10 12/31/11 12/31/12 12/31/13

NETFLIX, INC.
19
Notwithstanding any statement to the contrary
in any of our previous or future filings with the
Securities and Exchange Commission, the
following information relating to the price per-
formance of our common stock shall not be
deemed “filed” with the Commission or “solic-
iting material” under the Securities Exchange
Act of 1934 and shall not be incorporated by
reference into any such filings.
The previous graph compares, for the five
year period ended December 31, 2013, the
total cumulative stockholder return on the
Company’s common stock with the total cumu-
lative return of the NASDAQ Composite Index,
the S&P 500 Index and the S&P North American
Technology Internet Index.
The Company was added to the S&P 500
Index on December 18, 2010. Measurement
points are the last trading day of each of the
Company’s fiscal years ended December 31,
2008, December 31, 2009, December 31, 2010,
December 31, 2011, December 31, 2012
and December 31, 2013.
Total cumulative stockholder return assumes
$100 invested at the beginning of the period
in the Company’s common stock, the stocks
represented in the NASDAQ Composite Index,
the stocks represented in the S&P 500 Index
and the stocks represented in the S&P North
American Technology Internet Index, respectively,
and reinvestment of any dividends.
The S&P North American Technology Internet
Index is a modified-capitalization weighted
index of stocks representing the Internet
industry, including Internet content and access
providers, Internet software and services
companies and e-commerce companies.
Historical stock price performance should not
be relied upon as an indication of future stock
price performance.

20
4.Selected Financial Data
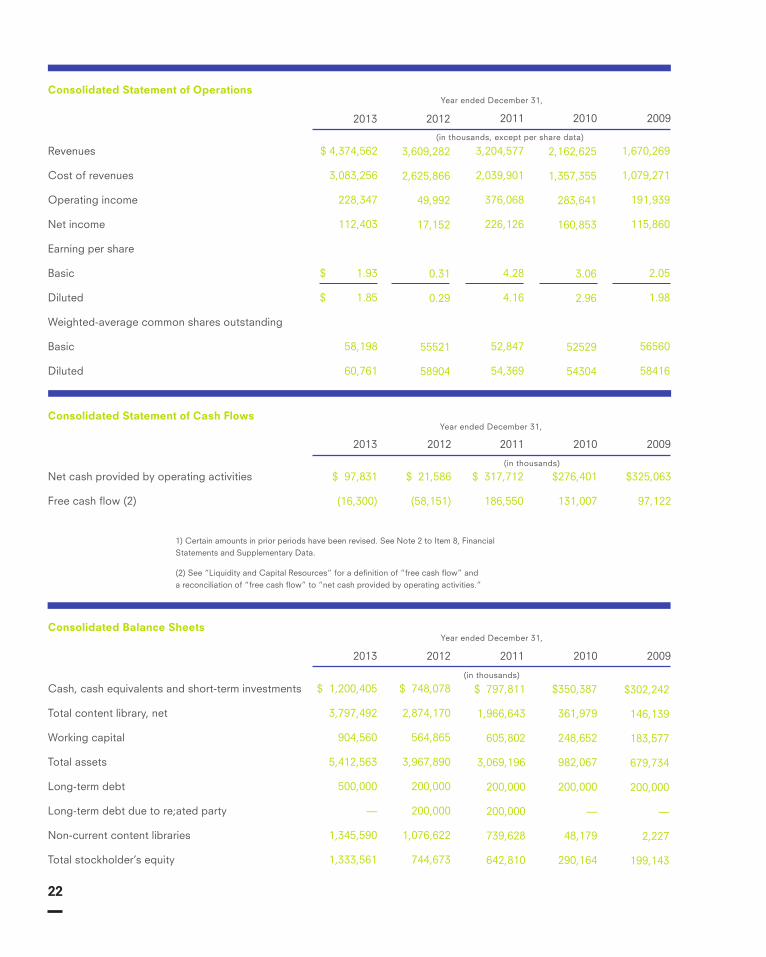
The following selected consolidated financial
data is not necessarily indicative of results of
future operations and should be read in conjunc-
tion with Item 7, Management’s Discussion and
Analysis of Financial Condition and Results of
Operations and Item 8, Financial Statements
and Supplementary Data .
4
Consolidated Statements of Operations
0 1000000 2000000 3000000 4000000 5000000
Cost of revenuesRevenues
09'
10'
11'
12'
13'

NETFLIX, INC.
21
Consolidated Statements of Cash Flows
0
50000
100000
150000
200000
250000
300000
350000
09’10’11’12’13’
Net cash provided by operating activities
Free Cash Flow
0 50000 100000 150000 200000 250000 300000 350000 400000
Net income Operating Income
09'
10'
11'
12'
13'
22
Consolidated Statement of Operations
Consolidated Statement of Cash Flows
Consolidated Balance Sheets
Cash, cash equivalents and short-term investments
Total content library, net
Working capital
Total assets
Long-term debt
Long-term debt due to re;ated party
Non-current content libraries
Total stockholder’s equity
Revenues
Cost of revenues
Operating income
Net income
Earning per share
Basic
Diluted
Weighted-average common shares outstanding
Basic
Diluted
$ 4,374,562
3,083,256
228,347
112,403
$ 1.93
$ 1.85
58,198
60,761
3,609,282
2,625,866
49,992
17,152
0.31
0.29
55521
58904
3,204,577
2,039,901
376,068
226,126
4.28
4.16
52,847
54,369
2,162,625
1,357,355
283,641
160,853
3.06
2.96
52529
54304
1,670,269
1,079,271
191,939
115,860
2.05
1.98
56560
58416
2013
2013
2013
2012
2012
2012
2011
2011
2011
2010
2010
2010
2009
2009
2009
Net cash provided by operating activities
Free cash flow (2)
$ 97,831
(16,300)
$ 1,200,405
3,797,492
904,560
5,412,563
500,000
—
1,345,590
1,333,561
$ 748,078
2,874,170
564,865
3,967,890
200,000
200,000
1,076,622
744,673
$ 797,811
1,966,643
605,802
3,069,196
200,000
200,000
739,628
642,810
$350,387
361,979
248,652
982,067
200,000
—
48,179
290,164
$302,242
146,139
183,577
679,734
200,000
—
2,227
199,143
$ 21,586
(58,151)
$ 317,712
186,550
$276,401
131,007
$325,063
97,122
Year ended December 31,
Year ended December 31,
Year ended December 31,
(in thousands, except per share data)
(in thousands)
(in thousands)
1) Certain amounts in prior periods have been revised. See Note 2 to Item 8, Financial Statements and Supplementary Data.
(2) See “Liquidity and Capital Resources” for a definition of “free cash flow” and a reconciliation of “free cash flow” to “net cash provided by operating activities.”

NETFLIX, INC.
23

24
Management’s
Discussion and Analysis
of Financial Condition
and Results of Operations55

NETFLIX, INC.
25
Management’s
Discussion and Analysis
of Financial Condition
and Results of Operations
We are the world’s leading
Internet television network
with more than 44 million
streaming members in over 40
countries enjoying more than
one billion hours of TV shows
and movies per month, includ-
ing original series.
Our members can watch as much as they want,
anytime, anywhere, on nearly any Internet-
connected screen. Members can play, pause
and resume watching, all without commercials
or commitments. Additionally, in the United
States (“U.S.”), our members can receive DVDs
delivered quickly to their homes.
We are a pioneer in the Internet delivery of TV
shows and movies, launching our streaming
service in 2007. Since this launch, we have
developed an ecosystem for Internet-connected
devices and have licensed increasing amounts
of content that enable consumers to enjoy
TV shows and movies directly on their TVs, com-
puters and mobile devices. As a result of these
efforts, we have experienced growing consumer
acceptance of and interest in the delivery of
TV shows and movies directly over the Internet.
Historically, our acquisition of new members
has been seasonal with the first and fourth
quarters representing our strongest net
member additions and our second quarter rep-
resenting the lowest net member additions in
a calendar year.
Our core strategy is to grow our streaming
subscription business domestically and interna-
tionally. We are continuously improving our
members’ experience-expanding our streaming
content, with a focus on programming an
overall mix of content that delights our custom-
ers, enhancing our user interface and extending
our streaming service to even more Internet-
connected devices while staying within the
parameters of our consolidated net income
(loss) and operating segment contribution
profit (loss) targets.

26
Results of Operations
Consolidated revenues for 2013 increased as
compared to prior years due to growth in inter-
national and domestic streaming memberships.
Operating income and net income increased
as compared to prior year by $178.4 million and
$95.3 million, respectively, due to the increase
in revenue, partially offset by an increase in the
cost of revenues due to continued investments
in existing and new streaming content.
Free cash flow was $128.7 million lower than
net income for the year ended December 31,
2013. The excess of net income over free cash
flow has increased from $75.3 million and $39.6
million in the years ended December 31, 2012
and 2011, respectively. The increases are
primarily the result of increased investments in
original content or content that is licensed in an
earlier window through an output arrangement
which will typically, depending upon the terms,
require more up-front cash payments relative to
the expense.
NETFLIX, INC.
27
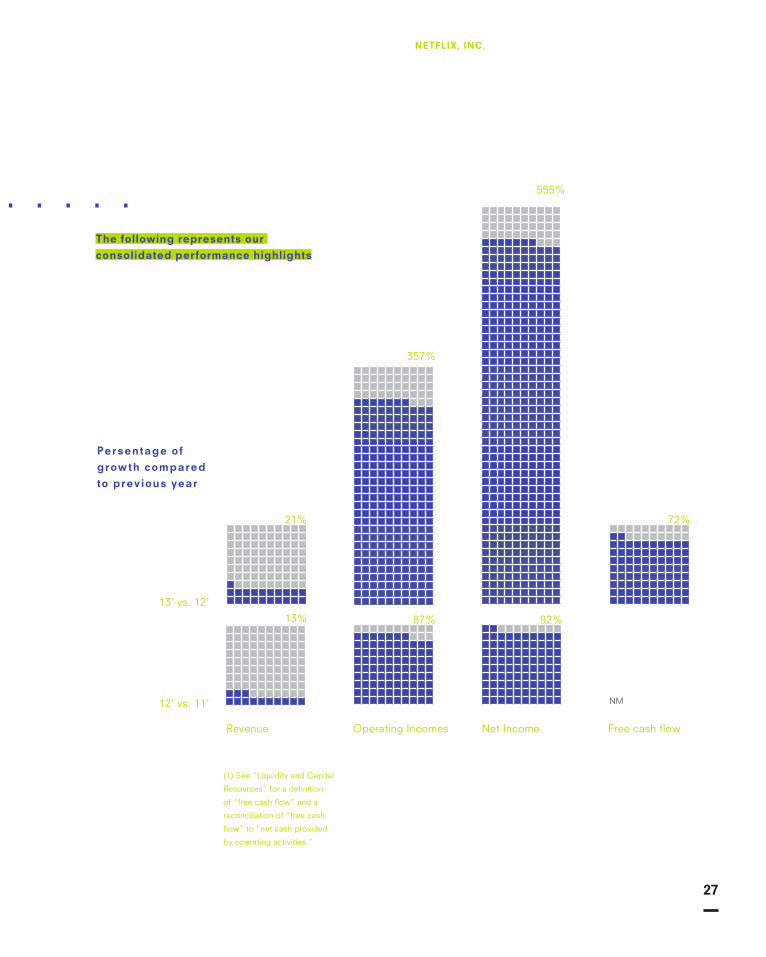
The following represents our
consolidated performance highlights
Persentage of
growth compared
to previous year
13’ vs. 12’
21%
357%
555%
72%
92%87%13%
Revenue Operating Incomes Free cash flow
NM
Net Income
12’ vs. 11’
(1) See “Liquidity and Capital
Resources” for a definition
of “free cash flow” and a
reconciliation of “free cash
flow” to “net cash provided
by operating activities.”

28
The fol lowing represents the key
elements to our segment results of
operat ions
We define contribution profit as revenues less
cost of revenues and marketing expenses.
We believe this is an important measure of
our operating segment performance as it rep-
resents each segment’s performance before
discrete global corporate costs.
For the Domestic and International streaming
segments, content licensing expenses, which
include the amortization of the streaming con-
tent library and other expenses associated with
the licensing of streaming content, represent
the vast majority of cost of revenues.
Streaming content rights are generally specific
to a geographic region and accordingly our
international expansion will require us to obtain
additional streaming content licenses to sup-
port new international markets. Other cost of
revenues such as content delivery expenses,
customer service and payment processing
fees are lower as a percentage of total cost
of revenues as compared to content licensing
expenses. We utilize both our own and third-
party content delivery networks to help us
efficiently stream a high volume of content to
our members over the Internet.
Content delivery expenses, therefore, also
include equipment costs related to our stream-
ing content delivery network (“Open Connect”)
and all third-party costs associated with deliv-
ering streaming content over the Internet. Cost
of revenues in the Domestic DVD segment
consists primarily of content delivery, expenses
related to the acquisition of content, including
amortization of DVD content library and revenue
sharing expenses, and other expenses asso-
ciated with our DVD processing and customer
service centers. Content delivery expenses for
the Domestic DVD segment consist of the
postage costs to mail DVDs to and from our
paying members and the packaging and label
costs for the mailers.
For the Domestic and International streaming
segments, marketing expenses consist primarily
of advertising expenses and payments made
to our affiliates and consumer electronics part-
ners. Advertising expenses include promotional
activities such as television and online adver-
tising. Payments to our affiliates and device
partners include fixed fee and /or revenue shar-
ing payments.
Marketing costs are primarily incurred by our
Domestic and International streaming segments
given our focus on building consumer aware-
ness of the streaming offerings. Marketing
expenses incurred by our International stream-
ing segment have been significant and will
fluctuate dependent upon the number of
International territories in which our streaming
service is offered and the timing of the launch
of new territories. Marketing costs are
immaterial for the Domestic DVD segment.

NETFLIX, INC.
29
We have demonstrated our abil-
ity to grow contribution margin
as evidenced by the increase in
contribution margin from 12%
when we first began separately
reporting Domestic streaming
results in the fourth quarter of
2011 to 23% in the fourth quarter
of 2013.
As a result of our focus on growing the stream-
ing segments, contribution margins for the
Domestic and International streaming segments
are lower than for our Domestic DVD segment.
Investments in content and marketing associ-
ated with the International streaming segment
will continue to fluctuate dependent upon the
number of International territories in which our
streaming service is offered and the timing of
the launch of new territories.
As we grow our streaming segments, we con-
tinue to shift spending away from the Domestic
DVD segment to invest more in streaming con-
tent and marketing for our streaming services.

30
2013 Segment Results
Domestic Streaming
Segment
Members
Net additions
Members at end of period
Paid members at end of period
Contribution profit
Revenues
Cost of revenues
Marketing
Contribution profit
Contribution Margin
2013 2012
6,274
33,420
31,712
$ 2,751,375
1,849,154
279,454
622,767
23%
5,475
27,146
25,471
2,184,868
1,558,864
256,995
369,009
17%
As of/Year ended December 31,
(in thousands)
15%
Change
2012 vs. 2013
23%
25%
26%
19%
9%
69%
$566.5 million increase
in our domestic
streaming revenues

NETFLIX, INC.
31
In the Domestic streaming segment, we
derive revenues from monthly membership fees
for services consisting solely of streaming con-
tent offered through a membership plan. Our
Domestic streaming membership plans are
priced primarily at $7.99 per month. In 2013, we
introduced membership plans priced at $11.99
per month under which members can stream
content on up to four devices concurrently.
New member additions and revenue related
to $11.99 membership plans were not material
for the year ended December 31, 2013. The
$566.5 million increase in our domestic stream-
ing revenues was due to the 26% growth in the
average number of paid memberships.
The $290.3 million increase in domestic stream-
ing cost of revenues was primarily due to the
$226.3 million increase in content licensing
expenses resulting from continued investments
in existing and new streaming content including
more exclusive and original programming. In
addition, content delivery expenses increased
by $31.0 million and other costs, such as pay-
ment processing fees and customer service call
centers, increased $33.0 million due to our
growing member base.
Marketing expenses increased
$22.5 million primarily due to an
increase in advertising partially
offset by a decrease in pay-
ments to affiliates in the U.S.
Our Domestic streaming segment had a contri-
bution margin of 23% for the year ended
December 31, 2013, which increased as com-
pared to the contribution margin of 17% for the
year ended December 31, 2012, as a result of
growing memberships and revenue faster than
content and marketing spending.
32
International Streaming
Segment
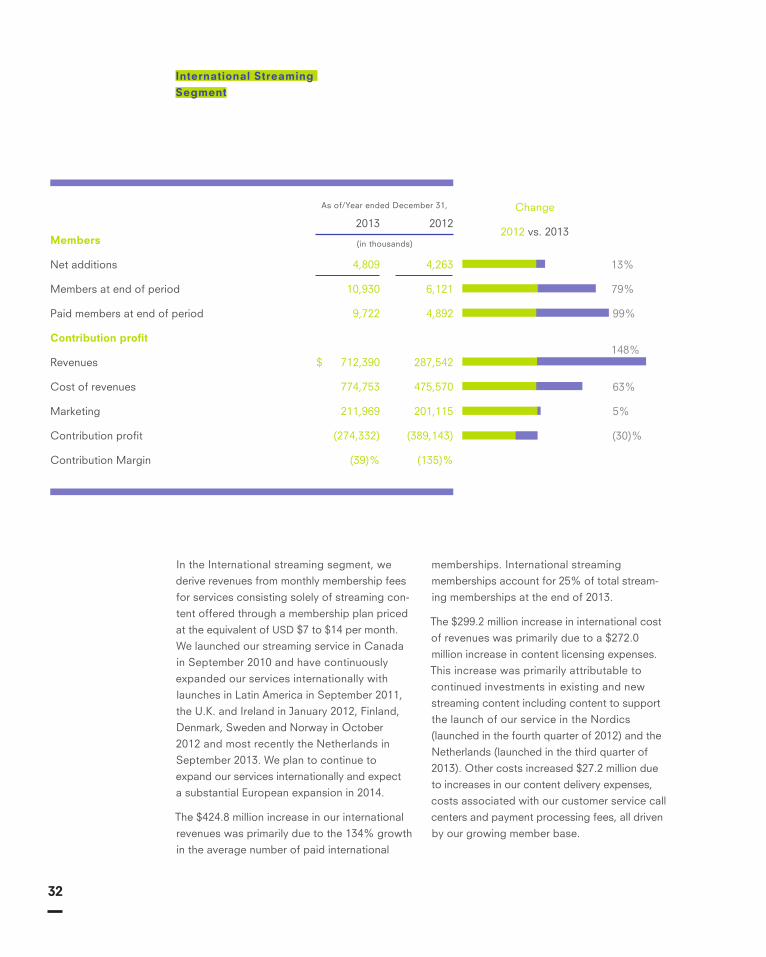
In the International streaming segment, we
derive revenues from monthly membership fees
for services consisting solely of streaming con-
tent offered through a membership plan priced
at the equivalent of USD $7 to $14 per month.
We launched our streaming service in Canada
in September 2010 and have continuously
expanded our services internationally with
launches in Latin America in September 2011,
the U.K. and Ireland in January 2012, Finland,
Denmark, Sweden and Norway in October
2012 and most recently the Netherlands in
September 2013. We plan to continue to
expand our services internationally and expect
a substantial European expansion in 2014.
The $424.8 million increase in our international
revenues was primarily due to the 134% growth
in the average number of paid international
memberships. International streaming
memberships account for 25% of total stream-
ing memberships at the end of 2013.
The $299.2 million increase in international cost
of revenues was primarily due to a $272.0
million increase in content licensing expenses.
This increase was primarily attributable to
continued investments in existing and new
streaming content including content to support
the launch of our service in the Nordics
(launched in the fourth quarter of 2012) and the
Netherlands (launched in the third quarter of
2013). Other costs increased $27.2 million due
to increases in our content delivery expenses,
costs associated with our customer service call
centers and payment processing fees, all driven
by our growing member base.
Members
Net additions
Members at end of period
Paid members at end of period
Contribution profit
Revenues
Cost of revenues
Marketing
Contribution profit
Contribution Margin
2013 2012
4,809
10,930
9,722
$ 712,390
774,753
211,969
(274,332)
(39)%
4,263
6,121
4,892
287,542
475,570
201,115
(389,143)
(135)%
As of/Year ended December 31,
(in thousands)
13%
Change
2012 vs. 2013
79%
99%
63%
5%
(30)%
148%

NETFLIX, INC.
33
International marketing
expenses for the year ended
December 31, 2013 increased
$10.9 million as compared
to the year ended December 31,
2012 due to our expansion in the
Nordics and the Netherlands off-
set partially by a decrease in
spending in other territories.
International contribution losses improved
$114.8 million year over year, as a result of
growing memberships and revenues faster
than content and marketing spending. Our
International streaming segment does not
benefit from the established member base that
exists for the Domestic segments. As a result
of having to build a member base from zero,
investments in streaming content and marke-
ting programs for our International segment
particular as new territories are launched. The
contribution losses for our International seg-
ment have been significant due to investments
in streaming content and marketing programs
to drive membership growth and viewing in our
international markets.
34
$226.1
million decrease in our domes-
tic DVD revenues was due to a
20% decrease in the average
number of paid memberships

NETFLIX, INC.
35
Domestic DVD Segment
In the Domestic DVD segment, we derive reve-
nues from our DVD-by-mail membership
services. The price per plan for DVD-by-mail
varies from $4.99 to $43.99 per month accord-
ing to the plan chosen by the member.
DVD-by-mail plans differ by the number of DVDs
that a member may have out at any given point.
Members electing access to high definition Blu-
ray discs in addition to standard definition DVDs
pay a surcharge ranging from $2 to $4 per
month for our most popular plans.
The $226.1 million decrease in our domestic
DVD revenues was due to a 20% decrease in
the average number of paid memberships.
The $132.1 million decrease in domestic DVD
cost of revenues was primarily due to a $63.2
million decrease in content acquisition
expenses and a $47.7 million decrease in con-
tent delivery expenses resulting from a 21%
decrease in the number of DVDs mailed to pay-
ing members. The decrease in shipments was
driven by a decline in the number of DVD
memberships. Other costs, primarily those
associated with content processing and cus-
tomer service center expenses, decreased
$21.2 million primarily due to a decrease in hub
operation expenses resulting from the decline
in DVD shipments.
Our Domestic DVD segment had a contribution
margin of 48% for the year ended December
31, 2013, and was relatively flat as compared to
the year ended December 31, 2012.
Members
Net losses
Members at end of period
Paid members at end of period
Contribution profit
Revenues
Cost of revenues
Marketing
Contribution profit
Contribution Margin
2013 2012
(1,294)
6,930
6,765
$ 910,797
459,349
12,466
438,982
48%
(2,941)
8,224
8,049
2,184,868
1,558,864
256,995
369,009
47%
As of/Year ended December 31,
(in thousands)
(56)%
Change
2012 vs. 2013
(16)%
(16)%
(20)%
(22)%
71%
(18)%

3636

NETFLIX, INC.
37
Liquidity and Capital Resources
Cash, cash equivalents and short-term invest-
ments were $1,200.4 million and $748.1 million
at December 31, 2013 and 2012, respectively.
In February 2013, we issued $500.0 million
aggregate principal amount of 5.375% Senior
Notes due 2021 (the “5.375% Notes”). We
used approximately $224.5 million of the net
proceeds to redeem our outstanding 8.50%
Notes, including a $19.4 million make-whole
premium and $5.1 million of accrued and unpaid
interest. In November 2011, we issued $200.0
million of Senior Convertible Notes and raised
an additional $200.0 million through a public
offering of common stock. The Senior
Convertible Notes consisted of $200.0 million
aggregate principal amount due on December
1, 2018 and did not bear interest. Our primary
uses of cash include licensing of content, con-
tent delivery, marketing programs and payroll.
We expect to continue to make significant
investments to license streaming content both
domestically and internationally and will con-
tinue to expand our investments in original
content. In 2014, we expect to substantially
increase our investment in original content
(though still representing less than 10% of our
overall global content expense). Original con-
tent or content that is licensed in an earlier
window through an output arrangement will
typically, depending upon the terms, require
more up-front cash payments relative to the
expense and, therefore, future investments
could impact our liquidity and result in a use
of operating cash.
We expect to significantly increase our invest-
ments in international expansion, including
substantial expansion in Europe in 2014, and in
original content. As a result, and to take advan-
tage of the current favorable interest rate
environment, we plan to obtain approximately
$400 million in long term debt in the first quarter
of 2014. Our ability to obtain this, or any addi-
tional financing that we may choose to or need
to obtain, will depend on, among other things,
our development efforts, business plans, oper-
ating performance and the condition of the
capital markets at the time we seek financing.
We may not be able to obtain such financing on
terms acceptable to us or at all. If we raise
additional funds through the issuance of equity
or debt securities, those securities may have
rights, preferences or privileges senior to the
rights of our common stock, and our stockhold-
ers may experience dilution.
IN NOVEMBER 2011,
WE ISSUED
\$200,000,000 OF SENIOR CONVERTIBLE NOTES AND
RAISED AN ADDITIONAL
$200.000,000 MILLION THROUGH A PUBLIC OFFERING
OF COMMON STOCK.

38
FREE CASH FLOW
We define free cash flow as cash provided by
operating and investing activities excluding the
non-operational cash flows from purchases,
maturities and sales of short-term investments.
We believe free cash flow is an important liquid-
ity metric because it measures, during a given
period, the amount of cash generated that
is available to repay debt obligations, make
investments and for certain other activities.
Free cash flow is considered a non-GAAP finan-
cial measure and should not be considered in
isolation of, or as a substitute for, net income,
operating income, cash flow provided by
operating activities, or any other measure of
financial performance or liquidity presented
in accordance with GAAP.
In assessing liquidity in relation to our results
of operations, we compare free cash flow to
net income, noting that the three major recur-
ring differences are excess content payments
over expenses, non-cash stock-based com-
pensation expense and other working capital
differences which include deferred revenue,
taxes and semi-annual interest payments on
outstanding debt. Our receivables from mem-
bers settle quickly and deferred revenue is a
source of cash flow. For streaming content, we
typically enter into multi-year licenses with vari-
ous content providers that may result in an
increase in content library and a corresponding
increase in liabilities on the Consolidated
Balance Sheets. The payment terms for these
license fees may extend over the term of the
license agreements, which typically range from
six months to five years.
Net additions
Members at end of period
Paid members at end of period
Non-GAAP free cash flow reconciliation
Net cash provided by operating activities
Acquisition of DVD content libary
Purchase of property and equipment
Other assets
Non-GAAP free cash flow
2013 2012
$ 97,831
(255,968)
476,264
97,831
(65,927)
(54,143)
5,939
$ (16,300)
21,586
(244,740)
5,589
21,586
(48,275)
(40,278)
8,816
(58,151)
Year ended December 31,
(in thousands)

NETFLIX, INC.
39
Cash provided by operating activities increa
sed $76.2 million, primarily due to an increase
in revenues of $765.3 million or 21%. This
increase was partially offset by increased pay-
ments for content acquisition and licensing
other than DVD library of $502.6 million or 24%
as well as increased payments associated with
higher operating expenses. Operating activities
were further impacted by increased payments
for streaming content delivery, payment pro-
cessing fees and customer service call centers
due to our growing member base.
Cash used in investing activities increased
$11.2 million, primarily due to an increase of
$17.7 million in the acquisition of DVD content
library and a $13.9 million increase in the
purchase of property and equipment primarily
due to investments in our streaming content
delivery network. Cash outflow was offset by
a $23.2 million increase in the proceeds from
sales and maturities of short-term invest-
ments, net of purchases.
Cash provided by financing activities increased
$470.7 million. In the first quarter of 2013, we
issued $500.0 million of 5.375% Notes, with net
proceeds of $490.6 million after payment of
debt issuance costs. This was offset by the
$219.4 million redemption of our 8.50% Senior
Notes. Financing activities were further
impacted by $197.6 million of increased cash
flows provided by stock option exercises.
Free cash flow was $128.7 million lower than
net income for the year ended December 31,
2013 primarily due to $230.4 million of content
cash payments over expense, $29.4 million
of tax impacts and $13.4 million non-favorable
other working capital differences. This was
partially offset by $73.1 million non-cash stock-
based compensation expense, $46.3 million in
deferred revenue and $25.1 million loss on debt
extinguishment, the cash impact of which is a
financing activity and therefore not included in
free cash flow.
Free cash flow was $75.3 million lower than net
income for the year ended December 31, 2012
primarily due to $145.2 million of content cash
$502,600,000
increased payments for content
acquisition and licensing other than
DVD library

40
payments over expense and $4.0 million non-
favorable other working capital differences
partially offset by $73.9 million non-cash stock-
based compensation expense.
Cash provided by operating activities decr-
eased $296.1 million, primarily due to increased
payments for content acquisition and licensing
other than DVD library of $779.5 million or
59%, partially offset by an increase in subscrip-
tion revenues of $404.7 million or 13%.
Cash used in investing activities decreased
$21.1 million primarily due a $36.9 million
decrease in the acquisition of DVD content
library and a $9.4 million decrease in the pur-
chase of property and equipment due to a
decrease in purchases of automation equip-
ment for our various shipping centers. These
decreases were partially offset by a $30.4
million increase in the purchases, net of
proceeds from sales and maturities, of short-
term investments.
Cash provided by financing activities for the
year ended December 31, 2012 was $5.6 million
primarily related to stock option activity. Cash
provided by financing activities for the year
ended December 31, 2011 was $261.7 million,
which consisted primarily of $199.9 million of
proceeds from the public offering of common
stock and $198.1 million of proceeds from
the issuance of debt. These proceeds were
offset by $199.7 million of stock repurchases.
Free cash flow was $39.6 million lower than net
income for the year ended December 31, 2011
primarily due to $147.7 million of content cash
payments over expense partially offset by $61.6
million non-cash stock-based compensation
expense and $46.5 million favorable other work-
ing capital differences.
Cash used in investing activi-
ties decreased $21.1 million
primarily due a $36.9 million
decrease in the acquisition of
DVD content library

NETFLIX, INC.
41
1
At December 31, 2013, the Company had $7.3
billion of obligations comprised of $1.8 billion
included in “Current content liabilities” and
$1.3 billion of “Non-current content liabilities”
on the Consolidated Balance Sheets and $4.2
billion of obligations that are not reflected on
the Consolidated Balance Sheet.
At December 31, 2012, the Company had $5.6
billion of obligations comprised of $1.3 billion
included in “Current content liabilities” and $1.1
billion of “Non-current content liabilities” on the
Consolidated Balance Sheets and $3.2 billion of
obligations that are not reflected on the
Consolidated Balance Sheet.
CONTR ACTUAL OBLIGATIONS
For the purpose of this table, contractual obli-
gations for purchases of goods or services are
defined as agreements that are enforceable and
legally binding and that specify all significant
terms, including: fixed or minimum quantities to
be purchased; fixed, minimum or variable price
provisions; and the approximate timing of
the transaction.
The expected timing of payment of the obliga-
tions discussed below is estimated based on
information available to us as of December 31,
A streaming content obligation is incurred at
the time we sign a license agreement to obtain
future titles. Once a title becomes available,
a content liability is generally recorded on the
Consolidated Balance Sheet. Certain agree-
ments include the obligation to license rights
for unknown future titles, the ultimate quantity
and / or fees for which are not yet determinable
as of the reporting date. Because the amount is
not reasonably estimable, we do not include
any estimated obligation for these future titles
beyond the known minimum amount. However,
the unknown obligations are expected to be
significant and the expected timing of payments
could range primarily from one year to more
than five years.
Consolidated Statement of Operations
Payment due by Period
Streaming content obligations(1)
5.375% Notes(2)
Lease obligations(3)
Other purchase obligations(4)
Total
$ 7,252,161
699,323
201,422
214,838
$ 8,367,744
2,972,325
26,875
25,101
113,134
$ 3,137,435
3,266,907
53,750
53,710
101,704
3,475,071
929,645
53,750
37,432
—
1,020,827
83,284
564,948
86,179
—
734,411
Total 1 year 1-3 years 3-5 years 5 yearsLess than More than
2013. Timing of payments and actual amounts
paid may be different depending on the time
of receipt of goods or services or changes to
agreed-upon amounts for some obligations.
The following table summarizes our contractual
obligations at December 31, 2013:

42
2
Long-term debt obligations include our 5.375%
Notes consisting of principal and interest
payments. See Note 5 of Item 8, Financial
Statements and Supplementary Data for
further details.
3
Lease obligations include lease financing
obligations of $12.1 million related to our cur-
rent Los Gatos, California headquarters for
which we are the deemed owner for accounting
purposes, commitments of $68.1 million for
facilities under non-cancelable operating leases
with various expiration dates through 2019, and
commitments of $121.2 million for facilities lease
agreements entered into in the third quarter of
2013 to expand our Los Gatos headquarters to
a nearby site.
As of December 31, 2013, we had gross unrec-
ognized tax benefits of $68.2 million and an
additional $3.9 million for gross interest and
penalties classified as “Other non-current liabil-
ities” on the Consolidated Balance Sheets. At
this time, we are not able to make a reasonably
reliable estimate of the timing of payments
in individual years due to uncertainties in the
timing of tax audit outcomes; therefore, such
amounts are not included in the above contrac-
tual obligation table.
At the time we entered into these lease agree-
ments we simultaneously terminated the
previous agreement signed in the fourth quarter
of 2012. The 124 month lease terms for the
new leases will commence after the construc-
tion of the buildings is complete.
4
Other purchase obligations include all other
non-cancelable contractual obligations. These
contracts are primarily related to streaming
content delivery, DVD content acquisition,
and miscellaneous open purchase orders for
which we have not received the related services
or goods.
$68,200,000gross unrecognized
tax benefits
NETFLIX, INC.
43
INCOME TA XES
We record a provision for income taxes for the
anticipated tax consequences of our reported
results of operations using the asset and liability
method. Deferred income taxes are recognized
by applying enacted statutory tax rates applica-
ble to future years to differences between the
financial statement carrying amounts of existing
assets and liabilities and their respective fee
bases as well as net operating loss and tax
credit carryforwards.
The effect on deferred tax assets and liabilities
of a change in tax rates is recognized in income
in the period that includes the enactment date.
The measurement of deferred tax assets is
reduced, if necessary, by a valuation allowance
for any tax benefits for which future realization
is uncertain.
Although we believe our assumptions, judg-
ments and estimates are reasonable, changes in
tax laws or our interpretation of tax laws and
the resolution of any tax audits could signifi-
cantly impact the amounts provided for income
taxes in our consolidated financial statements.
In evaluating our ability to recover our deferred
tax assets, in full or in part, we consider all
available positive and negative evidence, includ-
ing our past operating results, and our forecast
of future earnings, future taxable income and
prudent and feasible tax planning strategies.

44
The assumptions utilized in determining future
taxable income require significant judgment
and are consistent with the plans and estimates
we are using to manage the underlying busi-
nesses. Actual operating results in future years
could differ from our current assumptions, judg-
ments and estimates. However, we believe that
it is more likely than not that substantially all
deferred tax assets recorded on our Consolida-
ted Balance Sheets will ultimately be realized.
In the event we were to determine that we
would not be able to realize all or part of our
net deferred tax assets in the future, an adjust-
ment to the deferred tax assets would be
charged to earnings in the period in which we
make such determination.
We did not recognize certain tax benefits from
uncertain tax positions within the provision for
income taxes. We may recognize a tax benefit
only if it is more likely than not the tax position
will be sustained on examination by the taxing
authorities, based on the technical merits of the
position. The tax benefits recognized in the
financial statements from such positions are
then measured based on the largest benefit that
has a greater than 50% likelihood of being
realized upon settlement. At December 31, 2013,
our estimated gross unrecognized tax benefits
were $68.2 million of which $57.0 million, if
recognized, would favorably impact our future
earnings. Due to uncertainties in any tax audit
outcome, our estimates of the ultimate settle-
ment of our unrecognized tax positions
may change and the actual tax benefits may
differ significantly from the estimates. See
Note 10 of Item 8, Financial Statements and
Supplementary Data for further information
regarding income taxes.
At December 31, 2013 , our
estimated gross unrecognized
tax benefits were
$68.2 million
NETFLIX, INC.
45
STOCK-BASED COMPENSATION
Stock-based compensation expense at the
grant date is based on the total number of
options granted and an estimate of the fair value
of the awards expected to vest and is recog-
nized as expense ratably over the requisite
service period, which is the vesting period.
We calculate the fair value of new stock-based
compensation awards under our stock option
plans using a lattice-binomial model. This model
requires the input of highly subjective assump-
tions, including price volatility of the underlying
stock. Changes in the subjective input assump-
tions can materially affect the estimate of fair
value of options granted and our results of oper-
ations could be impacted.
Expected Volatility Our computation of
expected volatility is based on a blend of histor-
ical volatility of our common stock and implied
volatility of tradable forward call options to pur-
chase shares of our common stock.
Our decision to incorporate implied volatility
was based on our assessment that implied vola-
tility of publicly traded options in our common
stock is more reflective of market conditions
and, therefore, can reasonably be expected to
be a better indicator of expected volatility than
historical volatility of our common stock.
We include the historical volatility in our compu-
tation due to low trade volume of our tradable
forward call options in certain periods ther-
eby precluding sole reliance on implied volatility.
An increase of 10% in our computation of
expected volatility would increase the total
stock-based compensation expense by approxi-
mately $4.5 million for the year ended
December 31, 2013 .
Suboptimal Exercise Factor Our computation
of the suboptimal exercise factor is based
on historical option exercise behavior and the
terms and vesting periods of the options
granted and is determined for both executives
and non-executives. An increase in the subopti-
mal exercise factor of 10% would increase the
total stock-based compensation expense by
approximately $2.4 million for the year ended
December 31, 2013 .

46
Notes To Consolidated
Financial Statements

NETFLIX, INC.
47
Notes To Consolidated
Financial Statements
66

48
Streaming Content
We amor t ize the content l ibrar y in “Cost
of revenues” on a stra ight l ine or on an
acce lerated bas is , as appropr iate
For content that does not premiere on the
Netflix service (representing the vast majority of
content), we amortize on a straight-line basis
over the shorter of each title’s contractual win-
dow of availability or estimated period of use,
beginning with the month of first availability. The
amortization period typically ranges from six
months to five years.
For content that premieres on the Netflix ser-
vice, we expect more upfront viewing due
efforts for this original content available only on
Netflix. Hence, we amortize on an accelerated
basis over the amortization period, which is the
shorter of four years or the license period,
beginning with the month of first availability.
If a subsequent season is added, the amortiza-
tion period is extended by a year.
If the cost per title cannot be reasonably esti-
mated, the license fee is not capitalized and
costs are expensed on a straight line basis over
the license period. This typically occurs when
the license agreement does not specify the
number of titles, the license fee per title or the
windows of availability per title.
The Company licenses rights to stream TV
shows, movies and original content to members
for unlimited viewing. These licenses are for a
fixed fee and specify license windows that gen-
erally range from six months to five years.
Payment terms may extend over the license
window, or may require more up-front paym-
ents as is typically the case for original content
or content that is licensed in an earlier window
through an output arrangement. We license
rights to stream TV shows, movies, and original
content to members for unlimited viewing.
These licenses are for a fixed fee and specify
license windows that generally range from six
months to five years. Payment terms may
extend over the license window, or may require
more up-front payments as is typically the
case for original content or content that
is licensed in an earlier window through an
output arrangement.
We capitalize the fee per title and record
a corresponding liability at the gross amount of
liabilities when the license period begins, the
cost of the title is known and the title is
accepted and available for streaming. The por-
tion available for streaming within one year is
recognized as “Current content library” and
the remaining portion as “Non-current content
library” on the Consolidated Balance sheets.
The acquisition of streaming content licenses
rights and the changes in related liabilities, are
classified within cash used in operating activi-
ties on the Consolidated Statements of
Cash Flows.
•
•
•

NETFLIX, INC.
49

50
Amortization of the content library is deter-
mined based on our historical and estimated
viewing patterns and requires considerable
management judgment. When we started with
original content, we did not have specific data
about viewing patterns over time for content
that premieres on Netflix.
Based on our experience with other similar tele-
vision series and our initial estimates of viewing
patterns, we amortized content that exclusively
premiered on our service on a straight-line basis
over the shorter of four years or the license
period. If a subsequent season is added, we
extend the remaining amortization period by a
year. Current estimates of viewing patterns
indicate that viewing in the first few months is
significantly higher, relative to the rest of the
amortization period, than previously estimated.
As a result, in the third quarter
of 2013, we began amortizing
this type of content on an accel-
erated basis over the
amortization period.
The effect of this change in estimate was a
decrease in operating income and net income
of $25.0 million and $15.4 million, respectively for
the year ended December 31, 2013. Any other
changes in management’s estimates could
have a significant impact on our future results
of operations.
The content library is stated at the lower of
unamortized cost or net realizable value.
Streaming content licenses (whether capital-
ized or not) are reviewed in aggregate at
the geographic region level for impairment
when an event or change in circumstances
indicates a change in the expected usefulness
of the content.
The level of geographic aggregation is deter-
mined based on the streaming content rights
which are generally specific to a geographic
region inclusive of several countries (such as
Latin America). No material write down from
unamortized cost to a lower net realizable value
was recorded in any of the periods presented.
We have entered into certain licenses with per-
forming rights organizations (“PROs”), and are
currently involved in negotiations with other
PROs, that hold certain rights to music and
other entertainment works “publicly performed”
in connection with streaming content into vari-
ous territories.
Accruals for estimated royalties are recorded
and then adjusted based on any changes
in estimates. These amounts are included in
the streaming content obligations. The res-
ults of these negotiations are uncertain and
may be materially different from manag-
ement’s estimates.
decrease in operating income
and net income
$25,000,000 &
$15,400,000

NETFLIX, INC.
51
DVD CONTENT LIBRARY
The Company acquires DVD content for the pur-
pose of renting such content to its members
and earning membership rental revenues, and,
as such, the Company considers its direct pur-
chase DVD library to be a productive asset.
Accordingly, the Company classifies its DVD
library in “Non-current content library, net” on
the Consolidated Balance Sheets.
The acquisition of DVD content library, net
of changes in related liabilities, is classified
within cash used in investing activities on the
Consolidated Statements of Cash Flows
because the DVD content library is considered
a productive asset. Other companies in the
in-home entertainment video industry classify
these cash flows as operating activities.
The Company amortizes its
direct purchase DVDs on an
accelerated basis over their
estimated useful lives,
which range from one year to
two years.
The Company also obtains DVD content thro-
ugh revenue sharing agreements with studios
and other content providers. Revenue sharing
obligations are expensed as incurred based
on shipments.
PROPERTY AND EQUIPMENT
Property and equipment are carried at cost less
accumulated depreciation. Depreciation is cal-
culated using the straight-line method over
the shorter of the estimated useful lives of the
respective assets, generally up to 30 years, or
the lease term for leasehold improvements,
if applicable.
Leased buildings are capitalized and included in
property and equipment when the Company
was involved in the construction funding and
did not meet the “sale-leaseback” criteria.
IMPAIRMENT OF LONG-LIVED ASSETS
Long-lived assets such as DVD content library,
property and equipment and intangible assets
subject to depreciation and amortization are
reviewed for impairment whenever events or
changes in circumstances indicate that the car-
rying amount of an asset group may not be
recoverable. Recoverability of asset groups to
be held and used is measured by a comparison
of the carrying amount of an asset group to
estimated undiscounted future cash flows
expected to be generated by the asset group.
If the carrying amount of an asset group
exceeds its estimated future cash flows, an
impairment charge is recognized by the amount
by which the carrying amount of an asset group
exceeds fair value of the asset group. There
were no events or changes in circumstances
that would indicate that the carrying amount of
an asset group may not be recoverable in any
of the years presented.

52
MARKETING
Marketing expenses consist primarily of adver-
tising expenses and also include payments
made to the Company’s affiliates and consumer
electronics partners. Advertising expenses
include promotional activities such as television
and online advertising. Advertising costs are
expensed as incurred. Advertising expenses
were $437.9 million , $377.2 million and $299.1
million for the years ended December 31, 2013,
2012 and 2011 , respectively.
INCOME TAXES
The Company records a tax provision for the
anticipated tax consequences of the reported
results of operations using the asset and
liability method. Deferred income taxes are rec-
ognized by applying enacted statutory tax
rates applicable to future years to differences
between the financial statement carrying
amounts of existing assets and liabilities and
their respective tax bases and operating loss
and tax credit carry forwards. The effect on
deferred tax assets and liabilities of a change
in tax rates is recognized in income in the
period that includes the enactment date.
The measurement of deferred
tax assets is reduced, if neces-
sary, by a valuation allowance
for any tax benefits for which
future realization is uncertain.
There was no significant valu-
ation allowance as of
December 31, 2013 or 2012.
The Company did not recognize certain tax
benefits from uncertain tax positions within the
provision for income taxes. The Company rec-
ognizes a tax benefit from an uncertain tax
position only if it is more likely than not the
tax position will be sustained on examination
by the taxing authorities, based on the techni-
cal merits of the position.
The tax benefits recognized in the financial
statements from such positions are then mea-
sured based on the largest benefit that has
a greater than 50% likelihood of being realized
upon settlement. The Company recognizes
interest and penalties related to uncertain tax
positions in income tax expense. See Note 10
to the consolidated financial statements for
further information regarding income taxes.
FOREIGN CURRENCY
The Company translates the assets and liabili-
ties of its non-U.S. dollar functional currency
subsidiaries into U.S. dollars using exchange
rates in effect at the end of each period.
Revenues and expenses for these subsidiaries
are translated using rates that approximate
those in effect during the period. Gains and
losses from these translations are recognized in
cumulative translation adjustment included in
“Accumulated other comprehensive income”
in stockholders’ equity on the Consolidated
Balance Sheets.

NETFLIX, INC.
53
EARNINGS PER SHARE
Basic earnings per share is computed using
the weighted-average number of outstanding
shares of common stock during the period.
Diluted earnings per share is computed using
the weighted-average number of outstanding
shares of common stock and, when dilutive,
potential common shares outstanding during
the period. Potential common shares consist of
Basic earnings per share
Net income
Shares used in computation
Weighted-average common shares outstanding
Basic earnings per share
Diluted earnings per share
Net income
Convertible Notes interest expense, net of tax
Numerator for diluted earning per share
Shares used in computation
Weighted-average common shares outstanding
Convertible Notes shares
Employee stock options
Weighted-average number of shares
Diluted earnings per share
2013 2012 2011
$ 112,403
58,198
$ 1.93
$ 112,403
49
112,452
58,198
715
1,848
60,761
$ 1.85
$ 17,152
55,521
$ 0.31
$ 17,152
195
17,347
55,521
2,331
1,052
58,904
$ 0.29
$ 226,126
52,847
$ 4.28
226,143
17
226,143
52,847
217
1,305
54,369
$ 4.16
As of/Year ended December 31,
(in thousands, except per share data)
shares issuable upon the assumed conversion
of the Company’s Convertible Notes (prior to
the conversion of such notes) and incremental
shares issuable upon the assumed exercise of
stock options. The computation of earnings per
share is as follows:

54
Report of Independent Registered Public Accounting Firm
The Board of Directors and Stockholders of Netflix, Inc.
We have audited Netflix, Inc.’s internal control over financial reporting as of December 31, 2013,
based on criteria established in Internal Control - Integrated Framework issued by the Committee
of Sponsoring Organizations of the Treadway Commission (1992 framework) (the COSO criteria).
Netflix, Inc.’s management is responsible for maintaining effective internal control over financial
reporting, and for its assessment of the effectiveness of internal control over financial reporting
included in the accompanying Management’s Annual Report on Internal Control over Financial
Reporting. Our responsibility is to express an opinion on the Company’s internal control over finan-
cial reporting based on our audit.
We conducted our audit in accordance with the standards of the Public Company Accounting
Oversight Board (United States). Those standards require that we plan and perform the audit to
obtain reasonable assurance about whether effective internal control over financial reporting was
maintained in all material respects. Our audit included obtaining an understanding of internal
control over financial reporting, assessing the risk that a material weakness exists, testing and evalu-
ating the design and operating effectiveness of internal control based on the assessed risk, and
performing such other procedures as we considered necessary in the circumstances. We believe
that our audit provides a reasonable basis for our opinion.
A company’s internal control over financial reporting is a process designed to provide reasonable
assurance regarding the reliability of financial reporting and the preparation of financial statements
for external purposes in accordance with generally accepted accounting principles. A company’s
internal control over financial reporting includes those policies and procedures that (1) pertain to
the maintenance of records that, in reasonable detail, accurately and fairly reflect the transactions
and dispositions of the assets of the company; (2) provide reasonable assurance that transactions
are recorded as necessary to permit preparation of financial statements in accordance with gener-
ally accepted accounting principles, and that receipts and expenditures of the company are being
made only in accordance with authorizations of management and directors of the company; and
(3) provide reasonable assurance regarding prevention or timely detection of unauthorized acquisi-
tion, use, or disposition of the company’s assets that could have a material effect on the
financial statements.
Because of its inherent limitations, internal control over financial reporting may not prevent or
detect misstatements. Also, projections of any evaluation of effectiveness to future periods are
subject to the risk that controls may become inadequate because of changes in conditions, or
that the degree of compliance with the policies or procedures may deteriorate. In our opinion,
Netflix, Inc. maintained, in all material respects, effective internal control over financial reporting
as of December 31, 2013, based on the COSO criteria.
We also have audited, in accordance with the standards of the Public Company Accounting
Oversight Board (United States), the consolidated balance sheets of Netflix, Inc. as of December
31, 2013 and 2012, and the related consolidated statements of operations, comprehensive
income, stockholders’ equity and cash flows for each of the two years in the period ended
December 31, 2013 of Netflix, Inc. and our report dated January 31, 2014 expressed an unqua-
lified opinion thereon.
/s/ Ernst & Young LLP
San Jose, California
January 31, 2014

NETFLIX, INC.
55

56
GR601 Type Systems
Spring 2016
Instructor: John Nettleton
Student: Beibei An
Typefaces:
Bodycopy: Neuzeit S
Display 1: A. Poudre Five
Diaplay 2: Emigre Ten
GR601 Type Systems
Spring 2016
Instructor: John Nettleton
Student: Beibei An
Typefaces:
Bodycopy: Neuzeit S
Display 1: A. Poudre Five
Diaplay 2: Emigre Ten

NETFLIX, INC.
57

58
V
W W W. N E T F L I X . C O M