nepi annual report 2013
TRANSCRIPT

ANNUAL REPORT 2013
overview
Company profile 4
Board of Directors 8
Senior management team 10
Directors’ report 12
Analysis of shareholders and share trading 22
Beneficial shareholding of Directors 23
Portfolio overview 24
CorPorAte governAnCe
Corporate governance 50
Key risk factors 55
Sustainability report 56
finAnCiAl StAtementS
Directors’ responsibility for the annual financial statements 60
independent auditor's report 61
Statement of financial position 62
Statement of income 63
Statement of comprehensive income 64
Statement of changes in equity 65
Statement of cash flows 67
notes to the financial statements 68
Schedule of properties 128
AnnuAl generAl meeting
notice of 2014 Annual general meeting 130
notes to notice of Annual general meeting 132
Proxy form 133

The terms ‘NEPI’, the ‘Group’, the ‘Company’, ‘we’, ‘our’ and ‘us’ refer to New Europe Property Investments plc and, as applicable, its subsidiaries and/or interests in joint ventures and associates. All amounts presented in Euro unless otherwise stated.
More information can be found on our website
www.nepinvest.com
ph
ot
o: a
up
ar
k z
ilin
a, s
lov
ak
ia

4 NEW EUROPE PROPERTY INVESTMENTS PLC ANNUAL REPORT 2013
New Europe Property Investments plc is a commercial property investor and developer listed on the Main Board of the Johannesburg Stock Exchange (JSE), the regulated market of the Bucharest Stock Exchange (BVB) and the Alternative Investment Market (AIM) of the London Stock Exchange (LSE).
NEPI was set up to acquire, develop and manage regionally dominant retail assets, initially in Romania and subsequently in other Central and Eastern European countries. The Group also invests in office and industrial properties when suitable opportunities arise.
Through a combination of acquisitions, developments and redevelopments the Group built up an exceptional property portfolio in Romania, with significant retail and office developments in the pipeline. NEPI is currently involved in a retail expansion programme in other countries and recently acquired a retail centre in Slovakia.
The investment strategy is biased towards long-term leases in Euro with strong corporate covenants. On 31 December 2013, the portfolio had an outstanding weighted average lease duration of 4.8 years, while 64% of the contracted rental income was generated by contracts signed with large tenants and major franchisees.
The Group is internally managed and combines property and asset management with investment and development skills in an integrated approach.
The Company distributes at least 90% of its net rental profits on a semi-annual basis.
ph
ot
o: t
he o
ff
ice, c
lu
j-n
ap
oc
a, r
om
an
ia
Company profile
Share price (€) Trading volume (million shares)
2009 2010 2011 2012 2013
7
6
5
4
3
2
7
6
5
4
3
2
– Share price – Share price with dividend reinvested

NEW EUROPE PROPERTY INVESTMENTS PLC ANNUAL REPORT 2013 5

6 NEW EUROPE PROPERTY INVESTMENTS PLC ANNUAL REPORT 2013
20
08
20
08
20
08
20
08
29
28
87
27
total number of properties
shares in issuemillion
lettable area of properties
thousand m²
number of shareholders
30
41
140
23
2
33
77
214
642
34
103
21
9
1,9
07
41
144
279
3,47
9
51 20
4
43
3
6,01
1
201
0
201
0
201
0
201
0
201
2
201
2
201
2
201
2
20
09
20
09
20
09
20
09
201
1
201
1
201
1
201
1
201
3
201
3
201
3
201
3

NEW EUROPE PROPERTY INVESTMENTS PLC ANNUAL REPORT 2013 7
photo: aupark zilina, slovakia
20
08
20
08
20
08
20
08
1.9
8
85
34
%
14.7
2
adjusted nav per share
€
fair value of properties
€ million
gearing(loans–cash)/(investment property+listed securities)
distribution per share
€ cents
1.9
7
146
46
%
15.
77
2.2
2
314
49
%
17.6
1
2.4
3
342
32
%
20.
25
2.8
8
44
5
25
%
23.
29
3.70
874
23
%
26.
79
201
0
201
0
201
0
201
0
201
2
201
2
201
2
201
2
20
09
20
09
20
09
20
09
201
1
201
1
201
1
201
1
201
3
201
3
201
3
201
3

8 NEW EUROPE PROPERTY INVESTMENTS PLC ANNUAL REPORT 2013
01 martin slabbert (43)Chief executive officerAppointed on 14 August 2007BCom, llB (cum laude), mCom (cum laude), Dip fmi, Cf (england and wales)
Martin Slabbert started his career in South Africa. Here he held positions at Arthur Andersen and HSBC Investment Services (Africa) (Pty) Ltd, gaining experience in mergers and acquisitions, turn-around strategies and financial restructuring. He was Senior Vice-President for the shareholders’ funds and member of the Executive Committee at Nedcor Investment Bank Ltd, and later General Manager in the capital management cluster of the Nedbank Group. In Romania he served as Partner at Deloitte Central Europe. Mr Slabbert co-founded NEPI in 2007, and has been managing the Group since then.
03 alex morar (30)executive DirectorAppointed on 25 September 2013BSc finance and information Systems
Alexandru Morar graduated with a degree in finance from Stern School of Business, New York University, and spent two years with the financial advisory practice of Deloitte Romania. He joined NEPI in 2007 and is currently focused on the investments and acquisitions programme and oversees elements of asset management.
04 tiberiu smaranda (32)executive DirectorAppointed on 25 September 2013BA
Tiberiu Smaranda graduated with a degree in management and marketing, and started his career at the Flamingo Group (Flanco), one of Romania’s leading white goods retailers. Here he was involved in retail management, development and expansion for nearly eight years, and was responsible for company’s expansion into Bulgaria, Croatia, Hungary, Macedonia, Moldova and Serbia. He joined NEPI in 2009 as Leasing Manager, and is now responsible for the retail developments, including retail asset management and maintaining relationships with key retail tenants.
02 victor semionov (36)finance DirectorAppointed on 13 may 2010BCom
Victor Semionov graduated with a degree in finance in 1999 and started his career with the financial advisory practice of Deloitte Central Europe where he gained experience in mergers, acquisitions, turn-arounds and debt finance. Mr Semionov co-founded NEPI in 2007 and he has worked for the Group since then.
0201
03 04
Executive
Board of Directors

NEW EUROPE PROPERTY INVESTMENTS PLC ANNUAL REPORT 2013 9
01 dan pascariu (63)independent non-executive ChairmanAppointed on 30 march 2009mBA
Dan Pascariu is one of the most renowned figures in the Romanian banking industry. He started his career with the Romanian Bank for Foreign Trade in 1973, attaining the position of Chairman and CEO. Mr Pascariu is a non-executive Board member of the leasing, investment banking and building society subsidiaries of the Unicredit Group in Romania. He was the founder, and first President, of the Romanian Banking Association, as well as a co-founder and associate professor at the Romanian Banking Institute. Mr Pascariu is currently on the board of directors at various financial institutions in Romania and abroad.
04 michael mills (66)independent non-executive DirectorAppointed on 13 August 2007BSc, fCA
Michael Mills is an experienced public company chairman and managing director with significant operating and financial experience. A chartered accountant, he has worked across a range of sectors including technology, engineering, service and distribution, paper and packaging, food and textiles. His recent positions include, amongst others, Chairman of Advance Value Realisation, non-executive Director of Ultrasis, Managing Director of Atlas Medical Recruitment, Chairman of Athanor Capital Partners, Legacy Distribution Group and CEO of Drew Scientific Group.
05 dewald joubert (41)independent non-executive DirectorAppointed on 23 July 2007BCom, llB, Adv Cert tax
Dewald Joubert has extensive experience in international tax planning for corporations, transaction structuring and corporate governance. Formerly a practicing lawyer, he began his professional career with Arthur Andersen in South Africa and thereafter in the Isle of Man with the Maitland Group, where he was appointed partner of the firm. Mr Joubert holds a number of independent non-executive directorships on the boards of various listed companies and significant subsidiaries of listed multinational businesses.
02 desmond de beer (53)non-independent non-executive DirectorAppointed on 21 october 2008BProc, mAP
Desmond de Beer has significant experience in property investment and management. He spent several years in the banking industry, firstly at Barclays Bank in South Africa where he was Bond Manager at the Barclays Trust. Later he was appointed General Manager Corporate Equity, and became a member of the Executive Committee at Nedcor Investment Bank. Since 2003, Mr de Beer has been the Managing Director of the Resilient Property Income Fund, and a Director of Capital Property Fund, both listed on the JSE.
03 jeffrey Zidel (63)independent non-executive DirectorAppointed on 11 november 2009
Jeffrey Zidel is a successful property developer and investor, and has been involved in all aspects of the property industry for over 40 years. He is currently Chairman of Fortress Income Fund Ltd and Property Index Tracker Managers (Proprietary) Ltd, both listed on the JSE. Mr Zidel has been the President of the Roodepoort Chamber of Commerce three times, and one of the co-founders of Resilient Property Income Fund Ltd.
01 02 03
04 05
Non-executive

10 NEW EUROPE PROPERTY INVESTMENTS PLC ANNUAL REPORT 2013
01 michael beux (46)Construction project managementBSc
Michael Beux studied civil engineering in South Africa and started his career in the construction industry with Goldstein Civil Engineering (later Group Five Civil Engineering). In 2000, he moved to Romania where he spent five years contracting for Kier International, after which he moved into project management and construction consulting as Projects Director for Gleeds Romania. He joined NEPI in 2010 where he manages the internal project management function and provides technical advice.
02 neal farley (52)Construction project managementBSc, Pg Dip
Neal Farley graduated with a degree in minerals estate management and a post graduate diploma in project and construction management. He began his careerin London working on the construction of numerous office and retail developments before moving to Poland where he spent ten years gaining Eastern European experience. Mr Farley has been in Romania for seven years working on office, industrial and retail developments.
03 anca gania (33)Acquisitions and planningBCom, ACCA, Chamber of financial Auditors of romania
Anca Gania graduated with a degree in finance and has ten years of experience in corporate finance. Prior to joining NEPI, she was a senior manager with the transaction services practice at PricewaterhouseCoopers where she spent nine years mainly performing merger and acquisition assignments.
04 sorin badea (36)Acquisitions and legalllB
Sorin Badea is a lawyer with over twelve years of experience in mergers and acquisitions, real estate and developments. Prior to joining NEPI, he practiced law as part of the Romanian legal teams at Clifford Chance and Deloitte.
05 adrian boca (33)Construction project managementBSc
Adrian Boca graduated with a degree in civil engineering and has ten years of experience in construction project management. Prior to joining NEPI, he held similar positions at Gardiner&Theobald and Lidl Romania, part of the Schwarz Group, one of Europe’s largest discount retailers.
06 adrian rosca (39)Construction project managementBSc
Adrian Rosca graduated with a degree in civil engineering and has sixteen years of experience in construction project management. Prior to joining NEPI, he held construction project management positions at Mivan, the Romanian arm of Ed Züblin, a German contractor, and Gardiner&Theobald.
01 0302
04 05 06
Senior management teamNEPI’s senior management consists of the Executive Directors and the individuals presented below. This multifaceted multinational team is proud of its successful track record and comprehensive collection of in-house experts fully conversant with property and asset management, investment and property development.

NEW EUROPE PROPERTY INVESTMENTS PLC ANNUAL REPORT 2013 11
08 iulian rusu (37)retail leasingBJ
Iulian Rusu has nineteen years of experience in journalism, public relations and retail leasing. Prior to joining NEPI, he was senior consultant at the Romanian office of Krammer&Wagner where he was responsible for retail leasing.
07 estera enache (34)retail leasingBlS
Estera Enache has twelve years of experience in sales and retail leasing. Prior to joining NEPI, she was senior consultant at DTZ Echinox for seven years.
09 lori Collin (40)office leasingBSc
Lori Collin has twenty years of experience in real estate and is specialised in office leasing. Her career started in the USA covering the commercial, investment and residential sectors, spending the last five years specialising in office leases in Romania. Prior to joining NEPI, Ms Collin was associate director at Jones Lang LaSalle Romania.
10 mirela Covasa (31)reporting and controllingBCom, ACCA, Chamber of financial Auditors of romania
Mirela Covasa graduated with a degree in finance and has worked in accounting and auditing for over twelve years. Prior to joining NEPI, she was senior manager at PricewaterhouseCoopers where she spent eight years performing audit assignments in Romania, Slovenia and India.
11 marius barbu (34)Asset and property managementBCom, mSc
Marius Barbu has fourteen years of experience in marketing and real estate. Prior to joining NEPI, he held marketing executive positions with Unilever, and asset and property management appointments with Mivan, an Irish developer, and Argo Investment Fund, a retail property owner and operator.
12 daniel bod’a (34)Asset and property managementBSc, mBA
Daniel Bod’a has a master’s degree in natural sciences and later completed an MBA at Nottingham Trent University. Prior to joining NEPI, he spent five years in retail before moving into asset and property management when he joined HB Reavis, a property developer.
07
10
08 09
11 12

12 NEW EUROPE PROPERTY INVESTMENTS PLC ANNUAL REPORT 2013
Distributable earnings
The Group has achieved distributable earnings of 13.92 euro cents per share for the second half of the financial year ended 31 December 2013. This result, combined with the 11.87 euro cents per share for the first half of the financial year, represents a 23.5% improvement in recurring income per share when compared to 2012.
The improvement is due to the continued strong performance of the Group’s assets and the favourable impact of acquisitions and developments completed during the financial year, which are detailed below.
Distribution
The Board of Directors has resolved to set the 2013 full year distribution to 26.79 euro cents per share, an improvement of 15% over the 23.29 euro cents distribution declared in relation to 2012. Accordingly, the Board has declared a final distribution of 13.86 euro cents per share for the six months ended 31 December 2013.
Option to receive capital return
Consistent with the practice introduced in 2012, the Board has resolved to offer shareholders the option to receive their distribution as either cash or an issue of fully-paid shares up at a ratio of 2.742 new shares for each 100 held.
A circular that contains details of this resolution, accompanied by announcements on the Stock Exchange News Service (SENS) of the Johannesburg Stock Exchange (JSE), the Regulatory News Service (RNS) of the London Stock Exchange (LSE) and the Bucharest Stock Exchange (BVB) has been issued on 6 March 2014.
Retained distributable earnings
In recent years the Board has adopted a policy of retaining non-recurring distributable earnings and considering them for distribution as the Group increasingly pursued various property developments that are expected to have a positive impact on per share distributions once complete, but that are earnings dilutive during construction. This policy was adopted during the 2011 financial year to maintain a constant growth profile in per share distributions during the construction phase at an annualised target rate of 15% over a three-year period (from the 2010 base). In the second half of the 2013 financial year, the Group achieved its three year growth target in distribution per share without making use of retained distributable earnings.
Directors’ report
NEW EUROPE PROPERTY INVESTMENTS PLC ANNUAL REPORT 2013 13
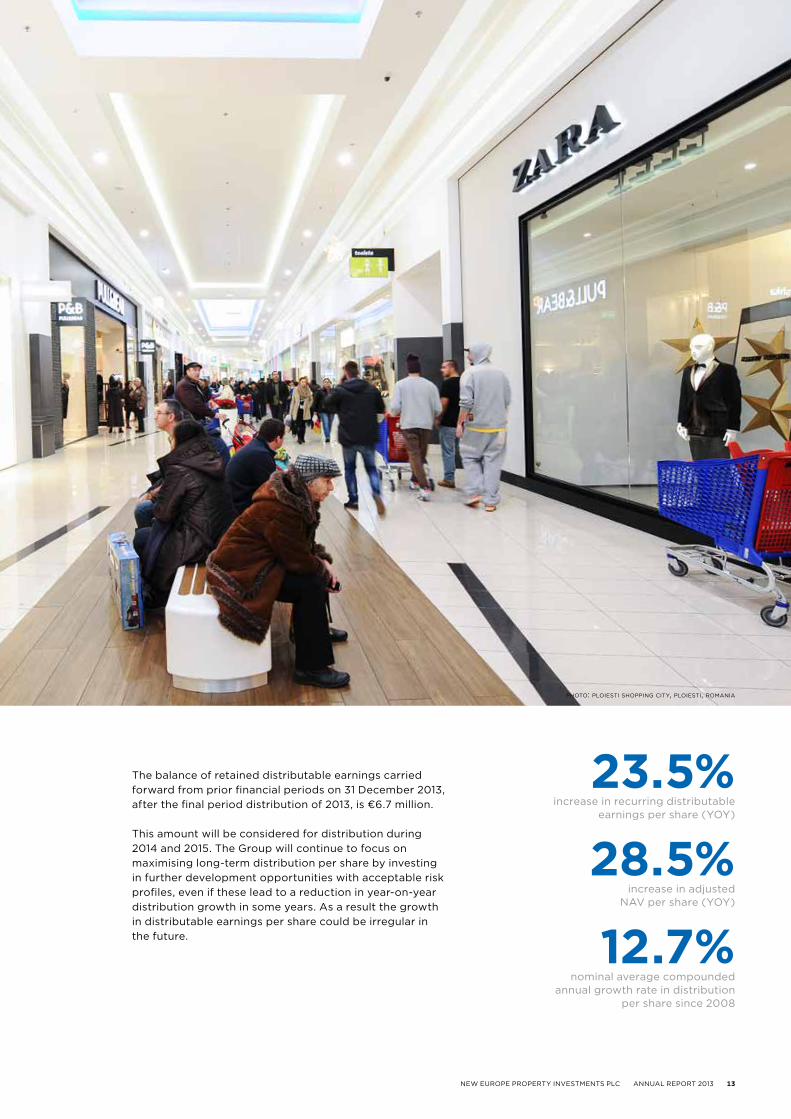
The balance of retained distributable earnings carried forward from prior financial periods on 31 December 2013, after the final period distribution of 2013, is €6.7 million.
This amount will be considered for distribution during 2014 and 2015. The Group will continue to focus on maximising long-term distribution per share by investing in further development opportunities with acceptable risk profiles, even if these lead to a reduction in year-on-year distribution growth in some years. As a result the growth in distributable earnings per share could be irregular in the future.
photo: ploiesti shopping city, ploiesti, romania
23.5%increase in recurring distributable
earnings per share (YOY)
28.5%increase in adjusted
NAV per share (YOY)
12.7%nominal average compounded
annual growth rate in distribution per share since 2008

14 NEW EUROPE PROPERTY INVESTMENTS PLC ANNUAL REPORT 2013
Retail property acquisitions and completed developments
aupark ZilinaEffective acquisition date: 31 July 2013
The Group has acquired Aupark Zilina, a regional mall with 24,874m² of Gross Leasable Area (GLA), situated in the historic centre of Zilina, Slovakia, 200 km from the capital Bratislava and close to the Czech and Polish borders. Zilina, with a population of 85,000 is the country’s third largest city, an
important industrial hub and the capital of a region with 700,000 residents. Within 30-minute drive of the shopping centre are 380,000 citizens. Major tenants include international brands such as Billa, C&A, Deichmann, H&M and New Yorker.
ph
ot
o: c
ity p
ar
k, c
on
sta
nta
, ro
ma
nia

NEW EUROPE PROPERTY INVESTMENTS PLC ANNUAL REPORT 2013 15
City park ConstantaEffective acquisition date: 31 October 2013
The Group has acquired City Park, a mall of 29,284m² GLA situated in Constanta, Romania. It is located on a busy intersection close to the centre and a short distance from Mamaia, the country’s most popular seaside resort. The Constanta metropolitan area has 425,000 residents, while Mamaia attracts large numbers of visitors each summer. City Park hosts a wide range of global fashion brands such as Bershka, Koton, LC Waikiki, Mango, Marks & Spencer, Orsay, Oysho, Pull&Bear, Stradivarius and Zara, as well as a Cora hypermarket, several international fast food brands like KFC, McDonalds and Pizza Hut, and various other international and national tenants. City Park has existing, approved building rights, which NEPI intends to utilise to develop a substantial fashion and leisure extension.
severin shopping CenterEffective acquisition date: 1 May 2013
The Group has acquired Severin Shopping Center in Drobeta-Turnu Severin, Romania, which has 16,546m² GLA and 23,000m² of additional land intended for extensions. Major tenants include Altex, Carrefour, Deichmann, Lee Cooper, New Yorker, Orsay and Takko.
shopping City galatiOpening date: 21 November 2013
The Group has completed the development of Shopping City Galati in Romania. The completed shopping centre, which has 27,206m² of GLA, houses various international brands, including Carrefour, CCC, C&A, Deichmann, dm, H&M, Intersport, KFC and New Yorker. It was completed in six months from the issue of the building permit and the Group owns sufficient land for a substantial future extension.
strip mall developmentsThe Group opened four Kaufland strip mall extensions in Romania:
— Alexandria (2 May 2013)— Petrosani (24 October 2013)— Sighisoara (14 November 2013)— Sfantu Gheorghe (21 November 2013)
Directors’ report
deva shopping CentreEffective acquisition date: 31 July 2013
The Group has acquired a regional shopping centre with 42,180m² GLA in Deva, Romania, the capital of Hunedoara county. In addition to Deva’s population of 56,000, the catchment area includes 220,000 residents within a 45-minute drive of the centre. Major tenants include dm, Domo, Jysk, Metro Cash & Carry, Praktiker, Real Hypermarket (recently rebranded as Auchan Hypermarket) and Takko. The acquisition includes 29,000m² of land intended for extensions.
162%increase in retail asset base (YOY)

16 NEW EUROPE PROPERTY INVESTMENTS PLC ANNUAL REPORT 2013
Retail property developments and extensions
mega mallThe Group has acquired a 70% interest in a permitted development on the former Electroaparataj factory site in Bucharest, and in conjunction with Austrian development group Real4You commenced construction of a 70,000m² GLA mall. The 51,000m² site is located close to the national football stadium, in the city’s densely populated east area which currently lacks retail space. Mega Mall is visible from a major vehicle artery and has excellent access to public transport, including trams, buses and trolley buses. A metro station is planned in front of the mall and the centre is expected to connect to it. Leasing efforts are progressing well and the opening is planned for the second quarter of 2015.
vulcan value CentreThe Group owns a 78,000m² former factory site, located in an under-serviced and densely populated area of Bucharest, where it is developing a value centre with 24,900m² GLA, anchored by a hypermarket and other value tenants. The site has good vehicular access to two major boulevards, excellent access to trams and buses, and should attract many pedestrians from the surrounding densely populated area. A building permit has been issued in January 2014, after an unplanned delay which was outside the Group’s control, and construction commenced. The value centre is expected to open in September 2014. More than 70% of the development has been let to international and national tenants, including a Carrefour hypermarket, C&A, dm, Domo, H&M, KFC and Takko.
Directors’ report
render: mega mall, bucharest, romania

NEW EUROPE PROPERTY INVESTMENTS PLC ANNUAL REPORT 2013 17
shopping City targu jiuThe Group has secured a series of adjoining plots of land with a total area of 40,000m² in Targu Jiu, Romania, and has commenced construction of a regional shopping centre with 27,000m² GLA. Targu Jiu is the capital of Gorj county, and with its population of 78,000 is its largest city. Employment levels in the county are high, it has one of the highest per capita income levels in the country, and purchasing power is relatively high. A series of large industrial developments are anticipated to occur in the area, which could stimulate further economic growth.
Currently there are no major retail developments in Targu Jiu. The site is located in the most densely populated area of the city, near the existing Kaufland hypermarket, and there are an additional 150,000 residents within a 30-minute drive. Lease agreements have been signed with tenants for 60% of the GLA, including Carrefour, the anchor hypermarket. The shopping centre is expected to open in October 2014.
strip mall developmentsFurther to the four Kaufland value centres opened during 2013, the Group expects to open a similar centre in Vaslui in the second quarter of 2014, and intends to pursue other opportunities in similar sized Romanian cities which are under-serviced by modern retail facilities.
retail extensionsVarious retail extensions are planned to commence subject to obtaining the necessary authorisations, permits and tenant commitments. These include extensions to NEPI’s retail assets in Brasov, Braila, Constanta, Deva and Drobeta-Turnu Severin.
Disposals
retail park pitesti – hypermarket sectionDisposal date: 29 April 2013
As announced in August 2012, the hypermarket section of Retail Park Pitesti was sold to the Auchan Group for a total consideration of €29.2 million.
render: mega mall, bucharest, romania

18 NEW EUROPE PROPERTY INVESTMENTS PLC ANNUAL REPORT 2013
Office property acquisition
the lakeviewEffective acquisition date: 1 January 2013
The Group has acquired The Lakeview in north-east Bucharest, Romania, a landmark A-grade building, including office space and ground-floor retail. The building comprises a total GLA of 25,564m² and 485 parking spaces. It is located close to NEPI’s Floreasca Business Park in the emerging office corridor between Floreasca and Barbu Vacarescu streets. Tenants include Alcon, Colgate-Palmolive, Huawei, Philips, PricewaterhouseCoopers and Royal Bank of Scotland.
Office property developments
City business CentreThe Group owns City Business Centre in Timisoara, Romania, a city that is home to a growing back-office activities and services market that offers a skilled labour force, low costs and proximity to Western Europe. The Group also has a forward purchase agreement for two additional buildings in City Business Centre, with 20,000m² GLA. An initial early payment of €8 million was made to the vendor in February 2013 through a secured loan, in relation to the first of these buildings (the second is still under development).
the officeIn February 2013 the Group commenced the first of three phases of a joint venture office development situated in the city centre of Cluj-Napoca. This will include up to 54,400m² of A-grade office GLA. Cluj is in the north-west of Romania and is the country’s second largest city by population. The first phase of 19,600m² GLA is planned to be completed and delivered in April 2014. Significant tenant interest has been generated for what will be Cluj’s first A-grade office development.
victoriei officePermits should soon be available for a landmark office development on land owned by NEPI in a prime location in central Bucharest.
Directors’ report
ph
ot
o: f
lor
ea
sc
a b
us
ine
ss p
ar
k, b
uc
ha
re
st,
ro
ma
nia

NEW EUROPE PROPERTY INVESTMENTS PLC ANNUAL REPORT 2013 19
20 NEW EUROPE PROPERTY INVESTMENTS PLC ANNUAL REPORT 2013
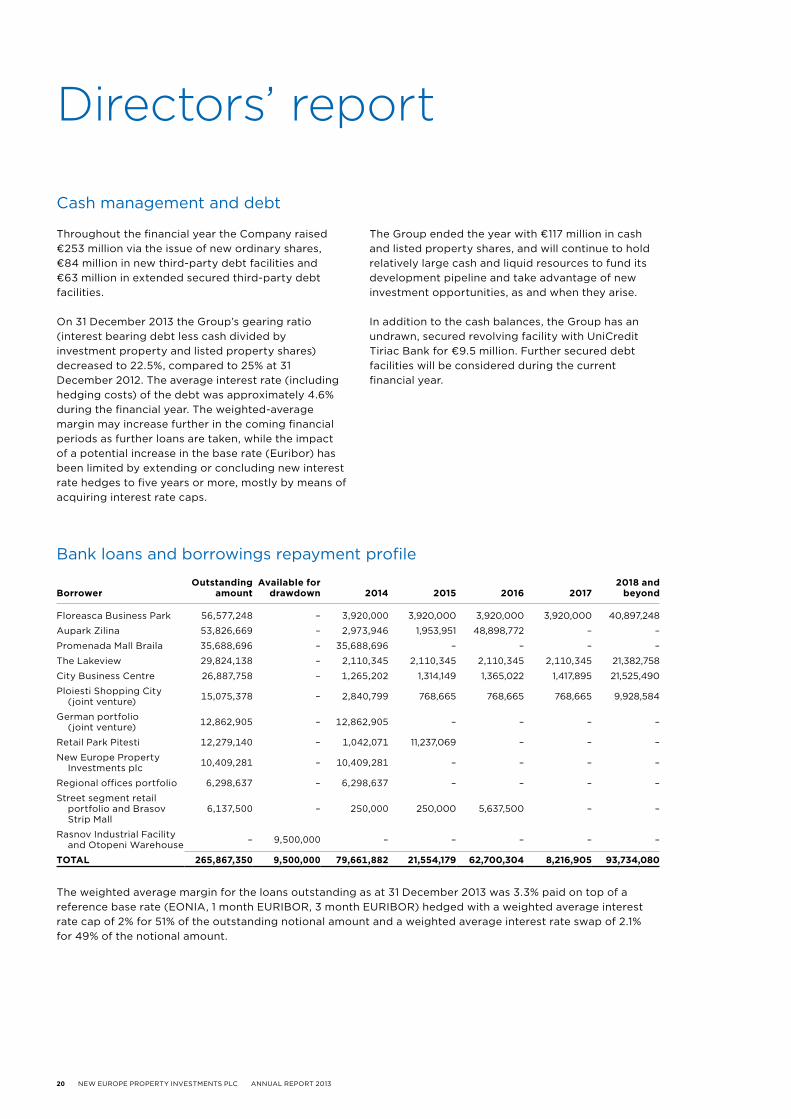
Cash management and debt
Throughout the financial year the Company raised €253 million via the issue of new ordinary shares, €84 million in new third-party debt facilities and €63 million in extended secured third-party debt facilities.
On 31 December 2013 the Group’s gearing ratio (interest bearing debt less cash divided by investment property and listed property shares) decreased to 22.5%, compared to 25% at 31 December 2012. The average interest rate (including hedging costs) of the debt was approximately 4.6% during the financial year. The weighted-average margin may increase further in the coming financial periods as further loans are taken, while the impact of a potential increase in the base rate (Euribor) has been limited by extending or concluding new interest rate hedges to five years or more, mostly by means of acquiring interest rate caps.
The Group ended the year with €117 million in cash and listed property shares, and will continue to hold relatively large cash and liquid resources to fund its development pipeline and take advantage of new investment opportunities, as and when they arise.
In addition to the cash balances, the Group has an undrawn, secured revolving facility with UniCredit Tiriac Bank for €9.5 million. Further secured debt facilities will be considered during the current financial year.
Bank loans and borrowings repayment profile
borroweroutstanding
amountavailable for
drawdown 2014 2015 2016 20172018 and
beyond
Floreasca Business Park 56,577,248 – 3,920,000 3,920,000 3,920,000 3,920,000 40,897,248
Aupark Zilina 53,826,669 – 2,973,946 1,953,951 48,898,772 – –
Promenada Mall Braila 35,688,696 – 35,688,696 – – – –
The Lakeview 29,824,138 – 2,110,345 2,110,345 2,110,345 2,110,345 21,382,758
City Business Centre 26,887,758 – 1,265,202 1,314,149 1,365,022 1,417,895 21,525,490
Ploiesti Shopping City (joint venture) 15,075,378 – 2,840,799 768,665 768,665 768,665 9,928,584
German portfolio (joint venture) 12,862,905 – 12,862,905 – – – –
Retail Park Pitesti 12,279,140 – 1,042,071 11,237,069 – – –
New Europe Property Investments plc 10,409,281 – 10,409,281 – – – –
Regional offices portfolio 6,298,637 – 6,298,637 – – – –
Street segment retail portfolio and Brasov Strip Mall
6,137,500 – 250,000 250,000 5,637,500 – –
Rasnov Industrial Facility and Otopeni Warehouse – 9,500,000 – – – – –
total 265,867,350 9,500,000 79,661,882 21,554,179 62,700,304 8,216,905 93,734,080
The weighted average margin for the loans outstanding as at 31 December 2013 was 3.3% paid on top of a reference base rate (EONIA, 1 month EURIBOR, 3 month EURIBOR) hedged with a weighted average interest rate cap of 2% for 51% of the outstanding notional amount and a weighted average interest rate swap of 2.1% for 49% of the notional amount.
Directors’ report

NEW EUROPE PROPERTY INVESTMENTS PLC ANNUAL REPORT 2013 21
Other highlights
The Group has grown significantly during 2013 and as a result NEPI has been included in the JSE mid-cap index. The total number of shareholders increased from 3,479 at the end of 2012 to 6,011 at the end of 2013; the daily trade in shares also increased.
On 31 December 2013, the Adjusted Net Asset Value (NAV) per share was 28.5% higher than it was at the end of the previous year. Vacancy level is decreasing: calculated as a portion of available rentable area (excluding the rentable areas covered by earn-out arrangements in City Business Centre, Timisoara) at the end of 2013 it was 2.33% compared to 4.8% the previous year (3.56% on a like-for-like basis).
Non-recoverable tenant income for 2013 amounted to €87,963, equivalent to 0.14% of contractual rental income and expense recoveries for the year.
Due to the growth in activity, the Group increased its focus on corporate governance to ensure that adequate internal controls are in place to manage risks. Two new directors joined the Board in September 2013, Alexandru Morar and Tiberiu Smaranda. The Group also augmented its management team by recruiting additional experienced asset management, leasing, project development and finance professionals.
Prospects
NEPI has maintained high levels of growth in recurring distributable earnings per share over the course of the past six years, and as a result has achieved a nominal average compounded annual growth rate of 12.7% in distribution per share from 2008 to 2013.
The development pipeline detailed above ensures that the Group is well placed to pursue further attractive investment opportunities and grow its recurring distributable earnings in 2014 and beyond. In addition, the Group will continue to explore further acquisitions and development opportunities in Romania and other central-eastern European countries, with initiatives already underway. Relevant announcements will be made as and when appropriate.
Earnings guidance
The Board is confident that recurring distributable earnings per share for the first half of 2014 will range from 13.90 to 14.20 euro cents per share (compared to 11.87 euro cents per share for the six months ended on 30 June 2013) based on the assumptions that a stable macroeconomic environment prevails, no major corporate failures occur and no further shares will be issued during the period.
Consequently growth in distribution per share of 15% is expected to be achieved for the interim period ending 30 June 2014. This forecast has not been audited or reviewed by NEPI’s auditors.
render: victoriei office, bucharest, romania
22 NEW EUROPE PROPERTY INVESTMENTS PLC ANNUAL REPORT 2013
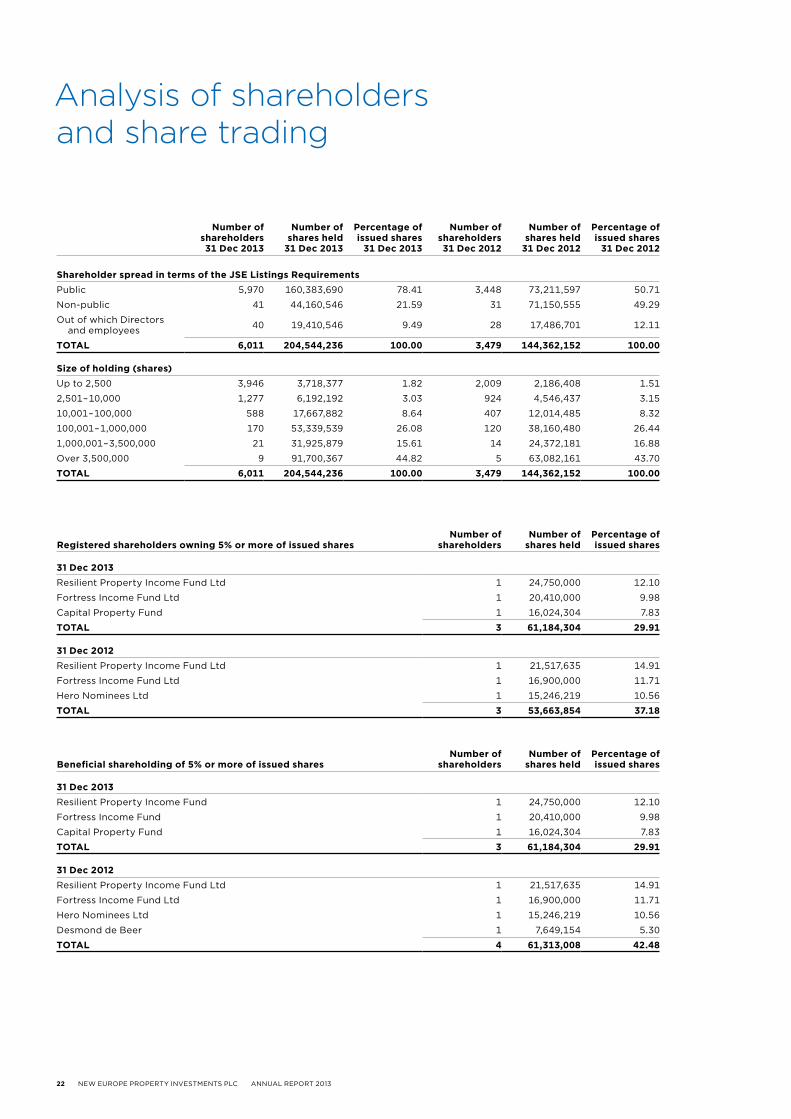
Analysis of shareholders and share trading
number of shareholders31 dec 2013
number of shares held
31 dec 2013
percentage of issued shares
31 dec 2013
number of shareholders 31 dec 2012
number of shares held
31 dec 2012
percentage of issued shares
31 dec 2012
shareholder spread in terms of the jse listings requirementsPublic 5,970 160,383,690 78.41 3,448 73,211,597 50.71
Non-public 41 44,160,546 21.59 31 71,150,555 49.29
Out of which Directors and employees 40 19,410,546 9.49 28 17,486,701 12.11
total 6,011 204,544,236 100.00 3,479 144,362,152 100.00
size of holding (shares)Up to 2,500 3,946 3,718,377 1.82 2,009 2,186,408 1.51
2,501 – 10,000 1,277 6,192,192 3.03 924 4,546,437 3.15
10,001 – 100,000 588 17,667,882 8.64 407 12,014,485 8.32
100,001 – 1,000,000 170 53,339,539 26.08 120 38,160,480 26.44
1,000,001 – 3,500,000 21 31,925,879 15.61 14 24,372,181 16.88
Over 3,500,000 9 91,700,367 44.82 5 63,082,161 43.70
total 6,011 204,544,236 100.00 3,479 144,362,152 100.00
registered shareholders owning 5% or more of issued sharesnumber of
shareholdersnumber of
shares heldpercentage of issued shares
31 dec 2013Resilient Property Income Fund Ltd 1 24,750,000 12.10
Fortress Income Fund Ltd 1 20,410,000 9.98
Capital Property Fund 1 16,024,304 7.83
total 3 61,184,304 29.91
31 dec 2012Resilient Property Income Fund Ltd 1 21,517,635 14.91
Fortress Income Fund Ltd 1 16,900,000 11.71
Hero Nominees Ltd 1 15,246,219 10.56
total 3 53,663,854 37.18
beneficial shareholding of 5% or more of issued sharesnumber of
shareholdersnumber of
shares heldpercentage of issued shares
31 dec 2013Resilient Property Income Fund 1 24,750,000 12.10
Fortress Income Fund 1 20,410,000 9.98
Capital Property Fund 1 16,024,304 7.83
total 3 61,184,304 29.91
31 dec 2012Resilient Property Income Fund Ltd 1 21,517,635 14.91
Fortress Income Fund Ltd 1 16,900,000 11.71
Hero Nominees Ltd 1 15,246,219 10.56
Desmond de Beer 1 7,649,154 5.30
total 4 61,313,008 42.48
NEW EUROPE PROPERTY INVESTMENTS PLC ANNUAL REPORT 2013 23
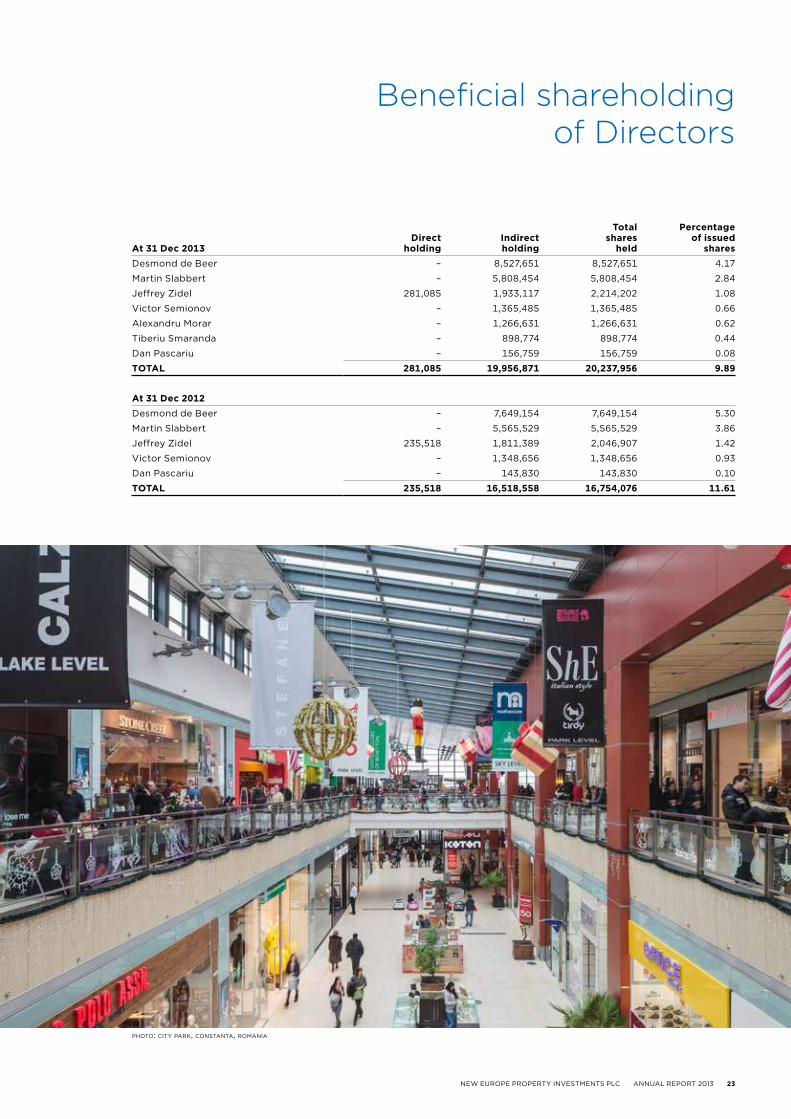
at 31 dec 2013direct
holdingindirect holding
total shares
held
percentage of issued
sharesDesmond de Beer – 8,527,651 8,527,651 4.17
Martin Slabbert – 5,808,454 5,808,454 2.84
Jeffrey Zidel 281,085 1,933,117 2,214,202 1.08
Victor Semionov – 1,365,485 1,365,485 0.66
Alexandru Morar – 1,266,631 1,266,631 0.62
Tiberiu Smaranda – 898,774 898,774 0.44
Dan Pascariu – 156,759 156,759 0.08
total 281,085 19,956,871 20,237,956 9.89
at 31 dec 2012Desmond de Beer – 7,649,154 7,649,154 5.30
Martin Slabbert – 5,565,529 5,565,529 3.86
Jeffrey Zidel 235,518 1,811,389 2,046,907 1.42
Victor Semionov – 1,348,656 1,348,656 0.93
Dan Pascariu – 143,830 143,830 0.10
total 235,518 16,518,558 16,754,076 11.61
Beneficial shareholding of Directors
photo: floreasca business park, bucharest, romania
photo: city park, constanta, romania

24 NEW EUROPE PROPERTY INVESTMENTS PLC ANNUAL REPORT 2013
Macroeconomic status: Romania
GDP in Romania underwent low but stable growth throughout 2011 and 2012, while in 2013 there was a notable increase of 3.5%. This rise was driven by an increase in industrial and agricultural production. During the last year inflation and the current account deficit decreased to 3.2% and 1% respectively, while the general government deficit was reduced to 2.6%. The funding profile of the banking sector showed a gradual improvement, with the loan-to-deposit ratio dropping by approximately 12% to 105%, and, in January 2014, the National Bank of Romania decreased both the monetary policy rate and the minimum reserve requirements. The unemployment rate decreased and remains below EU average.
Market overview: Romania
retailModern retail stock in Romania reached 2.8 million m² in December 2013 after four shopping centres and a hypermarket-led scheme were opened during the year, one of these being Shopping City Galati. Construction works started for five more projects, three of which developed by NEPI. Retail trade volume grew by approximately 2.1% during the year while month-on-month growth has picked up pace in the second half of 2013. Tenant demand remained strong, with new international brands entering the market, ranging from low- and medium-priced such as Tchibo Stores and H&M Home to exclusive, luxury labels such as Dolce&Gabbana and Laduree.
officeRomania’s most significant office market is Bucharest. In 2013, the total leasing activity was recorded at nearly 300,000m², the highest volume of leasing transactions ever recorded in the city. A third of these transactions involved clients from the Information Technology and Communications (IT&C) sector. A-grade properties continue to benefit from low vacancy rates, but new deliveries are putting pressure on rents. Tenant demand in Timisoara remains strong and rents are stable.
Macroeconomic status: Slovakia
The Slovakian economy grew by 0.8% and retains a positive outlook for the next period. Net exports continued to increase and stimulate growth, but investments and stagnating private consumption had an opposite effect.
Market overview: Slovakia
retailThe total amount of modern retail stock in Slovakia is approximately 1.54 million m², with one third being located in Bratislava. The market is stable, and demand for prime sites remains high. There is a current, growing trend for retailers to move out of lower quality centres and into prime centres. In 2013, the retail trade volume grew by approximately 1.9%.
Portfolio overview
ph
ot
o: c
ity b
us
ine
ss c
en
tr
e, t
imis
oa
ra, r
om
an
ia

NEW EUROPE PROPERTY INVESTMENTS PLC ANNUAL REPORT 2013 25
26 NEW EUROPE PROPERTY INVESTMENTS PLC ANNUAL REPORT 2013
group 31 dec 2013
group 31 dec 2012
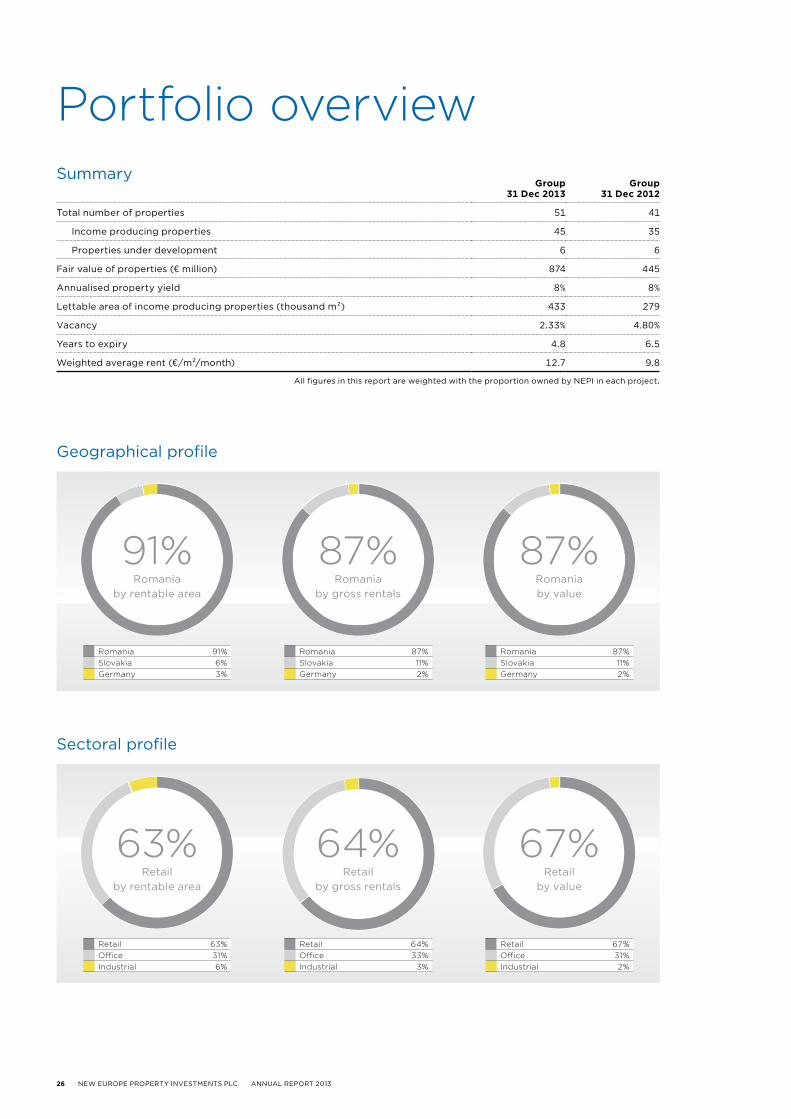
Total number of properties 51 41
Income producing properties 45 35
Properties under development 6 6
Fair value of properties (€ million) 874 445
Annualised property yield 8% 8%
Lettable area of income producing properties (thousand m²) 433 279
Vacancy 2.33% 4.80%
Years to expiry 4.8 6.5
Weighted average rent (€/m²/month) 12.7 9.8
All figures in this report are weighted with the proportion owned by NEPI in each project.
91+6+3+S63+31+6+S
87+11+2+S64+33+3+S
87+11+2+S67+31+2+S
Portfolio overview
Romania 91%Slovakia 6%Germany 3%
Retail 63%Office 31%Industrial 6%
Romania 87%Slovakia 11%Germany 2%
Retail 64%Office 33%Industrial 3%
Romania 87%Slovakia 11%Germany 2%
Retail 67%Office 31%Industrial 2%
91%Romania
by rentable area
63%Retail
by rentable area
87%Romania
by gross rentals
64%Retail
by gross rentals
87%Romaniaby value
67%Retail
by value
Geographical profile
Summary
Sectoral profile
NEW EUROPE PROPERTY INVESTMENTS PLC ANNUAL REPORT 2013 27
Vacancy profile
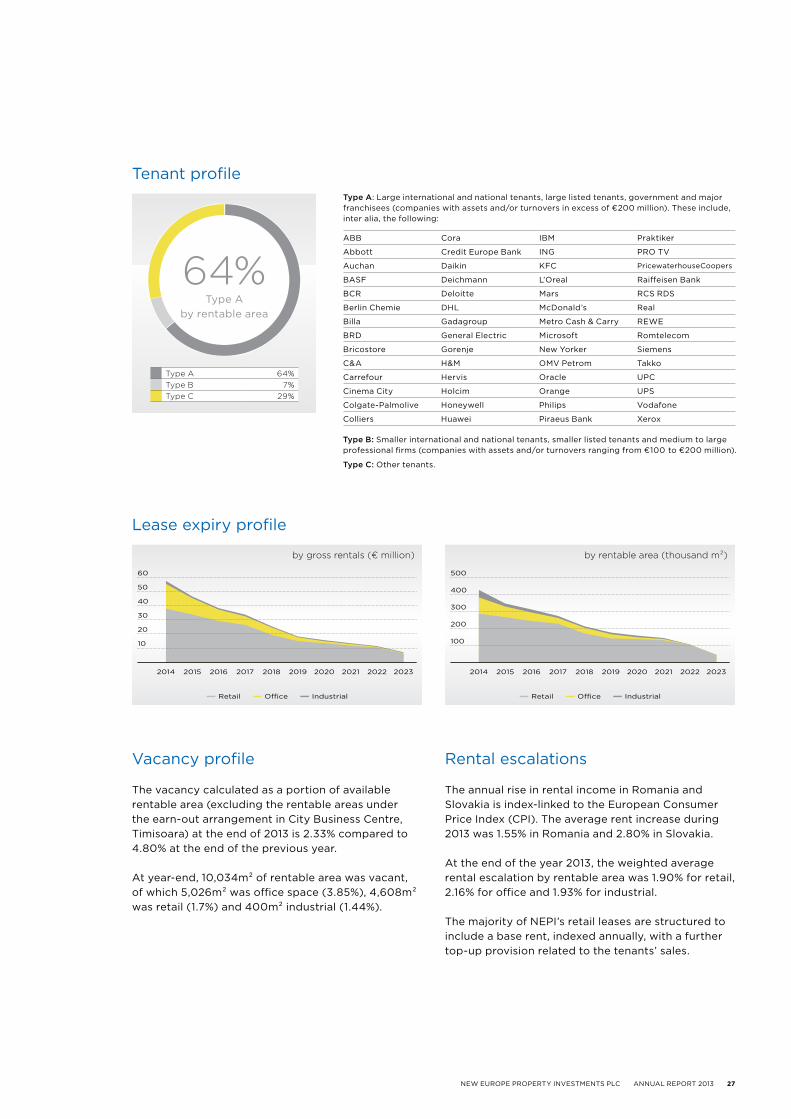
The vacancy calculated as a portion of available rentable area (excluding the rentable areas under the earn-out arrangement in City Business Centre, Timisoara) at the end of 2013 is 2.33% compared to 4.80% at the end of the previous year.
At year-end, 10,034m² of rentable area was vacant, of which 5,026m² was office space (3.85%), 4,608m² was retail (1.7%) and 400m² industrial (1.44%).
Rental escalations
The annual rise in rental income in Romania and Slovakia is index-linked to the European Consumer Price Index (CPI). The average rent increase during 2013 was 1.55% in Romania and 2.80% in Slovakia.
At the end of the year 2013, the weighted average rental escalation by rentable area was 1.90% for retail, 2.16% for office and 1.93% for industrial.
The majority of NEPI’s retail leases are structured to include a base rent, indexed annually, with a further top-up provision related to the tenants’ sales.
type A: Large international and national tenants, large listed tenants, government and major franchisees (companies with assets and/or turnovers in excess of €200 million). These include, inter alia, the following:
ABB Cora IBM Praktiker
Abbott Credit Europe Bank ING PRO TV
Auchan Daikin KFC PricewaterhouseCoopers
BASF Deichmann L’Oreal Raiffeisen Bank
BCR Deloitte Mars RCS RDS
Berlin Chemie DHL McDonald’s Real
Billa Gadagroup Metro Cash & Carry REWE
BRD General Electric Microsoft Romtelecom
Bricostore Gorenje New Yorker Siemens
C&A H&M OMV Petrom Takko
Carrefour Hervis Oracle UPC
Cinema City Holcim Orange UPS
Colgate-Palmolive Honeywell Philips Vodafone
Colliers Huawei Piraeus Bank Xerox
type B: Smaller international and national tenants, smaller listed tenants and medium to large professional firms (companies with assets and/or turnovers ranging from €100 to €200 million).
type C: Other tenants.
64+7+29+SType A 64%Type B 7%Type C 29%
64%Type A
by rentable area
Tenant profile
Lease expiry profile
by gross rentals (€ million)
— Retail — O�ce — Industrial
2014 2015 2016 2017 2018 2019 2020 2021 2022 2023
60
50
40
30
20
10
by rentable area (thousand m2)
— Retail — O�ce — Industrial
2014 2015 2016 2017 2018 2019 2020 2021 2022 2023
500
400
300
200
100
28 NEW EUROPE PROPERTY INVESTMENTS PLC ANNUAL REPORT 2013
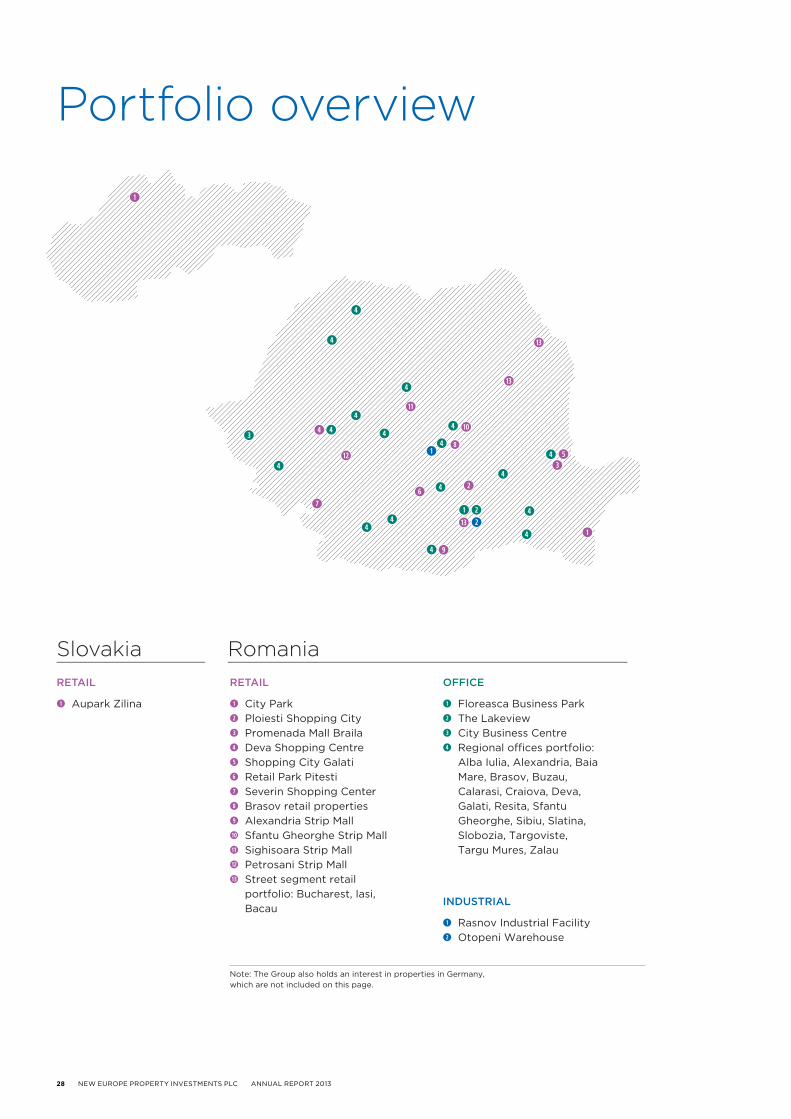
Slovakia RomaniaRETAIL
City Park Ploiesti Shopping City Promenada Mall Braila Deva Shopping Centre Shopping City Galati Retail Park Pitesti Severin Shopping Center Brasov retail properties Alexandria Strip Mall Sfantu Gheorghe Strip Mall Sighisoara Strip Mall Petrosani Strip Mall Street segment retail portfolio: Bucharest, Iasi, Bacau
OFFICE
Floreasca Business Park The Lakeview City Business Centre Regional oces portfolio: Alba Iulia, Alexandria, Baia Mare, Brasov, Buzau, Calarasi, Craiova, Deva, Galati, Resita, Sfantu Gheorghe, Sibiu, Slatina, Slobozia, Targoviste, Targu Mures, Zalau
INDUSTRIAL
Rasnov Industrial Facility Otopeni Warehouse
RETAIL
Aupark Zilina
Note: The Group also holds an interest in properties in Germany, which are not included on this page.
Portfolio overview

NEW EUROPE PROPERTY INVESTMENTS PLC ANNUAL REPORT 2013 29
Slovakia RomaniaRETAIL
City Park Ploiesti Shopping City Promenada Mall Braila Deva Shopping Centre Shopping City Galati Retail Park Pitesti Severin Shopping Center Brasov retail properties Alexandria Strip Mall Sfantu Gheorghe Strip Mall Sighisoara Strip Mall Petrosani Strip Mall Street segment retail portfolio: Bucharest, Iasi, Bacau
OFFICE
Floreasca Business Park The Lakeview City Business Centre Regional oces portfolio: Alba Iulia, Alexandria, Baia Mare, Brasov, Buzau, Calarasi, Craiova, Deva, Galati, Resita, Sfantu Gheorghe, Sibiu, Slatina, Slobozia, Targoviste, Targu Mures, Zalau
INDUSTRIAL
Rasnov Industrial Facility Otopeni Warehouse
RETAIL
Aupark Zilina
Note: The Group also holds an interest in properties in Germany, which are not included on this page.
Aupark ZilinaThis regional mall is located in the historic centre of Zilina (Slovakia), the capital of a region with 700,000 residents.
Lettable area 24,874m²
Ownership 100%
Property value €95.3 million
Occupancy 99.19%
Passing rent €6.8 million
Major tenantsBilla, C&A, Deichmann, H&M, Mango, New Yorker, Orsay, Subway, Takko, Tom Tailor, Tommy Hilfiger

30 NEW EUROPE PROPERTY INVESTMENTS PLC ANNUAL REPORT 2013
City ParkThis mall has a prime location in Constanta, close to the most popular Romanian seaside resorts. It has approved building rights which NEPI intends to use for the development of a significant fashion and leisure extension.
Lettable area 29,284m²
Ownership 100%
Property value €90 million
Occupancy 99.66%
Passing rent €7.4 million
Major tenantsAdidas, Bershka, Cora, Domo, KFC, Koton, LC Waikiki, McDonald’s, Pull&Bear, Stradivarius, Zara
Portfolio overview
NEW EUROPE PROPERTY INVESTMENTS PLC ANNUAL REPORT 2013 31
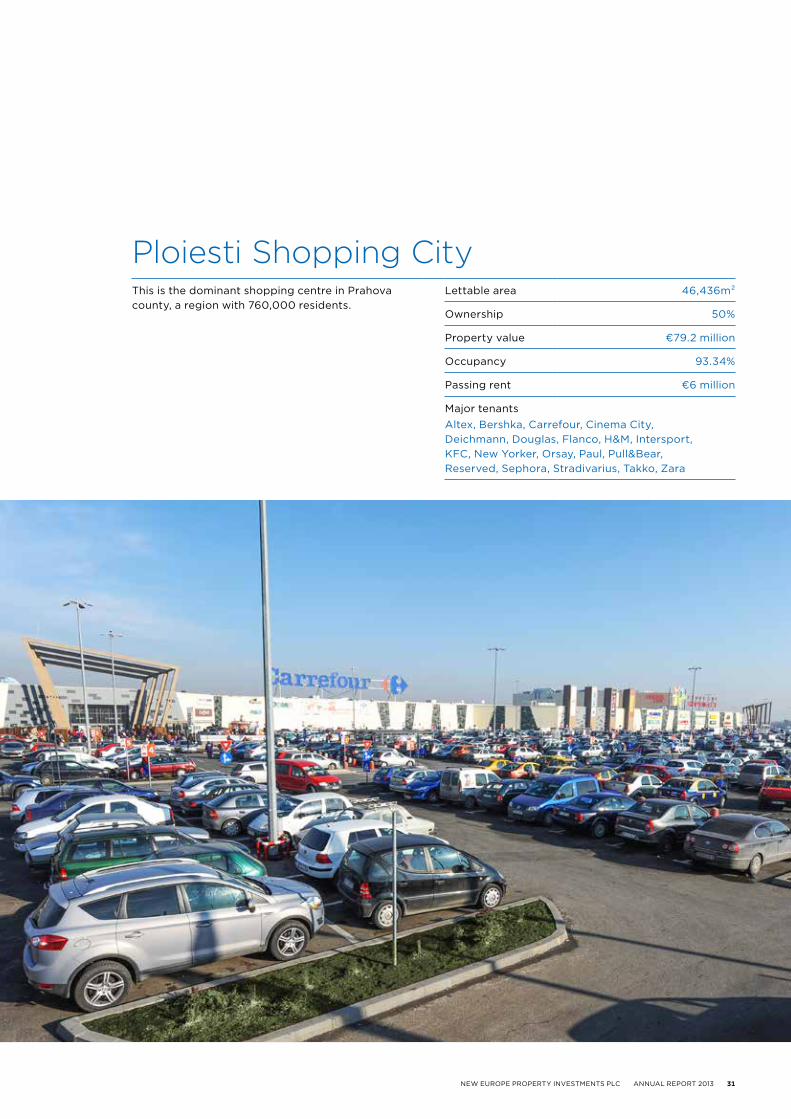
Ploiesti Shopping CityThis is the dominant shopping centre in Prahova county, a region with 760,000 residents.
Lettable area 46,436m²
Ownership 50%
Property value €79.2 million
Occupancy 93.34%
Passing rent €6 million
Major tenantsAltex, Bershka, Carrefour, Cinema City, Deichmann, Douglas, Flanco, H&M, Intersport, KFC, New Yorker, Orsay, Paul, Pull&Bear, Reserved, Sephora, Stradivarius, Takko, Zara
32 NEW EUROPE PROPERTY INVESTMENTS PLC ANNUAL REPORT 2013
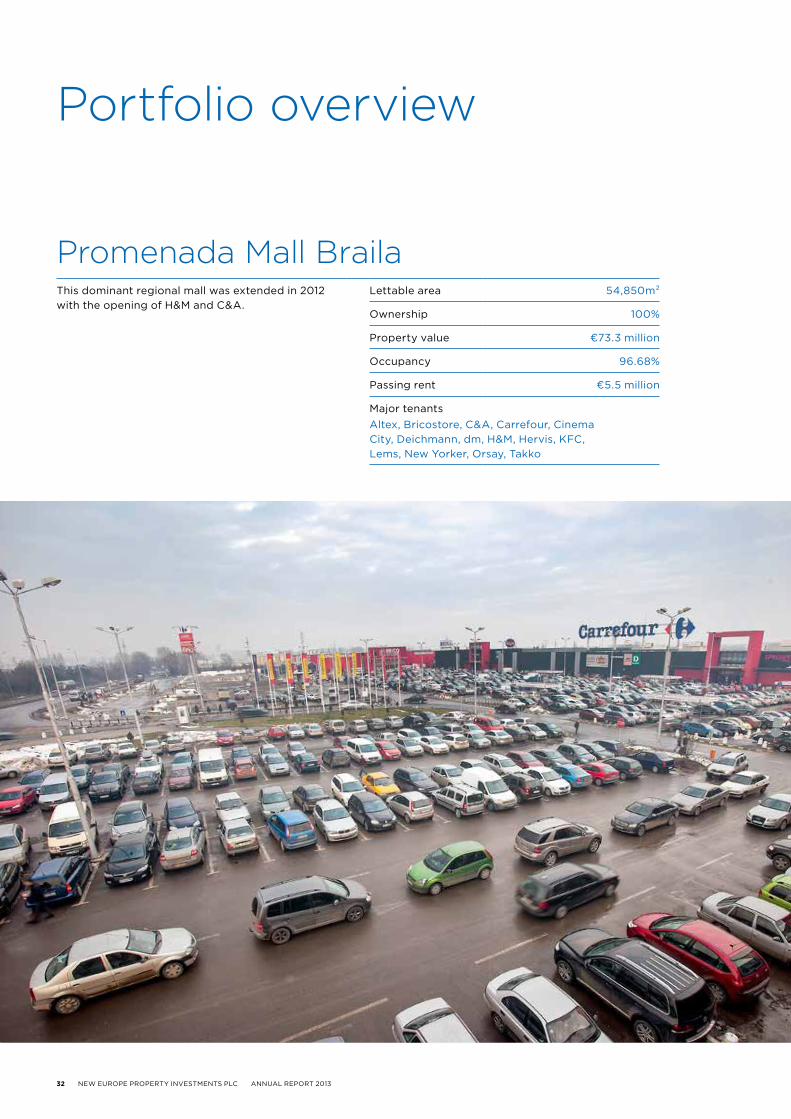
Promenada Mall BrailaThis dominant regional mall was extended in 2012 with the opening of H&M and C&A.
Lettable area 54,850m²
Ownership 100%
Property value €73.3 million
Occupancy 96.68%
Passing rent €5.5 million
Major tenantsAltex, Bricostore, C&A, Carrefour, Cinema City, Deichmann, dm, H&M, Hervis, KFC, Lems, New Yorker, Orsay, Takko
Portfolio overview
NEW EUROPE PROPERTY INVESTMENTS PLC ANNUAL REPORT 2013 33
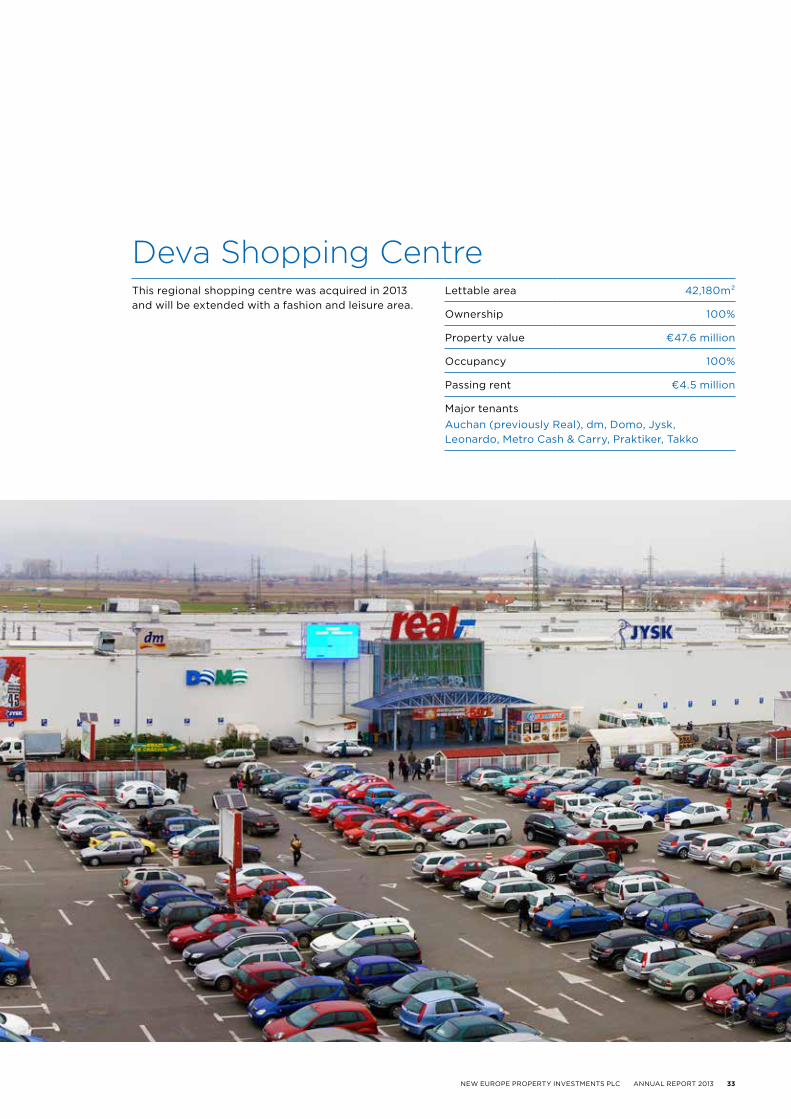
Deva Shopping CentreThis regional shopping centre was acquired in 2013 and will be extended with a fashion and leisure area.
Lettable area 42,180m²
Ownership 100%
Property value €47.6 million
Occupancy 100%
Passing rent €4.5 million
Major tenantsAuchan (previously Real), dm, Domo, Jysk, Leonardo, Metro Cash & Carry, Praktiker, Takko
34 NEW EUROPE PROPERTY INVESTMENTS PLC ANNUAL REPORT 2013
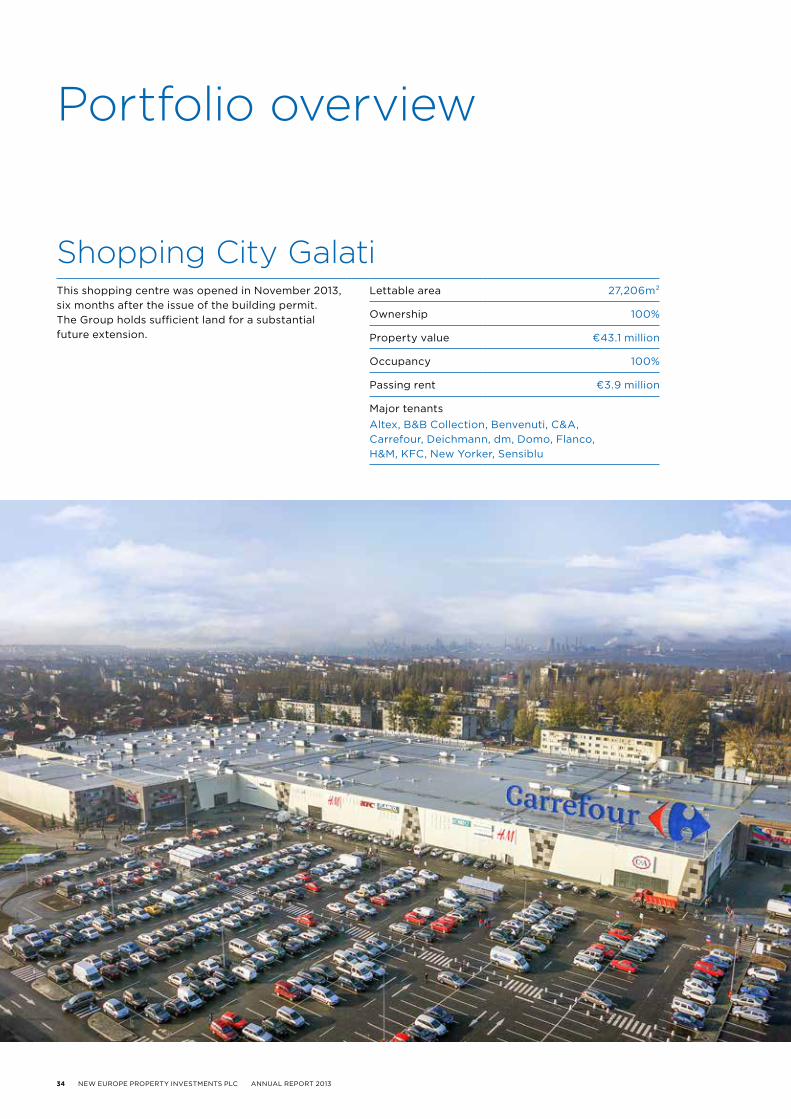
Shopping City GalatiThis shopping centre was opened in November 2013, six months after the issue of the building permit. The Group holds sufficient land for a substantial future extension.
Lettable area 27,206m²
Ownership 100%
Property value €43.1 million
Occupancy 100%
Passing rent €3.9 million
Major tenantsAltex, B&B Collection, Benvenuti, C&A, Carrefour, Deichmann, dm, Domo, Flanco, H&M, KFC, New Yorker, Sensiblu
Portfolio overview
NEW EUROPE PROPERTY INVESTMENTS PLC ANNUAL REPORT 2013 35
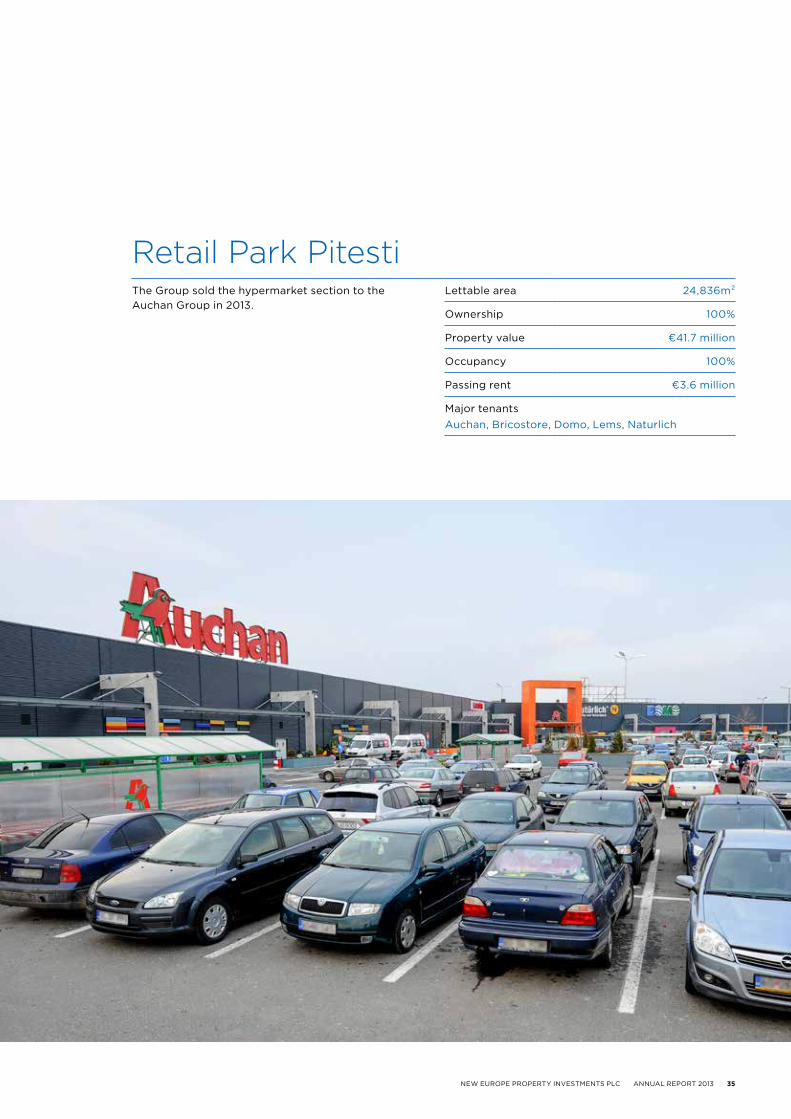
Retail Park PitestiThe Group sold the hypermarket section to the Auchan Group in 2013.
Lettable area 24,836m²
Ownership 100%
Property value €41.7 million
Occupancy 100%
Passing rent €3.6 million
Major tenantsAuchan, Bricostore, Domo, Lems, Naturlich
36 NEW EUROPE PROPERTY INVESTMENTS PLC ANNUAL REPORT 2013
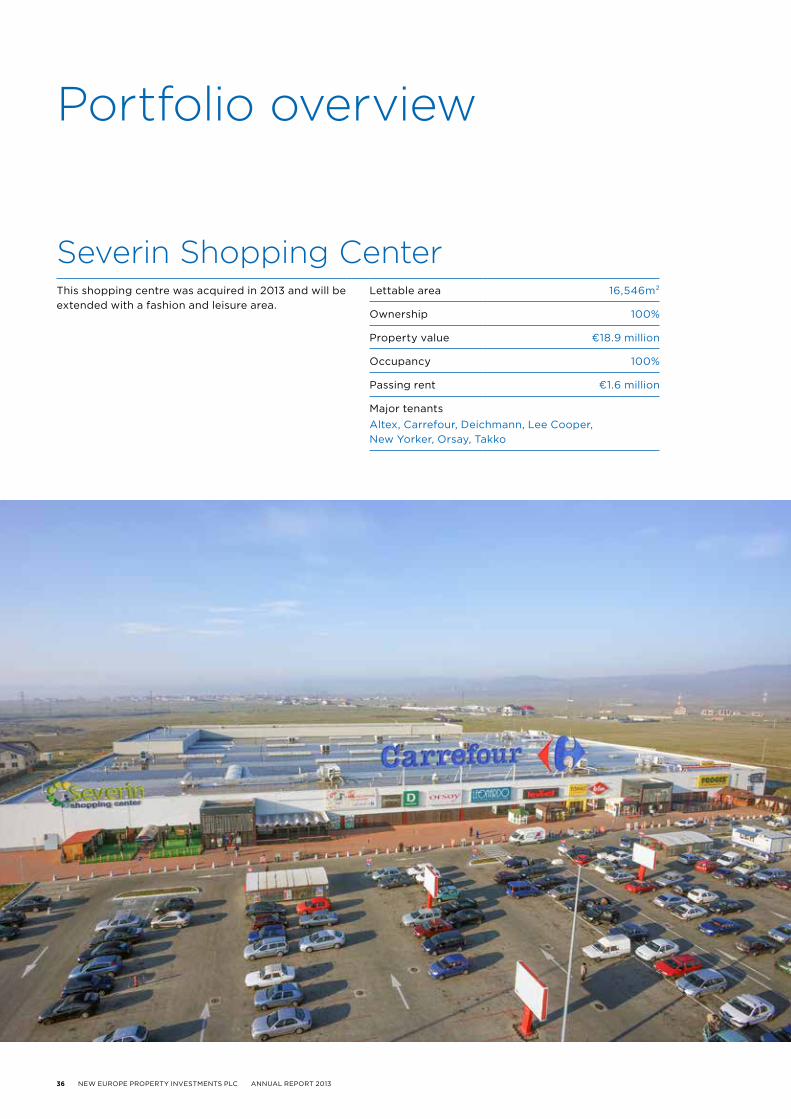
Severin Shopping CenterThis shopping centre was acquired in 2013 and will be extended with a fashion and leisure area.
Lettable area 16,546m²
Ownership 100%
Property value €18.9 million
Occupancy 100%
Passing rent €1.6 million
Major tenantsAltex, Carrefour, Deichmann, Lee Cooper, New Yorker, Orsay, Takko
Portfolio overview
NEW EUROPE PROPERTY INVESTMENTS PLC ANNUAL REPORT 2013 37
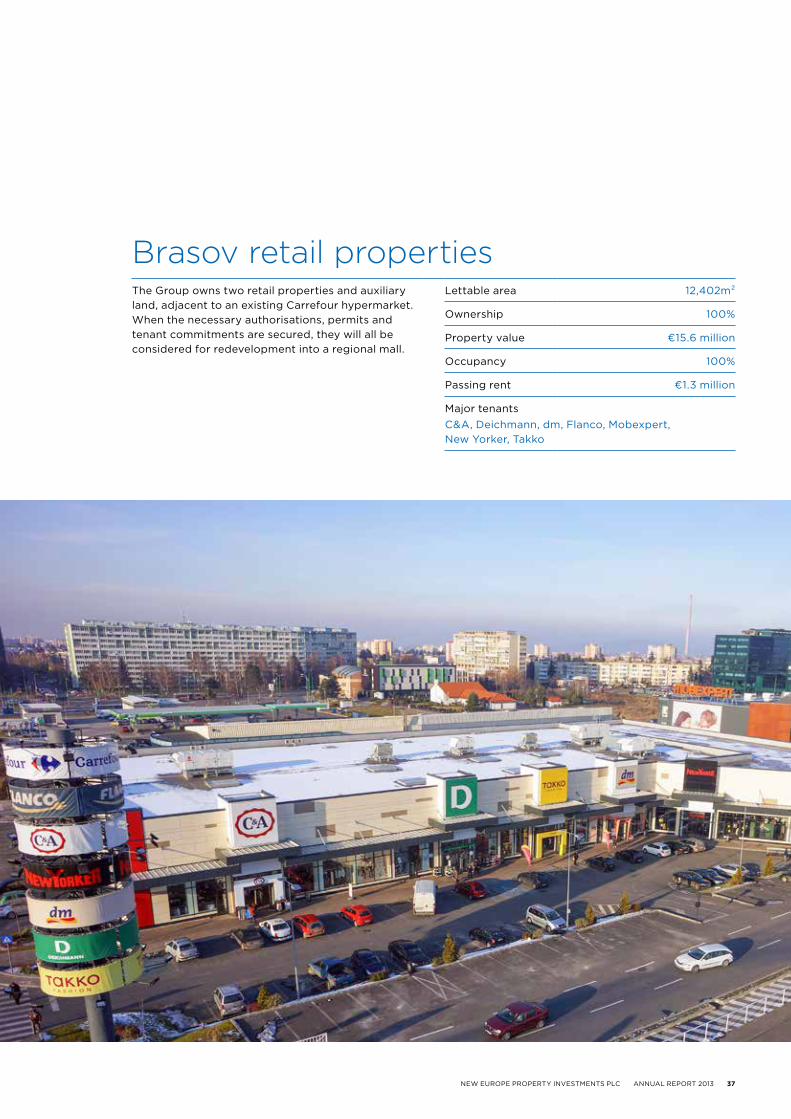
Brasov retail propertiesThe Group owns two retail properties and auxiliary land, adjacent to an existing Carrefour hypermarket. When the necessary authorisations, permits and tenant commitments are secured, they will all be considered for redevelopment into a regional mall.
Lettable area 12,402m²
Ownership 100%
Property value €15.6 million
Occupancy 100%
Passing rent €1.3 million
Major tenantsC&A, Deichmann, dm, Flanco, Mobexpert, New Yorker, Takko
38 NEW EUROPE PROPERTY INVESTMENTS PLC ANNUAL REPORT 2013
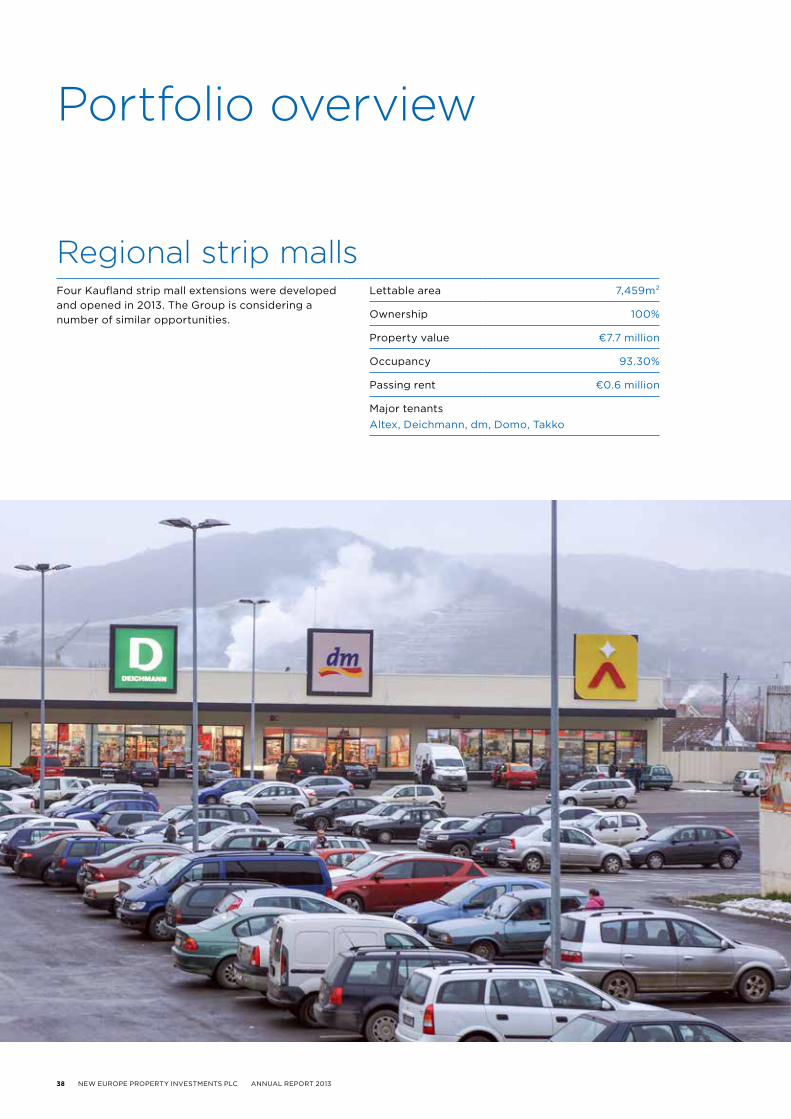
Regional strip mallsFour Kaufland strip mall extensions were developed and opened in 2013. The Group is considering a number of similar opportunities.
Lettable area 7,459m²
Ownership 100%
Property value €7.7 million
Occupancy 93.30%
Passing rent €0.6 million
Major tenantsAltex, Deichmann, dm, Domo, Takko
Portfolio overview

NEW EUROPE PROPERTY INVESTMENTS PLC ANNUAL REPORT 2013 39
Floreasca Business ParkFloreasca Business Park is located in the most attractive business area of Bucharest. The area has seen significant development in recent years with new A-grade buildings, a new shopping centre and new infrastructure providing improved access.
Lettable area 36,032m²
Ownership 100%
Property value €101.1 million
Occupancy 100%
Passing rent €8.5 million
Major tenantsAbbot, BASF, Berlin Chemie, Colliers, DHL, General Electric, Gorenje, Honeywell, L’Oreal, Sandoz, Xerox

40 NEW EUROPE PROPERTY INVESTMENTS PLC ANNUAL REPORT 2013
The LakeviewThis A-grade Bucharest office building was acquired in 2013. It is located close to Floreasca Business Park in the emerging office corridor between Floreasca and Barbu Vacarescu Streets in the north-east of Bucharest.
Lettable area 25,564m²
Ownership 100%
Property value €63.6 million
Occupancy 100%
Passing rent €5.6 million
Major tenantsAlcon, Colgate-Palmolive, Huawei, Phillips, PricewaterhouseCoopers, Royal Bank of Scotland
Portfolio overview

NEW EUROPE PROPERTY INVESTMENTS PLC ANNUAL REPORT 2013 41
City Business CentreCity Business Centre is the only A-grade office building in Timisoara, the third largest city in Romania.
Lettable area 27,151m²
Ownership 100%
Property value €55.5 million
Occupancy 99.79%
Passing rent €4.6 million
Major tenantsAlcatel, Deloitte, IBM, Microsoft, Raiffeisen Bank, UniCredit Tiriac Bank, Wipro

42 NEW EUROPE PROPERTY INVESTMENTS PLC ANNUAL REPORT 2013
Regional offices portfolioThis office portfolio consists of 17 office buildings situated in smaller Romanian cities.
Lettable area 40,581m²
Ownership 100%
Property value €28.1 million
Occupancy 87.76%
Passing rent €2.4 million
LocationsAlba Iulia, Alexandria, Baia Mare, Brasov, Buzau, Calarasi, Craiova, Deva, Galati, Resita, Sfantu Gheorghe, Sibiu, Slatina, Slobozia, Targoviste, Targu Mures, Zalau
Portfolio overview

NEW EUROPE PROPERTY INVESTMENTS PLC ANNUAL REPORT 2013 43
Industrial portfolioThe Group owns two industrial properties, Otopeni Warehouse in Bucharest, and Rasnov Industrial Facility in Rasnov, Brasov county.
Lettable area 27,842m²
Ownership 100%
Property value €16.9 million
Occupancy 98.56%
Passing rent €1.8 million
Major tenantsDelamode, Dexion, DM Elektron, PsiControl, UPS, Vodafone
RomaniaRETAIL
Mega Mall Vulcan Value Centre Targu Jiu Shopping City City Park extension Deva Shopping Centre extension Severin Shopping Center extension Vaslui Strip Mall Brasov Shopping City
OFFICE
The O�ce Victoriei O�ce
|100
|50
|-50
|150
|200
|250
|300
|350
|400
Dec 2013
Dec 2012
€ million
Money spent Commited Controlled
Note: capitalised interest is not included
|0
Finalised
projects currently under construction
projects with land controlled; construction not yet started
44 NEW EUROPE PROPERTY INVESTMENTS PLC ANNUAL REPORT 2013
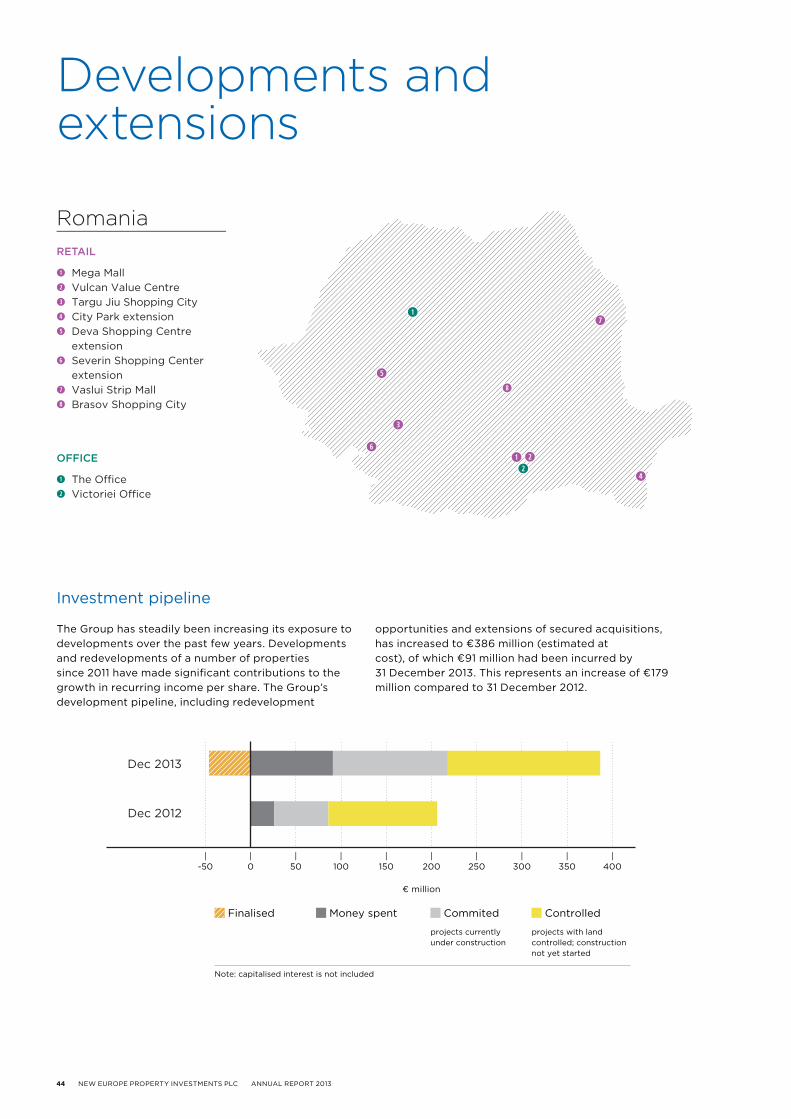
Investment pipeline
The Group has steadily been increasing its exposure to developments over the past few years. Developments and redevelopments of a number of properties since 2011 have made significant contributions to the growth in recurring income per share. The Group’s development pipeline, including redevelopment
opportunities and extensions of secured acquisitions, has increased to €386 million (estimated at cost), of which €91 million had been incurred by 31 December 2013. This represents an increase of €179 million compared to 31 December 2012.
Developments and extensions

RomaniaRETAIL
Mega Mall Vulcan Value Centre Targu Jiu Shopping City City Park extension Deva Shopping Centre extension Severin Shopping Center extension Vaslui Strip Mall Brasov Shopping City
OFFICE
The O�ce Victoriei O�ce
|100
|50
|-50
|150
|200
|250
|300
|350
|400
Dec 2013
Dec 2012
€ million
Money spent Commited Controlled
Note: capitalised interest is not included
|0
Finalised
projects currently under construction
projects with land controlled; construction not yet started
NEW EUROPE PROPERTY INVESTMENTS PLC ANNUAL REPORT 2013 45
Mega MallThis mall is developed in the east of Bucharest, a densely populated area which currently lacks modern retail space.
Lettable area 70,000m²
Ownership 70%
Opening Q2 2015
Major signed leasesAltex, Bata, C&A, Carrefour, Claire’s, Flanco, H&M, MAC, Mango, Noriel, Otter, Sensiblu, Tommy Hilfiger, Vodafone, Yves Rocher
render

46 NEW EUROPE PROPERTY INVESTMENTS PLC ANNUAL REPORT 2013
Vulcan Value CentreThis new value centre is currently under construction in a densely populated residential area in the south-west part of Bucharest.
Lettable area 24,900m²
Ownership 100%
Opening September 2014
Major signed leasesCarrefour, C&A, dm, Domo, Germanos, H&M, KFC, Leonardo, Noriel, Sensiblu, Takko, Vodafone
Developments and extensions
render

NEW EUROPE PROPERTY INVESTMENTS PLC ANNUAL REPORT 2013 47
Shopping City Targu JiuThe Group has started the development of this regional retail centre in Targu Jiu, the capital of a region with 350,000 residents and currently lacking modern retail facilities.
Targeted lettable area 27,000m²
Ownership 100%
Opening October 2014
Major signed leasesAltex, Carrefour, Claire’s, dm, H&M, Noriel, Salamander, Vodafone
render

48 NEW EUROPE PROPERTY INVESTMENTS PLC ANNUAL REPORT 2013
The OfficeNEPI is a co-developer in the first A-grade office building in Cluj-Napoca, the second largest city in Romania.
Targeted lettable area 54,400m²
Ownership 50%
Opening April 2014 (first phase)
Developments and extensions
render

NEW EUROPE PROPERTY INVESTMENTS PLC ANNUAL REPORT 2013 49
Victoriei OfficeVictoriei Office is a unique concept that not only includes the development of a modern office but also the refurbishment of a historical building. The project is located in Victoriei Square, in central Bucharest, and neighbours the Government building.
Targeted lettable area 8,000m²
Ownership 100%
Opening Q4 2015
render

50 NEW EUROPE PROPERTY INVESTMENTS PLC ANNUAL REPORT 2013
Corporate governance
The Board recognises the importance of sound corporate governance and endorses and monitors compliance with the King III Report on Corporate Governance in South Africa and the Quoted Companies Alliance Corporate Governance Guidelines for Smaller Quoted Companies. The Board confirms that the Company is compliant with the provisions of King III in all material respects. A register of the 75 King III principles and the extent of the Company’s compliance therewith is available on our website.
The Directors recognise the need to manage the Group with integrity and provide effective leadership based on an ethical foundation. This includes timely, relevant and meaningful reporting to its shareholders and other stakeholders providing a proper and objective perspective of the Company and its activities, directing the strategy and operations of the Company to build a sustainable business and considering short and long-term impacts of the strategy on the economy, society and the environment. The Board will ensure that the Group is seen to be a responsible corporate citizen through the implementation of the corporate governance policies provided below.
Board of Directors
The Board comprises four independent non-executive directors, one non-independent non-executive director and four executive directors. The roles of Chairman and CEO are clearly separated to ensure a balance of power and prevent any director from exercising unfettered powers of decision-making. The Directors of the Company are listed on pages 8 and 9 of the report. The main functions of the Board include:
— Adopting strategic plans and ensuring that these plans are carried out by management.
— Approving major matters, including capital funding, acquisitions, disposals, capital expenditure and financial statements.
— Monitoring the operational performance of the business and the performance of the management at both operational and executive level.
— Overseeing the effectiveness of the internal controls of the Company designed to ensure that the assets of the Company are safeguarded, that proper accounting records are maintained and that the financial information on which business decisions are made and which is issued for publication is reliable.
The Directors’ varied backgrounds and experience give NEPI a good mix of the knowledge and expertise necessary to manage the business effectively. Further to this, a clear division of responsibilities at Board level is in place to ensure a balance of power and authority, such that no one individual has unrestricted powers of decision-making. The Board aims to meet formally at least four times a year. There are no external advisors who regularly attend or are invited to attend Board committee meetings. The policies and procedures of the Company are also adopted by all subsidiaries.
The Board is confident that the Group has established effective framework and processes for compliance with laws, codes, rules and standards. There were no material or immaterial but often repeated regulatory penalties, sanctions or fines for contraventions or non-compliance with statutory obligations imposed on the companies or any of its directors or officers.
Appointment of Directors
Directors are appointed by the Board or at the Annual General Shareholders’ Meeting. Board appointed directors need to be re-appointed by the shareholders in the first subsequent annual general shareholders’ meeting to confirm such appointments. The longest serving third of the directors are required to be re-appointed by the shareholders annually. Board appointments are conducted in a formal and transparent manner by the Board as a whole.
investment CommitteeMembers: Desmond de Beer (Chairman), Jeffrey Zidel and Martin Slabbert
The Investment Committee considers all acquisitions, sales of investments and capital expenditures. Appropriate investments or disposals are then presented to the Board for consideration.
remuneration CommitteeMembers: Dewald Joubert (Chairman), Dan Pascariu and Desmond de Beer
The Remuneration Committee assesses and recommends to the Board the remuneration and incentivisation of the management and staff of the Company.
NEW EUROPE PROPERTY INVESTMENTS PLC ANNUAL REPORT 2013 51
nomination CommitteeMembers: Dan Pascariu (Chairman), Jeffrey Zidel and Michael Mills
The Nomination Committee assists the Board in identifying qualified individuals to become Board members and makes recommendations on the composition of the Board.
audit and risk CommitteeMembers: Michael Mills (Chairman), Dewald Joubert and Jeffrey Zidel
The Audit and Risk Committee, comprising three independent non-executive directors, meets at least four times a year and is responsible for ensuring that the financial performance of the Group is properly reported on and monitored, including reviewing the annual and interim accounts, results announcements, internal control systems and procedures, accounting policies and risk management.
The Board has delegated the responsibility for developing and monitoring the Group’s risk management policies to the Audit and Risk Committee. The Group’s risk management policies are established to identify and analyse the risks faced by the Group, to set appropriate risk limits and controls and to monitor risks and adherence to limits. The Directors assume overall responsibility for the Group’s system of internal control and for reviewing its effectiveness.
The controls are designed to identify and manage risks faced by the Group and not to completely eliminate the risk of failure to achieve business objectives. To this end, internal controls provide reasonable, but not absolute assurance against material misstatement or loss. The implementation and operation of such systems resides with the management and the processes are communicated regularly to its staff who are made aware of the areas they are responsible for. Such systems include strategic planning, the appointment of appropriately qualified staff, regular reporting and monitoring of performance and effective control over capital expenditure and investments. The internal financial control environment is considered appropriate for the size and activities of the Group.
Significant risks that are identified by these systems are communicated to the Board with the recommended risk mitigating actions.
The Group may use independent agents to undertake any specialist analysis, investigation or action that is needed. The systems are regularly reviewed by the Audit and Risk Committee.
Internal financial controls are based on a comprehensive and regular reporting structure. Detailed revenue, cash flow and capital forecasts are prepared and updated regularly throughout the year and approved by the Board.
The Audit and Risk Committee has primary responsibility for making recommendations to the Board on the appointment, re-appointment and removal of the external auditor. It ensures that the scope of the auditor’s work is sufficient and that the auditor is fairly remunerated. The Committee also oversees the appointment of the auditor for non-audit services, in line with Company policy. The Committee reviews audit plans for external audits and the outcome of the work performed in executing these plans. The Committee meets with the external auditor, discusses and reviews the accounts, the audit procedures and the Group’s internal controls.
The Board has determined that the Committee members have the skills and experience necessary to contribute meaningfully to the Committee’s deliberations. In addition, the Chairman has the requisite experience in accounting and financial management. The Audit and Risk Committee has considered and found appropriate the expertise and experience of the Finance Director.
The Committee met five times during the financial year. In fulfilling its responsibility of monitoring the integrity of financial reports to shareholders, the Audit and Risk Committee has reviewed the accounting principles, policies and practices adopted in the preparation of financial information and has examined documentation relating to the Annual Report and interim financial statements. The clarity of disclosures included in the financial statements was reviewed by the Audit and Risk Committee, as was the basis for significant estimates and judgements. The Audit and Risk Committee complied with its legal, regulatory and Company’s charter and recommended the Annual Report to the Board for approval.
52 NEW EUROPE PROPERTY INVESTMENTS PLC ANNUAL REPORT 2013
External audit
The external auditor confirmed to the Audit and Risk Committee its independence from the Group during the year. The Committee considered information pertaining to the external auditor’s relationships with the Group that might reasonably have a bearing on the external auditor’s independence and the audit engagement partner and staff’s objectivity, and the related safeguards and procedures, and has concluded that the external auditor’s independence was not impaired. The Committee approved the external auditor’s terms of engagement and scope of work. Currently, this includes the audit of the annual consolidated and separate financial statements. Based on written reports submitted, the Committee reviewed, with the external auditor, the findings of their work and confirmed that all significant matters had been satisfactorily resolved.
Governance of stakeholders’ relationships
The main stakeholders are considered to be the shareholders, the employees, the tenants, the suppliers, the public and fiscal administrations of the locations where the Group carries its activities and the banks with whom the Group entered into contractual agreements. The Group has a transparent information communication policy, with the purpose of enabling stakeholders to make an informed assessment of the Group’s economic value and allowing insight into the prospects for future value creation. The Group did not record any refusals of requests for information in terms of the Promotion of Access to Information Act (2000).
Internal audit
During 2011, the Group implemented an internal audit function performed by an independent, professional firm which reports directly to the Chief Executive Officer and the Chairman of the Audit and Risk Committee. The Group’s Internal auditor carries out risk oriented audits of operational and functional activities, according to the recommendations of the Audit and Risk Committee.
The Audit and Risk Committee also examined and discussed with the auditor the appropriateness of internal controls and utilisation of Internal auditor and made recommendations to the Board.
Company Secretary
All Directors have access to the advice of the Company Secretary, who provides guidance to the Board as a whole and to individual Directors with regard to how their responsibilities should properly be discharged in the best interests of the Company.
After careful consideration, the qualifications, experience and competence of the Company Secretary, Sabre Fiduciary Limited, represented by Cornelius Eduard Cassell, were deemed appropriate by the Board of Directors. The Board of Directors also concluded that the relationship with the Company Secretary is at arm’s length and there is no conflict of interests.
Corporate governance
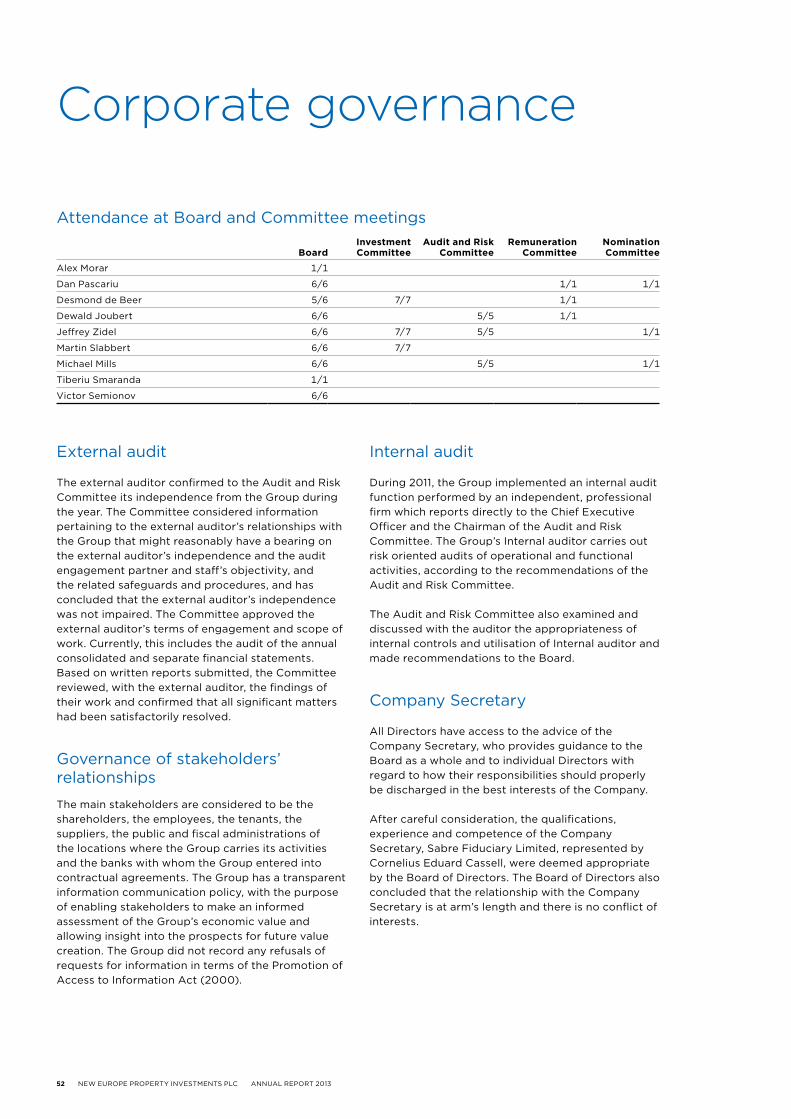
Attendance at Board and Committee meetings
boardinvestment Committee
audit and risk Committee
remuneration Committee
nomination Committee
Alex Morar 1/1
Dan Pascariu 6/6 1/1 1/1
Desmond de Beer 5/6 7/7 1/1
Dewald Joubert 6/6 5/5 1/1
Jeffrey Zidel 6/6 7/7 5/5 1/1
Martin Slabbert 6/6 7/7
Michael Mills 6/6 5/5 1/1
Tiberiu Smaranda 1/1
Victor Semionov 6/6

NEW EUROPE PROPERTY INVESTMENTS PLC ANNUAL REPORT 2013 53
Directors’ remuneration
The remuneration policy is aligned with the strategic objectives of the Group to create long-term sustainable value for shareholders.
Directors receive only base pay, as bonuses are not part of the Group’s policy. Executive salaries are competitive in the market and increases are determined with reference to individual performance, inflation and market related factors.
Participation in the share purchase schemes is restricted to employees and executive directors. Share purchase scheme awards are considered and allocated annually by the Remuneration Committee based on individual performance. The Group provides loan financing to employees and executive directors for acquiring shares. There are no separate share purchase schemes to encourage retention, aside from the share purchase schemes rewarding performance. Directors’ remuneration in 2013 is shown in Note 37 to the financial statements.
Governance of information technology
The Board of Directors confirms that there are processes in place to ensure complete, timely, relevant, accurate and accessible IT reporting from management to the Board and in the Annual Report.
Communication
The Board recognises that it is accountable to shareholders for the performance and activities of the Group. NEPI communicates with its shareholders principally through its website, Annual Report and announcements. Annual General Meetings of the Company give the Directors the opportunity to report to shareholders on current and proposed operations and enable shareholders to express their views on the Group’s business activities.
photo: shopping city galati, romania

54 NEW EUROPE PROPERTY INVESTMENTS PLC ANNUAL REPORT 2013
Directors’ dealings
Dealing in Company’s securities by Directors and Company officials is regulated and monitored as required by the JSE Listing Requirements, AIM Rules and BVB requirements. In addition, NEPI maintains a closed period from the end of a financial period to the date of publication of the financial results.
Ethics
NEPI is committed to acting ethically in all aspects of its business. Its ethical standards are based on the principles of honesty, integrity, fairness and transparency and focus on all of the Group’s shareholders, employees, customers, business partners, government, society, and the community at large.
employeesThe Group values its employees as the keystone to success and is therefore committed to treating all employees with dignity, trust, and respect, and to building a long-term relationship based on enforceable labour law and the respect of human rights.
CustomersCustomer satisfaction is an overriding concern of the Group and has a vital role in managing its properties. In this highly competitive environment, the success of the Group depends on properly meeting the customers’ needs and providing them with the best value for money.
governmentThe Group seeks to build and manage a sound relationship with governmental authorities on an arm’s length basis. No attempts to improperly influence governmental decisions offer, pay, solicit, or accept bribes in any form or shape are acceptable.
social and environmental responsibilityThe Group views itself as an integral part of the community in which it operates and is committed to a sound relationship built on respect, trust, honesty, and fairness. Not only is environmental compliance legally necessary, but it is also an important component of the Group’s obligation to the community and its good reputation. The Group therefore strives to minimize environmental impact of its activities by reducing waste, emissions and discharges, and by using energy efficiently.
Conflict of interestA conflict of interest arises when ever an employee’s position or responsibilities within the Group present an opportunity for personal gain that is otherwise inconsistent with the best interests of the Group. Each individual is responsible for his own ethical behaviour. They are expected to use their judgment to act, at all times and in all ways, in the best interests of the Group and if they consider that a conflict of interest may exist should promptly notify management.
insider trading policyThe Group prohibits all managers or employees the use of confidential and insider information that is not generally known or available to the public to their personal gain and interest.
equal employment and non-discriminationIt is the Group’s policy to maintain the highest ethical standards and comply with all applicable laws, rules, and regulations. The continued success of the Group is dependent upon employing the most qualified people and establishing a work environment that is free of discrimination, harassment, intimidation or coercion related to race, colour, religion, gender, age, national origin or disability.
Corporate governance
NEW EUROPE PROPERTY INVESTMENTS PLC ANNUAL REPORT 2013 55
The Group has appropriate internal risk management and control systems. Key elements of the internal control systems are: a management structure designed to enable effective decision making; monthly review of important indicators, such as turnovers in shopping centres, rent collection, vacancies, arrears and doubtful debtors, and weekly meetings held to review performance against budgets. Strict procedures are also observed for the periodic production of monthly, quarterly and annual figures on the basis of the adopted policies. The internal management reporting system is designed to identify developments in the value of investments and in income and expenses. Use is made of electronic data processing within automated information systems. There is a back-up and recovery plan in place so that data can be restored.
The Internal auditor provides detailed reports with suggested improvements on areas of interest for management. The Board reviews the external auditor’s findings on the Group’s internal control environment, supervises the internal control framework and procedures and takes action when necessary.
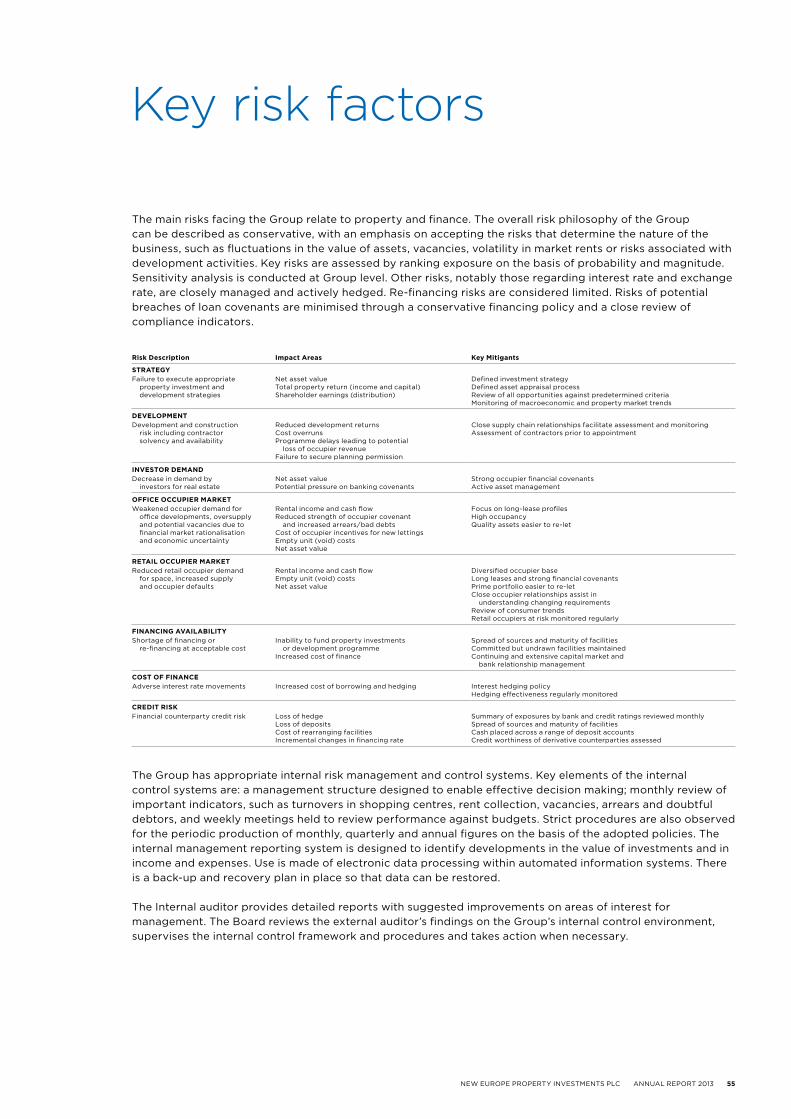
risk description impact areas Key mitigants
strategYFailure to execute appropriate
property investment and development strategies
Net asset valueTotal property return (income and capital)Shareholder earnings (distribution)
Defined investment strategyDefined asset appraisal processReview of all opportunities against predetermined criteriaMonitoring of macroeconomic and property market trends
developmentDevelopment and construction
risk including contractor solvency and availability
Reduced development returnsCost overrunsProgramme delays leading to potential
loss of occupier revenueFailure to secure planning permission
Close supply chain relationships facilitate assessment and monitoringAssessment of contractors prior to appointment
investor demandDecrease in demand by
investors for real estateNet asset valuePotential pressure on banking covenants
Strong occupier financial covenantsActive asset management
offiCe oCCupier marKetWeakened occupier demand for
office developments, oversupply and potential vacancies due to financial market rationalisation and economic uncertainty
Rental income and cash flowReduced strength of occupier covenant
and increased arrears/bad debtsCost of occupier incentives for new lettingsEmpty unit (void) costsNet asset value
Focus on long-lease profilesHigh occupancyQuality assets easier to re-let
retail oCCupier marKetReduced retail occupier demand
for space, increased supply and occupier defaults
Rental income and cash flowEmpty unit (void) costsNet asset value
Diversified occupier baseLong leases and strong financial covenantsPrime portfolio easier to re-letClose occupier relationships assist in
understanding changing requirementsReview of consumer trendsRetail occupiers at risk monitored regularly
finanCing availabilitYShortage of financing or
re-financing at acceptable costInability to fund property investments
or development programmeIncreased cost of finance
Spread of sources and maturity of facilitiesCommitted but undrawn facilities maintainedContinuing and extensive capital market and
bank relationship management
Cost of finanCeAdverse interest rate movements Increased cost of borrowing and hedging Interest hedging policy
Hedging effectiveness regularly monitored
Credit risKFinancial counterparty credit risk Loss of hedge
Loss of depositsCost of rearranging facilitiesIncremental changes in financing rate
Summary of exposures by bank and credit ratings reviewed monthlySpread of sources and maturity of facilitiesCash placed across a range of deposit accountsCredit worthiness of derivative counterparties assessed
The main risks facing the Group relate to property and finance. The overall risk philosophy of the Group can be described as conservative, with an emphasis on accepting the risks that determine the nature of the business, such as fluctuations in the value of assets, vacancies, volatility in market rents or risks associated with development activities. Key risks are assessed by ranking exposure on the basis of probability and magnitude. Sensitivity analysis is conducted at Group level. Other risks, notably those regarding interest rate and exchange rate, are closely managed and actively hedged. Re-financing risks are considered limited. Risks of potential breaches of loan covenants are minimised through a conservative financing policy and a close review of compliance indicators.
Key risk factors
56 NEW EUROPE PROPERTY INVESTMENTS PLC ANNUAL REPORT 2013
Sustainability report
NEPI is committed to developing buildings in a responsible and resource efficient manner. Minimising the environmental impact of its portfolio is achieved by implementing ecologically sustainable practices at all stages of building, design, construction, operation and renovation. The measures undertaken include:
— efficient use of water, energy and other resources throughout the design, construction and lifespan of the development;
— use of environmentally friendly materials;— thermal studies undertaken during design and
operation to improve building efficiency; for instance, at Floreasca Business Park additional insulation was attached to the underside of the first floor to minimise loss while at The Lakeview the facades’ execution flaws were eliminated;
— studies undertaken during design to reduce solar gain within buildings through the use of shading elements on facades, specification of glass or other related optimization solutions, which minimise the need for air conditioning;
— design focuses on increasing internal natural light, thereby reducing daytime energy consumption;
— the use of energy efficient lighting;— installing highly-efficient building
management systems to monitor and regulate energy consumption, and
— waste management and recycling initiatives are active throughout the construction and building’s life cycle.
The above resolutions ensure that environmental impact is minimised, capital expenditure and operating costs are reduced and guarantee a first-class environment.
WaterCompany policy regarding water usage is concerned with not only ensuring that the supply is of the highest quality, but also that water consumption is reduced to minimise expenditure. The purity of the water supply is of paramount importance, so, although this resource is supplied by the municipal network, it is cleansed further using mechanical filters.
Reducing consumption is achieved through a variety of strategies. Wherever possible, equipment is installed that detects leaks when they occur enabling them to be remedied immediately.
Water consumption has been significantly reduced in Floreasca Business Park and The Lakeview by utilising special faucets. These have proved so efficient they will be used in all further developments.
Where possible, waste water is collected, treated and then recycled in closed circuit systems used for non-potable requirements – anything other than drinking – such as lavatories and irrigation.
As a direct result of these policies water consumption in NEPI’s largest properties decreased by 4% in 2013 compared to 2012.
electricityReducing ongoing electricity expenditure by optimising consumption is one of the Group’s main objectives, and a number of strategies are employed to achieve this.
All new developments prioritise natural light, while low-energy bulbs, combined with light sensors where practicable, are used throughout. Shopping City Galati, opened in November 2013, is the first shopping centre in Romania to fully employ LED efficient lighting from opening date. A similar system will replace the ones currently used in Floreasca Business Park and The Lakeview.
The shopping centres and office buildings’ skylights are having a reflective film fitted to mitigate solar gain during the summer, reducing the need for air conditioning.
Escalators are fitted with motion sensors and stop automatically when not in use, while developments with multiple elevators use computerised systems to monitor keypad commands reducing overall lift movements.
As a direct result of these policies electricity consumption in NEPI’s largest properties decreased by 4.7% in 2013 compared to 2012.
Carbon dioxide emissionsNEPI is committed to minimising the carbon footprint of its portfolio by reducing associated carbon dioxide emissions.
Motor vehicles are a main source of carbon dioxide, so all the Group’s latest buildings, acquisitions and developments, namely Floreasca Business Park, City Business Centre, Victoriei Office, The Office and The Lakeview, are all within walking distance of subway, tram and bus routes.
NEW EUROPE PROPERTY INVESTMENTS PLC ANNUAL REPORT 2013 57
Current retail properties, as well as those being developed, such as Shopping City Galati and Vulcan Value Centre, are also located in close proximity to public transport. Where a centre is located on the outskirts of town, free bus transport is provided, combined with marketing campaigns encouraging customers to use them, as is the case in Promenada Mall Braila.
Waste managementThe Company is dedicated to maximising recycling and minimising landfill, and has set long-term objectives that will be regularly monitored to ensure consistent progress.
Unfortunately, the total volume of waste generated in a building is dependent on its tenants, an area where the Group has limited influence. Despite this, a number of initiatives are underway to educate occupants and encourage compliance with objectives. Tenants are regularly informed about on-site waste management processes and policy, while supplier purchasing contracts and green leases establish minimal requirements for the sorting and recycling of refuse.
The Group has also started replacing paper tissue dispensers with high-speed, very efficient hand driers, significantly reducing paper waste.
building research establishment environmental assessment method (breeam) certificationBREEAM is the world’s leading environmental assessment method and rating system. Buildings that obtain BREEAM recognition have achieved the highest corporate, organisational and environmental objectives, and set the standard for sustainable building design, construction and operation.
Over the past two years the Group has been committed to obtaining BREEAM certification for its largest assets:
— in 2009 The Lakeview was the first Romanian building awarded BREEAM ‘Very Good’ design certification;
— The Office was awarded BREEAM ‘Excellent’ interim design certification, and
— in August 2013, Floreasca Business Park became the first, and only Romanian building, awarded ‘Very Good’ BREEAM In Use certificate for a green development, while the property management team was awarded ‘Excellent’ BREEAM certification.
The asset management team is currently pursuing IN-USE BREEAM certification for The Lakeview, City Business Centre, Ploiesti Shopping City, Promenada Mall Braila and Shopping City Galati.
social responsibilityThe Group is committed to improving its impact on local communities and promoting social responsibility. Towards this end, throughout 2013, it was actively engaged in various campaigns and activities.
In September 2013, the Company organised a campaign to help people affected by the flood in Galati county, and nearly 100 tons of donated supplies were distributed as a result.
Together with local environmental NGOs, police stations, fire departments and the Red Cross, the Group organises social responsibility and risk awareness campaigns at its commercial centres and office buildings.
In Ploiesti Shopping City a large number of trees were planted in local parks, while at Braila Promenada Mall and Floreasca Business Park events were arranged to teach road safety regulations to children and to raise adults’ awareness on the importance of responsible driving.
Free skating and hockey lessons were offered at Promenada Mall Braila and Aupark Zilina respectively, and the Slovakian centre hosted a free science night for children, involving an exhibition of inventions and themed workshops.
historical buildingsAn existing historical monument, built by the famous Romanian architect Petre Antonescu who designed the city’s Arc de Triumf and City Hall, will be incorporated into the design of NEPI’s Victoriei Office project. Completed in 1927 and abandoned for years, it will be fully restored following a historical study of the Ministry of Culture’s Archives.
people managementNEPI started business six years ago with a headcount of only three. Today it comprises over one hundred people. The human resources policy is simple: to employ and retain the best people, and to utilise their knowledge, skill and effort to realise the Company’s full potential.
The remuneration policy encourages individual achievement, is comparable with the industry standard and is reviewed annually, based on the performance evaluation process.
NEPI has a social diversity employment policy and applies zero tolerance to any gender, age or ethnic discrimination.

photo: city business centre, timisoara, romania
NEW EUROPE PROPERTY INVESTMENTS PLC ANNUAL REPORT 2013 59
for the year ended 31 December 2013
Directors’ responsibility for the annual financial statements 60
Independent auditor’s report 61
Statement of financial position 62
Statement of income 63
Statement of comprehensive income 64
Statement of changes in equity 65
Statement of cash flows 67
Notes to the financial statements 68
Schedule of properties 128
Financial statements
60 NEW EUROPE PROPERTY INVESTMENTS PLC ANNUAL REPORT 2013
deClaration bY CompanY seCretarY
In terms of the Companies Act of South Africa 71 of 2008 (‘the Act’), as amended, I certify that the Company has lodged with the Registrar of Companies all such returns as are required of an external company registered in terms of ‘the Act’ and that all such returns are true, correct and up to date.
Cornelius eduard Cassell COMPANY SECRETARY
13 March 2014
Directors’ responsibility for the annual financial statements
The Directors are responsible for preparing the Directors’ Report, the annual financial statements of NEPI and the Group annual financial statements in accordance with applicable law and regulations. In addition, the Directors have elected to prepare the Group and Company financial statements in accordance with International Financial Reporting Standards.
The consolidated and separate financial statements are required to give a true and fair view of the state of affairs of the Group and Company and of the profit or loss of the Group and Company for that period.
In preparing these financial statements the Directors are required to:— select suitable accounting policies and then apply them consistently— make judgements and estimates that are reasonable and prudent— state whether they have been prepared in accordance with International Financial Reporting Standards— prepare the financial statements on the going concern basis unless it is inappropriate
to presume that the Group and Company will continue in business.
The Directors are responsible for keeping proper accounting records that disclose with reasonable accuracy at any time the financial position of the Company and to allow for the preparation of financial statements. They have general responsibility for taking such steps as are reasonably available to them to safeguard the assets of the Group and to prevent and detect fraud and other irregularities.
The Directors are responsible for the maintenance and integrity of the corporate and financial information included on the Company’s website.
The Directors have made an assessment of the Group’s and the Company’s ability to continue as a going concern and there is no reason to believe that the business will not be a going concern in the year ahead.
The Group and Company financial statements were approved by the Board of Directors on 13 March 2014 and signed on its behalf by:
martin slabbert victor semionovCHIEF EXECUTIVE OFFICER FINANCE DIRECTOR
NEW EUROPE PROPERTY INVESTMENTS PLC ANNUAL REPORT 2013 61
Independent Auditor’s report
We have audited the financial statements of New Europe Property Investments plc for the year ended 31 December 2013 which comprise the Group’s Statement of financial position, Statement of income, Statement of comprehensive income, Statement of changes in equity and Statement of cash flows, and the Company’s Statement of financial position, Statement of income, Statement of comprehensive income, Statement of changes in equity and Statement of cash flows and the related notes 1 to 38. The financial reporting framework that has been applied in their preparation is applicable law and International Financial Reporting Standards.
This report is made solely to the Company’s members, as a body. Our audit work has been undertaken so that we might state to the Company’s members those matters we are required to state to them in an auditor’s report and for no other purpose. To the fullest extent permitted by law, we do not accept or assume responsibility to anyone other than the Company and the Company’s members as a body for our audit work, for this report or for the opinions we have formed.
respective responsibilities of directors and auditorAs explained more fully in the Directors’ Responsibility for the Annual Financial Statements set out on page 60, the Directors are responsible for the preparation of the financial statements and for being satisfied that they give a true and fair view. Our responsibility is to audit and express an opinion on the financial statements in accordance with applicable law and International Standards on Auditing (UK and Ireland). Those standards require us to comply with the Auditing Practices Board’s Ethical Standards for Auditors.
scope of the audit of the financial statementsAn audit involves obtaining evidence about the amounts and disclosures in the financial statements sufficient to give reasonable assurance that the financial statements are free from material misstatement, whether caused by fraud or error. This includes an assessment of whether the accounting policies are appropriate to the Company’s and Group’s circumstances and have been consistently applied and adequately disclosed, the reasonableness of significant accounting estimates made by the Directors, and the overall presentation of the financial statements. In addition, we read all the financial and non-financial information in the Annual Report to identify material inconsistencies with the audited financial statements. If we become aware of any apparent material misstatements or inconsistencies we consider the implications for our report.
opinion on financial statementsIn our opinion the financial statements:
— give a true and fair view of the state of the Company’s and Group’s affairs as at 31 December 2013 and of the Company’s and Group’s profit for the year then ended
— have been properly prepared in accordance with International Financial Reporting Standards
Paul Francis Duffy For and on behalf of ernst & Young llC Chartered aCCountants DOUGLAS, ISLE OF MAN 14 March 2014
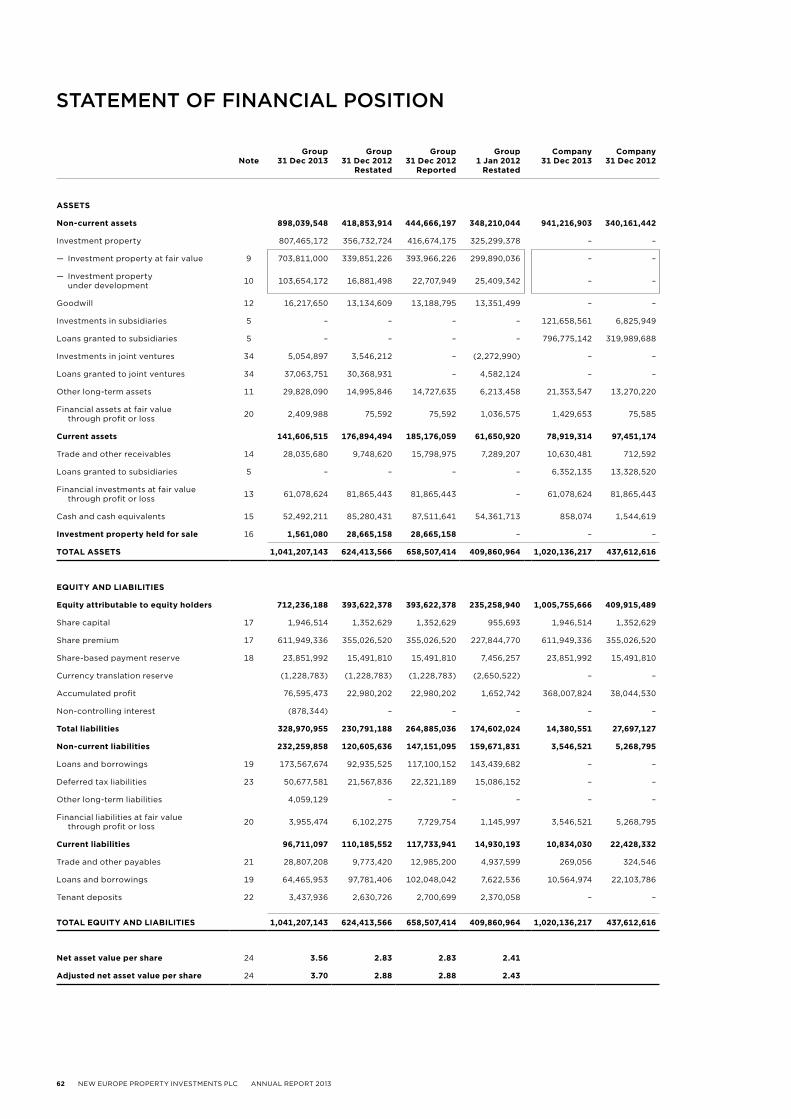
62 NEW EUROPE PROPERTY INVESTMENTS PLC ANNUAL REPORT 2013
StAtement of finAnCiAl PoSition
note
group 31 dec 2013
group 31 dec 2012
restated
group 31 dec 2012
reported
group 1 jan 2012
restated
Company 31 dec 2013
Company 31 dec 2012
assets
non-current assets 898,039,548 418,853,914 444,666,197 348,210,044 941,216,903 340,161,442
Investment property 807,465,172 356,732,724 416,674,175 325,299,378 – –
— Investment property at fair value 9 703,811,000 339,851,226 393,966,226 299,890,036 – –
— Investment property under development 10 103,654,172 16,881,498 22,707,949 25,409,342 – –
Goodwill 12 16,217,650 13,134,609 13,188,795 13,351,499 – –
Investments in subsidiaries 5 – – – – 121,658,561 6,825,949
Loans granted to subsidiaries 5 – – – – 796,775,142 319,989,688
Investments in joint ventures 34 5,054,897 3,546,212 – (2,272,990) – –
Loans granted to joint ventures 34 37,063,751 30,368,931 – 4,582,124 – –
Other long-term assets 11 29,828,090 14,995,846 14,727,635 6,213,458 21,353,547 13,270,220
Financial assets at fair value through profit or loss 20 2,409,988 75,592 75,592 1,036,575 1,429,653 75,585
Current assets 141,606,515 176,894,494 185,176,059 61,650,920 78,919,314 97,451,174
Trade and other receivables 14 28,035,680 9,748,620 15,798,975 7,289,207 10,630,481 712,592
Loans granted to subsidiaries 5 – – – – 6,352,135 13,328,520
Financial investments at fair value through profit or loss 13 61,078,624 81,865,443 81,865,443 – 61,078,624 81,865,443
Cash and cash equivalents 15 52,492,211 85,280,431 87,511,641 54,361,713 858,074 1,544,619
investment property held for sale 16 1,561,080 28,665,158 28,665,158 – – –
total assets 1,041,207,143 624,413,566 658,507,414 409,860,964 1,020,136,217 437,612,616
eQuitY and liabilities
equity attributable to equity holders 712,236,188 393,622,378 393,622,378 235,258,940 1,005,755,666 409,915,489
Share capital 17 1,946,514 1,352,629 1,352,629 955,693 1,946,514 1,352,629
Share premium 17 611,949,336 355,026,520 355,026,520 227,844,770 611,949,336 355,026,520
Share-based payment reserve 18 23,851,992 15,491,810 15,491,810 7,456,257 23,851,992 15,491,810
Currency translation reserve (1,228,783) (1,228,783) (1,228,783) (2,650,522) – –
Accumulated profit 76,595,473 22,980,202 22,980,202 1,652,742 368,007,824 38,044,530
Non-controlling interest (878,344) – – – – –
total liabilities 328,970,955 230,791,188 264,885,036 174,602,024 14,380,551 27,697,127
non-current liabilities 232,259,858 120,605,636 147,151,095 159,671,831 3,546,521 5,268,795
Loans and borrowings 19 173,567,674 92,935,525 117,100,152 143,439,682 – –
Deferred tax liabilities 23 50,677,581 21,567,836 22,321,189 15,086,152 – –
Other long-term liabilities 4,059,129 – – – – –
Financial liabilities at fair value through profit or loss 20 3,955,474 6,102,275 7,729,754 1,145,997 3,546,521 5,268,795
Current liabilities 96,711,097 110,185,552 117,733,941 14,930,193 10,834,030 22,428,332
Trade and other payables 21 28,807,208 9,773,420 12,985,200 4,937,599 269,056 324,546
Loans and borrowings 19 64,465,953 97,781,406 102,048,042 7,622,536 10,564,974 22,103,786
Tenant deposits 22 3,437,936 2,630,726 2,700,699 2,370,058 – –
total eQuitY and liabilities 1,041,207,143 624,413,566 658,507,414 409,860,964 1,020,136,217 437,612,616
net asset value per share 24 3.56 2.83 2.83 2.41
adjusted net asset value per share 24 3.70 2.88 2.88 2.43
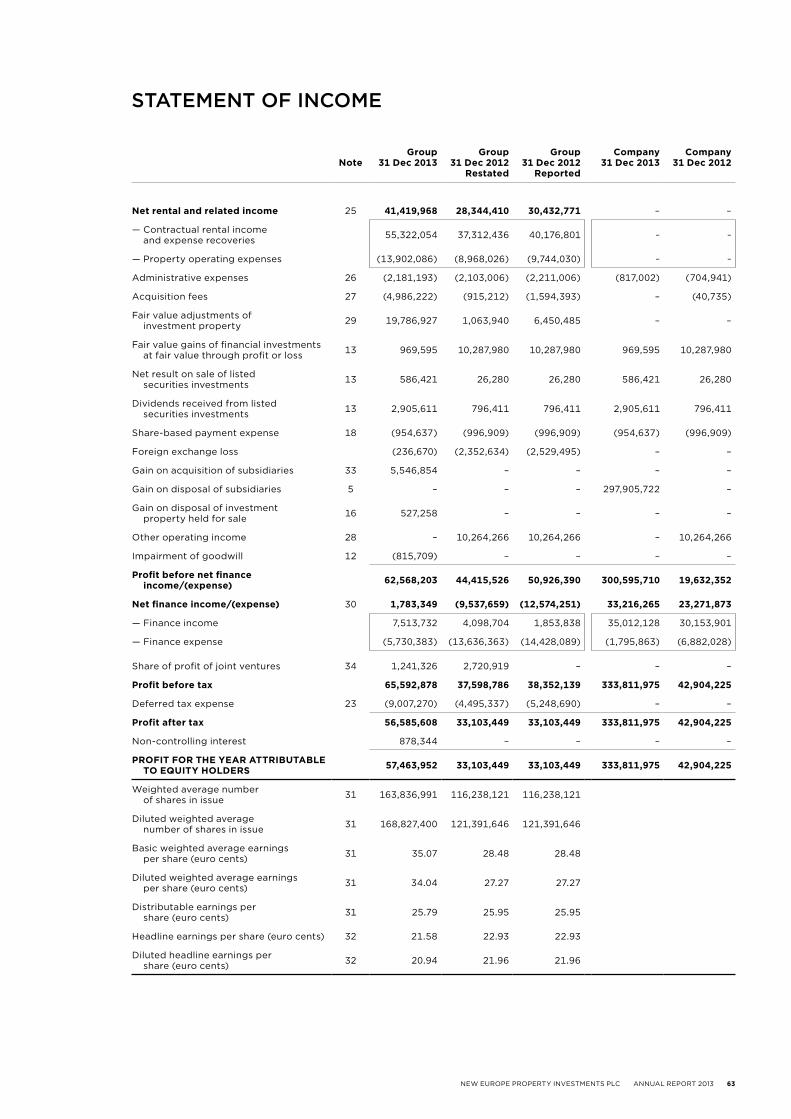
NEW EUROPE PROPERTY INVESTMENTS PLC ANNUAL REPORT 2013 63
StAtement of inCome
note
group 31 dec 2013
group 31 dec 2012
restated
group 31 dec 2012
reported
Company 31 dec 2013
Company 31 dec 2012
net rental and related income 25 41,419,968 28,344,410 30,432,771 – –
— Contractual rental income and expense recoveries 55,322,054 37,312,436 40,176,801 – –
— Property operating expenses (13,902,086) (8,968,026) (9,744,030) – –
Administrative expenses 26 (2,181,193) (2,103,006) (2,211,006) (817,002) (704,941)
Acquisition fees 27 (4,986,222) (915,212) (1,594,393) – (40,735)
Fair value adjustments of investment property 29 19,786,927 1,063,940 6,450,485 – –
Fair value gains of financial investments at fair value through profit or loss 13 969,595 10,287,980 10,287,980 969,595 10,287,980
Net result on sale of listed securities investments 13 586,421 26,280 26,280 586,421 26,280
Dividends received from listed securities investments 13 2,905,611 796,411 796,411 2,905,611 796,411
Share-based payment expense 18 (954,637) (996,909) (996,909) (954,637) (996,909)
Foreign exchange loss (236,670) (2,352,634) (2,529,495) – –
Gain on acquisition of subsidiaries 33 5,546,854 – – – –
Gain on disposal of subsidiaries 5 – – – 297,905,722 –
Gain on disposal of investment property held for sale 16 527,258 – – – –
Other operating income 28 – 10,264,266 10,264,266 – 10,264,266
Impairment of goodwill 12 (815,709) – – – –
profit before net finance income/(expense) 62,568,203 44,415,526 50,926,390 300,595,710 19,632,352
net finance income/(expense) 30 1,783,349 (9,537,659) (12,574,251) 33,216,265 23,271,873
— Finance income 7,513,732 4,098,704 1,853,838 35,012,128 30,153,901
— Finance expense (5,730,383) (13,636,363) (14,428,089) (1,795,863) (6,882,028)
Share of profit of joint ventures 34 1,241,326 2,720,919 – – –
profit before tax 65,592,878 37,598,786 38,352,139 333,811,975 42,904,225
Deferred tax expense 23 (9,007,270) (4,495,337) (5,248,690) – –
profit after tax 56,585,608 33,103,449 33,103,449 333,811,975 42,904,225
Non-controlling interest 878,344 – – – –
profit for the Year attributable to eQuitY holders 57,463,952 33,103,449 33,103,449 333,811,975 42,904,225
Weighted average number of shares in issue 31 163,836,991 116,238,121 116,238,121
Diluted weighted average number of shares in issue 31 168,827,400 121,391,646 121,391,646
Basic weighted average earnings per share (euro cents) 31 35.07 28.48 28.48
Diluted weighted average earnings per share (euro cents) 31 34.04 27.27 27.27
Distributable earnings per share (euro cents) 31 25.79 25.95 25.95
Headline earnings per share (euro cents) 32 21.58 22.93 22.93
Diluted headline earnings per share (euro cents) 32 20.94 21.96 21.96
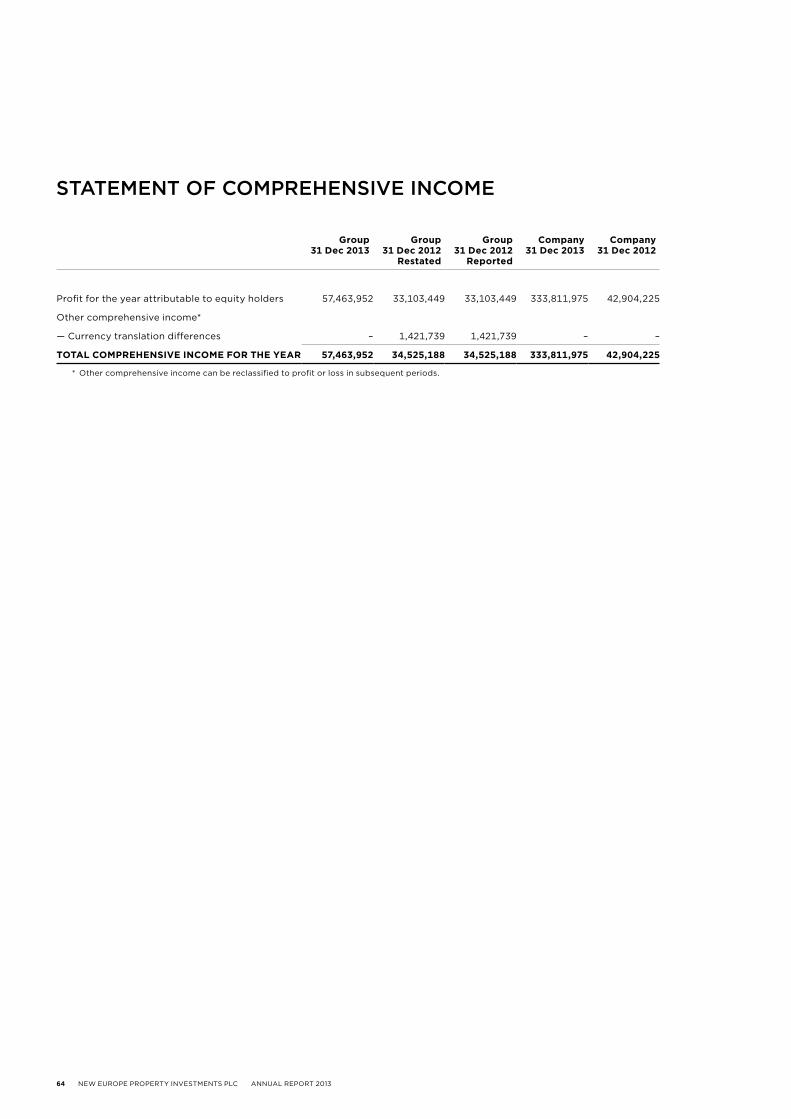
64 NEW EUROPE PROPERTY INVESTMENTS PLC ANNUAL REPORT 2013
StAtement of ComPreHenSive inCome
group 31 dec 2013
group 31 dec 2012
restated
group 31 dec 2012
reported
Company 31 dec 2013
Company 31 dec 2012
Profit for the year attributable to equity holders 57,463,952 33,103,449 33,103,449 333,811,975 42,904,225
Other comprehensive income*
— Currency translation differences – 1,421,739 1,421,739 – –
total Comprehensive inCome for the Year 57,463,952 34,525,188 34,525,188 333,811,975 42,904,225
* Other comprehensive income can be reclassified to profit or loss in subsequent periods.
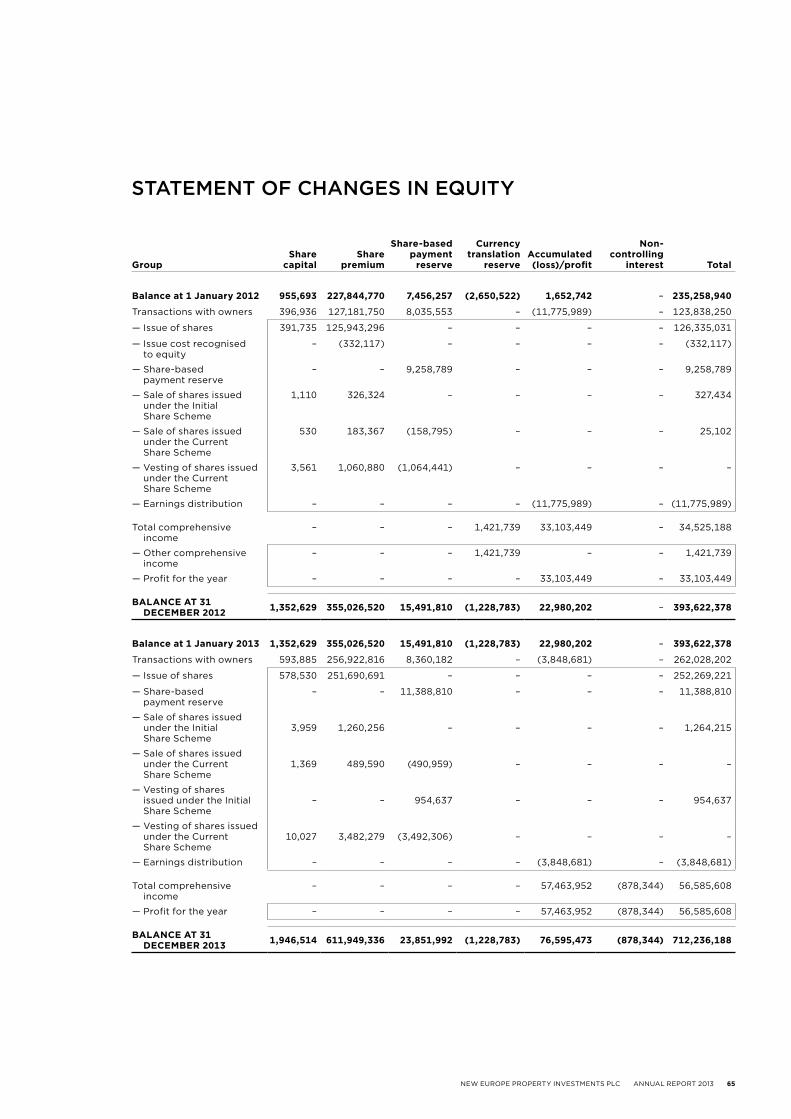
NEW EUROPE PROPERTY INVESTMENTS PLC ANNUAL REPORT 2013 65
StAtement of CHAngeS in eQuitY
groupshare
capitalshare
premium
share-based payment
reserve
Currency translation
reserveaccumulated (loss)/profit
non-controlling
interest total
balance at 1 january 2012 955,693 227,844,770 7,456,257 (2,650,522) 1,652,742 – 235,258,940
Transactions with owners 396,936 127,181,750 8,035,553 – (11,775,989) – 123,838,250
— Issue of shares 391,735 125,943,296 – – – – 126,335,031
— Issue cost recognised to equity
– (332,117) – – – – (332,117)
— Share-based payment reserve
– – 9,258,789 – – – 9,258,789
— Sale of shares issued under the Initial Share Scheme
1,110 326,324 – – – – 327,434
— Sale of shares issued under the Current Share Scheme
530 183,367 (158,795) – – – 25,102
— Vesting of shares issued under the Current Share Scheme
3,561 1,060,880 (1,064,441) – – – –
— Earnings distribution – – – – (11,775,989) – (11,775,989)
Total comprehensive income
– – – 1,421,739 33,103,449 – 34,525,188
— Other comprehensive income
– – – 1,421,739 – – 1,421,739
— Profit for the year – – – – 33,103,449 – 33,103,449
balanCe at 31 deCember 2012 1,352,629 355,026,520 15,491,810 (1,228,783) 22,980,202 – 393,622,378
balance at 1 january 2013 1,352,629 355,026,520 15,491,810 (1,228,783) 22,980,202 – 393,622,378
Transactions with owners 593,885 256,922,816 8,360,182 – (3,848,681) – 262,028,202
— Issue of shares 578,530 251,690,691 – – – – 252,269,221
— Share-based payment reserve
– – 11,388,810 – – – 11,388,810
— Sale of shares issued under the Initial Share Scheme
3,959 1,260,256 – – – – 1,264,215
— Sale of shares issued under the Current Share Scheme
1,369 489,590 (490,959) – – – –
— Vesting of shares issued under the Initial Share Scheme
– – 954,637 – – – 954,637
— Vesting of shares issued under the Current Share Scheme
10,027 3,482,279 (3,492,306) – – – –
— Earnings distribution – – – – (3,848,681) – (3,848,681)
Total comprehensive income
– – – – 57,463,952 (878,344) 56,585,608
— Profit for the year – – – – 57,463,952 (878,344) 56,585,608
balanCe at 31 deCember 2013 1,946,514 611,949,336 23,851,992 (1,228,783) 76,595,473 (878,344) 712,236,188
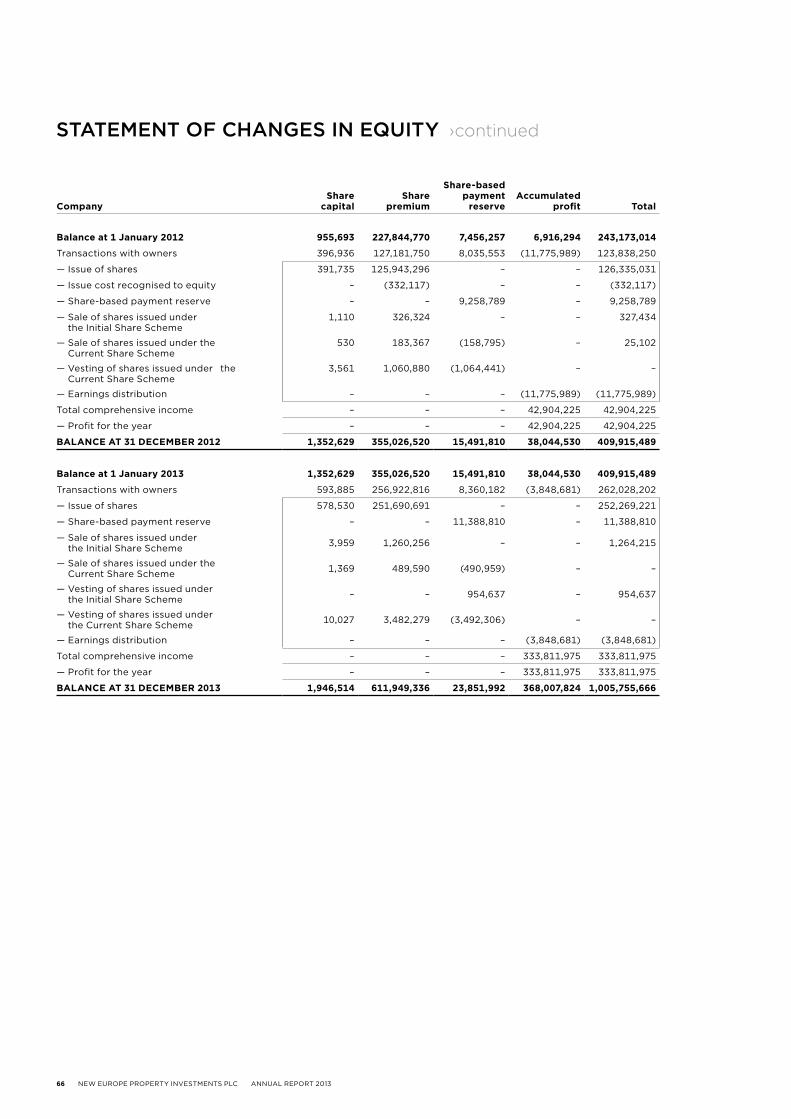
66 NEW EUROPE PROPERTY INVESTMENTS PLC ANNUAL REPORT 2013
StAtement of CHAngeS in eQuitY ›continued
Companyshare
capitalshare
premium
share-based payment
reserveaccumulated
profit total
balance at 1 january 2012 955,693 227,844,770 7,456,257 6,916,294 243,173,014
Transactions with owners 396,936 127,181,750 8,035,553 (11,775,989) 123,838,250
— Issue of shares 391,735 125,943,296 – – 126,335,031
— Issue cost recognised to equity – (332,117) – – (332,117)
— Share-based payment reserve – – 9,258,789 – 9,258,789
— Sale of shares issued under the Initial Share Scheme
1,110 326,324 – – 327,434
— Sale of shares issued under the Current Share Scheme
530 183,367 (158,795) – 25,102
— Vesting of shares issued under the Current Share Scheme
3,561 1,060,880 (1,064,441) – –
— Earnings distribution – – – (11,775,989) (11,775,989)
Total comprehensive income – – – 42,904,225 42,904,225
— Profit for the year – – – 42,904,225 42,904,225
balanCe at 31 deCember 2012 1,352,629 355,026,520 15,491,810 38,044,530 409,915,489
balance at 1 january 2013 1,352,629 355,026,520 15,491,810 38,044,530 409,915,489
Transactions with owners 593,885 256,922,816 8,360,182 (3,848,681) 262,028,202
— Issue of shares 578,530 251,690,691 – – 252,269,221
— Share-based payment reserve – – 11,388,810 – 11,388,810
— Sale of shares issued under the Initial Share Scheme 3,959 1,260,256 – – 1,264,215
— Sale of shares issued under the Current Share Scheme 1,369 489,590 (490,959) – –
— Vesting of shares issued under the Initial Share Scheme – – 954,637 – 954,637
— Vesting of shares issued under the Current Share Scheme 10,027 3,482,279 (3,492,306) – –
— Earnings distribution – – – (3,848,681) (3,848,681)
Total comprehensive income – – – 333,811,975 333,811,975
— Profit for the year – – – 333,811,975 333,811,975
balanCe at 31 deCember 2013 1,946,514 611,949,336 23,851,992 368,007,824 1,005,755,666
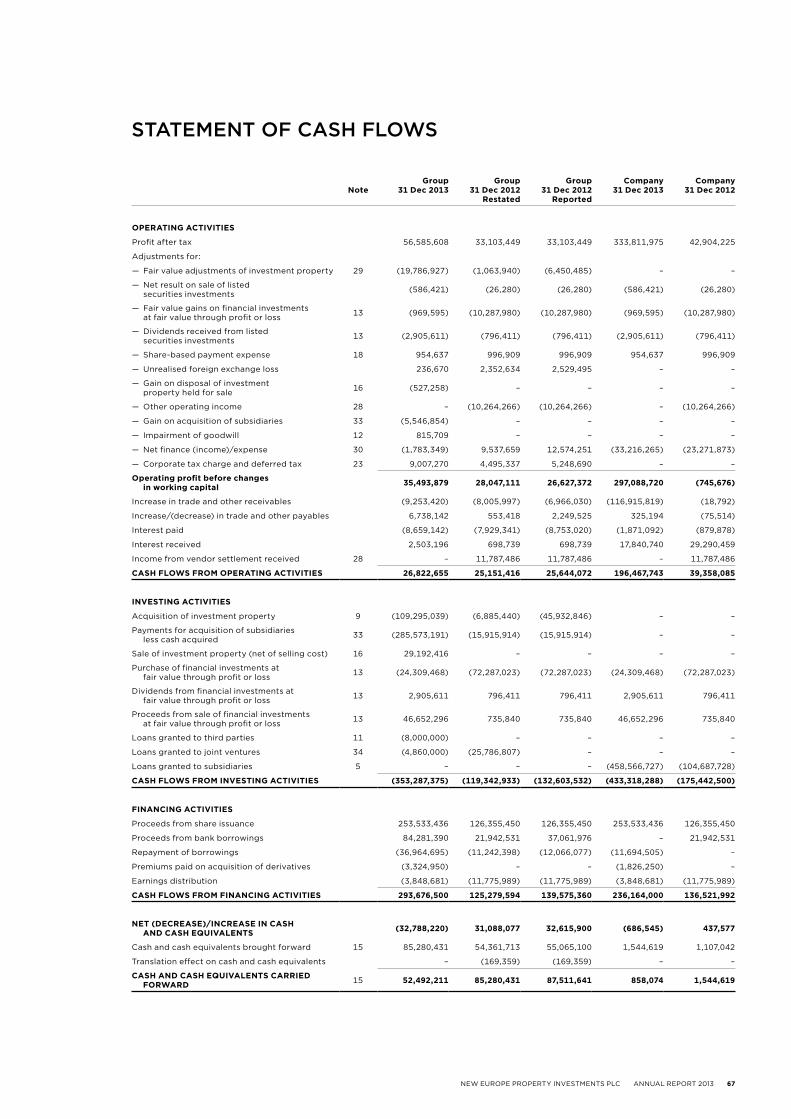
NEW EUROPE PROPERTY INVESTMENTS PLC ANNUAL REPORT 2013 67
StAtement of CASH flowS
note
group 31 dec 2013
group 31 dec 2012
restated
group 31 dec 2012
reported
Company 31 dec 2013
Company 31 dec 2012
operating aCtivities
Profit after tax 56,585,608 33,103,449 33,103,449 333,811,975 42,904,225
Adjustments for:
— Fair value adjustments of investment property 29 (19,786,927) (1,063,940) (6,450,485) – –
— Net result on sale of listed securities investments (586,421) (26,280) (26,280) (586,421) (26,280)
— Fair value gains on financial investments at fair value through profit or loss 13 (969,595) (10,287,980) (10,287,980) (969,595) (10,287,980)
— Dividends received from listed securities investments 13 (2,905,611) (796,411) (796,411) (2,905,611) (796,411)
— Share-based payment expense 18 954,637 996,909 996,909 954,637 996,909
— Unrealised foreign exchange loss 236,670 2,352,634 2,529,495 – –
— Gain on disposal of investment property held for sale 16 (527,258) – – – –
— Other operating income 28 – (10,264,266) (10,264,266) – (10,264,266)
— Gain on acquisition of subsidiaries 33 (5,546,854) – – – –
— Impairment of goodwill 12 815,709 – – – –
— Net finance (income)/expense 30 (1,783,349) 9,537,659 12,574,251 (33,216,265) (23,271,873)
— Corporate tax charge and deferred tax 23 9,007,270 4,495,337 5,248,690 – –
operating profit before changes in working capital 35,493,879 28,047,111 26,627,372 297,088,720 (745,676)
Increase in trade and other receivables (9,253,420) (8,005,997) (6,966,030) (116,915,819) (18,792)
Increase/(decrease) in trade and other payables 6,738,142 553,418 2,249,525 325,194 (75,514)
Interest paid (8,659,142) (7,929,341) (8,753,020) (1,871,092) (879,878)
Interest received 2,503,196 698,739 698,739 17,840,740 29,290,459
Income from vendor settlement received 28 – 11,787,486 11,787,486 – 11,787,486
Cash floWs from operating aCtivities 26,822,655 25,151,416 25,644,072 196,467,743 39,358,085
investing aCtivities
Acquisition of investment property 9 (109,295,039) (6,885,440) (45,932,846) – –
Payments for acquisition of subsidiaries less cash acquired 33 (285,573,191) (15,915,914) (15,915,914) – –
Sale of investment property (net of selling cost) 16 29,192,416 – – – –
Purchase of financial investments at fair value through profit or loss 13 (24,309,468) (72,287,023) (72,287,023) (24,309,468) (72,287,023)
Dividends from financial investments at fair value through profit or loss 13 2,905,611 796,411 796,411 2,905,611 796,411
Proceeds from sale of financial investments at fair value through profit or loss 13 46,652,296 735,840 735,840 46,652,296 735,840
Loans granted to third parties 11 (8,000,000) – – – –
Loans granted to joint ventures 34 (4,860,000) (25,786,807) – – –
Loans granted to subsidiaries 5 – – – (458,566,727) (104,687,728)
Cash floWs from investing aCtivities (353,287,375) (119,342,933) (132,603,532) (433,318,288) (175,442,500)
finanCing aCtivities
Proceeds from share issuance 253,533,436 126,355,450 126,355,450 253,533,436 126,355,450
Proceeds from bank borrowings 84,281,390 21,942,531 37,061,976 – 21,942,531
Repayment of borrowings (36,964,695) (11,242,398) (12,066,077) (11,694,505) –
Premiums paid on acquisition of derivatives (3,324,950) – – (1,826,250) –
Earnings distribution (3,848,681) (11,775,989) (11,775,989) (3,848,681) (11,775,989)
Cash floWs from finanCing aCtivities 293,676,500 125,279,594 139,575,360 236,164,000 136,521,992
net (deCrease)/inCrease in Cash and Cash eQuivalents (32,788,220) 31,088,077 32,615,900 (686,545) 437,577
Cash and cash equivalents brought forward 15 85,280,431 54,361,713 55,065,100 1,544,619 1,107,042
Translation effect on cash and cash equivalents – (169,359) (169,359) – –
Cash and Cash eQuivalents Carried forWard 15 52,492,211 85,280,431 87,511,641 858,074 1,544,619
68 NEW EUROPE PROPERTY INVESTMENTS PLC ANNUAL REPORT 2013
1 general
New Europe Property Investments plc is a limited liability company incorporated in the Isle of Man on 23 July 2007 and domiciled in Anglo International House, 2nd floor, Lord Street, Douglas, Isle of Man. The Company is listed on the Main Board of the JSE Ltd (JSE), the regulated market of the Bucharest Stock Exchange (BVB) and the Alternative Investment Market (AIM) of the London Stock Exchange (LSE). The Group includes the Company and its subsidiaries, as set out under ‘Basis of consolidation’ in Note 3.4.
The Group’s consolidated financial statements and the Company’s separate financial statements are collectively referred to as the Financial Statements.
The Group’s activities are detailed in the ‘Directors’ Report’ and in Note 35.
The financial statements for the year ended 31 December 2013 were authorised for issue in accordance with the Directors’ resolution on 13 March 2014.
2 Comparative period
The comparative period is the year ended 31 December 2012. As a result of the adoption of International Financial Reporting Standards (IFRS) 11 Joint Arrangements effective 1 January 2013, the Group is now accounting for its investments in joint ventures under the equity method. The Group has restated its Financial Statements starting 1 January 2012, as joint ventures were previously accounted for under the proportionate consolidation method.
3 aCCounting poliCies
The financial statements have been prepared in accordance with the Isle of Man law and IFRS. The accounting policies set out below have been consistently applied to all periods presented, unless otherwise stated.
3.1 functional and presentation currencyThe consolidated financial statements are presented in Euro (€, EUR) unless otherwise indicated. The entities within the Group have changed the functional currency to Euro effective 1 January 2013, due to the following reasons:
— based on the acquisitions made in 2013, the Group reassessed its transactions, assets and liabilities, and concluded that the majority were Euro denominated;
— Slovakia and Germany use the Euro as local currency;— many of the properties in the Group’s extensive acquisition pipeline are located in Central and Eastern
European countries using the Euro as functional currency (and, in some cases, also as local currency);— the Group has new significant loans contracted and settled in Euro and new interest rate hedging
instruments in Euro;— most cash balances are held in Euro deposits, very small amounts are held in Romanian Leu (RON) or
other currencies, and— the Group has significant developments with construction suppliers contracted in Euro.
Notes to the financial statements
NEW EUROPE PROPERTY INVESTMENTS PLC ANNUAL REPORT 2013 69
Previously issued financial statements are not restated in this respect, in accordance with the requirements set out by IAS 21 – The Effects of Changes in Foreign Exchange Rates.
3.2 basis of preparationThe financial statements are prepared on the historical-cost basis, except for investment property, land for investment property under development, derivatives and other financial instruments.
Investment property, land for investment property under development and derivatives designated as financial instruments at fair value through profit or loss are measured at fair value.
Management prepared these financial statements on a going concern basis. There are no uncertainties relating to events and conditions that cast a significant doubt upon the Group’s ability to continue as a going concern.
The preparation of financial statements in conformity with IFRS requires management to make judgements, estimates and assumptions that affect the application of policies and reported amounts of assets and liabilities, income and expenses. The estimates and associated assumptions are based on historical experience and various other factors that are believed to be reasonable under the circumstances. These enable judgements to be made about the carrying values of assets and liabilities that are not readily apparent from other sources. Actual results may differ from these estimates.
The estimates and underlying assumptions are reviewed on an ongoing basis. Revisions to accounting estimates are recognised in the period when the estimate is revised if the revision affects only that phase. If the revision affects both current and future periods it will be recognised in both.
property acquisitions and business combinationsWhere property is obtained through corporate interests, management considers the substance of the assets and activities of the entity when determining whether its acquisition represents the acquisition of a business or of an asset.
asset acquisitionsWhere property acquisitions are not judged to be an acquisition of a business, they are not treated as business combinations. Instead, the amount paid to acquire the corporate entity is allocated between the identifiable assets and liabilities of the entity, based on their relative fair values at the date of acquisition. No goodwill or additional deferred taxation arises.
Acquisitions of subsidiaries where the main assets were not in use on the date of the acquisition, and which do not include transfer of processes, other assets or employees, are accounted for as asset acquisitions.
business combinationsBusiness combinations are accounted for using the acquisition method. The acquisition is recognised at the aggregate amount of the consideration transferred, measured at fair value on the date of acquisition and the amount of any non-controlling interest in the acquired entity.
For each business combination, the acquirer measures the non-controlling interest in the acquired entity either at fair value or as a proportionate share of their identifiable net assets. Transaction costs incurred are expensed.
When the Group acquires a business, it assesses the financial assets and liabilities assumed for appropriate classification and designation, in accordance with the contractual terms, economic circumstances and pertinent conditions on the date of acquisition.
70 NEW EUROPE PROPERTY INVESTMENTS PLC ANNUAL REPORT 2013
Notes to the financial statements » continued
Any contingent consideration to be transferred by the acquirer will be recognised at fair value on the date of acquisition. Subsequent changes to the fair value of any contingent consideration classified as a liability will be recognised in the Statement of income. The acquisition accounting is finalised when the Group has gathered all the necessary information, but in a maximum period of 12 months from the acquisition date. There is no exemption from the 12-month rule for deferred tax assets or changes in the amount of contingent consideration.
valuation of investment propertyPlease refer to Notes 3.5, 3.6, 3.7 and 9 for further details.
3.3 statement of complianceThe financial statements have been consistently prepared in accordance with IFRS and its interpretations adopted by the IASB and the requirements of relevant Isle of Man Company Law.
3.4 basis of consolidation
subsidiariesThe financial statements incorporate the assets, liabilities, operating results and cash flows of the Company and its subsidiaries.
Subsidiaries are those entities over which the Group has the ability, either directly or indirectly, to govern the financial and operating policies to obtain benefits from their activities. When assessing control, potential voting rights that are currently exercisable are taken into account. Subsidiaries are consolidated from the date when control is transferred to the Group (effective date of acquisition or incorporation) and are deconsolidated from the date when control ceases.
The purchase method of accounting is used to account for the acquisition of subsidiaries. Identifiable assets acquired and liabilities, and contingent liabilities assumed in a business combination are measured at their fair values on the date of acquisition. The consideration transferred for the acquired entity is measured at the fair value of the assets given up, equity instruments issued and liabilities incurred, or assumed, including fair value of assets or liabilities from contingent consideration arrangements, but excluding acquisition related costs such as advisory, legal, valuation and similar professional services.
The accounting policies of the subsidiaries are consistent with those of the holding Company.
In the Company’s separate financial statements, investments in subsidiaries are stated at cost less accumulated impairment losses.
transactions eliminated on consolidationIntra-group balances and any unrealised gains and losses arising from intra-group transactions are eliminated when preparing the financial statements.
jointly controlled entitiesThe Group has contractual arrangements with other parties that represent joint ventures. These take the form of agreements to jointly control other entities.
NEW EUROPE PROPERTY INVESTMENTS PLC ANNUAL REPORT 2013 71
Before 1 January 2013, where the joint venture was established through an interest in the company (a jointly controlled entity) the Group recognised its interest in the entity’s assets and liabilities using the proportionate consolidation method. The Group’s Statement of financial position included its share of the assets and liabilities while the Statement of income included the Group’s share of the income and expenses that were under joint control.
Starting 1 January 2013, as a result of the adoption of IFRS 11 Joint Arrangements, the Group accounts for its investments in joint ventures using the equity method. Under the equity method, the initial recognition of an investment in a joint venture is at cost; the carrying amount is subsequently increased or decreased to recognise the Group’s share of profit or loss of the joint venture. Distributions received from a joint venture reduce the carrying amount of the investment. The Group classifies its investment in joint ventures as a non-current asset, and recognises its share of the joint ventures’ net result in the Statement of income.
3.5 investment propertyInvestment properties are held to earn rental income, capital appreciation or both.
The cost of investment property acquired by any other means than a business combination consists of the purchase price and directly attributable expenditure. Subsequent expenditure relating to investment property is capitalised when future economic benefits from the use of the asset is probable. All other subsequent expenditure is recognised as an expense during the period it is incurred.
After initial recognition, investment properties are measured at fair value. Fair value is determined annually by external, independent professional valuers, with appropriate and recognised qualifications and recent experience in the location and category of property being valued. Valuations are based on the open market value, using either the discounted cash flow method, the capitalisation of net income method or a combination of both. Gains or losses arising from changes in the fair values are included in the Statement of income for the period during which they arise. Unrealised gains, net of deferred tax, are classified as non-distributable in the accumulated profits. Unrealised losses, net of deferred tax, are transferred to a non-distributable reserve within the accumulated profit, up to, but not exceeding, the balance of the reserve.
Gains or losses on disposal of investment property are calculated as proceeds less carrying amount. Where the Group disposes of a property at fair value in an arm’s length transaction, the carrying value, immediately prior to the sale, is adjusted to the transaction price. The adjustment is recorded in the Statement of income for the year within Net gain from fair value adjustment on investment property.
3.6 investment property under developmentProperty that is being constructed or developed for future use as investment property is classified as investment property under development and carried at cost until construction or development is complete, or its fair value can be reliably determined. Once valued it is reclassified and accounted for as investment property.
The land on which investment property is constructed or developed is carried at fair value, which is determined annually by external, independent professional valuers, with appropriate and recognised qualifications and recent experience in the location and category of property being valued. Valuations are done using the market comparable approach or residual approach.
Gains or losses arising from changes in the fair values are included in the Statement of income during the period when they arise. Unrealised gains, net of deferred tax, are classified as non-distributable in the accumulated profits. Unrealised losses, net of deferred tax, are transferred to a non-distributable reserve up to, but not exceeding, the balance of the reserve.
72 NEW EUROPE PROPERTY INVESTMENTS PLC ANNUAL REPORT 2013
Notes to the financial statements » continued
3.7 non-current assets held for saleInvestment property is classified as a non-current asset held for sale if its carrying amount will be recovered mainly through a sale transaction rather than continuing use. For this to apply the property must be available for immediate sale in its present condition, subject only to terms that are usual and customary for sales of such property and its sale must be highly probable. The sale will be considered highly probable if the following criteria are met:
— the Board must be committed to a plan to sell the property and an active programme to locate a buyer and complete the sale must be initiated;
— the property must be actively marketed at a price that is reasonable in relation to its current fair value, and
— the sale of property should be expected to qualify for recognition as a completed sale within one year of the date of classification
On classification as held for sale, investment property that is measured at fair value continues to be so measured.
3.8 goodwillGoodwill arises on acquisition of subsidiaries and joint ventures that constitute a business. Goodwill represents the amount paid in excess of the Group’s interest in the net fair value of the identifiable assets and liabilities of the acquired entity. When the excess is negative (negative goodwill) it is recognised directly in the Statement of income.
subsequent measurementGoodwill is not amortised, but is tested for impairment at least annually.
After initial recognition, goodwill is measured at cost, less any accumulated impairment losses. For the purpose of impairment testing, goodwill acquired in a business combination is, from the date of acquisition, allocated to each of the Group’s cash generating units that are expected to benefit from the synergies of the combination, irrespective of whether other assets or liabilities of the acquired entity are assigned to those units.
Where goodwill is generated by the recognition, on the acquisition of a business, of deferred tax liabilities in excess of the fair value of such liabilities, the post-tax discount rate is adjusted in order to determine the appropriate pre-tax discount rate used to determine the value in use for impairment testing purposes. Therefore, the deferred tax liability in excess of its fair value, as determined at acquisition, is offset against the goodwill, and the net amount tested to determine whether that goodwill is impaired.
If the deferred tax provision in excess of the fair value of that liability is subsequently reduced or eliminated, for example through a change in the tax circumstances of the Group, the goodwill arising from the initial recognition of the deferred tax provision may be impaired. The goodwill is tested at the same time as the fair value of the relevant investment property is determined.
3.9 loans to participants in the Current share scheme (as defined in note 18)Loans to participants in the Current Share Scheme are initially recognised at the amount granted, carried at amortised cost and tested annually for impairment.
3.10 property, plant and equipment and intangible assetsProperty, plant and equipment, and intangible assets are initially recognised at acquisition cost, carried at amortised cost and tested annually for impairment.
NEW EUROPE PROPERTY INVESTMENTS PLC ANNUAL REPORT 2013 73
For property, plant and equipment the costs of minor repairs and maintenance are expensed when incurred while gains and losses on disposals are determined by comparing the proceeds with the carrying amount. Both are recognised in the Statement of income for the year.
The cost of computer licences and property, plant and equipment is depreciated on a straight-line basis over the length of their useful lives:
useful lives in years
Computer licences 1–3
Office improvements over the term of the underlying lease
Office equipment 2–16
Equipment used in owner managed activities 3–22
3.11 borrowingsBorrowings are recognised initially at the fair value of the liability (determined using the prevailing market rate of interest if significantly different from the transaction price) and net of transaction costs incurred. In subsequent periods, borrowings are stated at amortised cost using the effective interest method. Any difference between the fair value of the borrowing at initial recognition and the proceeds received is recognised in accordance with the substance of the transaction: to equity, if the premium or discount at initial recognition effectively represents a capital transaction with the Group’s owners, or in the Statement of comprehensive income, within finance activity.
Foreign currency translation differences are recognised as foreign exchange differences within finance income or finance costs.
Borrowing costs that are directly attributable to the acquisition, construction or production of qualifying assets, such as properties developed for future sale, capital appreciation or rental income, are capitalised as part of the cost of these assets. The capitalisation of borrowing costs ceases when the majority of the activities necessary to prepare the qualifying asset for its intended use or sale are complete.
Borrowings are classified as current liabilities unless the Group has an unconditional right to defer settlement of the liability for at least 12 months after the reporting date.
The Group derecognises its financial liability (or part of a financial liability) from its Statement of financial position when, and only when, it is extinguished. This occurs when the obligation specified in the contract is discharged, cancelled or expires. An exchange between the Group and a lender of debt instruments with substantially different terms is accounted for as an extinguishment of the original financial liability and the recognition of a new financial liability. Similarly, a substantial modification of the terms of an existing financial liability, or a part of it, is accounted for as an extinguishment of the original financial liability and the recognition of a new financial liability.
If the Group repurchases a part of a financial liability, it allocates the previous carrying amount of the financial liability between the part that continues to be recognised and the part that is derecognised based on the relative fair values of those parts on the date of the repurchase. The difference between the carrying amount allocated to the part derecognised and the consideration paid for the part derecognised, including any non-cash assets transferred or liabilities assumed, is recognised in the Statement of income.
74 NEW EUROPE PROPERTY INVESTMENTS PLC ANNUAL REPORT 2013
Notes to the financial statements » continued
3.12 tenant security depositsTenant security deposits represent financial advances made by lessees as guarantees during the lease and are repayable by the Group upon termination of contracts. Tenant security deposits are recognised at nominal value.
3.13 financial instrumentsFinancial instruments include cash and cash equivalents, trade and other receivables, trade and other payables, derivative financial instruments and loans granted by the Company to its subsidiaries. The Group holds derivative financial instruments to hedge its interest rate risk exposures. Such derivative financial instruments are initially recognised at fair value on the date a derivative contract is entered into and subsequently re-measured at fair value. Derivatives are carried as assets when the fair value is positive and as liabilities when the fair value is negative.
Derivatives are classified as current or non-current on the basis of their maturity date.
The Company has investments in listed property shares which are initially recognised at cost and subsequently re-measured at fair value. The fair value of the shares is determined by referring to published price quotations in an active market. The loans payable incurred for the purpose of financing these investments are measured at amortised cost and presented net of the cash collateral paid by the Company at the acquisition of each share (see Note 13).
These financial investments are classified as current or non-current assets, based on the estimated selling date. The loan payable in this respect follows the classification of the investments.
3.13.1 initial recognition and subsequent measurementFinancial instruments are initially measured at fair value, which, except for financial instruments at fair value through profit or loss and derivatives, include directly attributable transaction costs. Subsequent to initial recognition, financial instruments are measured as follows:
finanCial instrument reCognition methodInvestments in subsidiaries (presented only
in the Company’s financial statements) Carried at cost, net of impairment losses
Loans granted to subsidiaries (presented only in the Company’s financial statements) Carried at amortised cost using the effective interest rate method
Investments in joint ventures Carried at share of net assets of the joint ventures, net of impairment losses
Loans granted to joint ventures Carried at amortised cost using the effective interest rate method
Trade and other receivables Carried at amortised cost using the effective interest rate method, net of impairment losses
Trade and other payables Carried at amortised cost using the effective interest rate method
Cash and cash equivalents Carried at cost
Loans granted to participants in the Current Share Scheme Carried at amortised cost using the effective interest rate method
Financial liabilities, including loans and borrowings
Measured at amortised cost using the effective interest rate method
Derivative financial instruments Carried at fair value with changes therein recognised in the Statement of income, hedge accounting is not applied
Financial investments at fair value through profit or loss
Carried at fair value with changes therein recognised in the Statement of income
NEW EUROPE PROPERTY INVESTMENTS PLC ANNUAL REPORT 2013 75
The fair values of the financial assets and liabilities are estimates of the amount that the instrument could be exchanged in a current transaction between willing parties, other than in a forced or liquidation sale. The following methods and assumptions were used to estimate the fair values:
— Cash and cash equivalents, trade and other receivables, trade and other payables, tenant deposits, current portion of loans and borrowings are estimated at their carrying amounts due to the short-term maturities of these instruments
— The fair values of the derivative interest rate cap and swap contracts are estimated by discounting expected future cash flows using current market interest rates and yield curve over the remaining term of the instrument
— The fair values of financial investments are estimated based on quoted prices in active markets as at balance sheet date
The financial assets and liabilities are categorised according to the following levels:— Level 1: Quoted (unadjusted) market prices in active markets for identical assets or liabilities— Level 2: Valuation techniques for which the lowest level input that is significant to the fair value
measurement is directly or indirectly observable— Level 3: Valuation techniques for which the lowest level input that is significant to the fair value
measurement is unobservable
3.13.2 derecognition
financial assetsA financial asset (or, where applicable, a part of a financial asset or part of a group of similar financial assets) is derecognised when:
— the contractual rights to receive cash flows from the asset have expired, or— the Group or Company has transferred its rights to receive cash flows from the asset and either has
transferred substantially all the risks and rewards of the asset, or has neither transferred nor retained substantially all the risks and rewards of the asset, but has transferred control of the asset.
financial liabilitiesA financial liability is de-recognised when the obligation under the liability is discharged or cancelled or expires. Where an existing liability is replaced by another from the same lender on substantially different terms, or the terms of an existing liability are substantially modified, such an exchange or modification is treated as a de-recognition of the original liability and the recognition of a new liability, and the difference in the respective carrying amounts is recognised in the Statement of income.
3.13.3 offsetFinancial assets and financial liabilities are offset and the net amount reported in the Statement of financial position when the Group and/or Company has a legally enforceable right to set off the recognised amounts and intends either to settle on a net basis or to realise the asset and settle the liability simultaneously. Deferred tax and VAT assets and liabilities are the main items offset, and these are assessed at each property level.
3.14 impairment of financial assetsA financial asset not carried at fair value through profit or loss is assessed at each reporting date to determine whether there is objective evidence that it is impaired. A financial asset is impaired if objective evidence indicates that a loss event has occurred after the initial recognition of the asset and that the loss event had a negative effect on the estimated future cash flows of that asset that can be estimated reliably.
The Group considers evidence of impairment for receivables at a specific asset level.
All receivables are individually assessed for impairment.
76 NEW EUROPE PROPERTY INVESTMENTS PLC ANNUAL REPORT 2013
Notes to the financial statements » continued
An impairment loss in respect of a financial asset measured at amortised cost is calculated as the difference between its carrying amount and the present value of the estimated future cash flows, discounted at the asset’s original effective interest rate and is recognised through an allowance account. When a subsequent event causes the amount of impairment loss to decrease, the decrease in impairment loss is reversed through the Statement of income for the year.
If in a subsequent period, the amount of the impairment loss decreases and the decrease can be related objectively to an event occurring after the impairment was recognised (such as an improvement in the debtor’s credit rating) the previously recognised impairment loss is reversed by adjusting the allowance account through the Statement of income for the year.
Uncollectable assets are written-off against the related impairment loss provision after all the necessary procedures to recover the asset have been completed and the amount of the loss has been determined. Subsequent recoveries of amounts previously written-off are credited to the impairment loss account within the Statement of income for the year.
3.15 Cash and cash equivalentsCash and cash equivalents include cash balances, call deposits and short-term, highly-liquid investments that are readily convertible to known amounts of cash and which are subject to an insignificant risk of changes in value. Bank overdrafts that are repayable on demand and form an integral part of the Group’s cash management are included as a component of cash and cash equivalents for the purpose of the Statement of cash flows.
3.16 share capital and share premiumOrdinary shares are classified as equity. External costs directly attributable to the issue of new shares are shown as a deduction in equity from the proceeds.
3.17 share-based payment reserveThe Group has accounted for the Initial Share Scheme (Note 18) as a share option scheme. The fair value of share option granted to key individuals and their nominated entities is recognised as an expense, with a corresponding increase in equity, over the period that the participants become unconditionally entitled to the shares. The amount recognised as an expense is adjusted to reflect the actual number of shares that vest. The interest charged by the Company on the loans granted in terms of the Initial Share Scheme is not recognised to the Statement of income but added for calculation of distributable earnings purposes only (Note 31).
The fair value measurement inputs include share price on measurement date, exercise price of the instrument, expected volatility (based on weighted average historic volatility of similar listed companies), expected life of the instrument (considered as vesting period) and the risk free interest rate (based on government bonds).
The Current Share Scheme (Note 18) is accounted for by recognising in the share-based payment reserve the value of the loans given to employees. The share-based payment reserve is converted to share capital at each vesting date. The accrued interest is recognised as finance income in the Statement of income.
3.18 other reserves
3.18.1 Currency translation reservesThe financial statements reported as of 31 December 2012 required translation of foreign operations’ figures. Exchange differences arising, if any, were classified as equity and transferred to the Group’s currency translation reserve. The assets, liabilities and equity of the Group’s operations with a functional currency other than Euro were expressed in Euro using exchange rates prevailing at 31 December 2012. Income and expense items were translated at the average exchange rates for the period, unless exchange rates fluctuated

NEW EUROPE PROPERTY INVESTMENTS PLC ANNUAL REPORT 2013 77
significantly during the period, in which case the exchange rates at the dates of the transactions are used. Exchange differences arising, if any, were classified as equity and transferred to the Group’s currency translation reserve. Such translation differences were recognised in the Statement of income in the period in which the foreign operation is disposed of.
At 31 December 2012 the principal rate of exchange used for translating foreign currency balances was 1€=4.4287 RON. The principal average rate of exchange used for translating income and expenses was 1€=4.4560 RON.
Starting from 1 January 2013, the Group adopted Euro as functional currency for all its operations. All transactions denominated in currencies other than Euro are recognised at the exchange rate from the date of transaction, so the Group does not recognise currency translation reserves.
3.18.2 retained earningsThe balance on the Statement of income is transferred to retained earnings at the end of each financial period. Distribution paid in cash is deducted from Retained Earnings. Distribution for which shareholders elected to receive capital return is reflected as an issue of shares from the share premium account.
3.19 provisionsProvisions for liabilities are recognised when the Group has a present legal or constructive obligation as a result of past events, when it is probable that an outflow of resources embodying economic benefits will be required to settle the obligation. The amount recognised as a provision is the best estimate of the expenditure required to settle the obligation at the reporting date. Where the effect of the time value of money is material the amount of the provision is the present value of the expenditure expected to be required to settle the obligation.
Provisions are reassessed at each reporting date, and are included in the financial statements at their net present values using discount rates appropriate to the Group in the economic environment at each reporting date.
3.20 revenueRevenue comprises rental and related income and recovery of expenses, excluding VAT.
rental incomeRental income receivable from operating leases, less the Group’s initial direct cost of entering into the leases, is recognised on a straight-line basis over the duration of the lease, except for contingent rental income which is recognised when it arises.
service charges and expenses recoverable from tenantsIncome arising from expenses recharged to tenants is recognised on an accrual basis.
As specified in the lease agreements, the Group has the primary responsibility for providing services to tenants (electricity, water and gas utilities, interior and exterior cleaning, security, maintenance, repairs, etc). The Group negotiates directly with the suppliers all contracts for services provided to tenants. These contracts are concluded between the Group subsidiaries which own the properties and the direct supplier. As the Group sometimes uses the same providers for services across most of its portfolio, it can negotiate better prices through the economies of scale. The Group bears the responsibility of meeting the contractual deadlines agreed in the contracts with its suppliers and is liable for payment of the services, regardless of whether they are able to recover these charges from the tenants. The Group also bears the inventory risk for the necessary spare parts purchased for the maintenance and repairs required by the tenants. The Group bears the credit risk
78 NEW EUROPE PROPERTY INVESTMENTS PLC ANNUAL REPORT 2013
Notes to the financial statements » continued
for the amounts receivable from tenants. The Group negotiates and pays all expenses incurred by the tenants and then re-invoices these costs to them as defined in the contractual clauses included in the lease agreements. A flat fee is charged monthly during the year. This fee is estimated based on the previous year’s actual costs. After the year-end, the annual service charge reconciliation is performed based on actual costs. For contracts terminated during the year, the Group estimates the service charge to be collected based on the current budget and last year’s actual costs. The Group therefore bears the risk of not collecting the service charge differences for non-performing tenants. The Group is considered principal in these transactions, in terms of the IAS 18 requirements.
3.21 property operating and administrative expensesProperty operating expenses and administrative expenses are recognised on an accrual basis.
3.22 operating leasesWhere the Group is a lessee in a lease which does not transfer substantially all the risks and rewards incidental to ownership from the lessor to the Group, the total lease payments are charged to the Statement of income for the year on a straight-line basis over the lease term. The lease term is the non-cancellable period for which the lessee has contracted to lease the asset together with any further terms for which the lessee has the option to continue to lease the asset, with or without further payment, when at the inception of the lease it is reasonably certain that the lessee will exercise the option.
3.23 dividend receivedDividend/distribution income is recognised in the Statement of comprehensive income on the date the Group or Company’s right to receive payment is established.
3.24 dividend distributedDistribution is recorded as a liability and deducted from equity in the period in which it is declared and approved. Any distribution declared after the reporting period and before the financial statements are authorised for issue is disclosed in Note 31.
3.25 taxationTaxation on the profit or loss for the year comprises current and deferred tax. Current income tax and liabilities are measured at the amount expected to be recovered from, or paid to, taxation authorities. The tax rates and tax laws used to compute the amount are those that are enacted, or substantively enacted, by the reporting date. Current income tax relating to items recognised directly in equity is recognised directly in equity and not in the Statement of income. Management periodically evaluates positions taken in tax returns with respect to situations in which applicable tax regulations are subject to interpretation and establishes provisions where appropriate.
Deferred tax is determined using the Statement of financial position liability method and is based on temporary differences between the carrying amounts of assets and liabilities for financial reporting purposes and their tax bases. The amount of deferred tax provided is based on the expected manner of realisation or settlement of the carrying amount of assets and liabilities, using tax rates enacted or substantively enacted at the date of the Statement of financial position, which are expected to apply to the period when the temporary differences will reverse or the tax loss carried forward will be utilised.
The following temporary differences are not provided for: goodwill not deductible for tax purposes; the initial recognition of assets or liabilities that affect neither accounting nor taxable profit, and differences relating to investments in subsidiaries that are unlikely to reverse in the foreseeable future.
A deferred tax asset is recognised based on the assumption that it is probable that future taxable profits will be available against which it can be utilised. Deferred tax assets are reduced to the extent that it is no longer probable that the related tax benefit will be realised.
NEW EUROPE PROPERTY INVESTMENTS PLC ANNUAL REPORT 2013 79
The tax income or expense incurred by the Group reflects deferred tax accrued in the subsidiaries of the Group located in Romania and Slovakia.
Output Value Added Tax (VAT) related to sales is payable to tax authorities on either the collection of receivables from customers or the delivery of services to customers depending on which occurs first. Input VAT is generally recoverable against output VAT upon receipt of the invoice. The tax authorities permit the settlement of VAT on a net basis. VAT relating to sales and purchases is recognised in the Statement of financial position on a gross basis and is disclosed separately as an asset and liability. Where provision has been made for impairment of receivables, the loss is recorded for the gross amount of the debt, including VAT.
3.26 segment reportingManagement decisions and consequent allocation of resources are based on individual property level reports, which are analysed in detail. Management has a hands-on approach and is involved in day-to-day activities. Regular management meetings are held at least monthly for each property, where the top management of the Group and each property manager analyse the financial results, decide whether any repairs or improvements are necessary, review rent collection issues and allocate resources to resolve any delays with tenants and review maintenance plans, vacancies and the status of any contract negotiations, as well as other operational matters. The results of these discussions ensure management decisions are specific to each of the properties. The Segmental Reporting summarises the results recorded by the properties held by the Group. The properties can be classified as retail, office or industrial properties, depending on industry practice.
The Group’s Chief Operating Decision Makers (CODM) are the Chief Executive Officer and the Finance Director and they take decisions based on detailed reports. These are prepared regularly and are presented to the Board of Directors, which approves the results and gives guidance on the subsequent strategy to be undertaken.
Segment results, assets and liabilities include items directly attributable to a segment, as well as those that can be allocated there on a reasonable basis. Unallocated items comprise mainly investments (other than investment property) and related revenue, corporate assets and head office expenses. Segment capital expenditure is the total cost incurred during the period to acquire property, plant and equipment and intangible assets other than goodwill.
For investment property financial information is provided to the Board of Directors. The information provided is net rentals (including gross rent and property expenses) and valuation gains and losses. Individual properties are aggregated into segments with similar economic characteristics.
Consequently, the Group is considered to have three reportable operating segments:— Retail segment: acquires, develops and leases retail properties— Office segment: acquires, develops and leases office properties— Industrial segment: acquires, develops and leases industrial facilities
The Group also reports by geographic segments, currently Romania and Slovakia. Investments in joint ventures in Germany are not included in the segment reporting as these are accounted for under the equity method starting from 1 January 2013.
3.27 earnings per shareThe Group presents basic and diluted earnings per share.
Basic earnings per share are calculated by dividing annual profit for the year attributable to equity holders by the weighted average number of shares in issue during the year.
Diluted earnings per share is determined by adjusting the profit for the year and the weighted average number of shares in issue for the dilutive effects of all potential ordinary shares issued under the Initial Share Scheme (as defined in Note 18).
80 NEW EUROPE PROPERTY INVESTMENTS PLC ANNUAL REPORT 2013
Notes to the financial statements » continued
3.28 distributable earnings per shareThe Group presents distributable earnings per share, in accordance with its distribution policy.
Distributable earnings per share are calculated by dividing the distributable profit (earnings plus deferred tax, less/plus fair value increases/decreases, less/plus capital gains/losses on disposal, plus interest due from participants in the Initial Share Scheme and other adjustments that the Board may consider necessary) for the period by the number of shares in issue which are entitled to distribution at the end of the period.
3.29 headline earnings per shareThe Group presents basic and diluted headline earnings per share.
Headline earnings are an additional earnings number that is permitted by IAS 33. The starting point is earnings as determined in IAS 33, excluding ‘separately identifiable re-measurements’, net of related tax (both current and deferred) and minority interest, other than re-measurements specifically included in headline earnings (referred to as included re-measurements).
A re-measurement is an amount recognised in the Statement of income relating to any change (whether realised or unrealised) in the carrying amount of an asset or liability that arose after the initial recognition of such asset or liability. A re-measurement may be recognised in the Statement of comprehensive income either when the re-measurement occurs or subsequently. This latter situation occurs when re-measurements are initially recorded in equity (in accordance with the relevant IFRS) and subsequently included or recognised in the Statement of comprehensive income.
3.30 Changes in accounting policy and disclosuresThe accounting policies adopted are consistent with those of the previous financial year except for the following amended IFRSs which have been adopted by the Group as of 1 January 2013:
ias 1 presentation of items of other Comprehensive income – amendments to ias 1The amendments to IAS 1 became effective 1 July 2012 and were first applied by the Group on 1 January 2013. The amendments introduce a grouping of items presented in other comprehensive income (OCI). Items that will be reclassified (‘recycled’) to profit or loss at a future point in time (e.g., net loss or gain on available-for-sale financial assets) have to be presented separately from items that will not be reclassified (e.g., revaluation reserve). The amendment affected presentation only and had no impact on the Group’s financial position or performance.
ifrs 11 joint arrangementsThe new standard is effective for annual periods beginning on or after 1 January 2013. IFRS 11 replaces IAS 31 Interests in Joint Ventures and SIC-13 Jointly-controlled Entities — Non-monetary Contributions by Venturers. IFRS 11 removes the option to account for jointly controlled entities (JCEs) using proportionate consolidation. Instead, JCEs that meet the definition of a joint venture must be accounted for using the equity method. As a result of this adoption, the Group is now accounting for its investments in joint ventures under the equity method. The Group has restated the presentation of the Statement of Financial Position and Statement of Income starting 1 January 2012, which previously included joint ventures accounted for under the proportionate consolidation method.
ias 28 investments in associates and joint ventures (revised)The Standard is effective for annual periods beginning on or after 1 January 2013. As a consequence of the new IFRS 11 Joint arrangements and IFRS 12 Disclosure of Interests in Other Entities, IAS 28 Investments in Associates, has been renamed IAS 28 Investments in Associates and Joint Ventures, and describes the application of the equity method to investments in joint ventures in addition to associates. The Group has restated the presentation of the Statement of Financial Position and Statement of Income starting 1 January 2012, which previously included joint ventures accounted for under the proportionate consolidation method.
NEW EUROPE PROPERTY INVESTMENTS PLC ANNUAL REPORT 2013 81
ias 19 employee benefits (revised)The amendment is effective for annual periods beginning on or after 1 January 2013. IAS 19 initiates a number of amendments to the accounting for defined benefit plans, including actuarial gains and losses that are now recognised in other comprehensive income (OCI) and permanently excluded from profit and loss; expected returns on plan assets that are no longer recognised in profit or loss, instead, there is a requirement to recognise interest on the net defined benefit liability (asset) in profit or loss, calculated using the discount rate used to measure the defined benefit obligation, and; unvested past service costs are now recognised in profit or loss at the earlier of when the amendment occurs or when the related restructuring or termination costs are recognised. Other amendments include new disclosures, such as, quantitative sensitivity disclosures. This change has no impact on the Group’s financial position or performance.
ifrs 7 financial instruments: disclosures (amended) - offsetting financial assets and financial liabilitiesThe amendment is effective for annual periods beginning on or after 1 January 2013. These amendments require an entity to disclose information about rights to set-off and related arrangements (e.g. collateral agreements). The disclosures would provide users with information that is useful in evaluating the effect of netting arrangements on an entity’s financial position. The new disclosures are required for all recognized financial instruments that are set off in accordance with IAS 32 Financial Instruments: Presentation. The disclosures also apply to recognized financial instruments that are subject to an enforceable master netting arrangement or similar agreement, irrespective of whether they are set off in accordance with IAS 32. The impact of this change on the Group’s financial position or performance is insignificant.
ifrs 10 Consolidated financial statements, ias 27 separate financial statementsThe new standard is effective for annual periods beginning on or after 1 January 2013. IFRS 10 replaces the portion of IAS 27 Consolidated and Separate Financial Statements that addresses the accounting for consolidated financial statements. It also addresses the issues raised in SIC-12 Consolidation — Special Purpose Entities. IFRS 10 establishes a single control model that applies to all entities including special purpose entities. The changes introduced by IFRS 10 will require management to exercise significant judgment to determine which entities are controlled and therefore are required to be consolidated by a parent, compared with the requirements that were in IAS 27. The impact of this change on the Group’s financial position or performance is insignificant.
ifrs 12 disclosures of interests in other entitiesThe new standard is effective for annual periods beginning on or after 1 January 2013. IFRS 12 includes all of the disclosures that were previously in IAS 27 related to consolidated financial statements, as well as all of the disclosures that were previously included in IAS 31 and IAS 28. These disclosures relate to an entity’s interests in subsidiaries, joint arrangements, associates and structured entities. A number of new disclosures are also required. The impact of this change on the Group’s financial position or performance is insignificant.
ifrs 13 fair value measurementThe amendment is effective for annual periods beginning on or after 1 January 2013. IFRS 13 establishes a single source of guidance under IFRS for all fair value measurements. IFRS 13 does not change when an entity is required to use fair value, but rather provides guidance on how to measure fair value under IFRS when fair value is required or permitted. IFRS 13 also requires specific disclosures on fair values, some of which replace existing disclosure requirements in other standards, including IFRS 7 Financial Instruments: Disclosures. The application of IFRS 13 has not materially impacted the fair value measurements carried out by the Group, but it has an impact on disclosure requirements.
transition guidance (amendments to ifrs 10, ifrs 11 and ifrs 12)The guidance is effective for annual periods beginning on or after 1 January 2013. The IASB issued amendments to IFRS 10 Consolidated Financial Statements, IFRS 11 Joint Arrangements and IFRS 12 Disclosure of Interests in Other Entities. The amendments change the transition guidance to provide further relief from full retrospective application. The date of initial application’ in IFRS 10 is defined as ‘the beginning of the annual reporting period in which IFRS 10 is applied for the first time’. The assessment of whether control exists is made at ‘the
82 NEW EUROPE PROPERTY INVESTMENTS PLC ANNUAL REPORT 2013
Notes to the financial statements » continued
date of initial application’ rather than at the beginning of the comparative period. If the control assessment is different between IFRS 10 and IAS 27/SIC-12, retrospective adjustments should be determined. However, if the control assessment is the same, no retrospective application is required. If more than one comparative period is presented, additional relief is given to require only one period to be restated. For the same reasons IASB has also amended IFRS 11 Joint Arrangements and IFRS 12 Disclosure of Interests in Other Entities to provide transition relief. The impact of these changes on the Group’s financial position or performance is insignificant.
annual improvementsThe IASB has issued the Annual Improvements to IFRSs – 2009 – 2011 Cycle, which contains amendments to its standards and the related Basis for Conclusions. The annual improvements project provides a mechanism for making necessary, but non-urgent, amendments to IFRS. The amendment is effective for annual periods beginning on or after 1 January 2013. The impact of these changes on the Group’s financial position or performance is insignificant.
— IAS 1 Presentation of Financial Statements: This improvement clarifies the difference between voluntary additional comparative information and the minimum required comparative information. Generally, the minimum required comparative period is the previous period.
— IAS 16 Property, Plant and Equipment: This improvement clarifies that major spare parts and servicing equipment that meet the definition of property, plant and equipment are not inventory.
— IAS 32 Financial Instruments, Presentation: This improvement clarifies that income taxes arising from distributions to equity holders are accounted for in accordance with IAS 12 Income Taxes.
— IAS 34 Interim Financial Reporting: The amendment aligns the disclosure requirements for total segment assets with total segment liabilities in interim financial statements. This clarification also ensures that interim disclosures are aligned with annual disclosures.
3.31 standards issued but not yet effective and not early adopted
ias 32 financial instruments: presentation (amended) – offsetting financial assets and financial liabilitiesThe amendment is effective for annual periods beginning on or after 1 January 2014. These amendments clarify the meaning of ‘currently has a legally enforceable right to set-off’. The amendments also clarify the application of the IAS 32 offsetting criteria to settlement systems (such as central clearing house systems) which apply gross settlement mechanisms that are not simultaneous. Management is in the process of assessing the impact of this standard on the financial position or performance of the Group.
ifrs 9 financial instruments: classification and measurement and subsequent amendments to ifrs 9 and ifrs 7 mandatory effective date and transition disclosures; hedge accounting and amendments to ifrs 9, ifrs 7 and ias 39IFRS 9, as issued, reflects the first phase of the IASBs work on the replacement of IAS 39 and applies to classification and measurement of financial assets and financial liabilities as defined in IAS 39. The adoption of the first phase of IFRS 9 will have an effect on the classification and measurement of financial assets, but will not have an impact on classification and measurements of financial liabilities. In subsequent phases, the IASB will address hedge accounting and impairment of financial assets. The subsequent package of amendments issued in November 2013 initiate further accounting requirements for financial instruments. These amendments a) bring into effect a substantial overhaul of hedge accounting that will allow entities to better reflect their risk management activities in the financial statements; b) allow the changes to address the so-called ‘own credit’ issue that were already included in IFRS 9 Financial Instruments to be applied in isolation without the need to change any other accounting for financial instruments; and c) remove the 1 January 2015 mandatory effective date of IFRS 9, to provide sufficient time for preparers of financial statements to make the transition to the new requirements. The Group will quantify the effect in conjunction with the other phases, when the final standard including all phases is issued.
NEW EUROPE PROPERTY INVESTMENTS PLC ANNUAL REPORT 2013 83
investment entities (amendments to ifrs 10, ifrs 12 and ias 27)The amendment is effective for annual periods beginning on or after 1 January 2014. The amendment applies to a particular class of business that qualifies as investment entities. The IASB uses the term ‘investment entity’ to refer to an entity whose business purpose is to invest funds solely for returns from capital appreciation, investment income or both. An investment entity must also evaluate the performance of its investments on a fair value basis. Such entities could include private equity organizations, venture capital organizations, pension funds, sovereign wealth funds and other investment funds. Under IFRS 10 Consolidated Financial Statements, reporting entities were required to consolidate all investees that they control (i.e. all subsidiaries). The Investment Entities amendment provides an exception to the consolidation requirements in IFRS 10 and requires investment entities to measure particular subsidiaries at fair value through profit or loss, rather than consolidate them. The amendment also sets out disclosure requirements for investment entities. Management is in the process of assessing the impact of this standard on the financial position or performance of the Group.
ifrs 14 regulatory deferral accountsThe standard is effective for annual periods beginning on or after 1 January 2016. The aim of this interim standard is to enhance the comparability of financial reporting by entities that are engaged in rate-regulated activities, whereby governments regulate the supply and pricing of particular types of activity. This can include utilities such as gas, electricity and water. Rate regulation can have a significant impact on the timing and amount of an entity’s revenue. The IASB has a project to consider the broad issues of rate regulation and plans to publish a Discussion Paper on this subject in 2014. Pending the outcome of this comprehensive Rate-regulated Activities project, the IASB decided to develop IFRS 14 as an interim measure. IFRS 14 permits first-time adopters to continue to recognise amounts related to rate regulation in accordance with their previous GAAP requirements when they adopt IFRS. However, to enhance comparability with entities that already apply IFRS and do not recognise such amounts, the standard requires that the effect of rate regulation must be presented separately from other items. An entity that already presents IFRS financial statements is not eligible to apply the standard. This change has no impact on the Group’s financial position or performance.
ias 36 impairment of assets (amended) – recoverable amount disclosures for non-financial assetsThis amendment is effective for annual periods beginning on or after 1 January 2014. These amendments remove the unintended consequences of IFRS 13 on the disclosures required under IAS 36. In addition, these amendments require disclosure of the recoverable amounts for the assets or CGUs for which impairment loss has been recognised or reversed during the period. Management is in the process of assessing the impact of this standard on the financial position or performance of the Group.
ias 39 financial instruments (amended): recognition and measurement - novation of derivatives and continuation of hedge accountingThis amendment is effective for annual periods beginning on or after 1 January 2014. Under the amendment there would be no need to discontinue hedge accounting if a hedging derivative was novated, provided certain criteria are met. The IASB made a narrow-scope amendment to IAS 39 to permit the continuation of hedge accounting in certain circumstances in which the counterparty to a hedging instrument changes in order to achieve clearing for that instrument. This change has no impact on the Group’s financial position or performance.
ias 19 defined benefit plans (amended): employee contributionsThe amendment is effective from 1 July 2014. The amendment applies to contributions from employees or third parties to defined benefit plans. The objective of the amendment is to simplify the accounting for contributions that are independent of the number of years of employee service, for example, employee contributions that are calculated according to a fixed percentage of salary. This change has no impact on the Group’s financial position or performance.
84 NEW EUROPE PROPERTY INVESTMENTS PLC ANNUAL REPORT 2013
Notes to the financial statements » continued
ifriC interpretation 21: leviesThe interpretation is effective for annual periods beginning on or after 1 January 2014. The Interpretations Committee was asked to consider how an entity should account for liabilities to pay levies imposed by governments, other than income taxes, in its financial statements. This Interpretation is an interpretation of IAS 37 Provisions, Contingent Liabilities and Contingent Assets. IAS 37 sets out criteria for the recognition of a liability, one of which is the requirement for the entity to have a present obligation as a result of a past event (known as an obligating event). The Interpretation clarifies that the obligating event that gives rise to a liability to pay a levy is the activity described in the relevant legislation that triggers the payment of the levy. This change has no impact on the Group’s financial position or performance.
annual improvementsThe IASB has issued the Annual Improvements to IFRSs 2010–2012 Cycle, which is a collection of amendments to IFRSs. The amendments are effective for annual periods beginning on or after 1 July 2014. Management is in the process of assessing the impact of this standard on the financial position or performance of the Group.
— IFRS 2 Share-based Payment: This improvement amends the definitions of ‘vesting condition’ and ‘market condition’ and adds definitions for ‘performance condition’ and ‘service condition’ (which were previously part of the definition of ‘vesting condition’).
— IFRS 3 Business combinations: This improvement clarifies that contingent consideration in a business acquisition that is not classified as equity is subsequently measured at fair value through profit or loss whether or not it falls within the scope of IFRS 9 Financial Instruments.
— IFRS 8 Operating Segments: This improvement requires an entity to disclose the judgments made by management in applying the aggregation criteria to operating segments and clarifies that an entity shall only provide reconciliations of the total of the reportable segments’ assets to the entity’s assets if the segment assets are reported regularly.
— IFRS 13 Fair Value Measurement: This improvement in the Basis of Conclusion of IFRS 13 clarifies that issuing IFRS 13 and amending IFRS 9 and IAS 39 did not remove the ability to measure short-term receivables and payables with no stated interest rate at their invoice amounts without discounting if the effect of not discounting is immaterial.
— IAS 16 Property Plant & Equipment: The amendment clarifies that when an item of property, plant and equipment is revalued, the gross carrying amount is adjusted in a manner that is consistent with the revaluation of the carrying amount.
— IAS 24 Related Party Disclosures: The amendment clarifies that an entity providing key management personnel services to the reporting entity or to the parent of the reporting entity is a related party of the reporting entity.
— IAS 38 Intangible Assets: The amendment clarifies that when an intangible asset is revalued the gross carrying amount is adjusted in a manner that is consistent with the revaluation of the carrying amount.
— The IASB has issued the Annual Improvements to IFRSs 2011–2013 Cycle, which is a collection of amendments to IFRSs. The amendments are effective for annual periods beginning on or after 1 July 2014. Management is in the process of assessing the impact of this standard on the financial position or performance of the Group.
— IFRS 3 Business Combinations: This improvement clarifies that IFRS 3 excludes from its scope the accounting for the formation of a joint arrangement in the financial statements of the joint arrangement itself.
— IFRS 13 Fair Value Measurement: This improvement clarifies that the scope of the portfolio exception defined in paragraph 52 of IFRS 13 includes all contracts accounted for within the scope of IAS 39 Financial Instruments: Recognition and Measurement or IFRS 9 Financial Instruments, regardless of whether they meet the definition of financial assets or financial liabilities as defined in IAS 32 Financial Instruments: Presentation.
— IAS 40 Investment Properties: This improvement clarifies that determining whether a specific transaction meets the definition of both a business combination as defined in IFRS 3 Business Combinations and investment property as defined in IAS 40 Investment Property requires the separate application of both standards independently of each other.
NEW EUROPE PROPERTY INVESTMENTS PLC ANNUAL REPORT 2013 85
4 CritiCal aCCounting estimates and judgements in applYing aCCounting poliCies
The Group’s management discusses with the Audit and Risk Committee the development, selection and disclosure of the Group’s critical accounting policies and estimates, as well as their application.
The estimates and associated assumptions are based on historical experience and various other factors reasonable under the circumstances. These are used to make judgements about the carrying values of assets and liabilities that are not apparent from other sources. Actual results may differ from these estimates.
The estimates and associated assumptions are reviewed on an ongoing basis. Revisions to accounting estimates are recognised in the period when the estimate is revised if the revision affects only that period or in the period of the revision and future periods if the revision affects both.
Judgements that have the most significant effect on the amounts recognised in the financial statements and estimates that can cause a significant adjustment to the carrying amount of assets and liabilities within the next financial year are detailed below.
valuation of investment propertiesInvestment property is stated at its fair value based on reports prepared by an international valuation company at each end of the reporting period. Valuations are based principally on discounted cash flow projections based on reliable estimates of future cash flows, using discount rates that reflect current market assessments of the uncertainty in the amount and timing of the cash flows. These are supported by the terms of any existing lease and other contracts and by external evidence such as current market rents for similar properties in the same location and condition.
In preparing the valuation reports on the Group’s investment property, the external appraisers excluded distressed sales when considering comparable sales prices. Management reviewed the appraisers’ assumptions relating to the discounted cash flow models used in the valuations, and confirmed that factors such as the discount rate applied have been appropriately determined considering the market conditions at the end of the reporting period.
Valuations of the income generating properties are based on cash flow statements, in which the present value of net operating income during a ten-year period and the residual value of the property at the end of the period are calculated.
Forecasts of net operating income are based on leases signed at the time of the valuation date, the estimated rental values for existing leases when they expire and the estimated achievable rental values of to the existing vacancies. The value of long-term vacancies is estimated based on the property’s location and condition. The valuers’ assessments of non-recoverable expenses are based on their experience of comparable properties and historical costs provided by the Group.
The discount rates used are nominal returns on total capital before tax and vary between 7.5% and 12%. The required rates of return are based on assessments of the market’s required returns for similar properties. The discount rate is set individually for each property and is based on the condition and location, the stability of the tenant and lease length.
business combinations or asset acquisitionsThe Group assesses for each property or entity acquired whether the transaction represents a business combination or an asset acquisition. The basis for this assessment is described in Note 3.2.
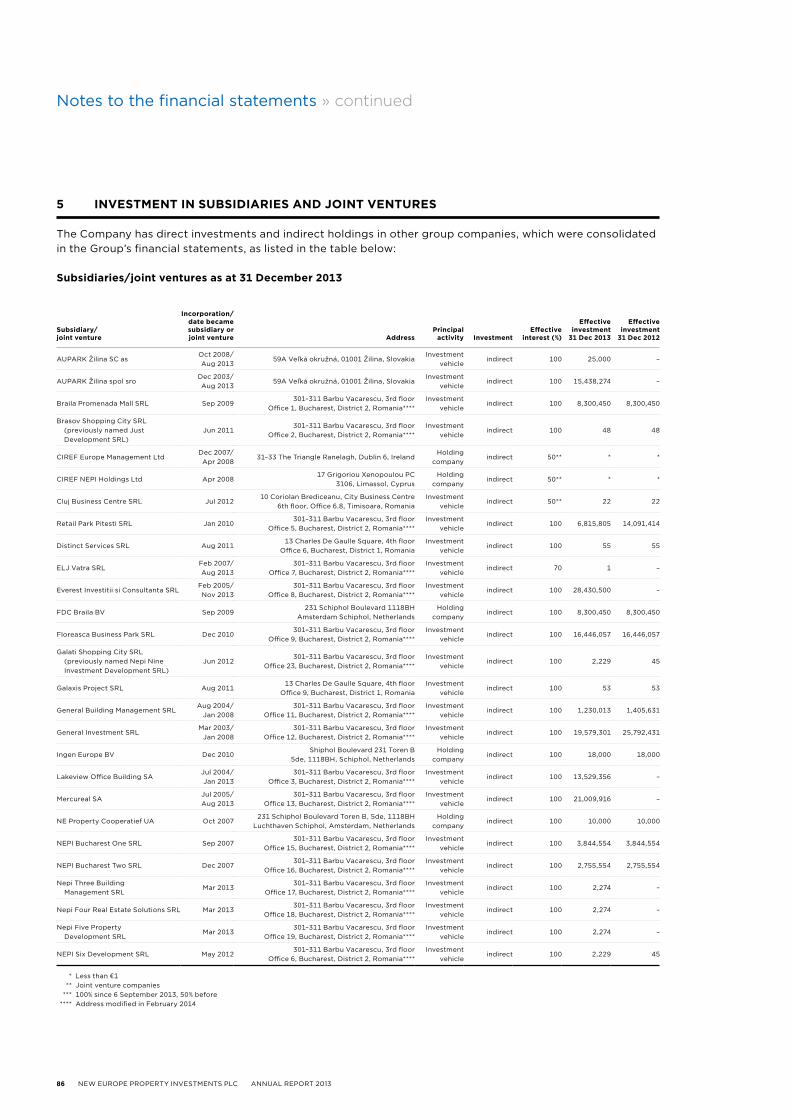
86 NEW EUROPE PROPERTY INVESTMENTS PLC ANNUAL REPORT 2013
Notes to the financial statements » continued
subsidiary/ joint venture
incorporation/date became subsidiary or joint venture address
principal activity investment
effective interest (%)
effective investment
31 dec 2013
effective investment
31 dec 2012
AUPARK Žilina SC asOct 2008/ Aug 2013
59A Veľká okružná, 01001 Žilina, SlovakiaInvestment
vehicleindirect 100 25,000 –
AUPARK Žilina spol sroDec 2003/ Aug 2013
59A Veľká okružná, 01001 Žilina, SlovakiaInvestment
vehicleindirect 100 15,438,274 –
Braila Promenada Mall SRL Sep 2009301–311 Barbu Vacarescu, 3rd floor
Office 1, Bucharest, District 2, Romania****Investment
vehicleindirect 100 8,300,450 8,300,450
Brasov Shopping City SRL (previously named Just Development SRL)
Jun 2011301–311 Barbu Vacarescu, 3rd floor
Office 2, Bucharest, District 2, Romania**** Investment
vehicleindirect 100 48 48
CIREF Europe Management LtdDec 2007/ Apr 2008
31–33 The Triangle Ranelagh, Dublin 6, IrelandHolding
companyindirect 50** * *
CIREF NEPI Holdings Ltd Apr 200817 Grigoriou Xenopoulou PC
3106, Limassol, CyprusHolding
companyindirect 50** * *
Cluj Business Centre SRL Jul 201210 Coriolan Brediceanu, City Business Centre
6th floor, Office 6.8, Timisoara, RomaniaInvestment
vehicleindirect 50** 22 22
Retail Park Pitesti SRL Jan 2010301–311 Barbu Vacarescu, 3rd floor
Office 5, Bucharest, District 2, Romania**** Investment
vehicleindirect 100 6,815,805 14,091,414
Distinct Services SRL Aug 201113 Charles De Gaulle Square, 4th floor
Office 6, Bucharest, District 1, RomaniaInvestment
vehicleindirect 100 55 55
ELJ Vatra SRLFeb 2007/ Aug 2013
301–311 Barbu Vacarescu, 3rd floorOffice 7, Bucharest, District 2, Romania****
Investment vehicle
indirect 70 1 –
Everest Investitii si Consultanta SRLFeb 2005/ Nov 2013
301–311 Barbu Vacarescu, 3rd floorOffice 8, Bucharest, District 2, Romania****
Investment vehicle
indirect 100 28,430,500 –
FDC Braila BV Sep 2009231 Schiphol Boulevard 1118BH
Amsterdam Schiphol, NetherlandsHolding
companyindirect 100 8,300,450 8,300,450
Floreasca Business Park SRL Dec 2010301–311 Barbu Vacarescu, 3rd floor
Office 9, Bucharest, District 2, Romania**** Investment
vehicleindirect 100 16,446,057 16,446,057
Galati Shopping City SRL (previously named Nepi Nine Investment Development SRL)
Jun 2012301–311 Barbu Vacarescu, 3rd floor
Office 23, Bucharest, District 2, Romania**** Investment
vehicleindirect 100 2,229 45
Galaxis Project SRL Aug 201113 Charles De Gaulle Square, 4th floor
Office 9, Bucharest, District 1, RomaniaInvestment
vehicleindirect 100 53 53
General Building Management SRLAug 2004/
Jan 2008301–311 Barbu Vacarescu, 3rd floor
Office 11, Bucharest, District 2, Romania**** Investment
vehicleindirect 100 1,230,013 1,405,631
General Investment SRL Mar 2003/
Jan 2008301–311 Barbu Vacarescu, 3rd floor
Office 12, Bucharest, District 2, Romania**** Investment
vehicleindirect 100 19,579,301 25,792,431
Ingen Europe BV Dec 2010Shiphol Boulevard 231 Toren B
5de, 1118BH, Schiphol, NetherlandsHolding
companyindirect 100 18,000 18,000
Lakeview Office Building SAJul 2004/ Jan 2013
301–311 Barbu Vacarescu, 3rd floorOffice 3, Bucharest, District 2, Romania****
Investment vehicle
indirect 100 13,529,356 –
Mercureal SAJul 2005/ Aug 2013
301–311 Barbu Vacarescu, 3rd floorOffice 13, Bucharest, District 2, Romania****
Investment vehicle
indirect 100 21,009,916 –
NE Property Cooperatief UA Oct 2007231 Schiphol Boulevard Toren B, 5de, 1118BH
Luchthaven Schiphol, Amsterdam, NetherlandsHolding
companyindirect 100 10,000 10,000
NEPI Bucharest One SRL Sep 2007301–311 Barbu Vacarescu, 3rd floor
Office 15, Bucharest, District 2, Romania**** Investment
vehicleindirect 100 3,844,554 3,844,554
NEPI Bucharest Two SRL Dec 2007301–311 Barbu Vacarescu, 3rd floor
Office 16, Bucharest, District 2, Romania**** Investment
vehicleindirect 100 2,755,554 2,755,554
Nepi Three Building Management SRL
Mar 2013301–311 Barbu Vacarescu, 3rd floor
Office 17, Bucharest, District 2, Romania**** Investment
vehicleindirect 100 2,274 –
Nepi Four Real Estate Solutions SRL Mar 2013301–311 Barbu Vacarescu, 3rd floor
Office 18, Bucharest, District 2, Romania**** Investment
vehicleindirect 100 2,274 –
Nepi Five Property Development SRL
Mar 2013301–311 Barbu Vacarescu, 3rd floor
Office 19, Bucharest, District 2, Romania**** Investment
vehicleindirect 100 2,274 –
NEPI Six Development SRL May 2012301–311 Barbu Vacarescu, 3rd floor
Office 6, Bucharest, District 2, Romania**** Investment
vehicleindirect 100 2,229 45
* Less than €1 ** Joint venture companies *** 100% since 6 September 2013, 50% before **** Address modified in February 2014
5 investment in subsidiaries and joint ventures
The Company has direct investments and indirect holdings in other group companies, which were consolidated in the Group’s financial statements, as listed in the table below:
subsidiaries/joint ventures as at 31 december 2013
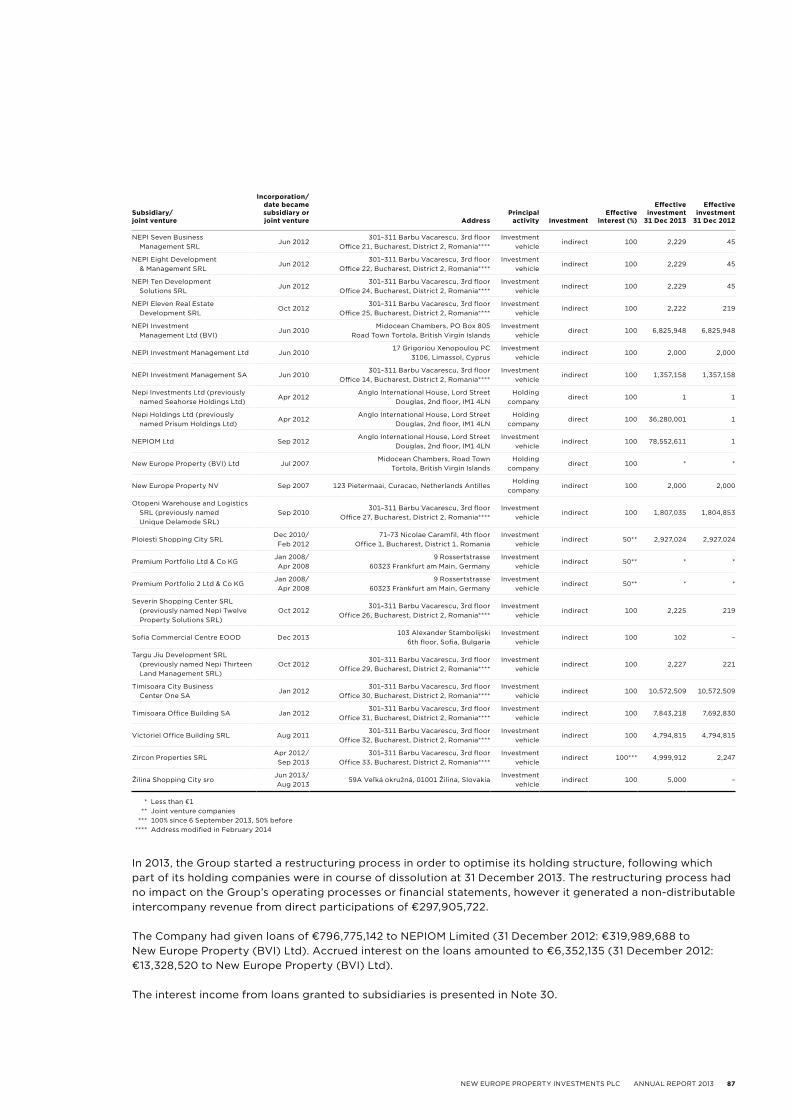
NEW EUROPE PROPERTY INVESTMENTS PLC ANNUAL REPORT 2013 87
subsidiary/ joint venture
incorporation/date became subsidiary or joint venture address
principal activity investment
effective interest (%)
effective investment
31 dec 2013
effective investment
31 dec 2012
NEPI Seven Business Management SRL
Jun 2012301–311 Barbu Vacarescu, 3rd floor
Office 21, Bucharest, District 2, Romania**** Investment
vehicleindirect 100 2,229 45
NEPI Eight Development & Management SRL
Jun 2012301–311 Barbu Vacarescu, 3rd floor
Office 22, Bucharest, District 2, Romania**** Investment
vehicleindirect 100 2,229 45
NEPI Ten Development Solutions SRL
Jun 2012301–311 Barbu Vacarescu, 3rd floor
Office 24, Bucharest, District 2, Romania**** Investment
vehicleindirect 100 2,229 45
NEPI Eleven Real Estate Development SRL
Oct 2012301–311 Barbu Vacarescu, 3rd floor
Office 25, Bucharest, District 2, Romania**** Investment
vehicleindirect 100 2,222 219
NEPI Investment Management Ltd (BVI)
Jun 2010Midocean Chambers, PO Box 805
Road Town Tortola, British Virgin IslandsInvestment
vehicledirect 100 6,825,948 6,825,948
NEPI Investment Management Ltd Jun 201017 Grigoriou Xenopoulou PC
3106, Limassol, CyprusInvestment
vehicleindirect 100 2,000 2,000
NEPI Investment Management SA Jun 2010301–311 Barbu Vacarescu, 3rd floor
Office 14, Bucharest, District 2, Romania**** Investment
vehicleindirect 100 1,357,158 1,357,158
Nepi Investments Ltd (previously named Seahorse Holdings Ltd)
Apr 2012Anglo International House, Lord Street
Douglas, 2nd floor, IM1 4LNHolding
companydirect 100 1 1
Nepi Holdings Ltd (previously named Prisum Holdings Ltd)
Apr 2012Anglo International House, Lord Street
Douglas, 2nd floor, IM1 4LNHolding
companydirect 100 36,280,001 1
NEPIOM Ltd Sep 2012Anglo International House, Lord Street
Douglas, 2nd floor, IM1 4LNInvestment
vehicleindirect 100 78,552,611 1
New Europe Property (BVI) Ltd Jul 2007Midocean Chambers, Road Town
Tortola, British Virgin IslandsHolding
companydirect 100 * *
New Europe Property NV Sep 2007 123 Pietermaai, Curacao, Netherlands AntillesHolding
companyindirect 100 2,000 2,000
Otopeni Warehouse and Logistics SRL (previously named Unique Delamode SRL)
Sep 2010301–311 Barbu Vacarescu, 3rd floor
Office 27, Bucharest, District 2, Romania****Investment
vehicleindirect 100 1,807,035 1,804,853
Ploiesti Shopping City SRLDec 2010/
Feb 201271–73 Nicolae Caramfil, 4th floor
Office 1, Bucharest, District 1, RomaniaInvestment
vehicleindirect 50** 2,927,024 2,927,024
Premium Portfolio Ltd & Co KG Jan 2008/Apr 2008
9 Rossertstrasse60323 Frankfurt am Main, Germany
Investment vehicle
indirect 50** * *
Premium Portfolio 2 Ltd & Co KG Jan 2008/Apr 2008
9 Rossertstrasse60323 Frankfurt am Main, Germany
Investment vehicle
indirect 50** * *
Severin Shopping Center SRL (previously named Nepi Twelve Property Solutions SRL)
Oct 2012301–311 Barbu Vacarescu, 3rd floor
Office 26, Bucharest, District 2, Romania****Investment
vehicleindirect 100 2,225 219
Sofia Commercial Centre EOOD Dec 2013103 Alexander Stambolijski
6th floor, Sofia, BulgariaInvestment
vehicleindirect 100 102 –
Targu Jiu Development SRL (previously named Nepi Thirteen Land Management SRL)
Oct 2012301–311 Barbu Vacarescu, 3rd floor
Office 29, Bucharest, District 2, Romania****Investment
vehicleindirect 100 2,227 221
Timisoara City Business Center One SA
Jan 2012301–311 Barbu Vacarescu, 3rd floor
Office 30, Bucharest, District 2, Romania****Investment
vehicleindirect 100 10,572,509 10,572,509
Timisoara Office Building SA Jan 2012301–311 Barbu Vacarescu, 3rd floor
Office 31, Bucharest, District 2, Romania****Investment
vehicleindirect 100 7,843,218 7,692,830
Victoriei Office Building SRL Aug 2011301–311 Barbu Vacarescu, 3rd floor
Office 32, Bucharest, District 2, Romania****Investment
vehicleindirect 100 4,794,815 4,794,815
Zircon Properties SRLApr 2012/ Sep 2013
301–311 Barbu Vacarescu, 3rd floorOffice 33, Bucharest, District 2, Romania****
Investment vehicle
indirect 100*** 4,999,912 2,247
Žilina Shopping City sroJun 2013/ Aug 2013
59A Veľká okružná, 01001 Žilina, SlovakiaInvestment
vehicleindirect 100 5,000 –
* Less than €1 ** Joint venture companies *** 100% since 6 September 2013, 50% before **** Address modified in February 2014
In 2013, the Group started a restructuring process in order to optimise its holding structure, following which part of its holding companies were in course of dissolution at 31 December 2013. The restructuring process had no impact on the Group’s operating processes or financial statements, however it generated a non-distributable intercompany revenue from direct participations of €297,905,722.
The Company had given loans of €796,775,142 to NEPIOM Limited (31 December 2012: €319,989,688 to New Europe Property (BVI) Ltd). Accrued interest on the loans amounted to €6,352,135 (31 December 2012: €13,328,520 to New Europe Property (BVI) Ltd).
The interest income from loans granted to subsidiaries is presented in Note 30.
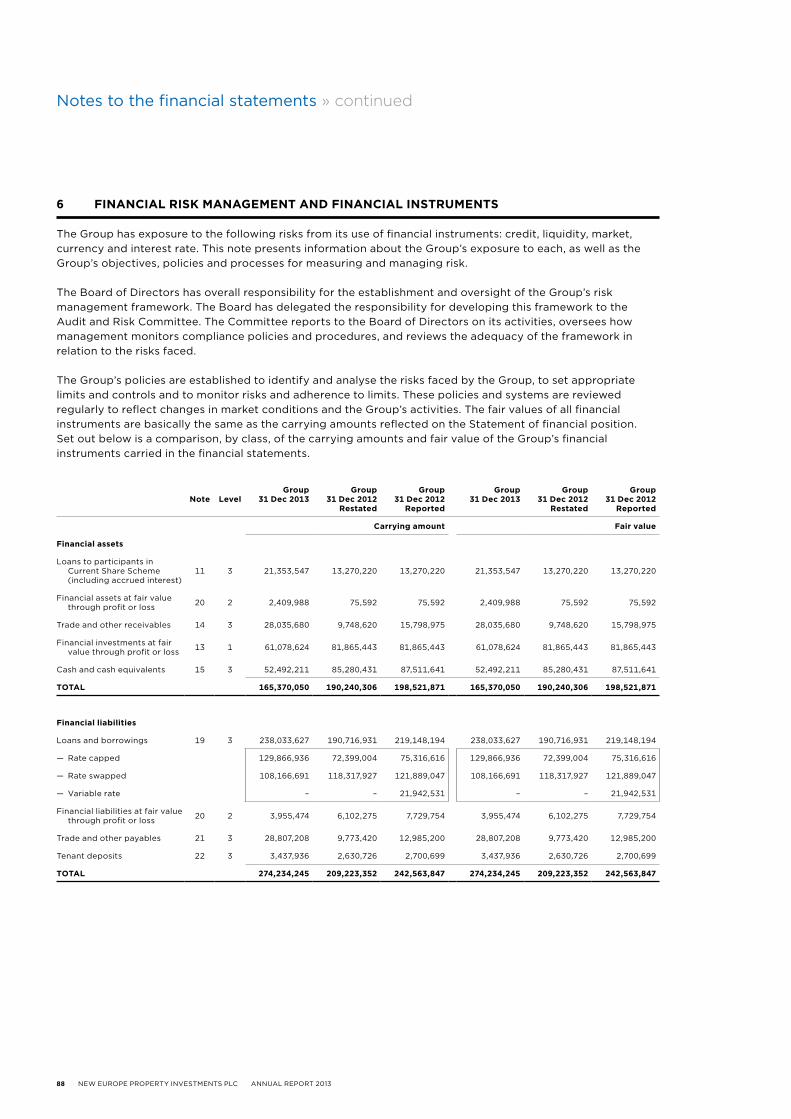
88 NEW EUROPE PROPERTY INVESTMENTS PLC ANNUAL REPORT 2013
Notes to the financial statements » continued
6 finanCial risK management and finanCial instruments
The Group has exposure to the following risks from its use of financial instruments: credit, liquidity, market, currency and interest rate. This note presents information about the Group’s exposure to each, as well as the Group’s objectives, policies and processes for measuring and managing risk.
The Board of Directors has overall responsibility for the establishment and oversight of the Group’s risk management framework. The Board has delegated the responsibility for developing this framework to the Audit and Risk Committee. The Committee reports to the Board of Directors on its activities, oversees how management monitors compliance policies and procedures, and reviews the adequacy of the framework in relation to the risks faced.
The Group’s policies are established to identify and analyse the risks faced by the Group, to set appropriate limits and controls and to monitor risks and adherence to limits. These policies and systems are reviewed regularly to reflect changes in market conditions and the Group’s activities. The fair values of all financial instruments are basically the same as the carrying amounts reflected on the Statement of financial position. Set out below is a comparison, by class, of the carrying amounts and fair value of the Group’s financial instruments carried in the financial statements.
note levelgroup
31 dec 2013group
31 dec 2012restated
group 31 dec 2012
reported
group 31 dec 2013
group 31 dec 2012
restated
group 31 dec 2012
reported
Carrying amount fair value
financial assets
Loans to participants in Current Share Scheme (including accrued interest)
11 3 21,353,547 13,270,220 13,270,220 21,353,547 13,270,220 13,270,220
Financial assets at fair value through profit or loss 20 2 2,409,988 75,592 75,592 2,409,988 75,592 75,592
Trade and other receivables 14 3 28,035,680 9,748,620 15,798,975 28,035,680 9,748,620 15,798,975
Financial investments at fair value through profit or loss 13 1 61,078,624 81,865,443 81,865,443 61,078,624 81,865,443 81,865,443
Cash and cash equivalents 15 3 52,492,211 85,280,431 87,511,641 52,492,211 85,280,431 87,511,641
total 165,370,050 190,240,306 198,521,871 165,370,050 190,240,306 198,521,871
financial liabilities
Loans and borrowings 19 3 238,033,627 190,716,931 219,148,194 238,033,627 190,716,931 219,148,194
— Rate capped 129,866,936 72,399,004 75,316,616 129,866,936 72,399,004 75,316,616
— Rate swapped 108,166,691 118,317,927 121,889,047 108,166,691 118,317,927 121,889,047
— Variable rate – – 21,942,531 – – 21,942,531
Financial liabilities at fair value through profit or loss 20 2 3,955,474 6,102,275 7,729,754 3,955,474 6,102,275 7,729,754
Trade and other payables 21 3 28,807,208 9,773,420 12,985,200 28,807,208 9,773,420 12,985,200
Tenant deposits 22 3 3,437,936 2,630,726 2,700,699 3,437,936 2,630,726 2,700,699
total 274,234,245 209,223,352 242,563,847 274,234,245 209,223,352 242,563,847
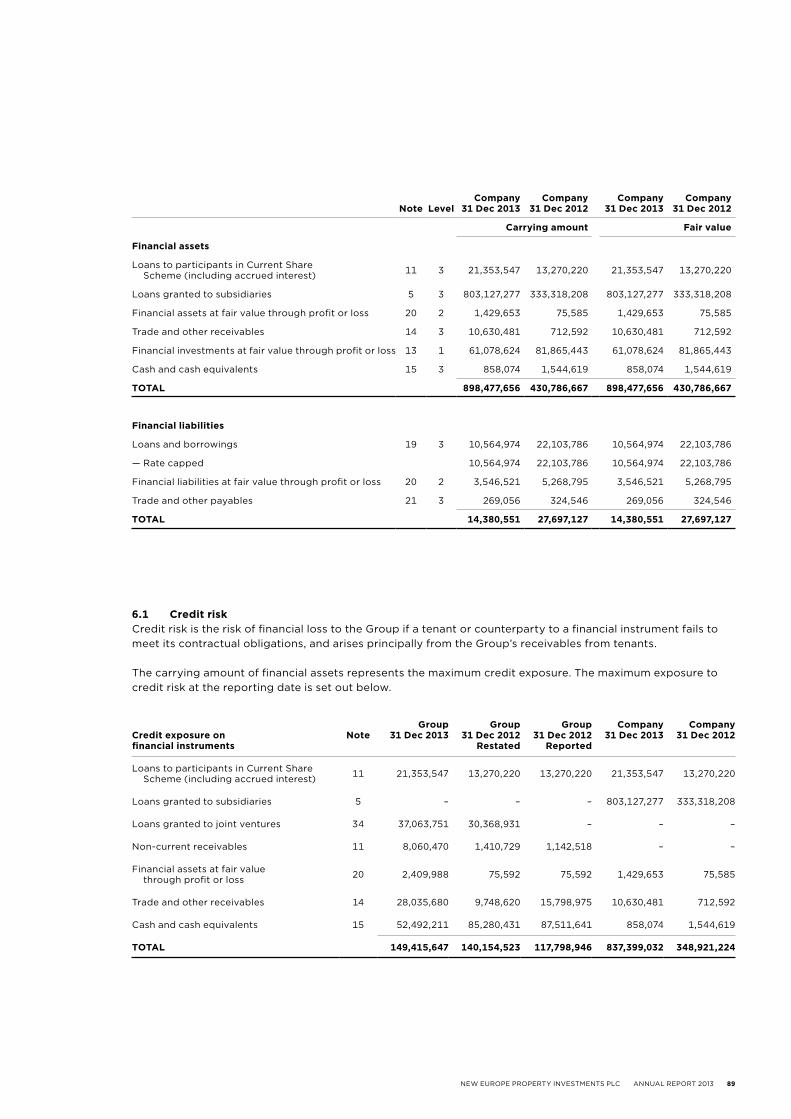
NEW EUROPE PROPERTY INVESTMENTS PLC ANNUAL REPORT 2013 89
note levelCompany
31 dec 2013Company
31 dec 2012Company
31 dec 2013Company
31 dec 2012
Carrying amount fair value
financial assets
Loans to participants in Current Share Scheme (including accrued interest) 11 3 21,353,547 13,270,220 21,353,547 13,270,220
Loans granted to subsidiaries 5 3 803,127,277 333,318,208 803,127,277 333,318,208
Financial assets at fair value through profit or loss 20 2 1,429,653 75,585 1,429,653 75,585
Trade and other receivables 14 3 10,630,481 712,592 10,630,481 712,592
Financial investments at fair value through profit or loss 13 1 61,078,624 81,865,443 61,078,624 81,865,443
Cash and cash equivalents 15 3 858,074 1,544,619 858,074 1,544,619
total 898,477,656 430,786,667 898,477,656 430,786,667
financial liabilities
Loans and borrowings 19 3 10,564,974 22,103,786 10,564,974 22,103,786
— Rate capped 10,564,974 22,103,786 10,564,974 22,103,786
Financial liabilities at fair value through profit or loss 20 2 3,546,521 5,268,795 3,546,521 5,268,795
Trade and other payables 21 3 269,056 324,546 269,056 324,546
total 14,380,551 27,697,127 14,380,551 27,697,127
6.1 Credit riskCredit risk is the risk of financial loss to the Group if a tenant or counterparty to a financial instrument fails to meet its contractual obligations, and arises principally from the Group’s receivables from tenants.
The carrying amount of financial assets represents the maximum credit exposure. The maximum exposure to credit risk at the reporting date is set out below.
Credit exposure onfinancial instruments
notegroup
31 dec 2013group
31 dec 2012restated
group31 dec 2012
reported
Company31 dec 2013
Company31 dec 2012
Loans to participants in Current Share Scheme (including accrued interest) 11 21,353,547 13,270,220 13,270,220 21,353,547 13,270,220
Loans granted to subsidiaries 5 – – – 803,127,277 333,318,208
Loans granted to joint ventures 34 37,063,751 30,368,931 – – –
Non-current receivables 11 8,060,470 1,410,729 1,142,518 – –
Financial assets at fair value through profit or loss 20 2,409,988 75,592 75,592 1,429,653 75,585
Trade and other receivables 14 28,035,680 9,748,620 15,798,975 10,630,481 712,592
Cash and cash equivalents 15 52,492,211 85,280,431 87,511,641 858,074 1,544,619
total 149,415,647 140,154,523 117,798,946 837,399,032 348,921,224
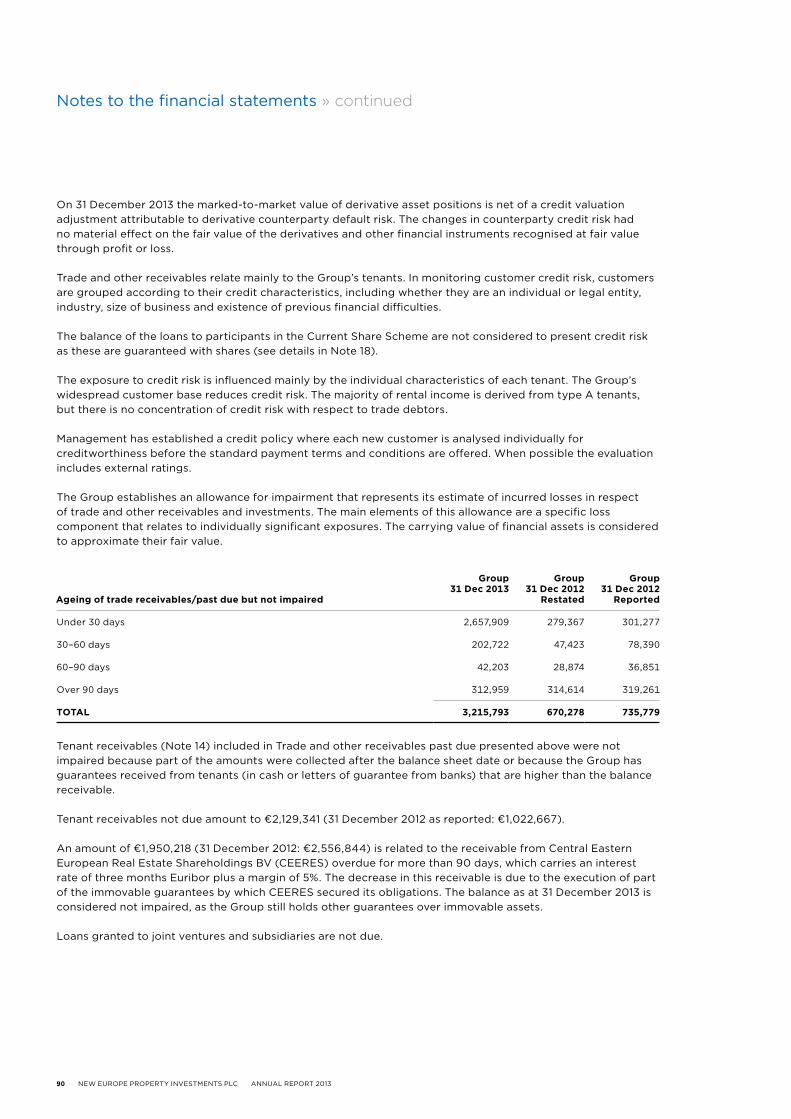
90 NEW EUROPE PROPERTY INVESTMENTS PLC ANNUAL REPORT 2013
Notes to the financial statements » continued
On 31 December 2013 the marked-to-market value of derivative asset positions is net of a credit valuation adjustment attributable to derivative counterparty default risk. The changes in counterparty credit risk had no material effect on the fair value of the derivatives and other financial instruments recognised at fair value through profit or loss.
Trade and other receivables relate mainly to the Group’s tenants. In monitoring customer credit risk, customers are grouped according to their credit characteristics, including whether they are an individual or legal entity, industry, size of business and existence of previous financial difficulties.
The balance of the loans to participants in the Current Share Scheme are not considered to present credit risk as these are guaranteed with shares (see details in Note 18).
The exposure to credit risk is influenced mainly by the individual characteristics of each tenant. The Group’s widespread customer base reduces credit risk. The majority of rental income is derived from type A tenants, but there is no concentration of credit risk with respect to trade debtors.
Management has established a credit policy where each new customer is analysed individually for creditworthiness before the standard payment terms and conditions are offered. When possible the evaluation includes external ratings.
The Group establishes an allowance for impairment that represents its estimate of incurred losses in respect of trade and other receivables and investments. The main elements of this allowance are a specific loss component that relates to individually significant exposures. The carrying value of financial assets is considered to approximate their fair value.
ageing of trade receivables/past due but not impaired
group31 dec 2013
group31 dec 2012
restated
group31 dec 2012
reported
Under 30 days 2,657,909 279,367 301,277
30–60 days 202,722 47,423 78,390
60–90 days 42,203 28,874 36,851
Over 90 days 312,959 314,614 319,261
total 3,215,793 670,278 735,779
Tenant receivables (Note 14) included in Trade and other receivables past due presented above were not impaired because part of the amounts were collected after the balance sheet date or because the Group has guarantees received from tenants (in cash or letters of guarantee from banks) that are higher than the balance receivable.
Tenant receivables not due amount to €2,129,341 (31 December 2012 as reported: €1,022,667).
An amount of €1,950,218 (31 December 2012: €2,556,844) is related to the receivable from Central Eastern European Real Estate Shareholdings BV (CEERES) overdue for more than 90 days, which carries an interest rate of three months Euribor plus a margin of 5%. The decrease in this receivable is due to the execution of part of the immovable guarantees by which CEERES secured its obligations. The balance as at 31 December 2013 is considered not impaired, as the Group still holds other guarantees over immovable assets.
Loans granted to joint ventures and subsidiaries are not due.
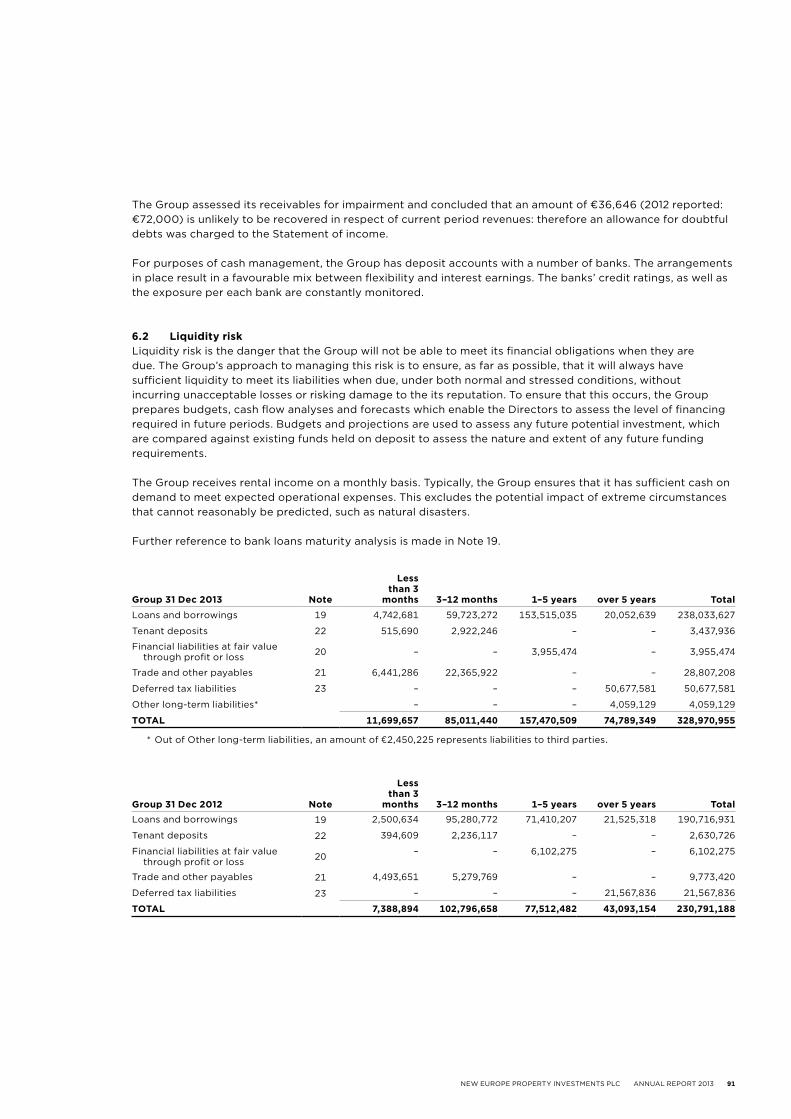
NEW EUROPE PROPERTY INVESTMENTS PLC ANNUAL REPORT 2013 91
The Group assessed its receivables for impairment and concluded that an amount of €36,646 (2012 reported: €72,000) is unlikely to be recovered in respect of current period revenues: therefore an allowance for doubtful debts was charged to the Statement of income.
For purposes of cash management, the Group has deposit accounts with a number of banks. The arrangements in place result in a favourable mix between flexibility and interest earnings. The banks’ credit ratings, as well as the exposure per each bank are constantly monitored.
6.2 liquidity riskLiquidity risk is the danger that the Group will not be able to meet its financial obligations when they are due. The Group’s approach to managing this risk is to ensure, as far as possible, that it will always have sufficient liquidity to meet its liabilities when due, under both normal and stressed conditions, without incurring unacceptable losses or risking damage to the its reputation. To ensure that this occurs, the Group prepares budgets, cash flow analyses and forecasts which enable the Directors to assess the level of financing required in future periods. Budgets and projections are used to assess any future potential investment, which are compared against existing funds held on deposit to assess the nature and extent of any future funding requirements.
The Group receives rental income on a monthly basis. Typically, the Group ensures that it has sufficient cash on demand to meet expected operational expenses. This excludes the potential impact of extreme circumstances that cannot reasonably be predicted, such as natural disasters.
Further reference to bank loans maturity analysis is made in Note 19.
group 31 dec 2013 note
lessthan 3
months 3–12 months 1–5 years over 5 years total
Loans and borrowings 19 4,742,681 59,723,272 153,515,035 20,052,639 238,033,627
Tenant deposits 22 515,690 2,922,246 – – 3,437,936
Financial liabilities at fair value through profit or loss 20 – – 3,955,474 – 3,955,474
Trade and other payables 21 6,441,286 22,365,922 – – 28,807,208
Deferred tax liabilities 23 – – – 50,677,581 50,677,581
Other long-term liabilities* – – – 4,059,129 4,059,129
total 11,699,657 85,011,440 157,470,509 74,789,349 328,970,955
* Out of Other long-term liabilities, an amount of €2,450,225 represents liabilities to third parties.
group 31 dec 2012 note
lessthan 3
months 3–12 months 1–5 years over 5 years totalLoans and borrowings 19 2,500,634 95,280,772 71,410,207 21,525,318 190,716,931
Tenant deposits 22 394,609 2,236,117 – – 2,630,726
Financial liabilities at fair value through profit or loss 20 – – 6,102,275 – 6,102,275
Trade and other payables 21 4,493,651 5,279,769 – – 9,773,420
Deferred tax liabilities 23 – – – 21,567,836 21,567,836
total 7,388,894 102,796,658 77,512,482 43,093,154 230,791,188
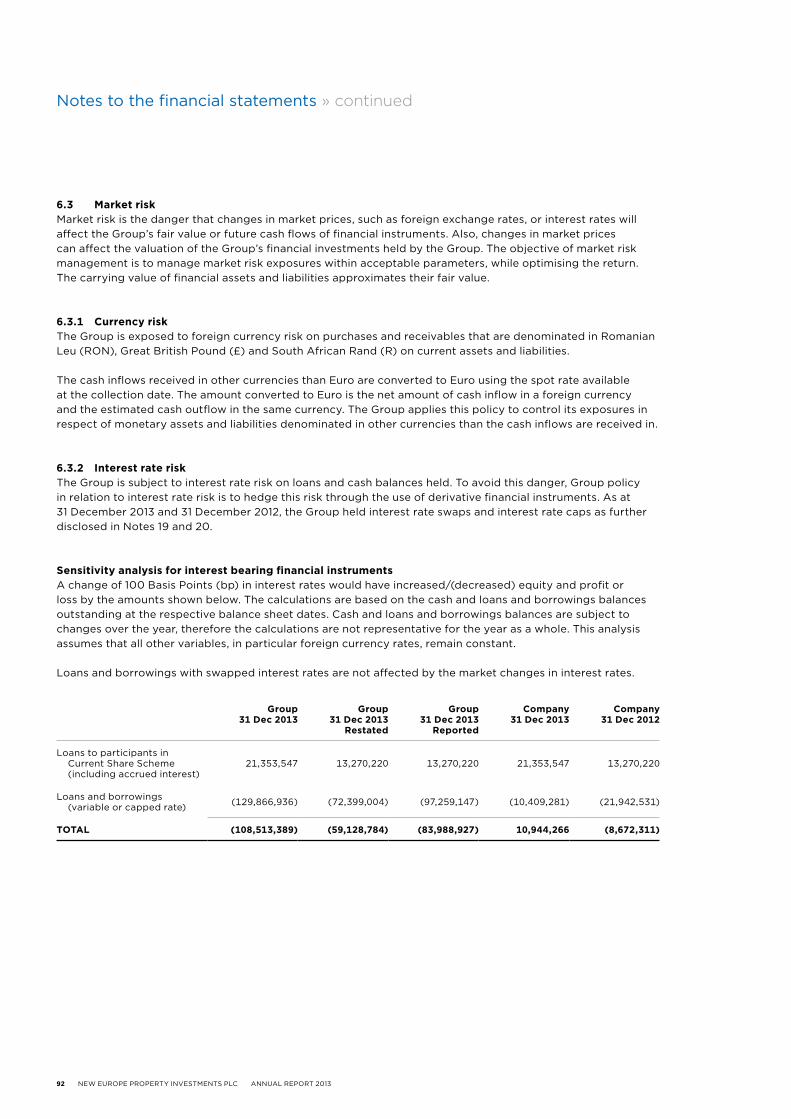
92 NEW EUROPE PROPERTY INVESTMENTS PLC ANNUAL REPORT 2013
Notes to the financial statements » continued
group31 dec 2013
group31 dec 2013
restated
group31 dec 2013
reported
Company31 dec 2013
Company31 dec 2012
Loans to participants in Current Share Scheme (including accrued interest)
21,353,547 13,270,220 13,270,220 21,353,547 13,270,220
Loans and borrowings (variable or capped rate) (129,866,936) (72,399,004) (97,259,147) (10,409,281) (21,942,531)
total (108,513,389) (59,128,784) (83,988,927) 10,944,266 (8,672,311)
6.3 market riskMarket risk is the danger that changes in market prices, such as foreign exchange rates, or interest rates will affect the Group’s fair value or future cash flows of financial instruments. Also, changes in market prices can affect the valuation of the Group’s financial investments held by the Group. The objective of market risk management is to manage market risk exposures within acceptable parameters, while optimising the return. The carrying value of financial assets and liabilities approximates their fair value.
6.3.1 Currency riskThe Group is exposed to foreign currency risk on purchases and receivables that are denominated in Romanian Leu (RON), Great British Pound (£) and South African Rand (R) on current assets and liabilities.
The cash inflows received in other currencies than Euro are converted to Euro using the spot rate available at the collection date. The amount converted to Euro is the net amount of cash inflow in a foreign currency and the estimated cash outflow in the same currency. The Group applies this policy to control its exposures in respect of monetary assets and liabilities denominated in other currencies than the cash inflows are received in.
6.3.2 interest rate riskThe Group is subject to interest rate risk on loans and cash balances held. To avoid this danger, Group policy in relation to interest rate risk is to hedge this risk through the use of derivative financial instruments. As at 31 December 2013 and 31 December 2012, the Group held interest rate swaps and interest rate caps as further disclosed in Notes 19 and 20.
sensitivity analysis for interest bearing financial instrumentsA change of 100 Basis Points (bp) in interest rates would have increased/(decreased) equity and profit or loss by the amounts shown below. The calculations are based on the cash and loans and borrowings balances outstanding at the respective balance sheet dates. Cash and loans and borrowings balances are subject to changes over the year, therefore the calculations are not representative for the year as a whole. This analysis assumes that all other variables, in particular foreign currency rates, remain constant.
Loans and borrowings with swapped interest rates are not affected by the market changes in interest rates.
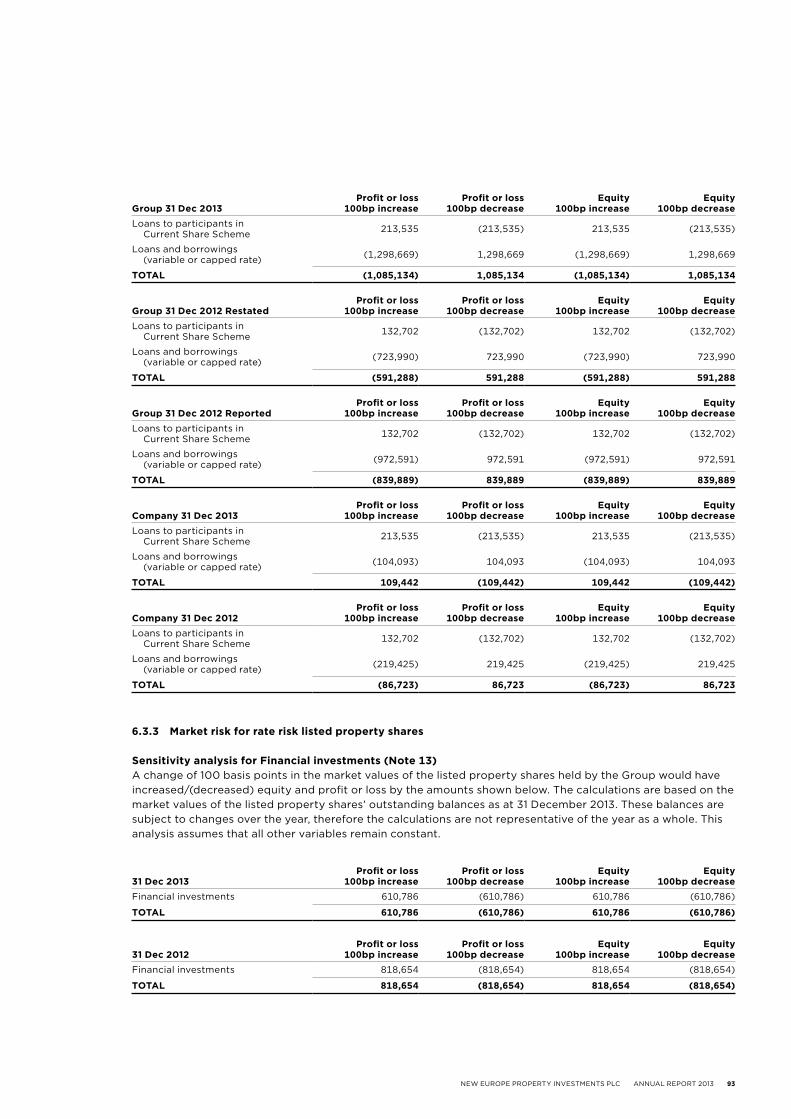
NEW EUROPE PROPERTY INVESTMENTS PLC ANNUAL REPORT 2013 93
group 31 dec 2013profit or loss
100bp increaseprofit or loss
100bp decrease equity
100bp increaseequity
100bp decreaseLoans to participants in
Current Share Scheme 213,535 (213,535) 213,535 (213,535)
Loans and borrowings (variable or capped rate) (1,298,669) 1,298,669 (1,298,669) 1,298,669
total (1,085,134) 1,085,134 (1,085,134) 1,085,134
group 31 dec 2012 restatedprofit or loss
100bp increaseprofit or loss
100bp decrease equity
100bp increaseequity
100bp decrease Loans to participants in
Current Share Scheme 132,702 (132,702) 132,702 (132,702)
Loans and borrowings (variable or capped rate) (723,990) 723,990 (723,990) 723,990
total (591,288) 591,288 (591,288) 591,288
group 31 dec 2012 reportedprofit or loss
100bp increaseprofit or loss
100bp decrease equity
100bp increaseequity
100bp decrease Loans to participants in
Current Share Scheme 132,702 (132,702) 132,702 (132,702)
Loans and borrowings (variable or capped rate) (972,591) 972,591 (972,591) 972,591
total (839,889) 839,889 (839,889) 839,889
Company 31 dec 2013profit or loss
100bp increaseprofit or loss
100bp decrease equity
100bp increaseequity
100bp decrease Loans to participants in
Current Share Scheme 213,535 (213,535) 213,535 (213,535)
Loans and borrowings (variable or capped rate) (104,093) 104,093 (104,093) 104,093
total 109,442 (109,442) 109,442 (109,442)
Company 31 dec 2012profit or loss
100bp increaseprofit or loss
100bp decreaseequity
100bp increaseequity
100bp decreaseLoans to participants in
Current Share Scheme 132,702 (132,702) 132,702 (132,702)
Loans and borrowings (variable or capped rate) (219,425) 219,425 (219,425) 219,425
total (86,723) 86,723 (86,723) 86,723
6.3.3 market risk for rate risk listed property shares
sensitivity analysis for financial investments (note 13)A change of 100 basis points in the market values of the listed property shares held by the Group would have increased/(decreased) equity and profit or loss by the amounts shown below. The calculations are based on the market values of the listed property shares’ outstanding balances as at 31 December 2013. These balances are subject to changes over the year, therefore the calculations are not representative of the year as a whole. This analysis assumes that all other variables remain constant.
31 dec 2013profit or loss
100bp increaseprofit or loss
100bp decreaseequity
100bp increaseequity
100bp decreaseFinancial investments 610,786 (610,786) 610,786 (610,786)
total 610,786 (610,786) 610,786 (610,786)
31 dec 2012profit or loss
100bp increaseprofit or loss
100bp decreaseequity
100bp increaseequity
100bp decreaseFinancial investments 818,654 (818,654) 818,654 (818,654)
total 818,654 (818,654) 818,654 (818,654)
94 NEW EUROPE PROPERTY INVESTMENTS PLC ANNUAL REPORT 2013
Notes to the financial statements » continued
7 internal Controls to manage risKs
The Board is responsible for the Group’s system of internal control and for reviewing its effectiveness. This system is designed to mitigate rather than eliminate the risk of failure to meet business objectives and can provide only reasonable and not absolute assurance against material misstatement or loss.
The key features of the Group’s system of internal control include:— Strategic and business planning: the Group produces and agrees a business plan each year, against
which the performance of the business is regularly monitored.— Investment appraisal: capital projects, major contracts and business and property acquisitions are
reviewed in detail and approved by the Investment Committee and/or the Board where appropriate, in accordance with delegated authority limits.
— Financial monitoring: profitability, cash flow and capital expenditure are closely monitored and key financial information is reported to the Board on a regular basis, including explanations of variances between actual and budgeted performance.
— Systems of control procedures and delegated authorities: there are clearly defined guidelines and approval limits for capital and operating expenditure and other key business transactions and decisions.
8 Capital management
The primary objective of the Group’s capital management is to ensure that it remains within its quantitative banking covenants and maintains a strong credit rating. No changes were made in the objectives, policies or processes during the years ended 31 December 2013 and 31 December 2012.
Capital is primarily monitored by using the gearing ratio, computed as interest bearing debt less cash divided by investment property and listed property shares, which decreased to 22.5% (31 December 2012: 25%).
The Group’s policy is to maintain a strong capital base of equity so as to maintain investor, creditor and market confidence and to sustain future development of the business. The Board of Directors also monitors the level of distributions to shareholders. Neither the Company nor any of its subsidiaries are subject to externally imposed capital requirements.
The Group will retain high levels of access to liquidity due to the instability of the European banking markets, to finance the Group’s development pipeline and to pursue further investment opportunities. In order to mitigate the dilutory effect this has on earnings, a portion of the cash held for capital commitments has been invested in liquid dividend paying listed property shares (details in Note 13).
9 investment propertY at fair value
A schedule of investment property is included on pages 128–129.
movement in investment property at fair value
group31 dec 2013
group31 dec 2012
restated
group31 dec 2012
reported
Carrying value at beginning of year 339,851,226 299,890,036 316,393,495
Additions from business combinations (Note 33) 293,708,904 51,242,968 51,242,968
Additions from joint ventures (Note 34) – – 10,206,824
Transferred from investment property under development 46,924,607 15,378,319 37,976,723
Fair value adjustments of investment property and goodwill (Note 29) 23,370,859 2,005,061 6,811,374
Investment property reclassified as held for sale (44,596) (28,665,158) (28,665,158)
CarrYing value at end of Year 703,811,000 339,851,226 393,966,226
Investment property is carried at fair value that is assessed on an annual basis.
NEW EUROPE PROPERTY INVESTMENTS PLC ANNUAL REPORT 2013 95
The fair value of completed investment property is determined using a discounted cash flow (DCF). Under the DCF method, a property’s fair value is estimated using explicit assumptions regarding the benefits and liabilities of ownership over the asset’s life including an exit or terminal value. As an accepted method within the income approach to valuation, the DCF method involves the projection of a series of cash flows on a real property interest. To this projected cash flow series, an appropriate, market-derived discount rate is applied to establish the present value of the cash inflows associated with the real property.
The duration of the cash flow and the specific timing of inflows and outflows are determined by events such as rent reviews, lease renewal and related lease up periods, re-letting, redevelopment, or refurbishment. The appropriate duration is typically driven by market behaviour. In the case of investment properties, periodic cash flow is typically estimated as gross income less vacancy, nonrecoverable expenses, collection losses, lease incentives, maintenance cost, agent and commission costs and other operating and management expenses. The series of periodic net cash inflows, along with an estimate of the terminal value anticipated at the end of the projection period, is then discounted.
The Group obtained independent appraisal reports from DTZ Echinox Consulting, Jones Lang LaSalle and NAI Apollo Valuation & Research GmbH, all members of RICS (Royal Institution of Chartered Surveyors). The fair value of investment property is based on the year-end appraisal reports. Investment property is classified as Level Three of the fair value hierarchy as defined in IFRS 7.
As at 31 December 2013, the portfolio had a vacancy rate of 2.33% (31 December 2012: 4.8%).
The Group’s investment properties at the end of the reporting period included retail, office and industrial properties and an immaterial amount of residential property in Germany.
IFRS 13 defines fair value as the price that would be received to sell an asset or paid to transfer a liability in an orderly transaction between market participants at the measurement date. The Group now discloses fair values according to a fair ‘value hierarchy’ (as per IFRS 13) which categorises the inputs used in valuation techniques into three levels. The hierarchy gives the highest priority (Level 1) to quoted prices in active markets for identical assets or liabilities and the lowest priority (Level 3) to unobservable inputs. The different levels of the fair value hierarchy are explained below:
— Level 1: Quoted prices (unadjusted) in active markets for identical assets or liabilities that the entity can access at measurement date.
— Level 2: Use of a model with inputs (other than quoted prices included within Level 1) that are directly or indirectly observable market data.
— Level 3: Use of a model with inputs that are not based on observable data.
The Group’s investment property is categorised as level 3. There were no transfers between the hierarchy levels during the year.
The residual value is the market value of the property at the end of the calculation period, which is based on the forecast net operating income for the first year after the calculation period. The required yield at the end of the calculation period is between 7.25% and 10%. The Group’s resulting weighted average net yield was 8.26% for the entire property portfolio (8.04% for retail, 8.46% for office and 10.35% for industrial portfolio).
Based on the year-end valuation net yield of 8.26%, an increase of 25 basis points would result in a €20.7 million value decrease in the Group’s property portfolio.
The significant unobservable inputs used in the fair value measurement categorised within Level 3 of the fair value hierarchy of the Group’s property portfolio, together with the impact of significant movements in these inputs on the fair value measurement, are shown below:
unobservable input impact on fair value of increase in inputEstimated rental value Increase
Net initial yield Decrease
Net reversionary yield Decrease
96 NEW EUROPE PROPERTY INVESTMENTS PLC ANNUAL REPORT 2013
Notes to the financial statements » continued
movement in investment property under development office
group31 dec 2013
group31 dec 2012
restated
group31 dec 2012
reported
Carrying value at beginning of year 12,961,000 18,356,964 18,356,964
Additions from asset deals and construction in progress 1,311,807 1,672,706 5,146,638
Fair value adjustments of investment property and goodwill (Note 29) (122,000) (930,121) (349,889)
Assets which became operational and were transferred to Investment Property at fair value (482,058) (6,138,549) (6,391,393)
CarrYing value at end of Year 13,668,749 12,961,000 16,762,320
Land included in investment property under development is carried at fair value that is assessed on an annual basis. The Group obtained independent appraisal reports from DTZ Echinox Consulting. The fair value of investment property was adjusted based on these year-end appraisal reports. Land included in investment property under development is classified as Level Three of the fair value hierarchy as defined in IFRS 7.
Additions from asset deals include various land plots purchased for development of retail and office projects.
Borrowing costs capitalised in 2013 amount to €3,373,738 (2012: €1,224,115) and were computed using an average annual interest rate of 4.6% (2012: 4.5%).
balance of investment property under development
group31 dec 2013
group31 dec 2012
restated
group31 dec 2012
reported
Retail 89,985,423 3,920,498 5,945,629
Office 13,668,749 12,961,000 16,762,320
total 103,654,172 16,881,498 22,707,949
movement in investment property under developmentretail
group31 dec 2013
group31 dec 2012
restated
group31 dec 2012
reported
Carrying value at beginning of year 4,913,629 – 7,052,378
Additions from business combinations (Note 33) 42,652,504 – 178,919
Additions from joint ventures (Note 34) – – (3,526,239)
Additions from asset deals and construction in progress 74,643,591 13,172,296 34,191,737
Disposals – (1,028) (354,836)
Fair value adjustments of investment property and goodwill (Note 29) 14,218,248 (11,000) (11,000)
Assets which became operational and were transferred to Investment Property at fair value (46,442,549) (9,239,770) (31,585,330)
CarrYing value at end of Year 89,985,423 3,920,498 5,945,629
10 investment propertY under development
NEW EUROPE PROPERTY INVESTMENTS PLC ANNUAL REPORT 2013 97
11 other long-term assets
The other long-term assets are classified as follows:
group 31 dec 2013 Cost
accumulated depreciation/
amortisationnet
book value
Computer licences 112,426 (101,291) 11,135
Office improvements and equipment 349,045 (71,228) 277,817
Equipment used in owner managed activities 131,823 (6,702) 125,121
total 593,294 (179,221) 414,073
group 31 dec 2012 reported Cost
accumulated depreciation/
amortisationnet
book value
Computer licences 93,942 (31,562) 62,380
Office improvements and equipment 165,012 (37,616) 127,396
Equipment used in owner managed activities 131,823 (6,702) 125,121
total 390,777 (75,880) 314,897
group 31 dec 2012 restated Cost
accumulated depreciation/
amortisationnet
book value
Computer licences 93,942 (31,562) 62,380
Office improvements and equipment 165,012 (37,616) 127,396
Equipment used in owner managed activities 131,823 (6,702) 125,121
total 390,777 (75,880) 314,897
Non-current receivables include loans given to third parties that carry an interest rate of 8.9% per annum (2012: 12% per annum).
The property, plant and equipment and intangible assets are detailed as follows:
group 31 dec 2013
group 31 dec 2012
restated
group 31 dec 2012
reported
Company 31 dec 2013
Company 31 dec 2012
Loans to participants in the Current Share Scheme (Note 18) 21,353,547 13,270,220 13,270,220 21,353,547 13,270,220
Non-current receivables 8,060,470 1,410,729 1,142,518 – –
Property, plant and equipment and intangible assets 414,073 314,897 314,897 – –
total 29,828,090 14,995,846 14,727,635 21,353,547 13,270,220
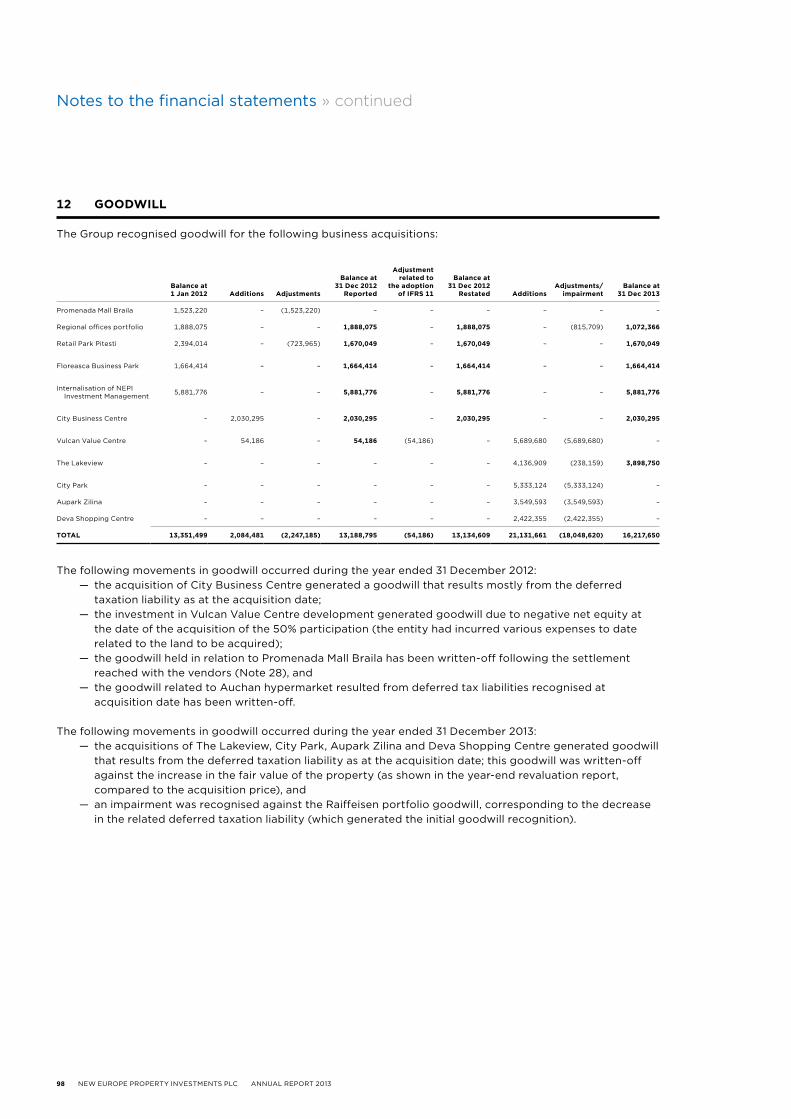
98 NEW EUROPE PROPERTY INVESTMENTS PLC ANNUAL REPORT 2013
Notes to the financial statements » continued
balance at1 jan 2012 additions adjustments
balance at 31 dec 2012
reported
adjustment related to
the adoption of ifrs 11
balance at 31 dec 2012
restated additionsadjustments/
impairmentbalance at
31 dec 2013
Promenada Mall Braila 1,523,220 – (1,523,220) – – – – – –
Regional offices portfolio 1,888,075 – – 1,888,075 – 1,888,075 – (815,709) 1,072,366
Retail Park Pitesti 2,394,014 – (723,965) 1,670,049 – 1,670,049 – – 1,670,049
Floreasca Business Park 1,664,414 – – 1,664,414 – 1,664,414 – – 1,664,414
Internalisation of NEPI Investment Management 5,881,776 – – 5,881,776 – 5,881,776 – – 5,881,776
City Business Centre – 2,030,295 – 2,030,295 – 2,030,295 – – 2,030,295
Vulcan Value Centre – 54,186 – 54,186 (54,186) – 5,689,680 (5,689,680) –
The Lakeview – – – – – – 4,136,909 (238,159) 3,898,750
City Park – – – – – – 5,333,124 (5,333,124) –
Aupark Zilina – – – – – – 3,549,593 (3,549,593) –
Deva Shopping Centre – – – – – – 2,422,355 (2,422,355) –
total 13,351,499 2,084,481 (2,247,185) 13,188,795 (54,186) 13,134,609 21,131,661 (18,048,620) 16,217,650
12 goodWill
The Group recognised goodwill for the following business acquisitions:
The following movements in goodwill occurred during the year ended 31 December 2012:— the acquisition of City Business Centre generated a goodwill that results mostly from the deferred
taxation liability as at the acquisition date;— the investment in Vulcan Value Centre development generated goodwill due to negative net equity at
the date of the acquisition of the 50% participation (the entity had incurred various expenses to date related to the land to be acquired);
— the goodwill held in relation to Promenada Mall Braila has been written-off following the settlement reached with the vendors (Note 28), and
— the goodwill related to Auchan hypermarket resulted from deferred tax liabilities recognised at acquisition date has been written-off.
The following movements in goodwill occurred during the year ended 31 December 2013:— the acquisitions of The Lakeview, City Park, Aupark Zilina and Deva Shopping Centre generated goodwill
that results from the deferred taxation liability as at the acquisition date; this goodwill was written-off against the increase in the fair value of the property (as shown in the year-end revaluation report, compared to the acquisition price), and
— an impairment was recognised against the Raiffeisen portfolio goodwill, corresponding to the decrease in the related deferred taxation liability (which generated the initial goodwill recognition).
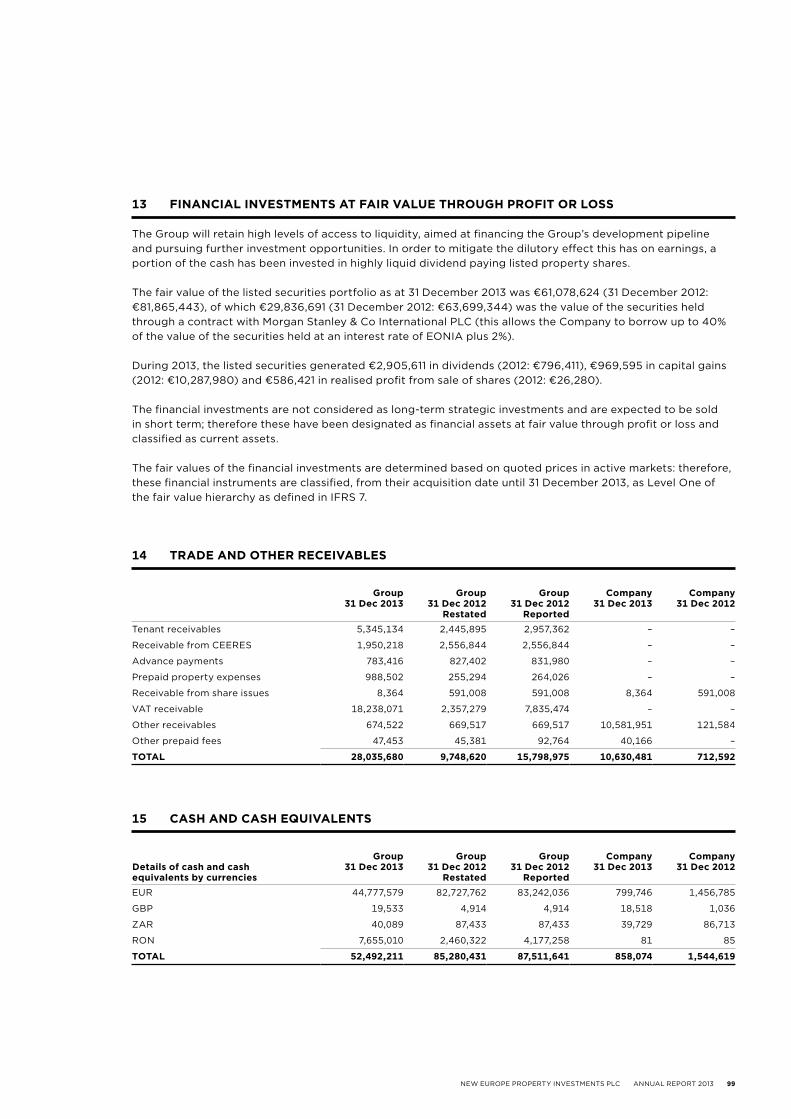
NEW EUROPE PROPERTY INVESTMENTS PLC ANNUAL REPORT 2013 99
13 finanCial investments at fair value through profit or loss
The Group will retain high levels of access to liquidity, aimed at financing the Group’s development pipeline and pursuing further investment opportunities. In order to mitigate the dilutory effect this has on earnings, a portion of the cash has been invested in highly liquid dividend paying listed property shares.
The fair value of the listed securities portfolio as at 31 December 2013 was €61,078,624 (31 December 2012: €81,865,443), of which €29,836,691 (31 December 2012: €63,699,344) was the value of the securities held through a contract with Morgan Stanley & Co International PLC (this allows the Company to borrow up to 40% of the value of the securities held at an interest rate of EONIA plus 2%).
During 2013, the listed securities generated €2,905,611 in dividends (2012: €796,411), €969,595 in capital gains (2012: €10,287,980) and €586,421 in realised profit from sale of shares (2012: €26,280).
The financial investments are not considered as long-term strategic investments and are expected to be sold in short term; therefore these have been designated as financial assets at fair value through profit or loss and classified as current assets.
The fair values of the financial investments are determined based on quoted prices in active markets: therefore, these financial instruments are classified, from their acquisition date until 31 December 2013, as Level One of the fair value hierarchy as defined in IFRS 7.
14 trade and other reCeivables
group 31 dec 2013
group 31 dec 2012
restated
group 31 dec 2012
reported
Company 31 dec 2013
Company 31 dec 2012
Tenant receivables 5,345,134 2,445,895 2,957,362 – –
Receivable from CEERES 1,950,218 2,556,844 2,556,844 – –
Advance payments 783,416 827,402 831,980 – –
Prepaid property expenses 988,502 255,294 264,026 – –
Receivable from share issues 8,364 591,008 591,008 8,364 591,008
VAT receivable 18,238,071 2,357,279 7,835,474 – –
Other receivables 674,522 669,517 669,517 10,581,951 121,584
Other prepaid fees 47,453 45,381 92,764 40,166 –
total 28,035,680 9,748,620 15,798,975 10,630,481 712,592
15 Cash and Cash eQuivalents
details of cash and cash equivalents by currencies
group 31 dec 2013
group 31 dec 2012
restated
group 31 dec 2012
reported
Company 31 dec 2013
Company 31 dec 2012
EUR 44,777,579 82,727,762 83,242,036 799,746 1,456,785
GBP 19,533 4,914 4,914 18,518 1,036
ZAR 40,089 87,433 87,433 39,729 86,713
RON 7,655,010 2,460,322 4,177,258 81 85
total 52,492,211 85,280,431 87,511,641 858,074 1,544,619
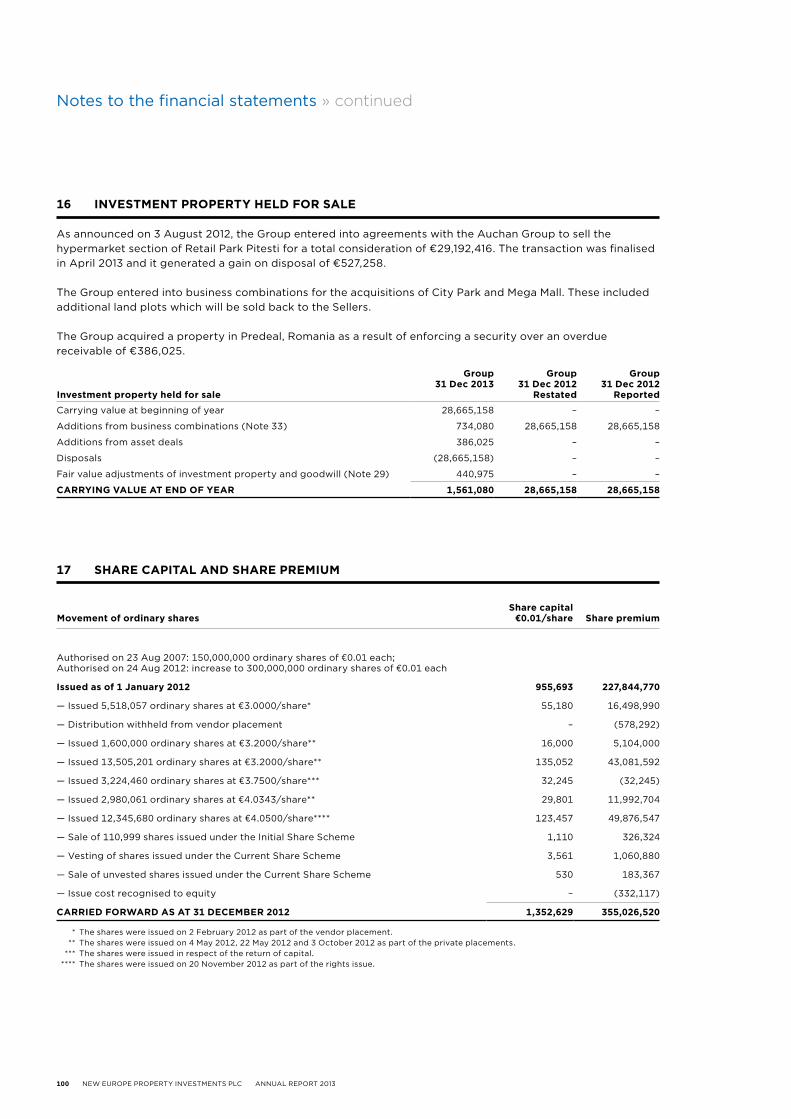
100 NEW EUROPE PROPERTY INVESTMENTS PLC ANNUAL REPORT 2013
Notes to the financial statements » continued
16 investment propertY held for sale
As announced on 3 August 2012, the Group entered into agreements with the Auchan Group to sell the hypermarket section of Retail Park Pitesti for a total consideration of €29,192,416. The transaction was finalised in April 2013 and it generated a gain on disposal of €527,258.
The Group entered into business combinations for the acquisitions of City Park and Mega Mall. These included additional land plots which will be sold back to the Sellers.
The Group acquired a property in Predeal, Romania as a result of enforcing a security over an overdue receivable of €386,025.
investment property held for sale
group31 dec 2013
group31 dec 2012
restated
group31 dec 2012
reported
Carrying value at beginning of year 28,665,158 – –
Additions from business combinations (Note 33) 734,080 28,665,158 28,665,158
Additions from asset deals 386,025 – –
Disposals (28,665,158) – –
Fair value adjustments of investment property and goodwill (Note 29) 440,975 – –
CarrYing value at end of Year 1,561,080 28,665,158 28,665,158
17 share Capital and share premium
movement of ordinary sharesshare capital
€0.01/share share premium
Authorised on 23 Aug 2007: 150,000,000 ordinary shares of €0.01 each; Authorised on 24 Aug 2012: increase to 300,000,000 ordinary shares of €0.01 each
issued as of 1 january 2012 955,693 227,844,770
— Issued 5,518,057 ordinary shares at €3.0000/share* 55,180 16,498,990
— Distribution withheld from vendor placement – (578,292)
— Issued 1,600,000 ordinary shares at €3.2000/share** 16,000 5,104,000
— Issued 13,505,201 ordinary shares at €3.2000/share** 135,052 43,081,592
— Issued 3,224,460 ordinary shares at €3.7500/share*** 32,245 (32,245)
— Issued 2,980,061 ordinary shares at €4.0343/share** 29,801 11,992,704
— Issued 12,345,680 ordinary shares at €4.0500/share**** 123,457 49,876,547
— Sale of 110,999 shares issued under the Initial Share Scheme 1,110 326,324
— Vesting of shares issued under the Current Share Scheme 3,561 1,060,880
— Sale of unvested shares issued under the Current Share Scheme 530 183,367
— Issue cost recognised to equity – (332,117)
Carried forWard as at 31 deCember 2012 1,352,629 355,026,520
* The shares were issued on 2 February 2012 as part of the vendor placement. ** The shares were issued on 4 May 2012, 22 May 2012 and 3 October 2012 as part of the private placements. *** The shares were issued in respect of the return of capital. **** The shares were issued on 20 November 2012 as part of the rights issue.
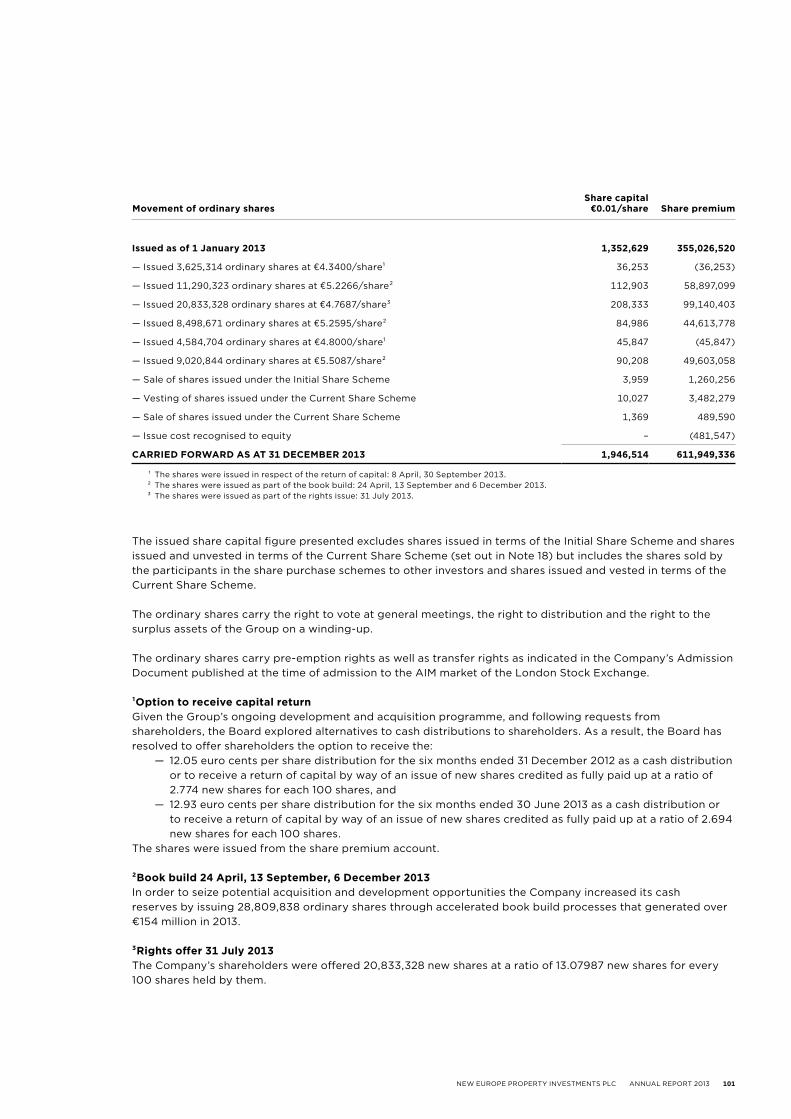
NEW EUROPE PROPERTY INVESTMENTS PLC ANNUAL REPORT 2013 101
movement of ordinary sharesshare capital
€0.01/share share premium
issued as of 1 january 2013 1,352,629 355,026,520
— Issued 3,625,314 ordinary shares at €4.3400/share¹ 36,253 (36,253)
— Issued 11,290,323 ordinary shares at €5.2266/share² 112,903 58,897,099
— Issued 20,833,328 ordinary shares at €4.7687/share³ 208,333 99,140,403
— Issued 8,498,671 ordinary shares at €5.2595/share² 84,986 44,613,778
— Issued 4,584,704 ordinary shares at €4.8000/share¹ 45,847 (45,847)
— Issued 9,020,844 ordinary shares at €5.5087/share² 90,208 49,603,058
— Sale of shares issued under the Initial Share Scheme 3,959 1,260,256
— Vesting of shares issued under the Current Share Scheme 10,027 3,482,279
— Sale of shares issued under the Current Share Scheme 1,369 489,590
— Issue cost recognised to equity – (481,547)
Carried forWard as at 31 deCember 2013 1,946,514 611,949,336
¹ The shares were issued in respect of the return of capital: 8 April, 30 September 2013. ² The shares were issued as part of the book build: 24 April, 13 September and 6 December 2013. ³ The shares were issued as part of the rights issue: 31 July 2013.
The issued share capital figure presented excludes shares issued in terms of the Initial Share Scheme and shares issued and unvested in terms of the Current Share Scheme (set out in Note 18) but includes the shares sold by the participants in the share purchase schemes to other investors and shares issued and vested in terms of the Current Share Scheme.
The ordinary shares carry the right to vote at general meetings, the right to distribution and the right to the surplus assets of the Group on a winding-up.
The ordinary shares carry pre-emption rights as well as transfer rights as indicated in the Company’s Admission Document published at the time of admission to the AIM market of the London Stock Exchange.
¹option to receive capital returnGiven the Group’s ongoing development and acquisition programme, and following requests from shareholders, the Board explored alternatives to cash distributions to shareholders. As a result, the Board has resolved to offer shareholders the option to receive the:
— 12.05 euro cents per share distribution for the six months ended 31 December 2012 as a cash distribution or to receive a return of capital by way of an issue of new shares credited as fully paid up at a ratio of 2.774 new shares for each 100 shares, and
— 12.93 euro cents per share distribution for the six months ended 30 June 2013 as a cash distribution or to receive a return of capital by way of an issue of new shares credited as fully paid up at a ratio of 2.694 new shares for each 100 shares.
The shares were issued from the share premium account.
²book build 24 april, 13 september, 6 december 2013In order to seize potential acquisition and development opportunities the Company increased its cash reserves by issuing 28,809,838 ordinary shares through accelerated book build processes that generated over €154 million in 2013.
³rights offer 31 july 2013The Company’s shareholders were offered 20,833,328 new shares at a ratio of 13.07987 new shares for every 100 shares held by them.

102 NEW EUROPE PROPERTY INVESTMENTS PLC ANNUAL REPORT 2013
Notes to the financial statements » continued
18 share-based paYments
The Company issued shares to its employees under two share purchase schemes.
The first share purchase scheme was in place before the internalisation of NEPI’s Investment Advisor (the ‘Initial Share Scheme’). The second share purchase scheme was approved by the shareholders of the Company on 3 May 2011 and amended on 26 April 2012 and is the scheme in terms of which all new share purchase scheme issues are implemented (the ‘Current Share Scheme’; collectively, the Initial Share Scheme and Current Share Scheme are defined as ‘share purchase schemes’).
The purpose of the share purchase schemes is to align the interests of executive directors and key individuals with those of the shareholders of the Company. The Company achieves this by granting loans to participants in the share purchase schemes for the purpose of buying shares, the repayment of which can be made in part out of the distribution payable in relation to the shares. Of the shares initially subscribed for by each participant, 20% vest annually.
The Company offers each participant the immediate right to subscribe for the relevant number of shares at their then market value less a maximum discount of 5%, together with a loan to fund such subscription. Each loan carries interest at the weighted average rate at which the Company is able to borrow money from its bankers. Each loan is repayable in full, together with interest, ten years after its relevant subscription date, but can be repaid earlier.
The Company has security interests over the shares held in the share purchase schemes by each participant. The security interests secure the repayment of all principal and interest in respect of each loan made by the Company to each participant under the share purchase schemes. In case of the shares issued under the Initial Share Scheme, the Company’s recourse against each participant is limited to the shares issued in terms of this scheme.
Pending repayment of the loan in respect of the shares subscribed to by a participant, the distributions on such shares are applied towards payment of interest on that loan. If the distribution on the shares exceeds the amount required for the interest payment then the excess is paid to the participant, otherwise the shortfall is due by the participant to the Company. In case of the Current Share Scheme any excess distribution after interest payment is applied towards repayment of the loan.
The maximum number of shares that can be issued under the share purchase schemes is 15,000,000. As at 31 December 2013, 4,707,354 shares were issued under the Initial Share Scheme (31 December 2012: 5,100,790) and loans in amount of €11,574,006 (31 December 2012: €12,489,022) remained outstanding under the Initial Share Scheme (of which the loans in respect of the vested shares amounted to €7,679,713 in 2013 and €6,084,258 in 2012).
During 2013, 2,329,000 shares were issued under the Current Share Scheme (2012: 2,405,000 shares) and loans in amount of €21,353,547 remained outstanding under the Current Share Scheme (2012: €13,270,220) of which the loans in respect of the vested shares amounted to €829,044 (2012: €565,113). Refer to Note 11.
NEW EUROPE PROPERTY INVESTMENTS PLC ANNUAL REPORT 2013 103
accounting treatmentThe Initial Share Scheme is accounted for as a share option scheme. Therefore, the fair value of the share-based payment, determined at the grant date, is expensed over the vesting period (2013: €954,637, 2012: €996,909) with a corresponding increase in the share-based payment reserve. The interest charged by the Company on the loans granted in terms of the Initial Share Scheme is not recognised to the Statement of income, but added for calculation of distributable earnings purposes only (2013: €562,913; 2012: €569,597).
The Current Share Scheme is accounted for by recognising the value of the shares issued as an asset and classified as ‘loan to participants in the Current Share Scheme’ (Note 11) and respectively as equity and classified as ‘share-based payment reserve’. At each vesting date, the vested value of the shares issued in terms of the Current Share Scheme is reclassified from ‘share-based payment reserve’ to ‘share capital’. The accrued interest is recognised as finance income in the Statement of income.
number of sharesgroup
31 dec 2013group
31 dec 2012
maximum number of share purchase schemes shares which can be offered for subscription 15,000,000 10,000,000
Share purchase schemes shares outstanding at the end of the period 10,181,518 9,113,290
Share purchase schemes shares available but unissued 3,165,210 389,603
19 loans and borroWings
In May 2013 the Group renewed its €9.5 million secured revolving facility with UniCredit Bank which matures on 31 May 2014 when, at the Group’s option, the facility is convertible into a term loan repayable on 31 December 2014. The facility remains undrawn as at 31 December 2013.
Details of bank loans are set out in the table below. The repayment profile of the Group’s outstanding loans is set out in the table below (excluding future interest). Apart from the bank loans presented below, the Group is also engaged in loans and borrowings related to its investments in joint ventures. Details on these bank loans are presented in Note 34.
The weighted average margin for the loans outstanding as at 31 December 2013 was 3.3% paid on top of a reference base rate (EONIA, 1 month EURIBOR, 3 month EURIBOR) hedged with a weighted average interest rate cap of 2% for 51% of the outstanding notional amount and a weighted average interest rate swap of 2.1% for 49% of the notional amount.
104 NEW EUROPE PROPERTY INVESTMENTS PLC ANNUAL REPORT 2013
Notes to the financial statements » continued
interest bearing borrowings group, 31 dec 2012, restated
payable in1 year
payable in 2–5 years
payable over 5 years total
Floreasca Business Park 62,246,248 – – 62,246,248
Promenada Mall Braila 2,155,653 35,688,694 – 37,844,347
Retail Park Pitesti 1,899,256 24,558,280 – 26,457,536
New Europe Property Investments plc (Note 13) 21,942,531 – – 21,942,531
City Business Centre 958,713 4,193,610 15,336,086 20,488,409
City Business Centre 259,392 1,168,758 6,189,232 7,617,382
Regional offices portfolio 1,548,018 6,298,648 – 7,846,666
Street segment retail portfolio and Brasov Strip Mall 6,200,000 – – 6,200,000
Accrued interest 571,595 – – 571,595
Deferred loan costs – (497,783) – (497,783)
total 97,781,406 71,410,207 21,525,318 190,716,931
interest bearing borrowings group, 31 dec 2013
payable in1 year
payable in 2–5 years
payable over 5 years total
Floreasca Business Park 3,920,000 52,657,248 – 56,577,248
Aupark Zilina 2,973,946 50,852,723 – 53,826,669
Promenada Mall Braila 35,688,696 – – 35,688,696
The Lakeview 2,110,345 27,713,793 – 29,824,138
City Business Centre 993,317 4,344,976 14,191,483 19,529,776
City Business Centre 271,885 1,224,941 5,861,156 7,357,982
Retail Park Pitesti 1,042,071 11,237,069 – 12,279,140
New Europe Property Investments plc (Note 13) 10,409,281 – – 10,409,281
Regional offices portfolio 6,298,637 – – 6,298,637
Street segment retail portfolio and Brasov Strip Mall 250,000 5,887,500 – 6,137,500
Accrued interest 507,775 – – 507,775
Deferred loan costs – (403,215) – (403,215)
total 64,465,953 153,515,035 20,052,639 238,033,627
street segment retail portfolio and brasov strip mall loanThe Group contracted a €6,200,000 loan facility with Alpha Bank Romania SA for the acquisition of properties owned by NEPI Bucharest One, which will expire in 2016.
Security— General security over the land and properties (fair value as at 31 December 2013 amounted to
€14,880,000), current assets, cash inflows from operating activities and shares of NEPI Bucharest One— Corporate guarantee issued by the Company
Covenants— Loan to value ratio of maximum 65%
NEW EUROPE PROPERTY INVESTMENTS PLC ANNUAL REPORT 2013 105
revolving facility for new europe property investments plc, rasnov industrial facility srl and unique delamode srlThe Group extended the €9,500,000 revolving facility on 27 May 2013 and it will expire on 31 May 2014 when, at the Group’s option, the facility is convertible into a term loan repayable on 31 December 2014.
Security— General security over the properties (fair value as at 31 December 2013 amounted to €16,930,000),
current assets, cash inflows from operating activities and shares of NEPI Bucharest Two SRL and Unique Delamode SRL
— Corporate guarantee issued by the Company
Covenants— Loan to value ratio of maximum 60%— Debt service ratio of minimum 125%
As at 31 December 2013 this facility was undrawn.
regional office portfolio loanA loan from EuroHypo AG for an amount of €15,000,000 has been taken over as a result of the acquisition of General Investment SRL and General Building Management SRL. The loan is repayable in August 2014.
Security— General security over the properties (fair value as at 31 December 2013 amounted to €28,140,000),
current assets, cash inflows from operating activities and shares of General Investment SRL and General Building Management SRL
Covenants— Loan to value ratio of maximum 70%— Debt service ratio of minimum 120%
promenada mall braila loanA €40,000,000 development loan was taken over and refinanced on 25 February 2010 with KBC Bank Ireland as part of the Promenada Mall Braila acquisition. The facility had a two-year grace period on repayment of the principal. Starting 2012, 16% of the principal has to be repaid in equal annual instalments until maturity in December 2014.
Security— General security over the property (fair value as at 31 December 2013 amounted to €73,300,000),
current assets, cash inflows from operating activities and shares of Braila Promenada Mall SRL— The facility is secured with a holding company guarantee (issued by NEPI) in favour of KBC Bank Ireland,
which covers the principal repayments due by Promenada Mall Braila during the third and fourth years of the loan agreement (that amounts to €6,318,600), and interest that is payable at any time during the term of the loan
Covenants— The covenants on a portfolio basis are below.
Year 1 Year 2 Year 3 Year 4 Year 5
Loan to value ratio of maximum 69% 69% 62% 56% 50%
Interest service coverage ratio of minimum 180% 200% 220% 220% 220%

106 NEW EUROPE PROPERTY INVESTMENTS PLC ANNUAL REPORT 2013
Notes to the financial statements » continued
retail park pitesti loanIn June 2010, the Group successfully refinanced a loan facility in relation to Retail Park Auchan Pitesti with a new loan facility from Unicredit Tiriac Bank and Banca Romaneasca. The Group reimbursed in April 2013 an amount of €12,926,232 to Banca Romaneasca, due to the sale of the hypermarket section to Auchan Group. The remaining part of the facility is due to Unicredit Tiriac Bank and it matures in January 2015.
Security— General security over the property (fair value as at 31 December 2013 amounted to €41,690,000),
current assets, cash inflows from operating activities, accounts and receivables of Retail Park Pitesti SRL— A property maintenance reserve account holding the equivalent of 1% of annual net operating income of
the property
Covenants— Loan to value ratio of maximum 70%— Debt service cover ratio of minimum 110%
floreasca business park loanThe Group refinanced the loan facility from Raiffeisen Bank International AG with an outstanding amount of €56,577,248 as at 31 December 2013. The new facility matures in October 2018 and is repayable in quarterly instalments.
Security— General security over the property (fair value as at 31 December 2013 amounted to €101,080,000),
current assets, cash inflows from operating activities, accounts and receivables of Floreasca Business Park SRL
Covenants— Loan to value ratio of maximum 65%— Debt service cover ratio of minimum 110% for 2014 and 120% thereafter— Yield on debt on minimum 10% per annum (based on EBITDA)
City business Centre – investkredit bank ag loanDuring February 2012, the Group acquired the City Business Centre Timisoara and had taken over two loan facilities from Investkredit Bank AG that amounted to €21,413,763. One loan facility matures in 2028 and the other in 2029. The loans are repayable in monthly instalments.
Security— General security over the property (fair value as at 31 December 2013 amounted to €33,940,000),
current assets, cash inflows from operating activities, accounts and receivables of Timisoara City Business Centre One SA
Covenants— Loan to value ratio of maximum 75%— Debt service cover ratio of minimum 120%
NEW EUROPE PROPERTY INVESTMENTS PLC ANNUAL REPORT 2013 107
City business Centre – banca Comerciala romana loanThe Group has taken over a loan from Banca Comerciala Romana SA that amounted to €7,872,995. The loan matures in 2021 and is repayable in monthly instalments.
Security— General security over the property (fair value as at 31 December 2013 amounted to €21,530,000),
current assets, cash inflows from operating activities, accounts and receivables of Timisoara Office Building SA
Covenants— Loan to value ratio of maximum 70%— Debt service cover ratio of minimum 115%
new europe property investments plc loanThe Group has received a short-term loan from Morgan Stanley & Co International plc, for financing the financial investments described in Note 13.
Security— General security over the financial investments acquired with this loan, for which the fair value estimated
as at 31 December 2013 amounted to €29,836,691
aupark Zilina – vub bank loanThe Group acquired Aupark Zilina in July 2013 and as a result took over two investment loans from VUB Bank Slovakia amounting to €54,281,391. The first loan matures in September 2016 and the second loan matures in June 2016.
Security— General security over the land and building (fair value as at 31 December 2013 amounted to
€95,300,000), current assets, cash inflows from operating activities, accounts and receivables of Aupark Zilina
Covenants for the development loan— Loan to value ratio of maximum 60%— Loan to cost ratio of maximum 80%— Debt service cover ratio of minimum 120%
the lakeview – uniCredit tiriac bankThe Group contracted a loan facility from UniCredit Tiriac Bank for its office building The Lakeview, acquired in January 2013. The loan facility amounted to €30,000,000 and it matures in October 2018.
Security— General security over the land and building (fair value as at 31 December 2013 amounted to
€63,570,000), current assets, cash inflows from operating activities, accounts and receivables of The Lakeview
Covenants for the development loan— Loan to value ratio of maximum 60%— Debt service cover ratio of minimum 125%
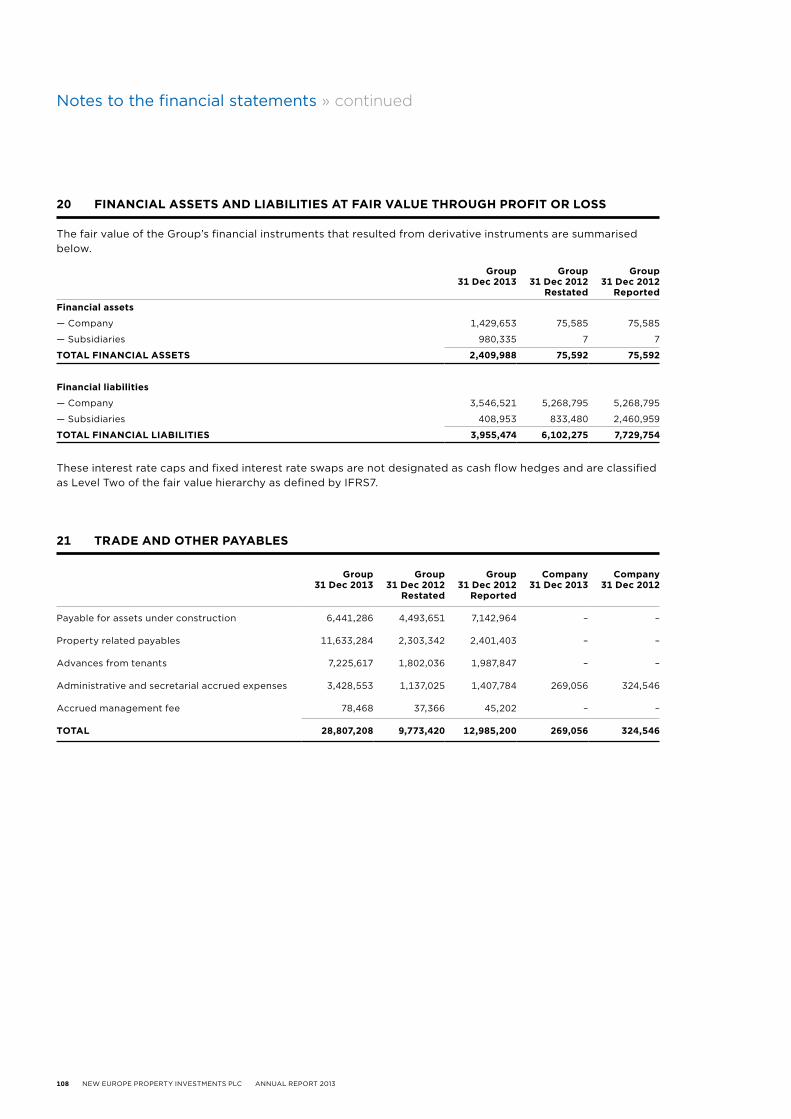
108 NEW EUROPE PROPERTY INVESTMENTS PLC ANNUAL REPORT 2013
Notes to the financial statements » continued
20 finanCial assets and liabilities at fair value through profit or loss
The fair value of the Group’s financial instruments that resulted from derivative instruments are summarised below.
group31 dec 2013
group31 dec 2012
restated
group31 dec 2012
reportedfinancial assets
— Company 1,429,653 75,585 75,585
— Subsidiaries 980,335 7 7
total finanCial assets 2,409,988 75,592 75,592
financial liabilities
— Company 3,546,521 5,268,795 5,268,795
— Subsidiaries 408,953 833,480 2,460,959
total finanCial liabilities 3,955,474 6,102,275 7,729,754
21 trade and other paYables
group31 dec 2013
group31 dec 2012
restated
group31 dec 2012
reported
Company31 dec 2013
Company31 dec 2012
Payable for assets under construction 6,441,286 4,493,651 7,142,964 – –
Property related payables 11,633,284 2,303,342 2,401,403 – –
Advances from tenants 7,225,617 1,802,036 1,987,847 – –
Administrative and secretarial accrued expenses 3,428,553 1,137,025 1,407,784 269,056 324,546
Accrued management fee 78,468 37,366 45,202 – –
total 28,807,208 9,773,420 12,985,200 269,056 324,546
These interest rate caps and fixed interest rate swaps are not designated as cash flow hedges and are classified as Level Two of the fair value hierarchy as defined by IFRS7.
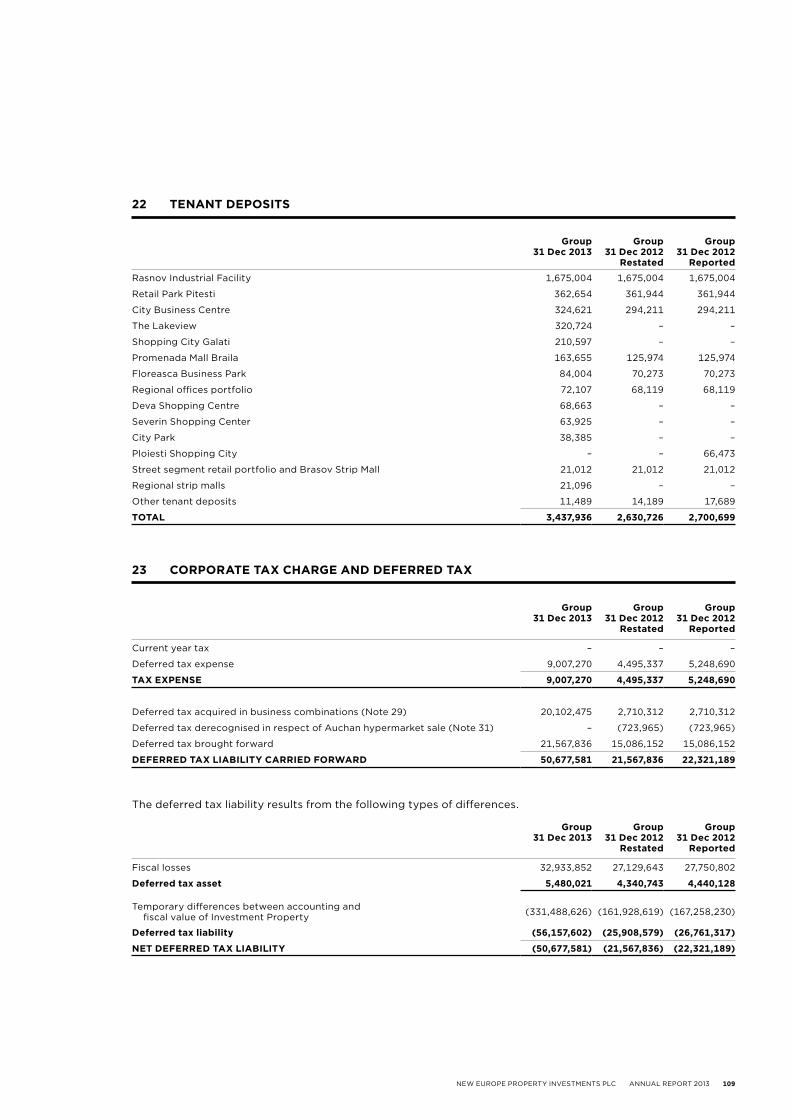
NEW EUROPE PROPERTY INVESTMENTS PLC ANNUAL REPORT 2013 109
group31 dec 2013
group31 dec 2012
restated
group31 dec 2012
reported
Rasnov Industrial Facility 1,675,004 1,675,004 1,675,004
Retail Park Pitesti 362,654 361,944 361,944
City Business Centre 324,621 294,211 294,211
The Lakeview 320,724 – –
Shopping City Galati 210,597 – –
Promenada Mall Braila 163,655 125,974 125,974
Floreasca Business Park 84,004 70,273 70,273
Regional offices portfolio 72,107 68,119 68,119
Deva Shopping Centre 68,663 – –
Severin Shopping Center 63,925 – –
City Park 38,385 – –
Ploiesti Shopping City – – 66,473
Street segment retail portfolio and Brasov Strip Mall 21,012 21,012 21,012
Regional strip malls 21,096 – –
Other tenant deposits 11,489 14,189 17,689
total 3,437,936 2,630,726 2,700,699
22 tenant deposits
group 31 dec 2013
group 31 dec 2012
restated
group 31 dec 2012
reported
Fiscal losses 32,933,852 27,129,643 27,750,802
deferred tax asset 5,480,021 4,340,743 4,440,128
Temporary differences between accounting and fiscal value of Investment Property (331,488,626) (161,928,619) (167,258,230)
deferred tax liability (56,157,602) (25,908,579) (26,761,317)
net deferred tax liabilitY (50,677,581) (21,567,836) (22,321,189)
group 31 dec 2013
group 31 dec 2012
restated
group 31 dec 2012
reported
Current year tax – – –
Deferred tax expense 9,007,270 4,495,337 5,248,690
tax expense 9,007,270 4,495,337 5,248,690
Deferred tax acquired in business combinations (Note 29) 20,102,475 2,710,312 2,710,312
Deferred tax derecognised in respect of Auchan hypermarket sale (Note 31) – (723,965) (723,965)
Deferred tax brought forward 21,567,836 15,086,152 15,086,152
deferred tax liabilitY Carried forWard 50,677,581 21,567,836 22,321,189
23 Corporate tax Charge and deferred tax
The deferred tax liability results from the following types of differences.
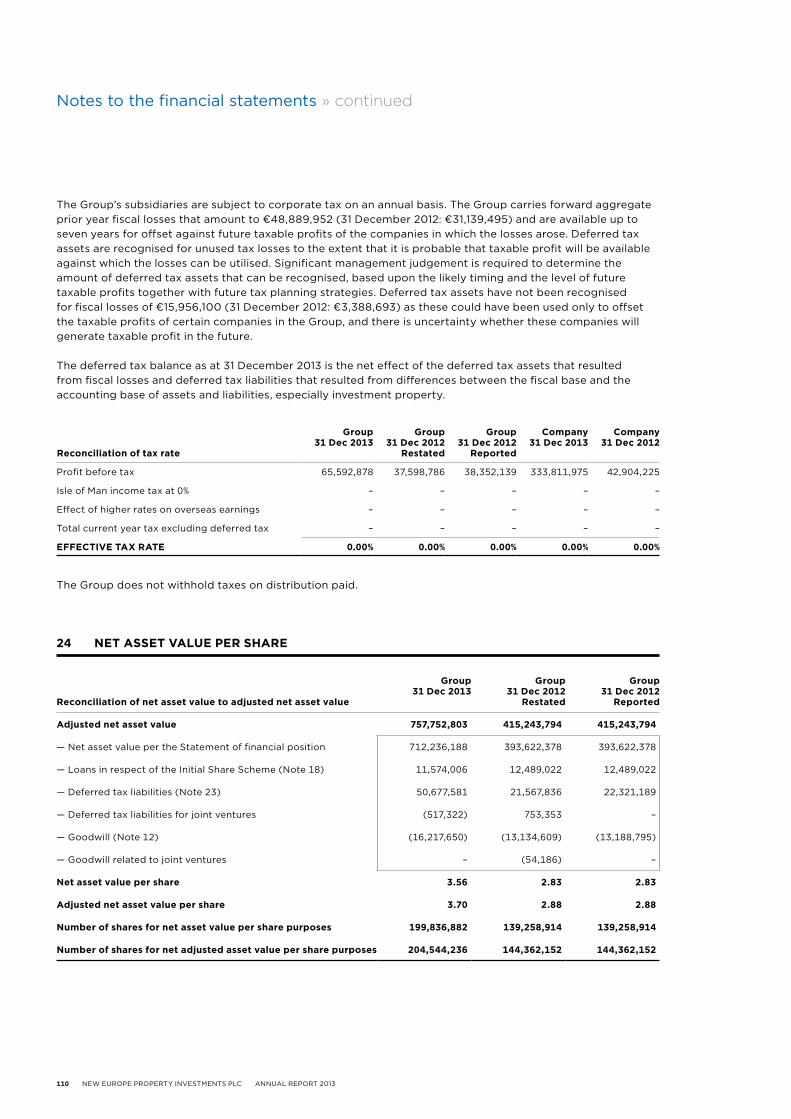
110 NEW EUROPE PROPERTY INVESTMENTS PLC ANNUAL REPORT 2013
Notes to the financial statements » continued
reconciliation of tax rate
group31 dec 2013
group31 dec 2012
restated
group31 dec 2012
reported
Company31 dec 2013
Company31 dec 2012
Profit before tax 65,592,878 37,598,786 38,352,139 333,811,975 42,904,225
Isle of Man income tax at 0% – – – – –
Effect of higher rates on overseas earnings – – – – –
Total current year tax excluding deferred tax – – – – –
effeCtive tax rate 0.00% 0.00% 0.00% 0.00% 0.00%
The Group’s subsidiaries are subject to corporate tax on an annual basis. The Group carries forward aggregate prior year fiscal losses that amount to €48,889,952 (31 December 2012: €31,139,495) and are available up to seven years for offset against future taxable profits of the companies in which the losses arose. Deferred tax assets are recognised for unused tax losses to the extent that it is probable that taxable profit will be available against which the losses can be utilised. Significant management judgement is required to determine the amount of deferred tax assets that can be recognised, based upon the likely timing and the level of future taxable profits together with future tax planning strategies. Deferred tax assets have not been recognised for fiscal losses of €15,956,100 (31 December 2012: €3,388,693) as these could have been used only to offset the taxable profits of certain companies in the Group, and there is uncertainty whether these companies will generate taxable profit in the future.
The deferred tax balance as at 31 December 2013 is the net effect of the deferred tax assets that resulted from fiscal losses and deferred tax liabilities that resulted from differences between the fiscal base and the accounting base of assets and liabilities, especially investment property.
The Group does not withhold taxes on distribution paid.
reconciliation of net asset value to adjusted net asset value
group31 dec 2013
group31 dec 2012
restated
group31 dec 2012
reported
adjusted net asset value 757,752,803 415,243,794 415,243,794
— Net asset value per the Statement of financial position 712,236,188 393,622,378 393,622,378
— Loans in respect of the Initial Share Scheme (Note 18) 11,574,006 12,489,022 12,489,022
— Deferred tax liabilities (Note 23) 50,677,581 21,567,836 22,321,189
— Deferred tax liabilities for joint ventures (517,322) 753,353 –
— Goodwill (Note 12) (16,217,650) (13,134,609) (13,188,795)
— Goodwill related to joint ventures – (54,186) –
net asset value per share 3.56 2.83 2.83
adjusted net asset value per share 3.70 2.88 2.88
number of shares for net asset value per share purposes 199,836,882 139,258,914 139,258,914
number of shares for net adjusted asset value per share purposes 204,544,236 144,362,152 144,362,152
24 net asset value per share
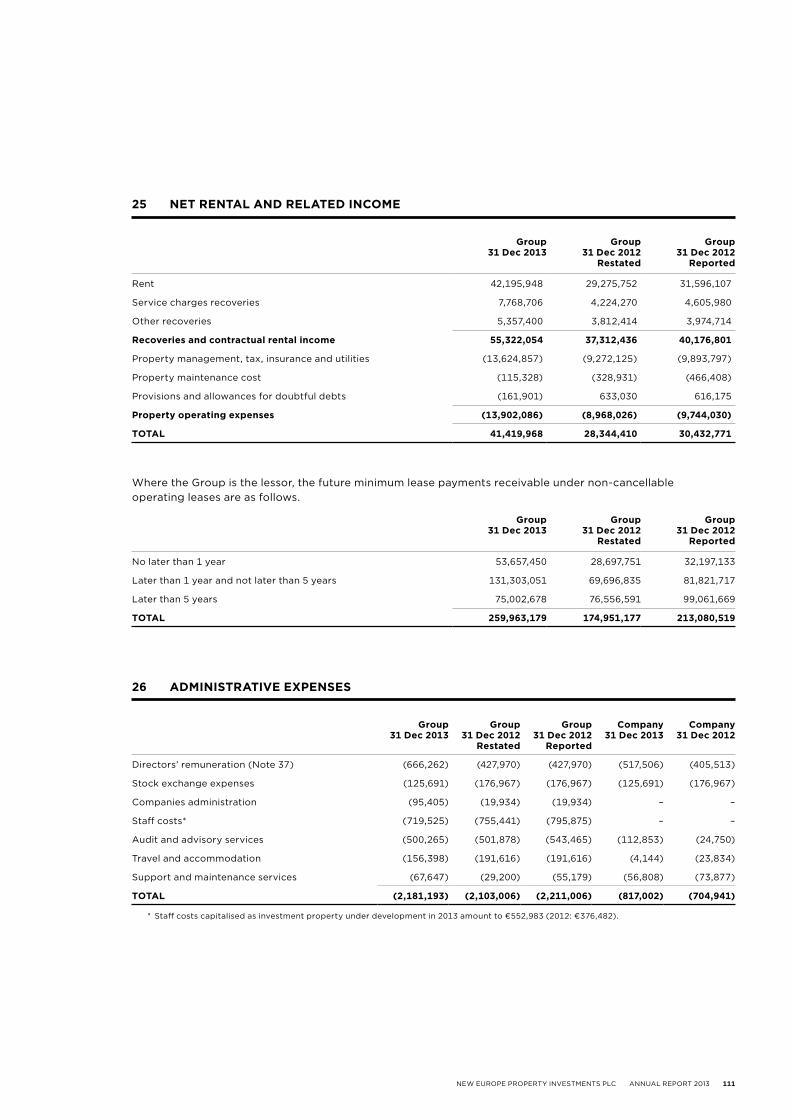
NEW EUROPE PROPERTY INVESTMENTS PLC ANNUAL REPORT 2013 111
group31 dec 2013
group31 dec 2012
restated
group31 dec 2012
reported
Rent 42,195,948 29,275,752 31,596,107
Service charges recoveries 7,768,706 4,224,270 4,605,980
Other recoveries 5,357,400 3,812,414 3,974,714
recoveries and contractual rental income 55,322,054 37,312,436 40,176,801
Property management, tax, insurance and utilities (13,624,857) (9,272,125) (9,893,797)
Property maintenance cost (115,328) (328,931) (466,408)
Provisions and allowances for doubtful debts (161,901) 633,030 616,175
property operating expenses (13,902,086) (8,968,026) (9,744,030)
total 41,419,968 28,344,410 30,432,771
25 net rental and related inCome
group31 dec 2013
group31 dec 2012
restated
group31 dec 2012
reported
No later than 1 year 53,657,450 28,697,751 32,197,133
Later than 1 year and not later than 5 years 131,303,051 69,696,835 81,821,717
Later than 5 years 75,002,678 76,556,591 99,061,669
total 259,963,179 174,951,177 213,080,519
Where the Group is the lessor, the future minimum lease payments receivable under non-cancellable operating leases are as follows.
group31 dec 2013
group31 dec 2012
restated
group31 dec 2012
reported
Company31 dec 2013
Company31 dec 2012
Directors’ remuneration (Note 37) (666,262) (427,970) (427,970) (517,506) (405,513)
Stock exchange expenses (125,691) (176,967) (176,967) (125,691) (176,967)
Companies administration (95,405) (19,934) (19,934) – –
Staff costs* (719,525) (755,441) (795,875) – –
Audit and advisory services (500,265) (501,878) (543,465) (112,853) (24,750)
Travel and accommodation (156,398) (191,616) (191,616) (4,144) (23,834)
Support and maintenance services (67,647) (29,200) (55,179) (56,808) (73,877)
total (2,181,193) (2,103,006) (2,211,006) (817,002) (704,941)
* Staff costs capitalised as investment property under development in 2013 amount to €552,983 (2012: €376,482).
26 administrative expenses
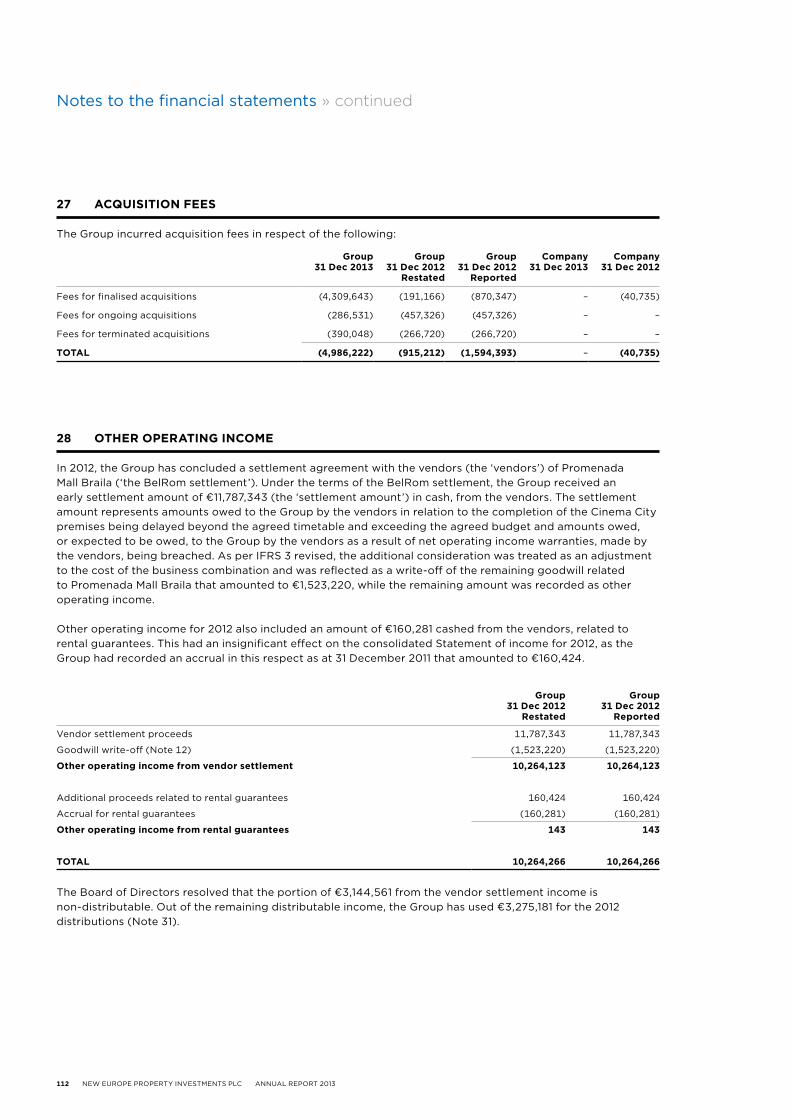
112 NEW EUROPE PROPERTY INVESTMENTS PLC ANNUAL REPORT 2013
Notes to the financial statements » continued
group31 dec 2013
group31 dec 2012
restated
group31 dec 2012
reported
Company31 dec 2013
Company31 dec 2012
Fees for finalised acquisitions (4,309,643) (191,166) (870,347) – (40,735)
Fees for ongoing acquisitions (286,531) (457,326) (457,326) – –
Fees for terminated acquisitions (390,048) (266,720) (266,720) – –
total (4,986,222) (915,212) (1,594,393) – (40,735)
27 aCQuisition fees
The Group incurred acquisition fees in respect of the following:
28 other operating inCome
In 2012, the Group has concluded a settlement agreement with the vendors (the ‘vendors’) of Promenada Mall Braila (‘the BelRom settlement’). Under the terms of the BelRom settlement, the Group received an early settlement amount of €11,787,343 (the ‘settlement amount’) in cash, from the vendors. The settlement amount represents amounts owed to the Group by the vendors in relation to the completion of the Cinema City premises being delayed beyond the agreed timetable and exceeding the agreed budget and amounts owed, or expected to be owed, to the Group by the vendors as a result of net operating income warranties, made by the vendors, being breached. As per IFRS 3 revised, the additional consideration was treated as an adjustment to the cost of the business combination and was reflected as a write-off of the remaining goodwill related to Promenada Mall Braila that amounted to €1,523,220, while the remaining amount was recorded as other operating income.
Other operating income for 2012 also included an amount of €160,281 cashed from the vendors, related to rental guarantees. This had an insignificant effect on the consolidated Statement of income for 2012, as the Group had recorded an accrual in this respect as at 31 December 2011 that amounted to €160,424.
group31 dec 2012
restated
group31 dec 2012
reported
Vendor settlement proceeds 11,787,343 11,787,343
Goodwill write-off (Note 12) (1,523,220) (1,523,220)
other operating income from vendor settlement 10,264,123 10,264,123
Additional proceeds related to rental guarantees 160,424 160,424
Accrual for rental guarantees (160,281) (160,281)
other operating income from rental guarantees 143 143
total 10,264,266 10,264,266
The Board of Directors resolved that the portion of €3,144,561 from the vendor settlement income is non-distributable. Out of the remaining distributable income, the Group has used €3,275,181 for the 2012 distributions (Note 31).
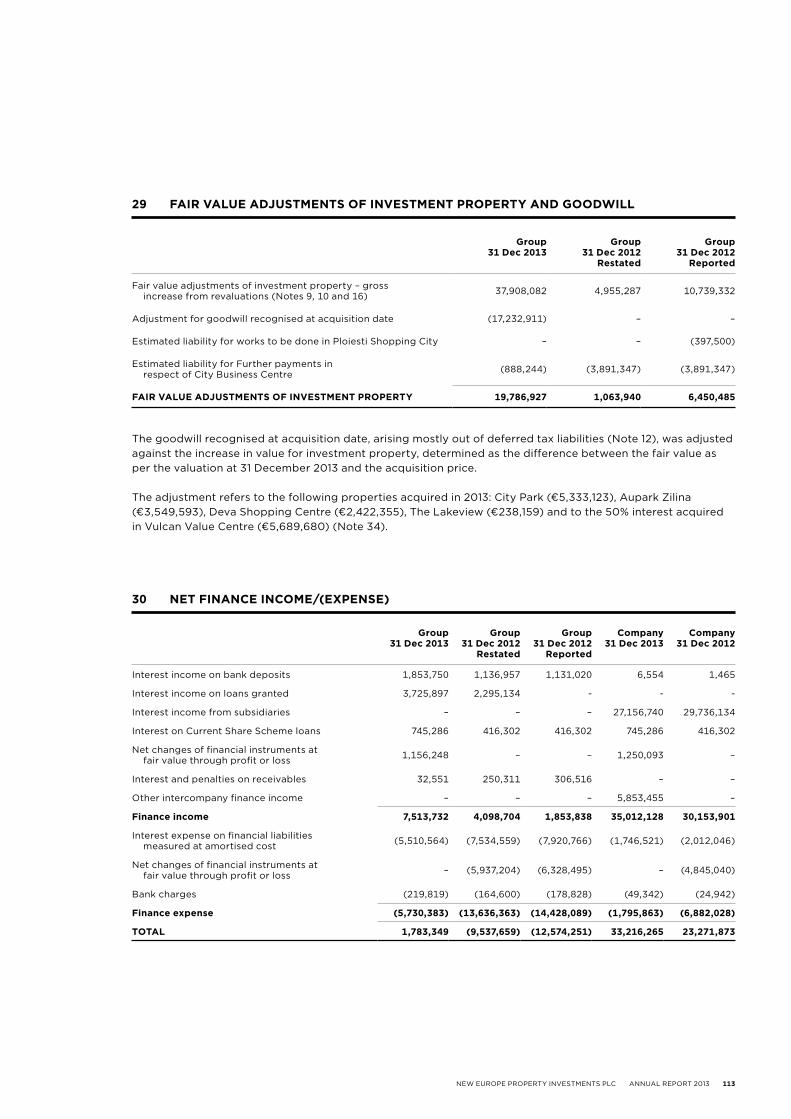
NEW EUROPE PROPERTY INVESTMENTS PLC ANNUAL REPORT 2013 113
group31 dec 2013
group31 dec 2012
restated
group31 dec 2012
reported
Company31 dec 2013
Company31 dec 2012
Interest income on bank deposits 1,853,750 1,136,957 1,131,020 6,554 1,465
Interest income on loans granted 3,725,897 2,295,134 - - -
Interest income from subsidiaries – – – 27,156,740 29,736,134
Interest on Current Share Scheme loans 745,286 416,302 416,302 745,286 416,302
Net changes of financial instruments at fair value through profit or loss 1,156,248 – – 1,250,093 –
Interest and penalties on receivables 32,551 250,311 306,516 – –
Other intercompany finance income – – – 5,853,455 –
finance income 7,513,732 4,098,704 1,853,838 35,012,128 30,153,901
Interest expense on financial liabilities measured at amortised cost (5,510,564) (7,534,559) (7,920,766) (1,746,521) (2,012,046)
Net changes of financial instruments at fair value through profit or loss – (5,937,204) (6,328,495) – (4,845,040)
Bank charges (219,819) (164,600) (178,828) (49,342) (24,942)
finance expense (5,730,383) (13,636,363) (14,428,089) (1,795,863) (6,882,028)
total 1,783,349 (9,537,659) (12,574,251) 33,216,265 23,271,873
30 net finanCe inCome/(expense)
29 fair value adjustments of investment propertY and goodWill
group31 dec 2013
group31 dec 2012
restated
group31 dec 2012
reported
Fair value adjustments of investment property – gross increase from revaluations (Notes 9, 10 and 16) 37,908,082 4,955,287 10,739,332
Adjustment for goodwill recognised at acquisition date (17,232,911) – –
Estimated liability for works to be done in Ploiesti Shopping City – – (397,500)
Estimated liability for Further payments in respect of City Business Centre (888,244) (3,891,347) (3,891,347)
fair value adjustments of investment propertY 19,786,927 1,063,940 6,450,485
The goodwill recognised at acquisition date, arising mostly out of deferred tax liabilities (Note 12), was adjusted against the increase in value for investment property, determined as the difference between the fair value as per the valuation at 31 December 2013 and the acquisition price.
The adjustment refers to the following properties acquired in 2013: City Park (€5,333,123), Aupark Zilina (€3,549,593), Deva Shopping Centre (€2,422,355), The Lakeview (€238,159) and to the 50% interest acquired in Vulcan Value Centre (€5,689,680) (Note 34).
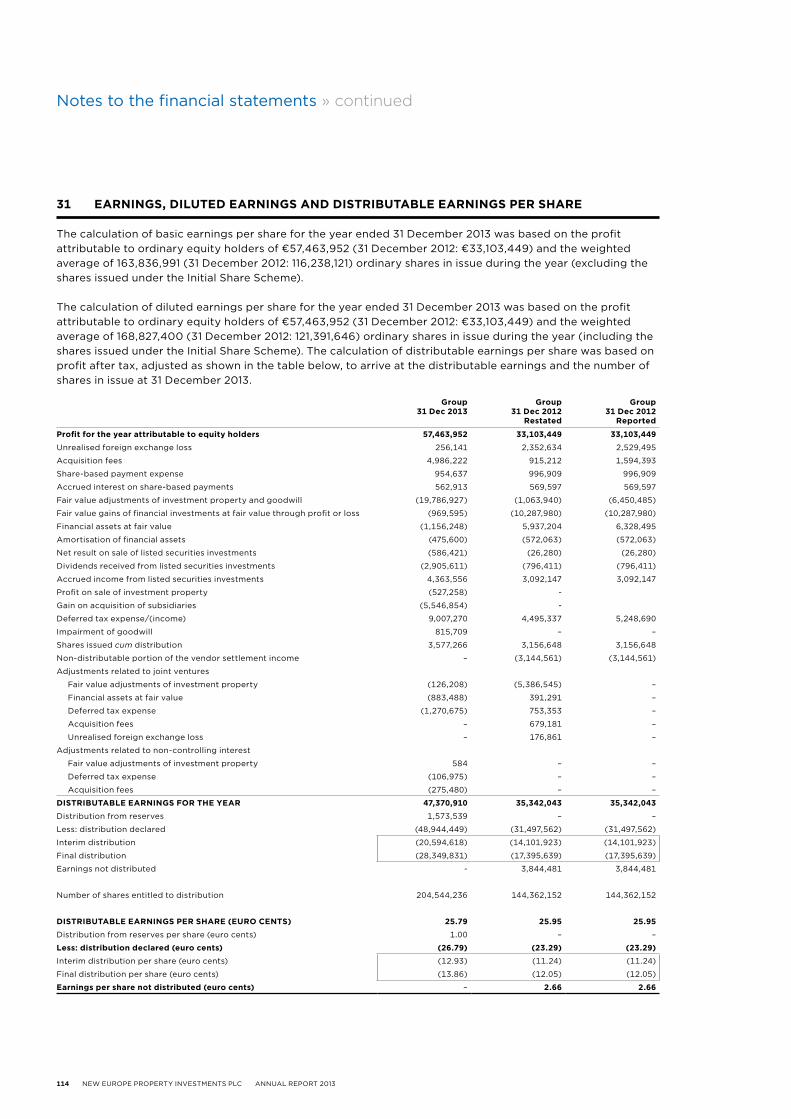
114 NEW EUROPE PROPERTY INVESTMENTS PLC ANNUAL REPORT 2013
Notes to the financial statements » continued
group31 dec 2013
group31 dec 2012
restated
group31 dec 2012
reported
profit for the year attributable to equity holders 57,463,952 33,103,449 33,103,449
Unrealised foreign exchange loss 256,141 2,352,634 2,529,495
Acquisition fees 4,986,222 915,212 1,594,393
Share-based payment expense 954,637 996,909 996,909
Accrued interest on share-based payments 562,913 569,597 569,597
Fair value adjustments of investment property and goodwill (19,786,927) (1,063,940) (6,450,485)
Fair value gains of financial investments at fair value through profit or loss (969,595) (10,287,980) (10,287,980)
Financial assets at fair value (1,156,248) 5,937,204 6,328,495
Amortisation of financial assets (475,600) (572,063) (572,063)
Net result on sale of listed securities investments (586,421) (26,280) (26,280)
Dividends received from listed securities investments (2,905,611) (796,411) (796,411)
Accrued income from listed securities investments 4,363,556 3,092,147 3,092,147
Profit on sale of investment property (527,258) -
Gain on acquisition of subsidiaries (5,546,854) -
Deferred tax expense/(income) 9,007,270 4,495,337 5,248,690
Impairment of goodwill 815,709 – –
Shares issued cum distribution 3,577,266 3,156,648 3,156,648
Non-distributable portion of the vendor settlement income – (3,144,561) (3,144,561)
Adjustments related to joint ventures
Fair value adjustments of investment property (126,208) (5,386,545) –
Financial assets at fair value (883,488) 391,291 –
Deferred tax expense (1,270,675) 753,353 –
Acquisition fees – 679,181 –
Unrealised foreign exchange loss – 176,861 –
Adjustments related to non-controlling interest
Fair value adjustments of investment property 584 – –
Deferred tax expense (106,975) – –
Acquisition fees (275,480) – –
distributable earnings for the Year 47,370,910 35,342,043 35,342,043
Distribution from reserves 1,573,539 – –
Less: distribution declared (48,944,449) (31,497,562) (31,497,562)
Interim distribution (20,594,618) (14,101,923) (14,101,923)
Final distribution (28,349,831) (17,395,639) (17,395,639)
Earnings not distributed - 3,844,481 3,844,481
Number of shares entitled to distribution 204,544,236 144,362,152 144,362,152
distributable earnings per share (euro Cents) 25.79 25.95 25.95
Distribution from reserves per share (euro cents) 1.00 – –
less: distribution declared (euro cents) (26.79) (23.29) (23.29)
Interim distribution per share (euro cents) (12.93) (11.24) (11.24)
Final distribution per share (euro cents) (13.86) (12.05) (12.05)
earnings per share not distributed (euro cents) – 2.66 2.66
31 earnings, diluted earnings and distributable earnings per share
The calculation of basic earnings per share for the year ended 31 December 2013 was based on the profit attributable to ordinary equity holders of €57,463,952 (31 December 2012: €33,103,449) and the weighted average of 163,836,991 (31 December 2012: 116,238,121) ordinary shares in issue during the year (excluding the shares issued under the Initial Share Scheme).
The calculation of diluted earnings per share for the year ended 31 December 2013 was based on the profit attributable to ordinary equity holders of €57,463,952 (31 December 2012: €33,103,449) and the weighted average of 168,827,400 (31 December 2012: 121,391,646) ordinary shares in issue during the year (including the shares issued under the Initial Share Scheme). The calculation of distributable earnings per share was based on profit after tax, adjusted as shown in the table below, to arrive at the distributable earnings and the number of shares in issue at 31 December 2013.
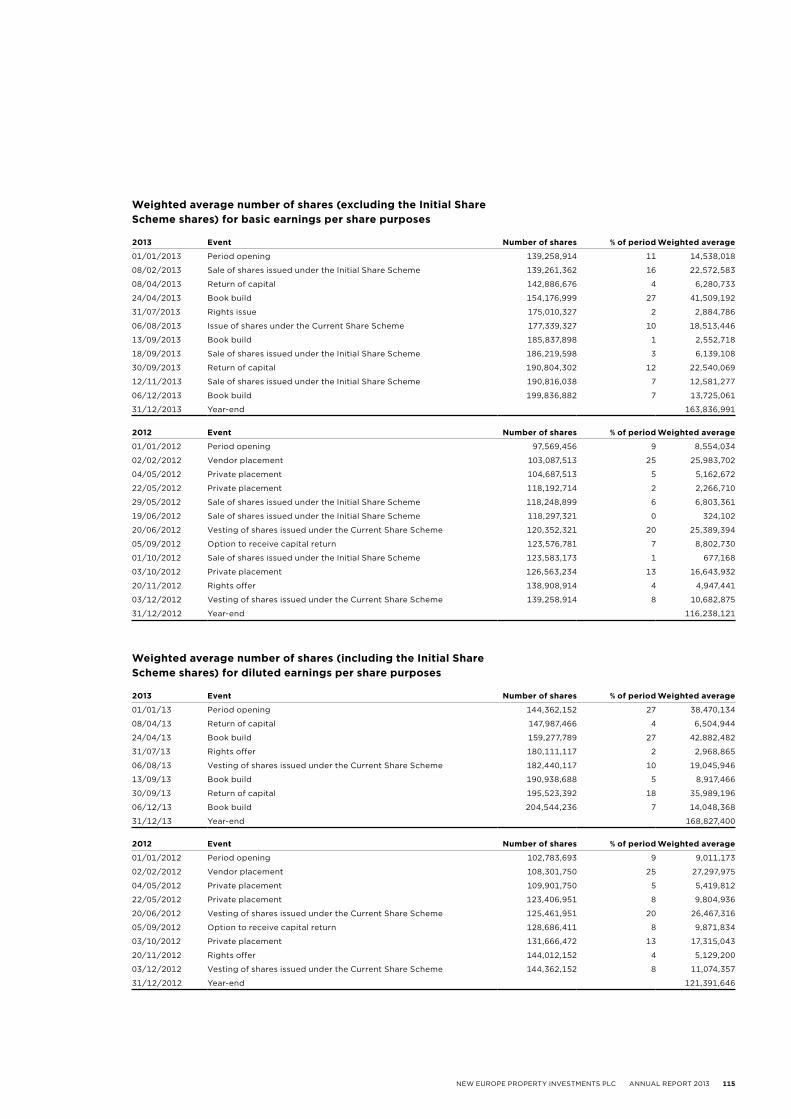
NEW EUROPE PROPERTY INVESTMENTS PLC ANNUAL REPORT 2013 115
Weighted average number of shares (excluding the initial share scheme shares) for basic earnings per share purposes
2013 event number of shares % of period Weighted average
01/01/2013 Period opening 139,258,914 11 14,538,018
08/02/2013 Sale of shares issued under the Initial Share Scheme 139,261,362 16 22,572,583
08/04/2013 Return of capital 142,886,676 4 6,280,733
24/04/2013 Book build 154,176,999 27 41,509,192
31/07/2013 Rights issue 175,010,327 2 2,884,786
06/08/2013 Issue of shares under the Current Share Scheme 177,339,327 10 18,513,446
13/09/2013 Book build 185,837,898 1 2,552,718
18/09/2013 Sale of shares issued under the Initial Share Scheme 186,219,598 3 6,139,108
30/09/2013 Return of capital 190,804,302 12 22,540,069
12/11/2013 Sale of shares issued under the Initial Share Scheme 190,816,038 7 12,581,277
06/12/2013 Book build 199,836,882 7 13,725,061
31/12/2013 Year-end 163,836,991
2013 event number of shares % of period Weighted average
01/01/13 Period opening 144,362,152 27 38,470,134
08/04/13 Return of capital 147,987,466 4 6,504,944
24/04/13 Book build 159,277,789 27 42,882,482
31/07/13 Rights offer 180,111,117 2 2,968,865
06/08/13 Vesting of shares issued under the Current Share Scheme 182,440,117 10 19,045,946
13/09/13 Book build 190,938,688 5 8,917,466
30/09/13 Return of capital 195,523,392 18 35,989,196
06/12/13 Book build 204,544,236 7 14,048,368
31/12/13 Year-end 168,827,400
2012 event number of shares % of period Weighted average
01/01/2012 Period opening 97,569,456 9 8,554,034
02/02/2012 Vendor placement 103,087,513 25 25,983,702
04/05/2012 Private placement 104,687,513 5 5,162,672
22/05/2012 Private placement 118,192,714 2 2,266,710
29/05/2012 Sale of shares issued under the Initial Share Scheme 118,248,899 6 6,803,361
19/06/2012 Sale of shares issued under the Initial Share Scheme 118,297,321 0 324,102
20/06/2012 Vesting of shares issued under the Current Share Scheme 120,352,321 20 25,389,394
05/09/2012 Option to receive capital return 123,576,781 7 8,802,730
01/10/2012 Sale of shares issued under the Initial Share Scheme 123,583,173 1 677,168
03/10/2012 Private placement 126,563,234 13 16,643,932
20/11/2012 Rights offer 138,908,914 4 4,947,441
03/12/2012 Vesting of shares issued under the Current Share Scheme 139,258,914 8 10,682,875
31/12/2012 Year-end 116,238,121
2012 event number of shares % of period Weighted average
01/01/2012 Period opening 102,783,693 9 9,011,173
02/02/2012 Vendor placement 108,301,750 25 27,297,975
04/05/2012 Private placement 109,901,750 5 5,419,812
22/05/2012 Private placement 123,406,951 8 9,804,936
20/06/2012 Vesting of shares issued under the Current Share Scheme 125,461,951 20 26,467,316
05/09/2012 Option to receive capital return 128,686,411 8 9,871,834
03/10/2012 Private placement 131,666,472 13 17,315,043
20/11/2012 Rights offer 144,012,152 4 5,129,200
03/12/2012 Vesting of shares issued under the Current Share Scheme 144,362,152 8 11,074,357
31/12/2012 Year-end 121,391,646
Weighted average number of shares (including the initial share scheme shares) for diluted earnings per share purposes
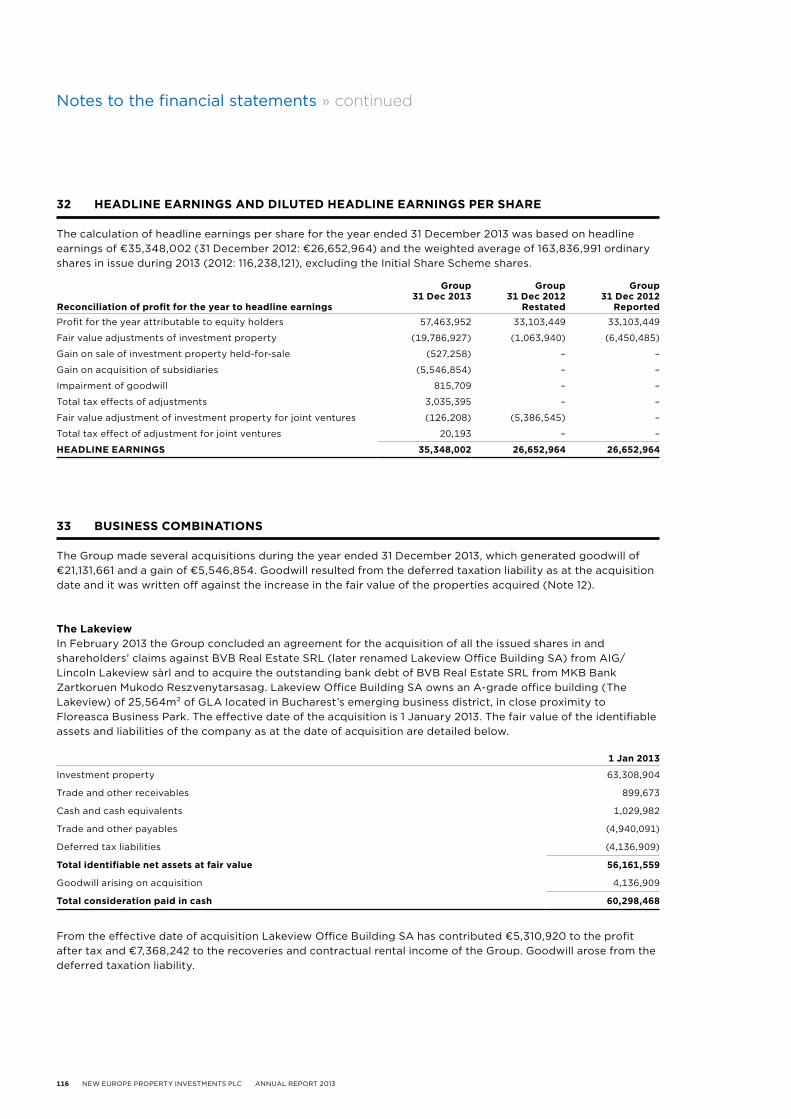
116 NEW EUROPE PROPERTY INVESTMENTS PLC ANNUAL REPORT 2013
Notes to the financial statements » continued
32 headline earnings and diluted headline earnings per share
The calculation of headline earnings per share for the year ended 31 December 2013 was based on headline earnings of €35,348,002 (31 December 2012: €26,652,964) and the weighted average of 163,836,991 ordinary shares in issue during 2013 (2012: 116,238,121), excluding the Initial Share Scheme shares.
33 business Combinations
The Group made several acquisitions during the year ended 31 December 2013, which generated goodwill of €21,131,661 and a gain of €5,546,854. Goodwill resulted from the deferred taxation liability as at the acquisition date and it was written off against the increase in the fair value of the properties acquired (Note 12).
the lakeviewIn February 2013 the Group concluded an agreement for the acquisition of all the issued shares in and shareholders’ claims against BVB Real Estate SRL (later renamed Lakeview Office Building SA) from AIG/Lincoln Lakeview sàrl and to acquire the outstanding bank debt of BVB Real Estate SRL from MKB Bank Zartkoruen Mukodo Reszvenytarsasag. Lakeview Office Building SA owns an A-grade office building (The Lakeview) of 25,564m² of GLA located in Bucharest’s emerging business district, in close proximity to Floreasca Business Park. The effective date of the acquisition is 1 January 2013. The fair value of the identifiable assets and liabilities of the company as at the date of acquisition are detailed below.
reconciliation of profit for the year to headline earnings
group31 dec 2013
group31 dec 2012
restated
group31 dec 2012
reportedProfit for the year attributable to equity holders 57,463,952 33,103,449 33,103,449
Fair value adjustments of investment property (19,786,927) (1,063,940) (6,450,485)
Gain on sale of investment property held-for-sale (527,258) – –
Gain on acquisition of subsidiaries (5,546,854) – –
Impairment of goodwill 815,709 – –
Total tax effects of adjustments 3,035,395 – –
Fair value adjustment of investment property for joint ventures (126,208) (5,386,545) –
Total tax effect of adjustment for joint ventures 20,193 – –
headline earnings 35,348,002 26,652,964 26,652,964
1 jan 2013
Investment property 63,308,904
Trade and other receivables 899,673
Cash and cash equivalents 1,029,982
Trade and other payables (4,940,091)
Deferred tax liabilities (4,136,909)
total identifiable net assets at fair value 56,161,559
Goodwill arising on acquisition 4,136,909
total consideration paid in cash 60,298,468
From the effective date of acquisition Lakeview Office Building SA has contributed €5,310,920 to the profit after tax and €7,368,242 to the recoveries and contractual rental income of the Group. Goodwill arose from the deferred taxation liability.
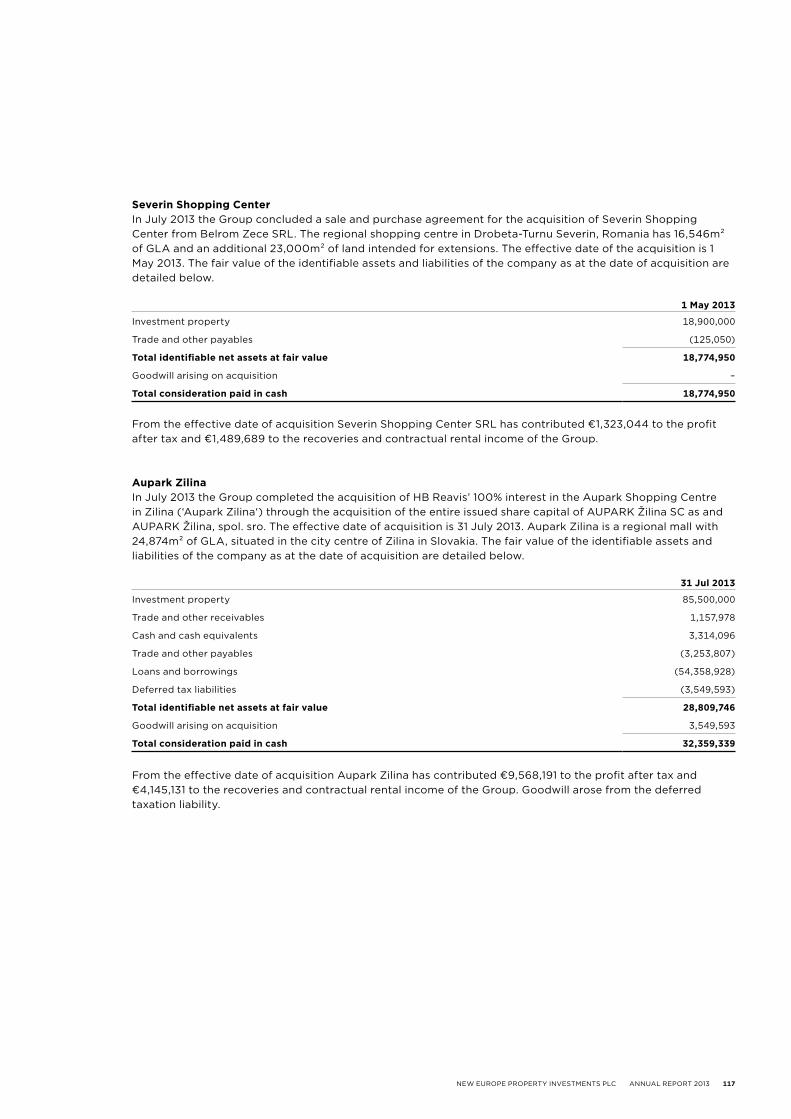
NEW EUROPE PROPERTY INVESTMENTS PLC ANNUAL REPORT 2013 117
severin shopping CenterIn July 2013 the Group concluded a sale and purchase agreement for the acquisition of Severin Shopping Center from Belrom Zece SRL. The regional shopping centre in Drobeta-Turnu Severin, Romania has 16,546m² of GLA and an additional 23,000m² of land intended for extensions. The effective date of the acquisition is 1 May 2013. The fair value of the identifiable assets and liabilities of the company as at the date of acquisition are detailed below.
1 may 2013
Investment property 18,900,000
Trade and other payables (125,050)
total identifiable net assets at fair value 18,774,950
Goodwill arising on acquisition –
total consideration paid in cash 18,774,950
From the effective date of acquisition Severin Shopping Center SRL has contributed €1,323,044 to the profit after tax and €1,489,689 to the recoveries and contractual rental income of the Group.
aupark ZilinaIn July 2013 the Group completed the acquisition of HB Reavis’ 100% interest in the Aupark Shopping Centre in Zilina (‘Aupark Zilina‘) through the acquisition of the entire issued share capital of AUPARK Žilina SC as and AUPARK Žilina, spol. sro. The effective date of acquisition is 31 July 2013. Aupark Zilina is a regional mall with 24,874m² of GLA, situated in the city centre of Zilina in Slovakia. The fair value of the identifiable assets and liabilities of the company as at the date of acquisition are detailed below.
31 jul 2013
Investment property 85,500,000
Trade and other receivables 1,157,978
Cash and cash equivalents 3,314,096
Trade and other payables (3,253,807)
Loans and borrowings (54,358,928)
Deferred tax liabilities (3,549,593)
total identifiable net assets at fair value 28,809,746
Goodwill arising on acquisition 3,549,593
total consideration paid in cash 32,359,339
From the effective date of acquisition Aupark Zilina has contributed €9,568,191 to the profit after tax and €4,145,131 to the recoveries and contractual rental income of the Group. Goodwill arose from the deferred taxation liability.
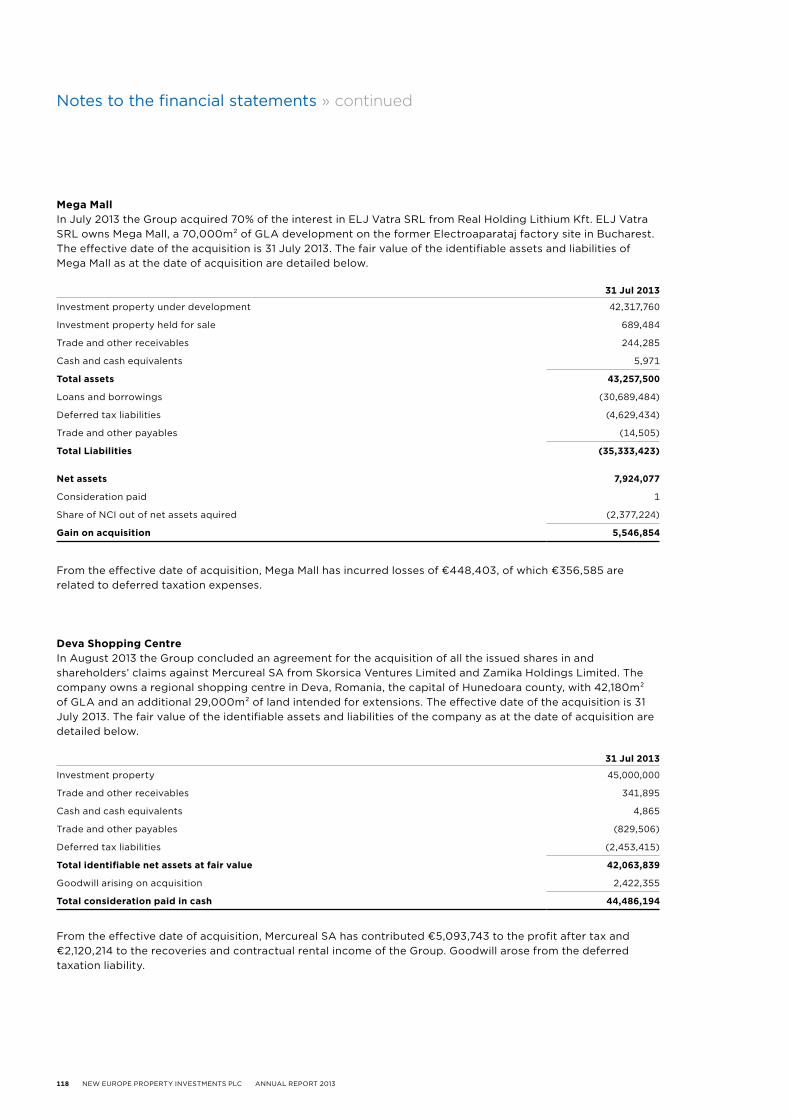
118 NEW EUROPE PROPERTY INVESTMENTS PLC ANNUAL REPORT 2013
Notes to the financial statements » continued
deva shopping CentreIn August 2013 the Group concluded an agreement for the acquisition of all the issued shares in and shareholders’ claims against Mercureal SA from Skorsica Ventures Limited and Zamika Holdings Limited. The company owns a regional shopping centre in Deva, Romania, the capital of Hunedoara county, with 42,180m² of GLA and an additional 29,000m² of land intended for extensions. The effective date of the acquisition is 31 July 2013. The fair value of the identifiable assets and liabilities of the company as at the date of acquisition are detailed below.
31 jul 2013
Investment property 45,000,000
Trade and other receivables 341,895
Cash and cash equivalents 4,865
Trade and other payables (829,506)
Deferred tax liabilities (2,453,415)
total identifiable net assets at fair value 42,063,839
Goodwill arising on acquisition 2,422,355
total consideration paid in cash 44,486,194
31 jul 2013
Investment property under development 42,317,760
Investment property held for sale 689,484
Trade and other receivables 244,285
Cash and cash equivalents 5,971
total assets 43,257,500
Loans and borrowings (30,689,484)
Deferred tax liabilities (4,629,434)
Trade and other payables (14,505)
total liabilities (35,333,423)
net assets 7,924,077
Consideration paid 1
Share of NCI out of net assets aquired (2,377,224)
gain on acquisition 5,546,854
From the effective date of acquisition, Mercureal SA has contributed €5,093,743 to the profit after tax and €2,120,214 to the recoveries and contractual rental income of the Group. Goodwill arose from the deferred taxation liability.
mega mallIn July 2013 the Group acquired 70% of the interest in ELJ Vatra SRL from Real Holding Lithium Kft. ELJ Vatra SRL owns Mega Mall, a 70,000m² of GLA development on the former Electroaparataj factory site in Bucharest. The effective date of the acquisition is 31 July 2013. The fair value of the identifiable assets and liabilities of Mega Mall as at the date of acquisition are detailed below.
From the effective date of acquisition, Mega Mall has incurred losses of €448,403, of which €356,585 are related to deferred taxation expenses.
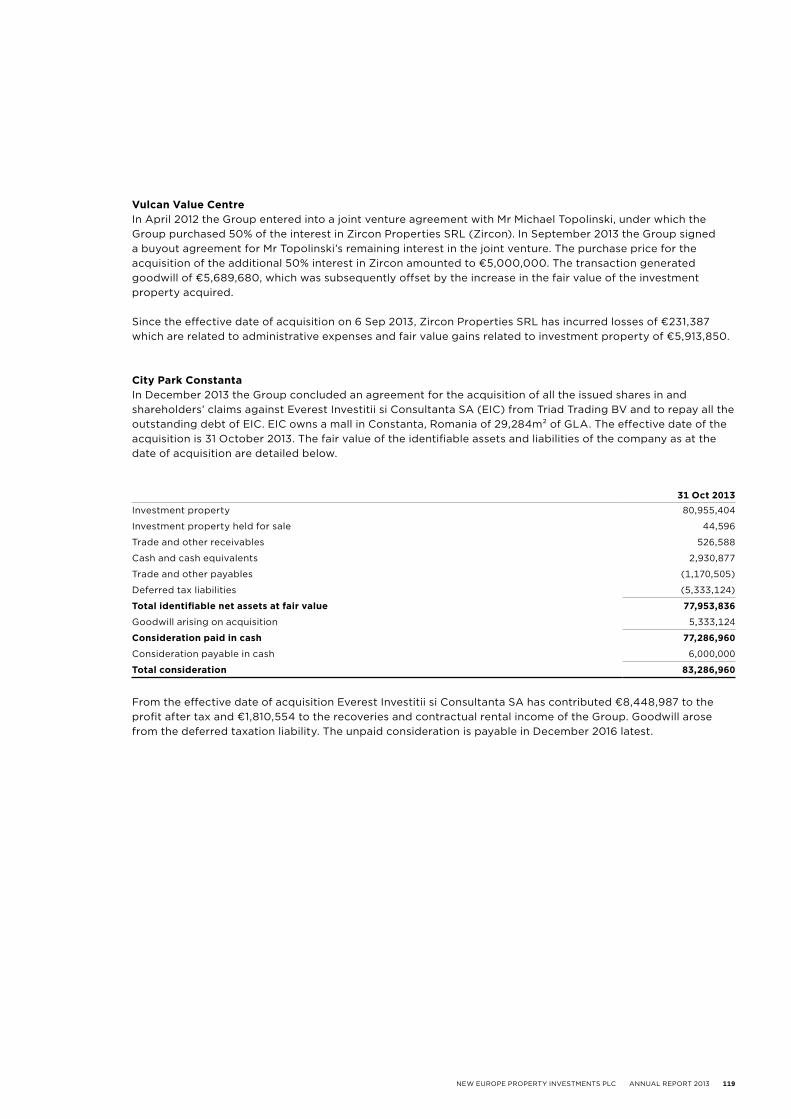
NEW EUROPE PROPERTY INVESTMENTS PLC ANNUAL REPORT 2013 119
vulcan value CentreIn April 2012 the Group entered into a joint venture agreement with Mr Michael Topolinski, under which the Group purchased 50% of the interest in Zircon Properties SRL (Zircon). In September 2013 the Group signed a buyout agreement for Mr Topolinski’s remaining interest in the joint venture. The purchase price for the acquisition of the additional 50% interest in Zircon amounted to €5,000,000. The transaction generated goodwill of €5,689,680, which was subsequently offset by the increase in the fair value of the investment property acquired.
Since the effective date of acquisition on 6 Sep 2013, Zircon Properties SRL has incurred losses of €231,387 which are related to administrative expenses and fair value gains related to investment property of €5,913,850.
City park ConstantaIn December 2013 the Group concluded an agreement for the acquisition of all the issued shares in and shareholders’ claims against Everest Investitii si Consultanta SA (EIC) from Triad Trading BV and to repay all the outstanding debt of EIC. EIC owns a mall in Constanta, Romania of 29,284m² of GLA. The effective date of the acquisition is 31 October 2013. The fair value of the identifiable assets and liabilities of the company as at the date of acquisition are detailed below.
31 oct 2013Investment property 80,955,404
Investment property held for sale 44,596
Trade and other receivables 526,588
Cash and cash equivalents 2,930,877
Trade and other payables (1,170,505)
Deferred tax liabilities (5,333,124)
total identifiable net assets at fair value 77,953,836
Goodwill arising on acquisition 5,333,124
Consideration paid in cash 77,286,960
Consideration payable in cash 6,000,000
total consideration 83,286,960
From the effective date of acquisition Everest Investitii si Consultanta SA has contributed €8,448,987 to the profit after tax and €1,810,554 to the recoveries and contractual rental income of the Group. Goodwill arose from the deferred taxation liability. The unpaid consideration is payable in December 2016 latest.
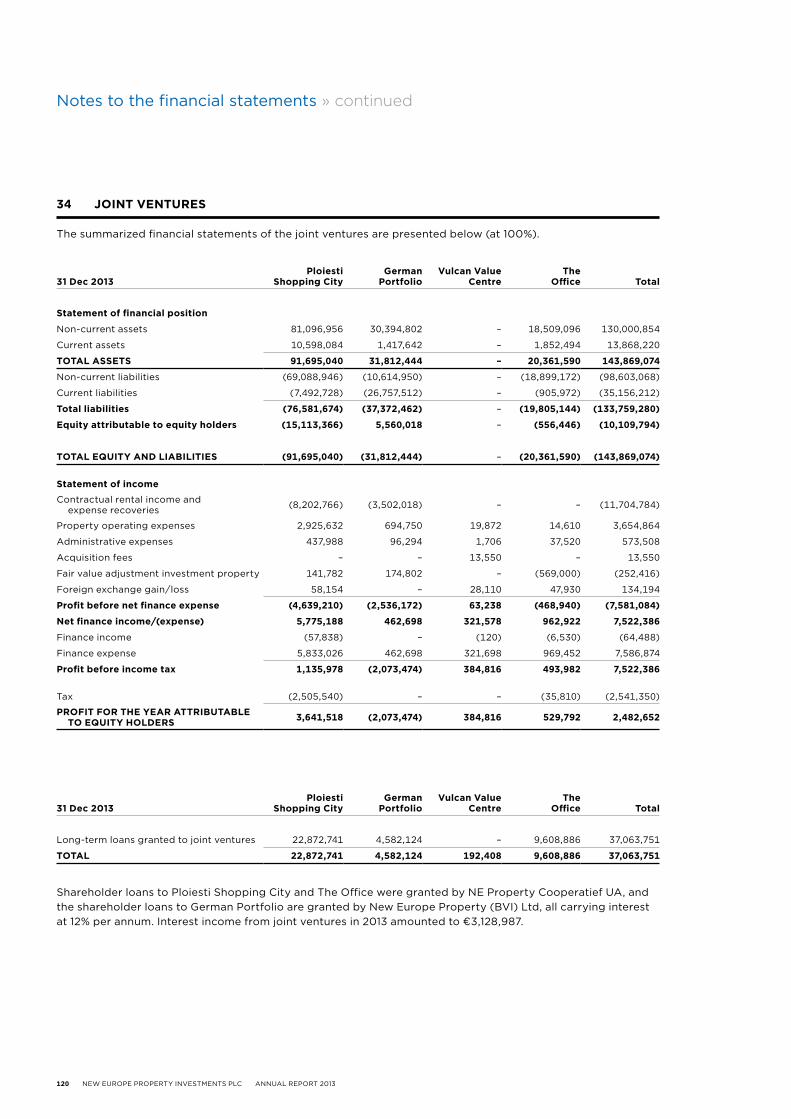
120 NEW EUROPE PROPERTY INVESTMENTS PLC ANNUAL REPORT 2013
Notes to the financial statements » continued
34 joint ventures
The summarized financial statements of the joint ventures are presented below (at 100%).
31 dec 2013ploiesti
shopping Citygerman
portfoliovulcan value
Centrethe
office total
statement of financial position
Non-current assets 81,096,956 30,394,802 – 18,509,096 130,000,854
Current assets 10,598,084 1,417,642 – 1,852,494 13,868,220
total assets 91,695,040 31,812,444 – 20,361,590 143,869,074
Non-current liabilities (69,088,946) (10,614,950) – (18,899,172) (98,603,068)
Current liabilities (7,492,728) (26,757,512) – (905,972) (35,156,212)
total liabilities (76,581,674) (37,372,462) – (19,805,144) (133,759,280)
equity attributable to equity holders (15,113,366) 5,560,018 – (556,446) (10,109,794)
total eQuitY and liabilities (91,695,040) (31,812,444) – (20,361,590) (143,869,074)
statement of income
Contractual rental income and expense recoveries (8,202,766) (3,502,018) – – (11,704,784)
Property operating expenses 2,925,632 694,750 19,872 14,610 3,654,864
Administrative expenses 437,988 96,294 1,706 37,520 573,508
Acquisition fees – – 13,550 – 13,550
Fair value adjustment investment property 141,782 174,802 – (569,000) (252,416)
Foreign exchange gain/loss 58,154 – 28,110 47,930 134,194
profit before net finance expense (4,639,210) (2,536,172) 63,238 (468,940) (7,581,084)
net finance income/(expense) 5,775,188 462,698 321,578 962,922 7,522,386
Finance income (57,838) – (120) (6,530) (64,488)
Finance expense 5,833,026 462,698 321,698 969,452 7,586,874
profit before income tax 1,135,978 (2,073,474) 384,816 493,982 7,522,386
Tax (2,505,540) – – (35,810) (2,541,350)
profit for the Year attributable to eQuitY holders 3,641,518 (2,073,474) 384,816 529,792 2,482,652
31 dec 2013ploiesti
shopping Citygerman
portfoliovulcan value
Centrethe
office total
Long-term loans granted to joint ventures 22,872,741 4,582,124 – 9,608,886 37,063,751
total 22,872,741 4,582,124 192,408 9,608,886 37,063,751
Shareholder loans to Ploiesti Shopping City and The Office were granted by NE Property Cooperatief UA, and the shareholder loans to German Portfolio are granted by New Europe Property (BVI) Ltd, all carrying interest at 12% per annum. Interest income from joint ventures in 2013 amounted to €3,128,987.
NEW EUROPE PROPERTY INVESTMENTS PLC ANNUAL REPORT 2013 121
details on the joint ventures’ loans and borrowing are presented below.
german portfolioA loan from Nord LB Bank was contracted in relation to the acquisition of German Portfolio.
Security— General security over the properties (weighted fair value as at 31 December 2013 amounted to
€15,197,401), current assets and cash inflows of Premium Portfolio Ltd & Co and Premium Portfolio 2 Ltd & Co
Covenants— Loan to value ratio of maximum 90%— Debt service ratio of minimum 115%
ploiesti shopping City loanThe Group has taken over a revolving loan facility of €3,250,000 and a €13,500,000 development loan (which represent 50% of the total amount of the loans) from BRD Group Societe Generale SA. The revolving loan facility matures in 2014.
The construction loan is in the process of conversion into an investment loan and the total loan amount is estimated to increase to €36.5 million, repayable in ten years.
Security— General security over the property (weighted fair value as at 31 December 2013 amounted to
€40,548,478), current assets, cash inflows from operating activities, accounts and receivables of Ploiesti Shopping City SRL
Covenants for the development loan— Loan to value ratio of maximum 50%— Debt service cover ratio of minimum 120%— Interest coverage ratio of minimum 170%
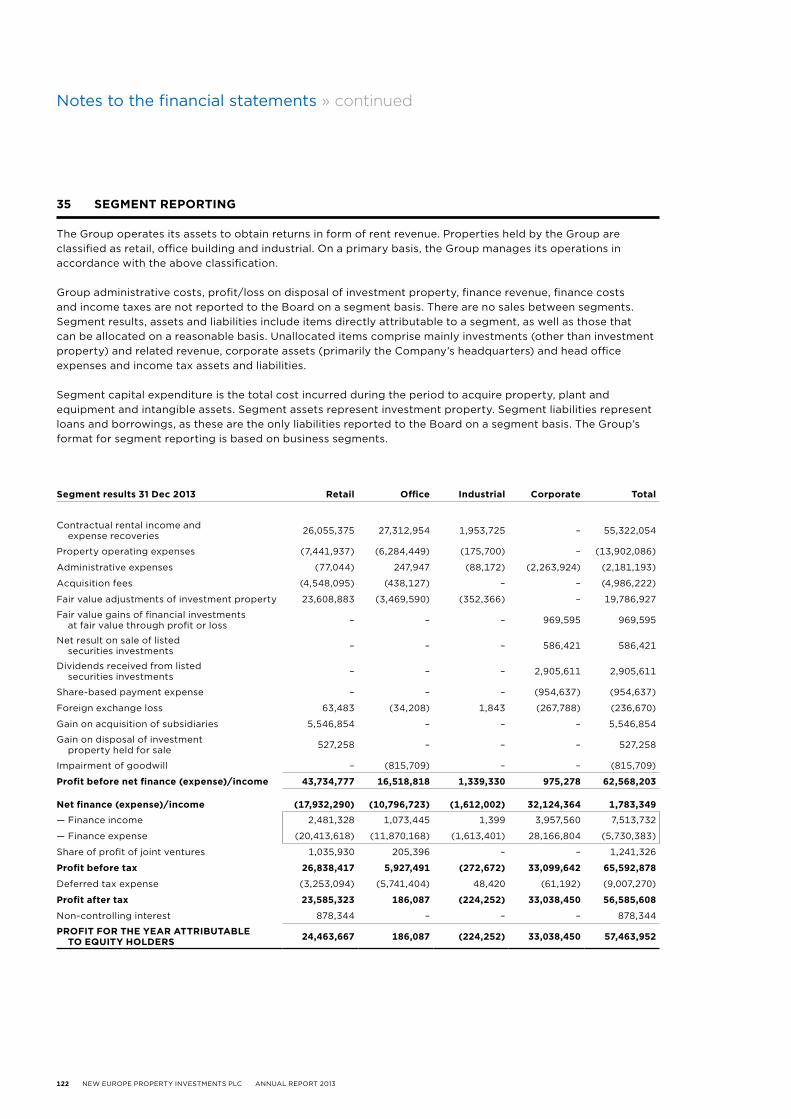
122 NEW EUROPE PROPERTY INVESTMENTS PLC ANNUAL REPORT 2013
Notes to the financial statements » continued
35 segment reporting
The Group operates its assets to obtain returns in form of rent revenue. Properties held by the Group are classified as retail, office building and industrial. On a primary basis, the Group manages its operations in accordance with the above classification.
Group administrative costs, profit/loss on disposal of investment property, finance revenue, finance costs and income taxes are not reported to the Board on a segment basis. There are no sales between segments. Segment results, assets and liabilities include items directly attributable to a segment, as well as those that can be allocated on a reasonable basis. Unallocated items comprise mainly investments (other than investment property) and related revenue, corporate assets (primarily the Company’s headquarters) and head office expenses and income tax assets and liabilities.
Segment capital expenditure is the total cost incurred during the period to acquire property, plant and equipment and intangible assets. Segment assets represent investment property. Segment liabilities represent loans and borrowings, as these are the only liabilities reported to the Board on a segment basis. The Group’s format for segment reporting is based on business segments.
segment results 31 dec 2013 retail office industrial Corporate total
Contractual rental income and expense recoveries 26,055,375 27,312,954 1,953,725 – 55,322,054
Property operating expenses (7,441,937) (6,284,449) (175,700) – (13,902,086)
Administrative expenses (77,044) 247,947 (88,172) (2,263,924) (2,181,193)
Acquisition fees (4,548,095) (438,127) – – (4,986,222)
Fair value adjustments of investment property 23,608,883 (3,469,590) (352,366) – 19,786,927
Fair value gains of financial investments at fair value through profit or loss – – – 969,595 969,595
Net result on sale of listed securities investments – – – 586,421 586,421
Dividends received from listed securities investments – – – 2,905,611 2,905,611
Share-based payment expense – – – (954,637) (954,637)
Foreign exchange loss 63,483 (34,208) 1,843 (267,788) (236,670)
Gain on acquisition of subsidiaries 5,546,854 – – – 5,546,854
Gain on disposal of investment property held for sale 527,258 – – – 527,258
Impairment of goodwill – (815,709) – – (815,709)
profit before net finance (expense)/income 43,734,777 16,518,818 1,339,330 975,278 62,568,203
net finance (expense)/income (17,932,290) (10,796,723) (1,612,002) 32,124,364 1,783,349
— Finance income 2,481,328 1,073,445 1,399 3,957,560 7,513,732
— Finance expense (20,413,618) (11,870,168) (1,613,401) 28,166,804 (5,730,383)
Share of profit of joint ventures 1,035,930 205,396 – – 1,241,326
profit before tax 26,838,417 5,927,491 (272,672) 33,099,642 65,592,878
Deferred tax expense (3,253,094) (5,741,404) 48,420 (61,192) (9,007,270)
profit after tax 23,585,323 186,087 (224,252) 33,038,450 56,585,608
Non-controlling interest 878,344 – – – 878,344
profit for the Year attributable to eQuitY holders 24,463,667 186,087 (224,252) 33,038,450 57,463,952
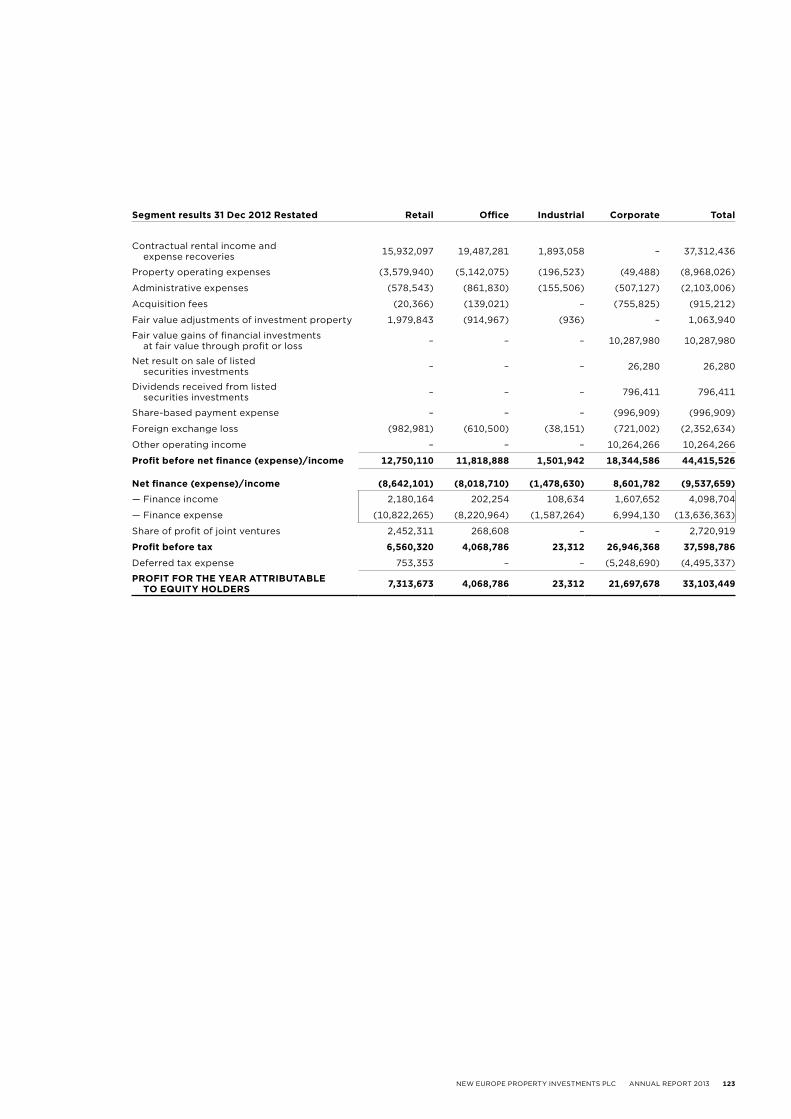
NEW EUROPE PROPERTY INVESTMENTS PLC ANNUAL REPORT 2013 123
segment results 31 dec 2012 restated retail office industrial Corporate total
Contractual rental income and expense recoveries 15,932,097 19,487,281 1,893,058 – 37,312,436
Property operating expenses (3,579,940) (5,142,075) (196,523) (49,488) (8,968,026)
Administrative expenses (578,543) (861,830) (155,506) (507,127) (2,103,006)
Acquisition fees (20,366) (139,021) – (755,825) (915,212)
Fair value adjustments of investment property 1,979,843 (914,967) (936) – 1,063,940
Fair value gains of financial investments at fair value through profit or loss – – – 10,287,980 10,287,980
Net result on sale of listed securities investments – – – 26,280 26,280
Dividends received from listed securities investments – – – 796,411 796,411
Share-based payment expense – – – (996,909) (996,909)
Foreign exchange loss (982,981) (610,500) (38,151) (721,002) (2,352,634)
Other operating income – – – 10,264,266 10,264,266
profit before net finance (expense)/income 12,750,110 11,818,888 1,501,942 18,344,586 44,415,526
net finance (expense)/income (8,642,101) (8,018,710) (1,478,630) 8,601,782 (9,537,659)
— Finance income 2,180,164 202,254 108,634 1,607,652 4,098,704
— Finance expense (10,822,265) (8,220,964) (1,587,264) 6,994,130 (13,636,363)
Share of profit of joint ventures 2,452,311 268,608 – – 2,720,919
profit before tax 6,560,320 4,068,786 23,312 26,946,368 37,598,786
Deferred tax expense 753,353 – – (5,248,690) (4,495,337)
profit for the Year attributable to eQuitY holders 7,313,673 4,068,786 23,312 21,697,678 33,103,449
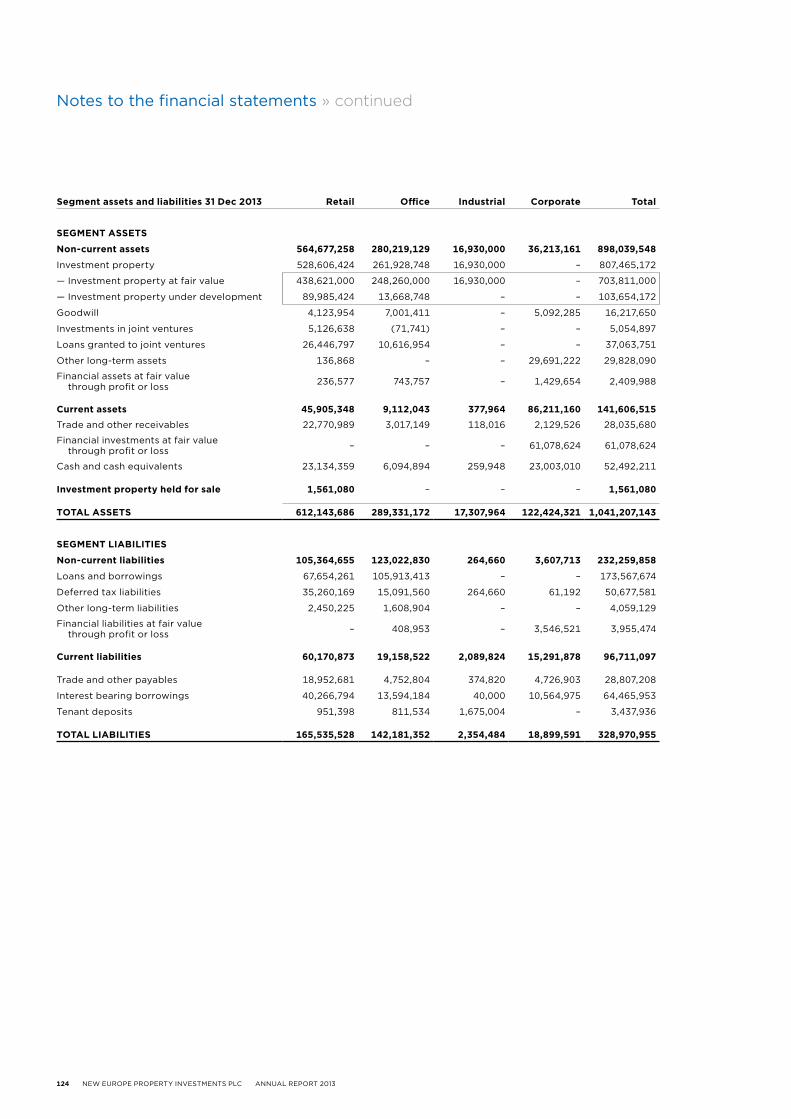
124 NEW EUROPE PROPERTY INVESTMENTS PLC ANNUAL REPORT 2013
Notes to the financial statements » continued
segment assets and liabilities 31 dec 2013 retail office industrial Corporate total
segment assets
non-current assets 564,677,258 280,219,129 16,930,000 36,213,161 898,039,548
Investment property 528,606,424 261,928,748 16,930,000 – 807,465,172
— Investment property at fair value 438,621,000 248,260,000 16,930,000 – 703,811,000
— Investment property under development 89,985,424 13,668,748 – – 103,654,172
Goodwill 4,123,954 7,001,411 – 5,092,285 16,217,650
Investments in joint ventures 5,126,638 (71,741) – – 5,054,897
Loans granted to joint ventures 26,446,797 10,616,954 – – 37,063,751
Other long-term assets 136,868 – – 29,691,222 29,828,090
Financial assets at fair value through profit or loss 236,577 743,757 – 1,429,654 2,409,988
Current assets 45,905,348 9,112,043 377,964 86,211,160 141,606,515
Trade and other receivables 22,770,989 3,017,149 118,016 2,129,526 28,035,680
Financial investments at fair value through profit or loss – – – 61,078,624 61,078,624
Cash and cash equivalents 23,134,359 6,094,894 259,948 23,003,010 52,492,211
investment property held for sale 1,561,080 – – – 1,561,080
total assets 612,143,686 289,331,172 17,307,964 122,424,321 1,041,207,143
segment liabilities
non-current liabilities 105,364,655 123,022,830 264,660 3,607,713 232,259,858
Loans and borrowings 67,654,261 105,913,413 – – 173,567,674
Deferred tax liabilities 35,260,169 15,091,560 264,660 61,192 50,677,581
Other long-term liabilities 2,450,225 1,608,904 – – 4,059,129
Financial liabilities at fair value through profit or loss – 408,953 – 3,546,521 3,955,474
Current liabilities 60,170,873 19,158,522 2,089,824 15,291,878 96,711,097
Trade and other payables 18,952,681 4,752,804 374,820 4,726,903 28,807,208
Interest bearing borrowings 40,266,794 13,594,184 40,000 10,564,975 64,465,953
Tenant deposits 951,398 811,534 1,675,004 – 3,437,936
total liabilities 165,535,528 142,181,352 2,354,484 18,899,591 328,970,955
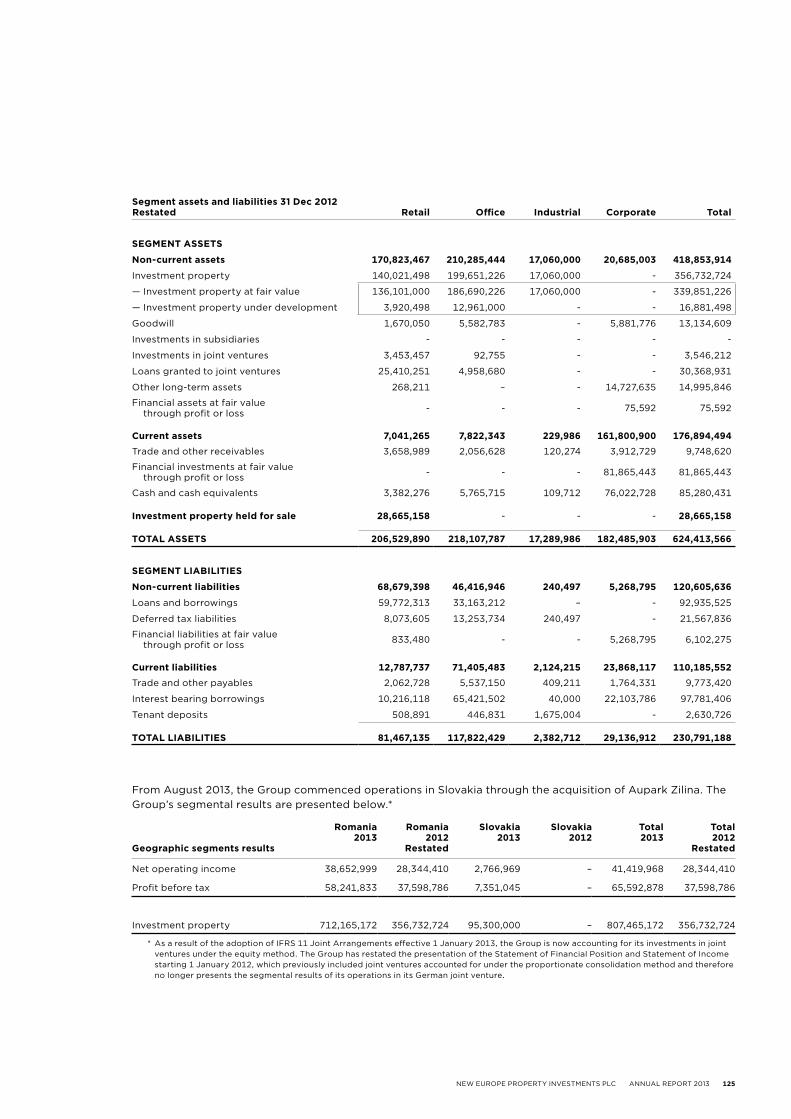
NEW EUROPE PROPERTY INVESTMENTS PLC ANNUAL REPORT 2013 125
From August 2013, the Group commenced operations in Slovakia through the acquisition of Aupark Zilina. The Group’s segmental results are presented below.*
geographic segments results
romania2013
romania2012
restated
slovakia2013
slovakia2012
total2013
total2012
restated
Net operating income 38,652,999 28,344,410 2,766,969 – 41,419,968 28,344,410
Profit before tax 58,241,833 37,598,786 7,351,045 – 65,592,878 37,598,786
Investment property 712,165,172 356,732,724 95,300,000 – 807,465,172 356,732,724
* As a result of the adoption of IFRS 11 Joint Arrangements effective 1 January 2013, the Group is now accounting for its investments in joint ventures under the equity method. The Group has restated the presentation of the Statement of Financial Position and Statement of Income starting 1 January 2012, which previously included joint ventures accounted for under the proportionate consolidation method and therefore no longer presents the segmental results of its operations in its German joint venture.
segment assets and liabilities 31 dec 2012 restated retail office industrial Corporate total
segment assets
non-current assets 170,823,467 210,285,444 17,060,000 20,685,003 418,853,914
Investment property 140,021,498 199,651,226 17,060,000 - 356,732,724
— Investment property at fair value 136,101,000 186,690,226 17,060,000 - 339,851,226
— Investment property under development 3,920,498 12,961,000 - - 16,881,498
Goodwill 1,670,050 5,582,783 - 5,881,776 13,134,609
Investments in subsidiaries - - - - -
Investments in joint ventures 3,453,457 92,755 - - 3,546,212
Loans granted to joint ventures 25,410,251 4,958,680 - - 30,368,931
Other long-term assets 268,211 – - 14,727,635 14,995,846
Financial assets at fair value through profit or loss - - - 75,592 75,592
Current assets 7,041,265 7,822,343 229,986 161,800,900 176,894,494
Trade and other receivables 3,658,989 2,056,628 120,274 3,912,729 9,748,620
Financial investments at fair value through profit or loss - - - 81,865,443 81,865,443
Cash and cash equivalents 3,382,276 5,765,715 109,712 76,022,728 85,280,431
investment property held for sale 28,665,158 - - - 28,665,158
total assets 206,529,890 218,107,787 17,289,986 182,485,903 624,413,566
segment liabilities
non-current liabilities 68,679,398 46,416,946 240,497 5,268,795 120,605,636
Loans and borrowings 59,772,313 33,163,212 – - 92,935,525
Deferred tax liabilities 8,073,605 13,253,734 240,497 - 21,567,836
Financial liabilities at fair value through profit or loss 833,480 - - 5,268,795 6,102,275
Current liabilities 12,787,737 71,405,483 2,124,215 23,868,117 110,185,552
Trade and other payables 2,062,728 5,537,150 409,211 1,764,331 9,773,420
Interest bearing borrowings 10,216,118 65,421,502 40,000 22,103,786 97,781,406
Tenant deposits 508,891 446,831 1,675,004 - 2,630,726
total liabilities 81,467,135 117,822,429 2,382,712 29,136,912 230,791,188
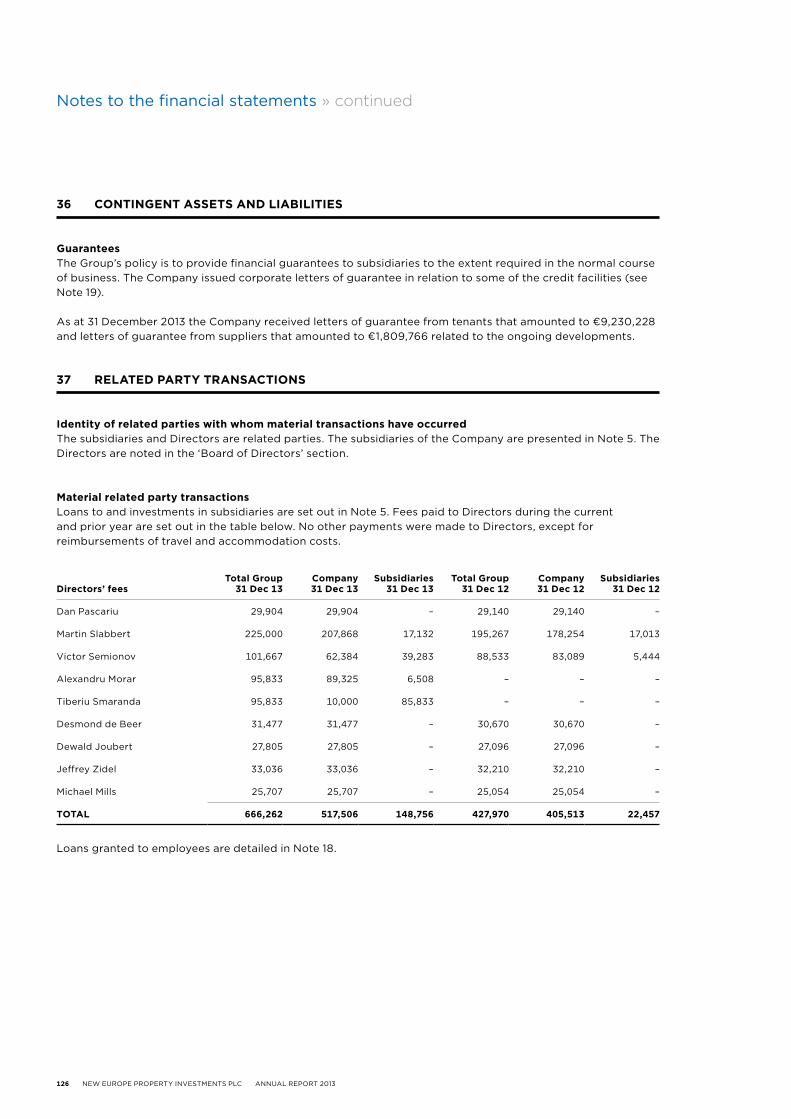
126 NEW EUROPE PROPERTY INVESTMENTS PLC ANNUAL REPORT 2013
Notes to the financial statements » continued
36 Contingent assets and liabilities
guaranteesThe Group’s policy is to provide financial guarantees to subsidiaries to the extent required in the normal course of business. The Company issued corporate letters of guarantee in relation to some of the credit facilities (see Note 19).
As at 31 December 2013 the Company received letters of guarantee from tenants that amounted to €9,230,228 and letters of guarantee from suppliers that amounted to €1,809,766 related to the ongoing developments.
37 related partY transaCtions
identity of related parties with whom material transactions have occurredThe subsidiaries and Directors are related parties. The subsidiaries of the Company are presented in Note 5. The Directors are noted in the ‘Board of Directors’ section.
material related party transactionsLoans to and investments in subsidiaries are set out in Note 5. Fees paid to Directors during the current and prior year are set out in the table below. No other payments were made to Directors, except for reimbursements of travel and accommodation costs.
directors’ feestotal group
31 dec 13Company 31 dec 13
subsidiaries 31 dec 13
total group 31 dec 12
Company 31 dec 12
subsidiaries 31 dec 12
Dan Pascariu 29,904 29,904 – 29,140 29,140 –
Martin Slabbert 225,000 207,868 17,132 195,267 178,254 17,013
Victor Semionov 101,667 62,384 39,283 88,533 83,089 5,444
Alexandru Morar 95,833 89,325 6,508 – – –
Tiberiu Smaranda 95,833 10,000 85,833 – – –
Desmond de Beer 31,477 31,477 – 30,670 30,670 –
Dewald Joubert 27,805 27,805 – 27,096 27,096 –
Jeffrey Zidel 33,036 33,036 – 32,210 32,210 –
Michael Mills 25,707 25,707 – 25,054 25,054 –
total 666,262 517,506 148,756 427,970 405,513 22,457
Loans granted to employees are detailed in Note 18.
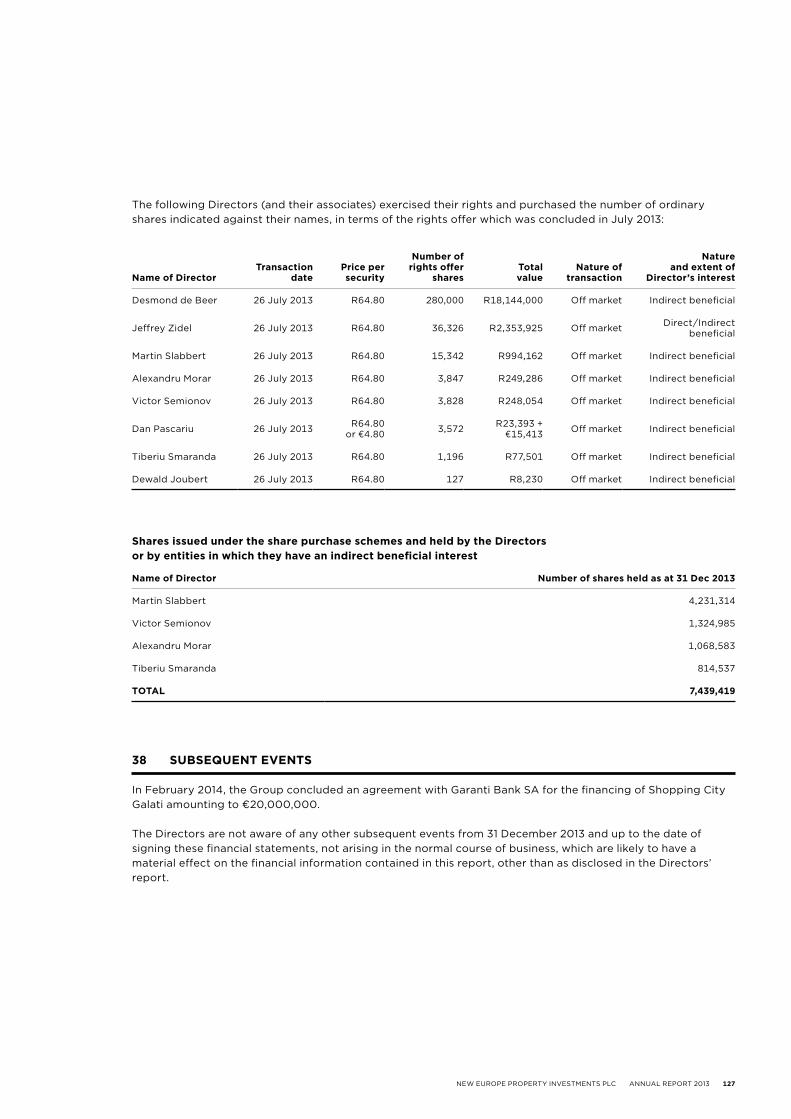
NEW EUROPE PROPERTY INVESTMENTS PLC ANNUAL REPORT 2013 127
The following Directors (and their associates) exercised their rights and purchased the number of ordinary shares indicated against their names, in terms of the rights offer which was concluded in July 2013:
name of director number of shares held as at 31 dec 2013
Martin Slabbert 4,231,314
Victor Semionov 1,324,985
Alexandru Morar 1,068,583
Tiberiu Smaranda 814,537
total 7,439,419
name of directortransaction
dateprice per security
number ofrights offer
sharestotalvalue
nature of transaction
natureand extent of
director’s interest
Desmond de Beer 26 July 2013 R64.80 280,000 R18,144,000 Off market Indirect beneficial
Jeffrey Zidel 26 July 2013 R64.80 36,326 R2,353,925 Off market Direct/Indirect beneficial
Martin Slabbert 26 July 2013 R64.80 15,342 R994,162 Off market Indirect beneficial
Alexandru Morar 26 July 2013 R64.80 3,847 R249,286 Off market Indirect beneficial
Victor Semionov 26 July 2013 R64.80 3,828 R248,054 Off market Indirect beneficial
Dan Pascariu 26 July 2013 R64.80 or €4.80 3,572 R23,393 +
€15,413 Off market Indirect beneficial
Tiberiu Smaranda 26 July 2013 R64.80 1,196 R77,501 Off market Indirect beneficial
Dewald Joubert 26 July 2013 R64.80 127 R8,230 Off market Indirect beneficial
shares issued under the share purchase schemes and held by the directors or by entities in which they have an indirect beneficial interest
38 subseQuent events
In February 2014, the Group concluded an agreement with Garanti Bank SA for the financing of Shopping City Galati amounting to €20,000,000.
The Directors are not aware of any other subsequent events from 31 December 2013 and up to the date of signing these financial statements, not arising in the normal course of business, which are likely to have a material effect on the financial information contained in this report, other than as disclosed in the Directors’ report.
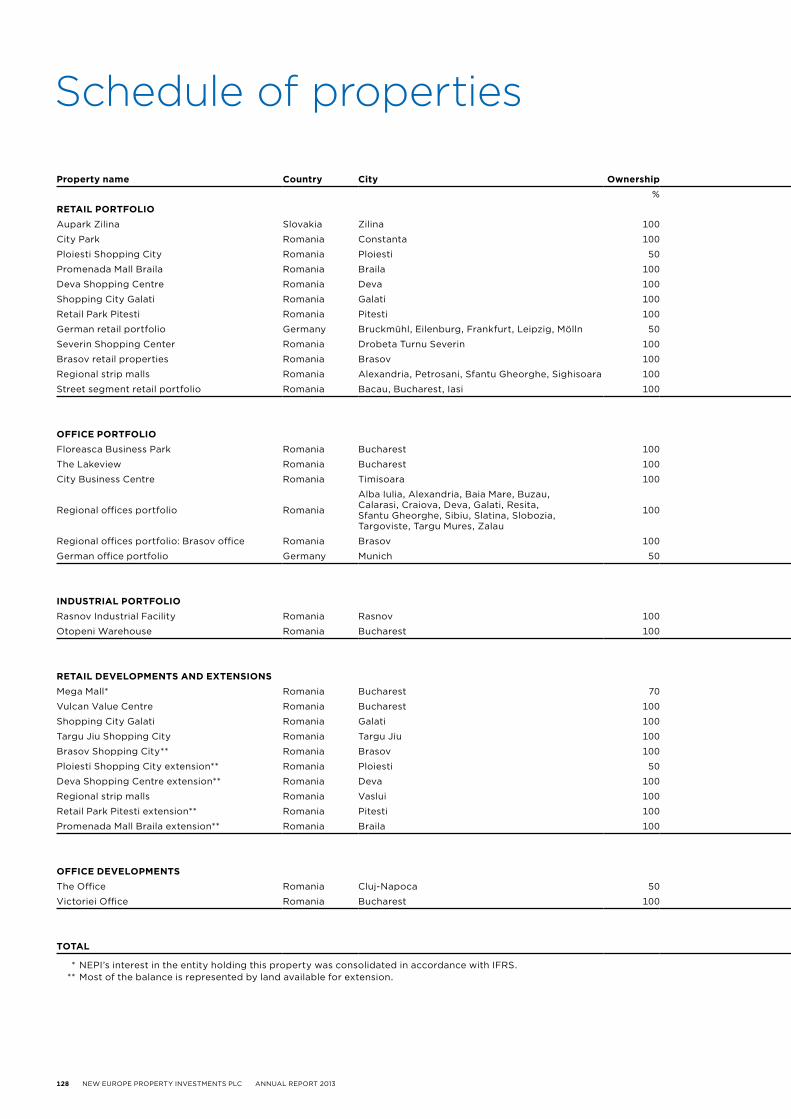
128 NEW EUROPE PROPERTY INVESTMENTS PLC ANNUAL REPORT 2013
Schedule of properties
property name Country City ownershiprentable
areaWeighted
rentable areaWeighted
average rentWeighted
vacancy valuationWeighted valuation
% m² m² €/m²/month % € €
retail portfolioAupark Zilina Slovakia Zilina 100 24,874 24,874 23.03 0.81 95,300,000 95,300,000
City Park Romania Constanta 100 29,284 29,284 21.33 0.34 90,010,000 90,010,000
Ploiesti Shopping City Romania Ploiesti 50 46,436 23,218 12.22 6.66 79,230,000 39,615,000
Promenada Mall Braila Romania Braila 100 54,850 54,850 8.64 3.32 73,300,000 73,300,000
Deva Shopping Centre Romania Deva 100 42,180 42,180 8.97 – 47,580,000 47,580,000
Shopping City Galati Romania Galati 100 27,206 27,206 12.04 – 43,140,000 43,140,000
Retail Park Pitesti Romania Pitesti 100 24,836 24,836 12.01 – 41,690,000 41,690,000
German retail portfolio Germany Bruckmühl, Eilenburg, Frankfurt, Leipzig, Mölln 50 22,078 11,039 7.00 – 23,788,948 11,894,474
Severin Shopping Center Romania Drobeta Turnu Severin 100 16,546 16,546 8.08 – 18,940,000 18,940,000
Brasov retail properties Romania Brasov 100 12,402 12,402 12.57 – 15,621,000 15,621,000
Regional strip malls Romania Alexandria, Petrosani, Sfantu Gheorghe, Sighisoara 100 7,459 7,459 7.73 6.70 7,740,000 7,740,000
Street segment retail portfolio Romania Bacau, Bucharest, Iasi 100 1,181 1,181 43.79 39.96 5,300,000 5,300,000
309,332 275,075 12.33 1.70 541,639,948 490,130,474
offiCe portfolioFloreasca Business Park Romania Bucharest 100 36,032 36,032 19.81 – 101,080,000 101,080,000
The Lakeview Romania Bucharest 100 25,564 25,564 20.15 – 63,570,000 63,570,000
City Business Centre Romania Timisoara 100 27,151 27,151 14.27 0.21 55,470,000 55,470,000
Regional offices portfolio Romania
Alba Iulia, Alexandria, Baia Mare, Buzau, Calarasi, Craiova, Deva, Galati, Resita, Sfantu Gheorghe, Sibiu, Slatina, Slobozia, Targoviste, Targu Mures, Zalau
100 33,861 33,861 6.69 13.43 21,810,000 21,810,000
Regional offices portfolio: Brasov office Romania Brasov 100 6,720 6,720 7.63 6.24 6,330,000 6,330,000
German office portfolio Germany Munich 50 2,222 1,111 16.98 – 6,605,854 3,302,927
131,550 130,439 15.34 3.85 254,865,854 251,562,927
industrial portfolioRasnov Industrial Facility Romania Rasnov 100 23,040 23,040 4.49 1.74 11,840,000 11,840,000
Otopeni Warehouse Romania Bucharest 100 4,802 4,802 9.28 – 5,090,000 5,090,000
27,842 27,842 5.33 1.44 16,930,000 16,930,000
retail developments and extensionsMega Mall* Romania Bucharest 70 45,258,163 45,258,163
Vulcan Value Centre Romania Bucharest 100 27,681,064 27,681,064
Shopping City Galati Romania Galati 100 7,268,000 7,268,000
Targu Jiu Shopping City Romania Targu Jiu 100 4,120,413 4,120,413
Brasov Shopping City** Romania Brasov 100 2,809,753 2,809,753
Ploiesti Shopping City extension** Romania Ploiesti 50 1,866,956 933,478
Deva Shopping Centre extension** Romania Deva 100 1,176,000 1,176,000
Regional strip malls Romania Vaslui 100 978,644 978,644
Retail Park Pitesti extension** Romania Pitesti 100 503,140 503,140
Promenada Mall Braila extension** Romania Braila 100 190,248 190,248
91,852,381 90,918,903
offiCe developmentsThe Office Romania Cluj-Napoca 50 18,509,098 9,254,549
Victoriei Office Romania Bucharest 100 13,668,747 13,668,747
32,177,845 22,923,296
total 468,724 433,356 12.71 2.33 937,466,028 872,465,600
* NEPI’s interest in the entity holding this property was consolidated in accordance with IFRS. ** Most of the balance is represented by land available for extension.
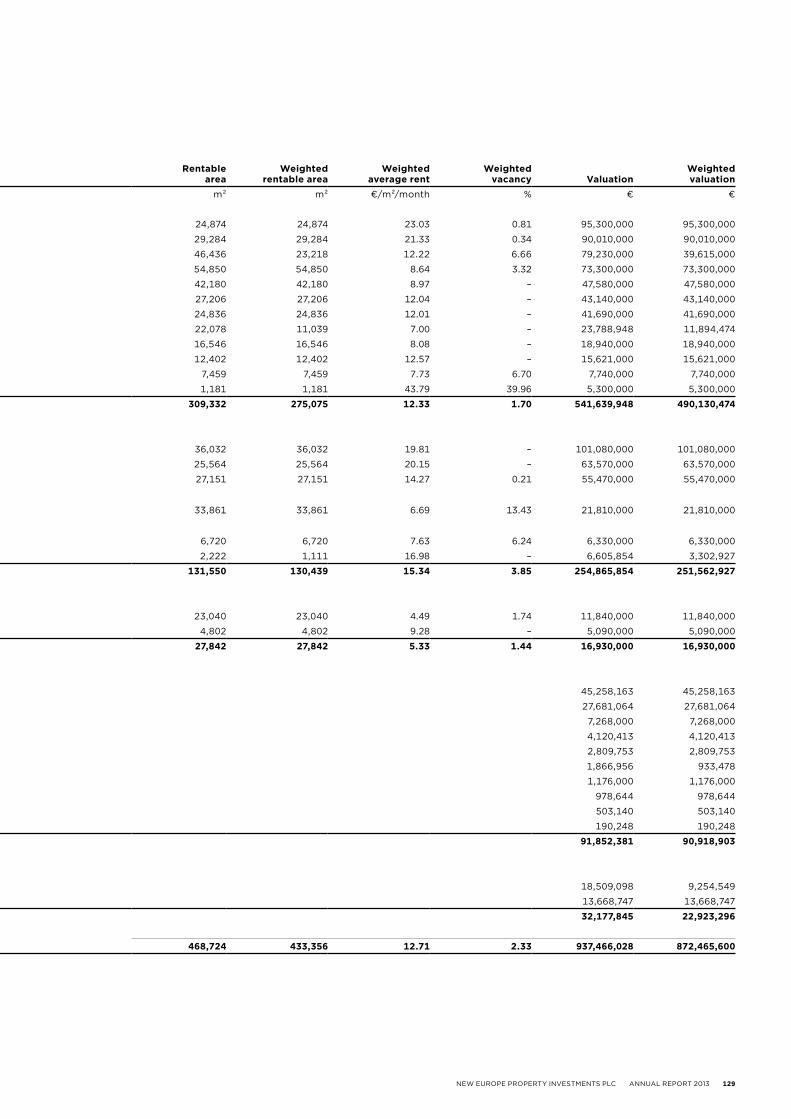
NEW EUROPE PROPERTY INVESTMENTS PLC ANNUAL REPORT 2013 129
property name Country City ownershiprentable
areaWeighted
rentable areaWeighted
average rentWeighted
vacancy valuationWeighted valuation
% m² m² €/m²/month % € €
retail portfolioAupark Zilina Slovakia Zilina 100 24,874 24,874 23.03 0.81 95,300,000 95,300,000
City Park Romania Constanta 100 29,284 29,284 21.33 0.34 90,010,000 90,010,000
Ploiesti Shopping City Romania Ploiesti 50 46,436 23,218 12.22 6.66 79,230,000 39,615,000
Promenada Mall Braila Romania Braila 100 54,850 54,850 8.64 3.32 73,300,000 73,300,000
Deva Shopping Centre Romania Deva 100 42,180 42,180 8.97 – 47,580,000 47,580,000
Shopping City Galati Romania Galati 100 27,206 27,206 12.04 – 43,140,000 43,140,000
Retail Park Pitesti Romania Pitesti 100 24,836 24,836 12.01 – 41,690,000 41,690,000
German retail portfolio Germany Bruckmühl, Eilenburg, Frankfurt, Leipzig, Mölln 50 22,078 11,039 7.00 – 23,788,948 11,894,474
Severin Shopping Center Romania Drobeta Turnu Severin 100 16,546 16,546 8.08 – 18,940,000 18,940,000
Brasov retail properties Romania Brasov 100 12,402 12,402 12.57 – 15,621,000 15,621,000
Regional strip malls Romania Alexandria, Petrosani, Sfantu Gheorghe, Sighisoara 100 7,459 7,459 7.73 6.70 7,740,000 7,740,000
Street segment retail portfolio Romania Bacau, Bucharest, Iasi 100 1,181 1,181 43.79 39.96 5,300,000 5,300,000
309,332 275,075 12.33 1.70 541,639,948 490,130,474
offiCe portfolioFloreasca Business Park Romania Bucharest 100 36,032 36,032 19.81 – 101,080,000 101,080,000
The Lakeview Romania Bucharest 100 25,564 25,564 20.15 – 63,570,000 63,570,000
City Business Centre Romania Timisoara 100 27,151 27,151 14.27 0.21 55,470,000 55,470,000
Regional offices portfolio Romania
Alba Iulia, Alexandria, Baia Mare, Buzau, Calarasi, Craiova, Deva, Galati, Resita, Sfantu Gheorghe, Sibiu, Slatina, Slobozia, Targoviste, Targu Mures, Zalau
100 33,861 33,861 6.69 13.43 21,810,000 21,810,000
Regional offices portfolio: Brasov office Romania Brasov 100 6,720 6,720 7.63 6.24 6,330,000 6,330,000
German office portfolio Germany Munich 50 2,222 1,111 16.98 – 6,605,854 3,302,927
131,550 130,439 15.34 3.85 254,865,854 251,562,927
industrial portfolioRasnov Industrial Facility Romania Rasnov 100 23,040 23,040 4.49 1.74 11,840,000 11,840,000
Otopeni Warehouse Romania Bucharest 100 4,802 4,802 9.28 – 5,090,000 5,090,000
27,842 27,842 5.33 1.44 16,930,000 16,930,000
retail developments and extensionsMega Mall* Romania Bucharest 70 45,258,163 45,258,163
Vulcan Value Centre Romania Bucharest 100 27,681,064 27,681,064
Shopping City Galati Romania Galati 100 7,268,000 7,268,000
Targu Jiu Shopping City Romania Targu Jiu 100 4,120,413 4,120,413
Brasov Shopping City** Romania Brasov 100 2,809,753 2,809,753
Ploiesti Shopping City extension** Romania Ploiesti 50 1,866,956 933,478
Deva Shopping Centre extension** Romania Deva 100 1,176,000 1,176,000
Regional strip malls Romania Vaslui 100 978,644 978,644
Retail Park Pitesti extension** Romania Pitesti 100 503,140 503,140
Promenada Mall Braila extension** Romania Braila 100 190,248 190,248
91,852,381 90,918,903
offiCe developmentsThe Office Romania Cluj-Napoca 50 18,509,098 9,254,549
Victoriei Office Romania Bucharest 100 13,668,747 13,668,747
32,177,845 22,923,296
total 468,724 433,356 12.71 2.33 937,466,028 872,465,600
* NEPI’s interest in the entity holding this property was consolidated in accordance with IFRS. ** Most of the balance is represented by land available for extension.
130 NEW EUROPE PROPERTY INVESTMENTS PLC ANNUAL REPORT 2013
Notice of 2014 AGMNotice is hereby given that the seventh Annual General Meeting of New Europe Property Investments plc (‘NEPI’ or ‘the Company’) will be held at its registered office being 2nd Floor, Anglo International House, Lord Street, Douglas, Isle of Man on 11 June 2014 at 10:00 AM British Summer Time (‘BST’), to address the considering and, if deemed fit, adopting of the resolutions set out below.
ordinarY business
To consider and, if deemed fit, to pass, with or without modification, the ordinary resolutions below.1 To receive and adopt the reports of the Directors and Auditor of the Company and the financial
statements for the year ended 31 December 2013.2 To re-elect those Directors of the Company who will retire by rotation at the Company’s Annual General
Meeting, in accordance with article 86 of the Articles of Association of the Company, and being eligible, have offered themselves for re-election.
2.1 Dan Pascariu, and2.2 Dewald Joubert
3 To re-elect those Directors of the Company who had been appointed by the Company’s Board of Directors since the last Annual General Meeting of the Company, who will retire at the Company’s Annual General Meeting, in accordance with article 81 of the Articles of Association of the Company, and being eligible, have offered themselves for re-election:
3.1 Alexandru Morar, and3.2 Tiberiu Smaranda
4 To authorise the Directors of the Company to fix their remuneration in accordance with article 95 of the Articles of Association of the Company.
In terms of the Company’s Articles of Association, in order for each of resolutions 1 to 4 above to be adopted, such resolutions must be approved by a member or members holding a majority in excess of 50% of the voting rights exercisable by shareholders, present in person or by proxy.
speCial business
To consider and, if deemed fit, to pass the following special resolutions:5 To appoint the Auditor of the Group and Company from Ernst & Young, KPMG or PricewaterhouseCoopers
and to authorise the Company’s Directors to fix their remuneration.6 So as to maintain the maximum ‘headroom’ available to the Directors for expanding the Company’s
business by allotting equity securities of the Company for cash on a non pre-emptive basis, the shareholders are to consider and, if thought fit, pass the following resolution: Resolved as a special resolution that, subject to the restrictions set out below and subject to the provisions of article 5.3, the Listings Requirements of the JSE Ltd, the AIM Rules for Companies issued by the London Stock Exchange plc and the rules of the Bucharest Stock Exchange, the Directors of the Company be and are hereby authorised until this authority lapses at the next Annual General Meeting of the Company, provided that this authority shall not extend beyond 15 months, to allot and issue shares of the Company (including the grant or issue of options or convertible securities that are convertible into an existing class of shares) for cash (or for the extinction or payment of any liability, obligation or commitment, restraint or settlement of expenses) on the following basis:
6.1 the shares which are the subject of the issue for cash must be of a class already in issue or, where this is not the case, must be limited to such shares or rights as are convertible into a class already in issue;
6.2 the allotment and issue of shares for cash shall be made only to persons qualifying as ‘public shareholders’, as defined in the Listings Requirements of the JSE Ltd, and not to ‘related parties’;
NEW EUROPE PROPERTY INVESTMENTS PLC ANNUAL REPORT 2013 131
6.3 the total aggregate number of shares which may be issued for cash in terms of this authority may not exceed 30 681 635 shares, being 15% of the Company’s issued shares as at the date of notice of this annual general meeting. Accordingly, any shares issued under this authority prior to this authority lapsing shall be deducted from the 30 681 635 shares the Company is authorised to issue in terms of this authority for the purpose of determining the remaining number of shares that may be issued in terms of this authority;
6.4 In the event of a sub-division or consolidation of shares prior to this authority lapsing, the existing authority shall be adjusted accordingly to represent the same allocation ratio;
6.5 the maximum discount at which shares may be issued is 10% of the weighted average traded price of such shares measured over the 30 business days prior to the date that the price of the issue is agreed between the Company and the party subscribing for the shares;
6.6 after the Company has issued shares in terms of this general authority to issue shares for cash representing on a cumulative basis within a financial year, 5% or more of the number of shares in issue prior to that issue, the Company shall publish an announcement containing full details of that issue, including:6.6.1 the number of shares issued;6.6.2 the average discount to the weighted average traded price of the shares over the 30
business days prior to the date that the issue is agreed in writing between the Company and the party/ies subscribing for the shares; and
6.6.3 the effects of the issue on the net asset value per share, net tangible asset value per share, earnings per share, headline earnings per share, and if applicable diluted earnings and diluted headline earnings per share.
In terms of the Listings Requirements of the JSE Ltd, in order for resolutions 5 and 6 above to be adopted, the support of at least 75% of the total number of votes exercisable by shareholders, present in person or by proxy, is required.
QuorumA quorum for the purposes of considering the resolutions above shall consist of three shareholders of the Company personally present (and if the shareholder is a body corporate, the representative of the body corporate) or by proxy and entitled to attend and vote on the business to be transacted at the Annual General Meeting or one person entitled to attend and to vote on the business to be transacted, being a member able to exercise in aggregate at least 25% of all the voting rights that are able to be exercised on at least one matter to be decided at the meeting and being present in person or by proxy.
By order of the Board, Ce Cassell COMPANY SECRETARY
132 NEW EUROPE PROPERTY INVESTMENTS PLC ANNUAL REPORT 2013
Notes to Notice of Annual General Meeting, dated 11 June 2014
1 A member of the Company who is entitled to attend the Company’s Annual General Meeting and vote thereat is entitled to appoint one or more proxies to attend and, on a poll, vote instead of that member.
2 A proxy of a member need not be a member of the Company.
3 A form of proxy is included with this notice (on page 133) and instructions for its use are shown on the form.
4 A duly completed and signed form of proxy must be received by the Company’s registrar, Sabre Fiduciary Limited, at the Company’s registered office (which is detailed in this notice) no later than 48 (forty eight) hours before the time that the meeting is due to commence. Delivery by e-mail is acceptable, as detailed in the proxy form on page 133.
5 Completion and return of a form of proxy does not preclude a member of the Company from attending the Annual General Meeting and voting in person.
6 Pursuant to regulation 22 of the Uncertificated Securities Regulations 2006 (SD 743/06), the Company specifies that in order to have the right to attend and vote at the meeting (and also for the purpose of calculating how many votes a person entitled to attend and vote may cast), a person must be entered on the register of members of the Company by no later than 10:00 AM BST on 11 June 2014 (‘the Register Time and Date’), being not more than two working days before the time fixed for the meeting to commence. Changes to entries on the register after the Register Time and Date shall be disregarded in determining the rights of any person to attend and vote at the meeting.
7 The Company’s register of Directors’ interests in the share capital and debentures of the Company, together with copies of service agreements under which the Directors of the Company are employed, are available for inspection at the Company’s registered office during normal business hours from the date of this notice until the date of the Annual General Meeting and will also be available for inspection at the place of the Annual General Meeting for at least 15 minutes prior to and during the meeting.
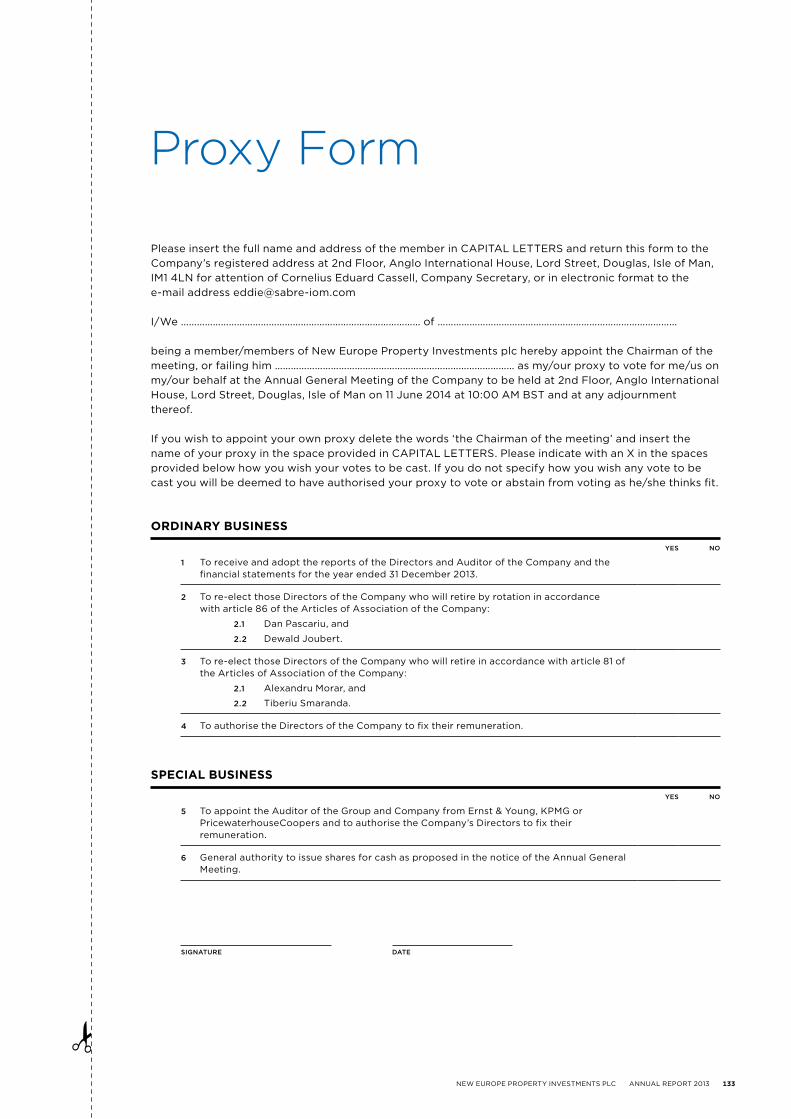
NEW EUROPE PROPERTY INVESTMENTS PLC ANNUAL REPORT 2013 133
Proxy Form
Please insert the full name and address of the member in CAPITAL LETTERS and return this form to the Company’s registered address at 2nd Floor, Anglo International House, Lord Street, Douglas, Isle of Man, IM1 4LN for attention of Cornelius Eduard Cassell, Company Secretary, or in electronic format to the e-mail address [email protected]
I/We ……………………………………………………………………………… of ………………………………………………………………………………
being a member/members of New Europe Property Investments plc hereby appoint the Chairman of the meeting, or failing him ……………………………………………………………………………… as my/our proxy to vote for me/us on my/our behalf at the Annual General Meeting of the Company to be held at 2nd Floor, Anglo International House, Lord Street, Douglas, Isle of Man on 11 June 2014 at 10:00 AM BST and at any adjournment thereof.
If you wish to appoint your own proxy delete the words ‘the Chairman of the meeting’ and insert the name of your proxy in the space provided in CAPITAL LETTERS. Please indicate with an X in the spaces provided below how you wish your votes to be cast. If you do not specify how you wish any vote to be cast you will be deemed to have authorised your proxy to vote or abstain from voting as he/she thinks fit.
ordinarY business
yes no
1 To receive and adopt the reports of the Directors and Auditor of the Company and the financial statements for the year ended 31 December 2013.
2 To re-elect those Directors of the Company who will retire by rotation in accordance with article 86 of the Articles of Association of the Company:
2.1 Dan Pascariu, and
2.2 Dewald Joubert.
3 To re-elect those Directors of the Company who will retire in accordance with article 81 of the Articles of Association of the Company:
2.1 Alexandru Morar, and
2.2 Tiberiu Smaranda.
4 To authorise the Directors of the Company to fix their remuneration.
speCial business
yes no
5 To appoint the Auditor of the Group and Company from Ernst & Young, KPMG or PricewaterhouseCoopers and to authorise the Company’s Directors to fix their remuneration.
6 General authority to issue shares for cash as proposed in the notice of the Annual General Meeting.
signature date


www.nepinvest.com
Company new europe property investments plcRegistration number 001211VJSE share code: NEP, AIM share code: NEPI, BVB share code: NEP2nd Floor, Anglo International House Lord Street, Douglas, Isle of Man, IM1 4LN
Company administrator and registrar sabre fiduciary ltd2nd Floor, Anglo International HouseLord Street, Douglas, Isle of Man, IM1 4LNPhone +44 (0) 2031 801 547Fax +44 1624 629 282
auditors and reporting accountants ernst & Young llCRose House, 51-59 Circular Road, Douglas, IM1 1AZ, Isle of Man
nominated adviser and broker smith & Williamson Corporate finance ltd25 Moorgate, London EC2R 6AY, UK
jse sponsor java Capital2 Arnold Road, Rosebank 2196, South Africa
romanian adviser intercapital invest33 Aviatorilor Blvd, Bucharest, Romania