nationwide building society/media/mainsite/docume… · · 2016-06-02nationwide undertakes no...
TRANSCRIPT

Nationwide Building Society
Preliminary Results Announcement For the year ended
4 April 2016

Nationwide Building Society – Preliminary Results Announcement
Page 2 of 108
CONTENTS
Page
Key Highlights 3
Financial Summary 4
Chief Executive’s Review 5
Financial Review 9
Business and Risk Report 19
Consolidated financial statements 73
Notes to the preliminary results announcement 79
Responsibility statement 108
Other information 108
Contacts 108
Underlying profit Profit before tax shown on a statutory and underlying basis is set out on page 9. Statutory profit before tax of £1,279 million has been adjusted for a number of items to derive an underlying profit before tax of £1,337 million. The purpose of this measure is to reflect management’s view of the Group’s underlying performance and to assist with like for like comparisons of performance across years. Underlying profit is not designed to measure sustainable levels of profitability as that potentially requires exclusion of non-recurring items even though they are closely related to (or even a direct consequence of) the Group’s core business activities. Forward looking statements Statements in this document are forward looking with respect to plans, goals and expectations relating to the future financial position, business performance and results of Nationwide. Although Nationwide believes that the expectations reflected in these forward looking statements are reasonable, Nationwide can give no assurance that these expectations will prove to be an accurate reflection of actual results. By their nature, all forward looking statements involve risk and uncertainty because they relate to future events and circumstances that are beyond the control of Nationwide including, amongst other things, UK domestic and global economic and business conditions, market related risks such as fluctuation in interest rates and exchange rates, inflation/deflation, the impact of competition, changes in customer preferences, risks concerning borrower credit quality, delays in implementing proposals, the timing, impact and other uncertainties of future acquisitions or other combinations within relevant industries, the policies and actions of regulatory authorities, the impact of tax or other legislation and other regulations in the jurisdictions in which Nationwide operates. As a result, Nationwide’s actual future financial condition, business performance and results may differ materially from the plans, goals and expectations expressed or implied in these forward looking statements. Due to such risks and uncertainties Nationwide cautions readers not to place undue reliance on such forward looking statements. Nationwide undertakes no obligation to update any forward looking statements whether as a result of new information, future events or otherwise. This document does not constitute or form part of an offer of securities for sale in the United States. Securities may not be offered or sold in the United States absent registration or an exemption from registration. Any public offering to be made in the United States will be made by means of a prospectus that may be obtained from the Society and will contain detailed information about the Society and management as well as financial statements.
Nationwide Building Society – Preliminary Results Announcement
Page 3 of 108
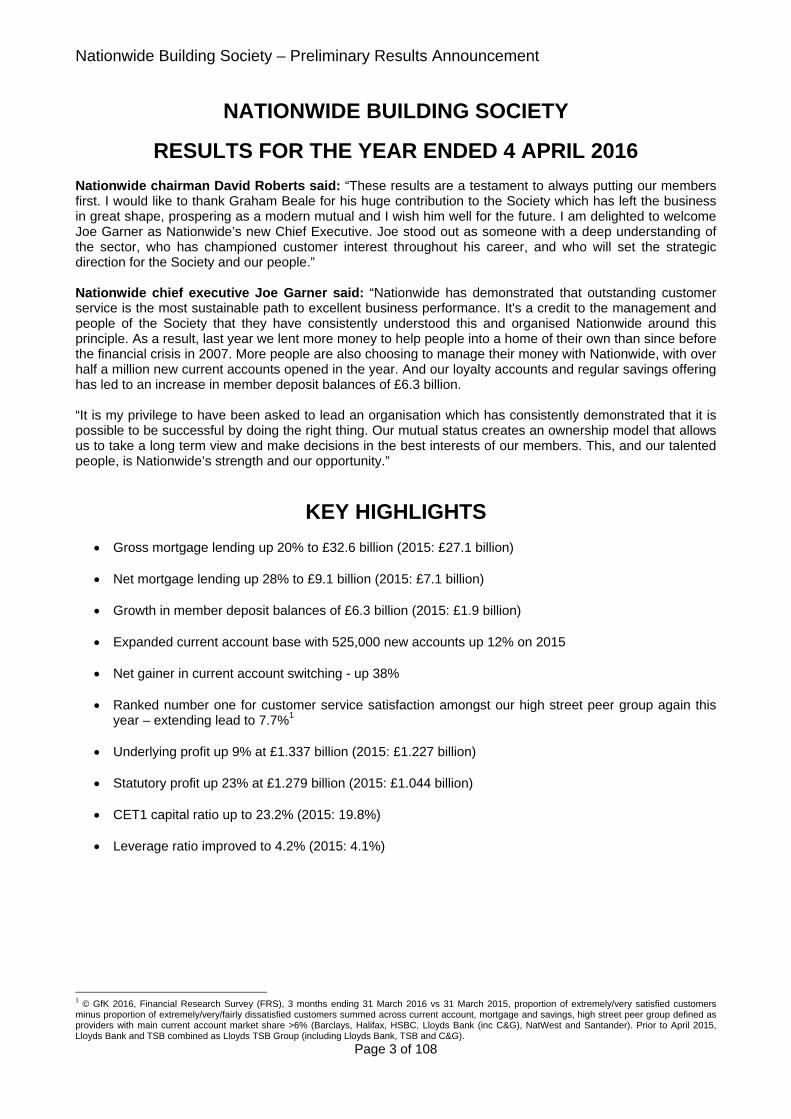
NATIONWIDE BUILDING SOCIETY
RESULTS FOR THE YEAR ENDED 4 APRIL 2016 Nationwide chairman David Roberts said: “These results are a testament to always putting our members first. I would like to thank Graham Beale for his huge contribution to the Society which has left the business in great shape, prospering as a modern mutual and I wish him well for the future. I am delighted to welcome Joe Garner as Nationwide’s new Chief Executive. Joe stood out as someone with a deep understanding of the sector, who has championed customer interest throughout his career, and who will set the strategic direction for the Society and our people.” Nationwide chief executive Joe Garner said: “Nationwide has demonstrated that outstanding customer service is the most sustainable path to excellent business performance. It's a credit to the management and people of the Society that they have consistently understood this and organised Nationwide around this principle. As a result, last year we lent more money to help people into a home of their own than since before the financial crisis in 2007. More people are also choosing to manage their money with Nationwide, with over half a million new current accounts opened in the year. And our loyalty accounts and regular savings offering has led to an increase in member deposit balances of £6.3 billion. “It is my privilege to have been asked to lead an organisation which has consistently demonstrated that it is possible to be successful by doing the right thing. Our mutual status creates an ownership model that allows us to take a long term view and make decisions in the best interests of our members. This, and our talented people, is Nationwide’s strength and our opportunity.”
KEY HIGHLIGHTS
Gross mortgage lending up 20% to £32.6 billion (2015: £27.1 billion) Net mortgage lending up 28% to £9.1 billion (2015: £7.1 billion) Growth in member deposit balances of £6.3 billion (2015: £1.9 billion) Expanded current account base with 525,000 new accounts up 12% on 2015 Net gainer in current account switching - up 38% Ranked number one for customer service satisfaction amongst our high street peer group again this
year – extending lead to 7.7%1 Underlying profit up 9% at £1.337 billion (2015: £1.227 billion) Statutory profit up 23% at £1.279 billion (2015: £1.044 billion) CET1 capital ratio up to 23.2% (2015: 19.8%) Leverage ratio improved to 4.2% (2015: 4.1%)
1 © GfK 2016, Financial Research Survey (FRS), 3 months ending 31 March 2016 vs 31 March 2015, proportion of extremely/very satisfied customers minus proportion of extremely/very/fairly dissatisfied customers summed across current account, mortgage and savings, high street peer group defined as providers with main current account market share >6% (Barclays, Halifax, HSBC, Lloyds Bank (inc C&G), NatWest and Santander). Prior to April 2015, Lloyds Bank and TSB combined as Lloyds TSB Group (including Lloyds Bank, TSB and C&G).

Nationwide Building Society – Preliminary Results Announcement
Page 4 of 108
FINANCIAL SUMMARY Year to
4 April 2016 Year to
4 April 2015 (note i)
Financial performance £m £mTotal underlying income 3,333 3,163Underlying profit before tax 1,337 1,227Statutory profit before tax 1,279 1,044Mortgage lending £bn % £bn %Group residential – gross/gross market share 32.6 13.7 27.1 13.4Group residential – net/net market share 9.1 21.4 7.1 31.2 % %Average loan to value of new residential lending (by value) 69 69Member deposits (note ii) £bn % £bn %Balance movement/market share 6.3 8.7 1.9 3.4Net receipts 5.1 0.8Key ratios % %Cost income ratio – underlying basis 53.9 51.4Cost income ratio – statutory basis 54.8 54.3Net interest margin 1.52 1.47 4 April 2016 4 April 2015 Balance sheet £bn £bnTotal assets 208.9 195.6Loans and advances to customers 178.8 170.6Member deposits (note ii) 138.7 132.4Asset quality % %Proportion of residential mortgage accounts 3 months+ in arrears 0.45 0.49Average indexed loan to value of residential mortgage book (by value) 55 56Total provision as % of non-performing balances on residential mortgage lending 3.2 3.1Total provision as % of non-performing balances on commercial real estate lending 26 47Key ratios % %Capital – CRD IV
Common Equity Tier 1 ratio (note iii) 23.2 19.8Leverage ratio (note iii) 4.2 4.1
Other balance sheet ratios
Liquidity coverage ratio 142.6 119.3Wholesale funding ratio (note iv) 24.8 23.3Loan to deposit ratio (note v) 117.2 115.6
Notes: i. Comparatives have been restated for the reclassification of foreign currency retranslation amounts from net interest income to
gains/losses on derivatives and hedge accounting as described in note 2 to the preliminary results announcement. ii. Member deposits include current account credit balances. iii. Reported under CRD IV on an end point basis. The leverage ratio is calculated using the Capital Requirements Regulation (CRR)
definition of Tier 1 for the capital amount and the Delegated Act definition of the exposure measure. iv. The wholesale funding ratio includes all balance sheet sources of funding (including securitisations) but excludes Funding for
Lending Scheme (FLS) drawings which are not included on the Group’s balance sheet, reflecting the substance of the arrangement. Off balance sheet FLS drawings totalling £8.5 billion are unchanged from the prior year.
v. The loan to deposit ratio represents loans and advances to customers divided by (shares + other deposits + amounts due to customers).

Nationwide Building Society – Preliminary Results Announcement
Page 5 of 108
Chief Executive’s Review Long term focus drives strong performance I am privileged to have been chosen to take over as Chief Executive of Nationwide Building Society. Nationwide is an exceptional organisation, one which has consistently demonstrated that it is possible to be successful by doing the right thing. This success is manifested in the latest set of results, which show strong mortgage lending, strong savings inflows and over half a million new current accounts opened. These figures are the result of a consistent and sustained focus on the needs of our members and customers, through the provision of excellent service, great products and continued investment in the fabric which underpins the Society. Our underlying profit of £1,337 million is the culmination of our performance over the past twelve months and the member relationships that we have formed over previous years. We stood by our members’ borrowing needs through the difficult financial crisis and over the four year period to March 2016 accounted for 36% of net mortgage lending in the UK. Our capital ratios have further improved, are comfortably ahead of current requirements and broadly in line with our best understanding of the medium term regulatory requirements. This enables us to be secure and to invest in the future for the benefit of members today and tomorrow. As the new Chief Executive my job will be to build on this success. As the results show, Nationwide is not in need of radical reform, but it is an organisation that should constantly challenge itself on ways it can improve and offer an enhanced level of service to its members. Helping more members buy their own home Our heritage is in providing support to the UK housing market, and 2015/16 was no exception. Over the year our gross mortgage advances reached £32.6 billion, while net lending amounted to £9.1 billion. These represent market shares of 13.7% and 21.4% respectively, strengthening our position as the UK’s second largest mortgage lender. As ever, we have recognised the importance of helping people take their initial steps onto the housing ladder, and over the year we provided finance for 57,200 first time buyer mortgages, one in six of all such mortgages in the UK. Our mutual commitment to providing consistently good value to all members has been delivered through competitive products and propositions, with no fees for standard valuations on all of our mortgage products, and we continue to provide our best rates exclusively to our existing mortgage members. We have played a major role in supporting borrowers in the buy to let market, in which we have maintained our position as the second largest lender. As the pattern of tenure in the UK continues to evolve, we believe it is right that we should offer good value, low risk loans to investors who are able to demonstrate their commitment to the rental market. We recognise that buy to let has come under regulatory and political scrutiny in recent times, including significant changes to the tax regime governing mortgage interest tax relief which come into effect from 2017. We pride ourselves on being a responsible lender, and since the year end we have taken a lead by increasing rental cover requirements to ensure loans are affordable, and by reducing the maximum loan to value for new buy to let loans.

Nationwide Building Society – Preliminary Results Announcement
Page 6 of 108
Chief Executive’s review (continued) Rewarding loyal savers Our strategy of offering a range of long term good value products has resulted in us growing our member deposit balances by £6.3 billion. This is despite significant competition at the start of the year from NS&I, offering rates well above those generally available in the market. In our drive for transparency and ease of access, we have further simplified our savings range and made it easier for members to select the best product for their needs. The vast majority of main savings products can now be opened online as well as in branch, and members can receive email and SMS updates on the status of their savings application. In addition, around ten million members received their annual statement as part of Nationwide’s Savings Promises, providing details of all their savings accounts, their current interest rates and the Society’s top variable rates. During the year over 760,000 members subscribed to our free SavingsWatch service, which automatically informs them whenever the interest rate on their account changes or Nationwide launches a new savings account. We understand that low market interest rates continue to pose challenges for savers and, in response, have offered a number of products aimed at rewarding our loyal and committed members:
Loyalty Bond, which offered our highest two-year fixed rate exclusively for existing members. Over 96,000 accounts were opened, with members depositing £2.7 billion during the four months the bond was available.
Loyalty Saver, which pays higher rates of interest according to length of membership. Over 100,000 accounts were opened during the year, with over 1.2 million members now holding these accounts.
Flexclusive Regular Saver, which offers our current account holders a rate of 5% for a year on monthly deposits of up to £500. In the first four months of the offer being available, over 185,000 members opened an account.
More people choosing Nationwide for their current account I am very pleased that we have opened 525,000 new current accounts in the last twelve months, up 12% on the previous year. This has taken our market share of main standard and packaged current accounts as at February to 7.1%; our strategic aim is to expand this to 10% to provide an effective balance with our established positions in the mortgage and savings markets. As testament to the quality of our current account range we have been a net beneficiary of customers seeking to switch their account in each and every month since the introduction of the Current Account Switch Service in September 2013. During the past year over 129,000 customers have switched their accounts to us through this service, up 38% on the previous year and representing a market share of switchers of 12.5%. Our current accounts are complemented by our high quality, good value credit card and personal loan propositions. We issued 186,000 new cards (2015: 196,000), with the attraction of new customers being impacted by the long term balance transfer products which are dominating the market. We continue to reward our main current account customers with the Select Credit Card cashback, which benefited customers to a total of over £15 million in cash reward payments, and also provides them with fee-free overseas transactions. Our strategy is to meet the unsecured borrowing needs of our existing members, and over the year we have lent £1.2 billion (2015: £0.9 billion) of personal loans.

Nationwide Building Society – Preliminary Results Announcement
Page 7 of 108
Chief Executive’s review (continued) Leading service satisfaction I am delighted that we continue to be ranked number one for customer satisfaction amongst our high street peer group and our lead over our nearest competitor has increased to 7.7% for the quarter ending March 2016 (2015: 4.5%)2. Over a longer twelve month period we remain ranked number one with a 6.6% lead3. Our service satisfaction lead is a measure of our performance over the last three months compared to the performance of our next nearest competitor, in our high street peer group. As a result, our lead can be volatile as it is dependent on the performance of our competitors. Despite our size, we account for only 2% of total industry complaints, and we make every attempt to resolve these to members’ satisfaction. When cases do get referred to the Financial Ombudsman Service, 82% of our decisions are upheld, compared with the industry average of 47%. Building a financially strong Society As a mutual we aim to optimise, rather than maximise, profit, retaining sufficient earnings to support future growth, sustain strong capital ratios and to allow us to invest in the business to provide the services that our members demand. This will help us to deliver a long term, sustainable business that operates in the interests of our members. Buoyant volumes and an improved net interest margin have contributed to a 5% increase in total underlying income to £3,333 million (2015: £3,163 million). Our underlying profit for the year was £1,337 million (2015: £1,227 million), an increase of 9%, and statutory profit before tax was £1,279 million (2015: £1,044 million), an increase of 23%. Underlying costs have increased by £170 million to £1,796 million, reflecting the growth of our business, our focus on risk and control and continued investment in new and enhanced products and services. This has resulted in our underlying cost income ratio deteriorating slightly to 53.9% (2015: 51.4%). Our strong financial performance has resulted in our CET1 ratio increasing to 23.2% (2015: 19.8%). The primary driver of the amount of capital we hold is our leverage ratio, which over the year has improved to 4.2% (2015: 4.1%). Guidance issued by the regulators during the financial year has given us greater certainty of the expected maximum capital requirements for the Society. This has allowed us to develop a financial framework to assess future performance and maintain our financial strength. The framework is based on the fundamental principle of maintaining our capital in excess of regulatory leverage ratio requirements. Based on our current assumptions, a level of underlying Group profit of approximately £1 billion to £1.5 billion per annum over the medium term would optimise our ability to invest to support members’ needs while maintaining our financial strength.
2 © GfK 2016, Financial Research Survey (FRS), 3 months ending 31 March 2016 vs 31 March 2015, proportion of extremely/very satisfied customers minus proportion of extremely/very/fairly dissatisfied customers summed across current account, mortgage and savings, high street peer group defined as providers with main current account market share >6% (Barclays, Halifax, HSBC, Lloyds Bank (inc C&G), NatWest and Santander). Prior to April 2015, Lloyds Bank and TSB combined as Lloyds TSB Group (including Lloyds Bank, TSB and C&G). 3 © GfK 2016, Financial Research Survey (FRS), 12 months ending 31 March 2016, proportion of extremely/very satisfied customers minus proportion of extremely/very/fairly dissatisfied customers summed across current account, mortgage and savings, high street peer group defined as providers with main current account market share >6% (Barclays, Halifax, HSBC, Lloyds Bank (inc C&G), NatWest and Santander).

Nationwide Building Society – Preliminary Results Announcement
Page 8 of 108
Chief Executive’s review (continued) Leading employer Our delivery of great service, great products and great results flows from employing talented and dedicated people and allowing them to make the most of their diverse range of talents. Being a great employer provides a genuine competitive advantage. We pay particular attention to providing a supportive and encouraging working environment, and our success is reflected in our annual employee survey, which continues to show exceptionally high levels of employee engagement and enablement. Supporting the communities we serve We have continued to support the communities in which we operate through a broad range of initiatives. The most notable development during the year has been our investment to extend our existing Specialist Support Service for customers affected by cancer; going forward, this will be available for customers facing other life-limiting or long term physical conditions, such as heart disease, stroke and multiple sclerosis. We will phase the roll-out to allow us to gather feedback and refine the service as it is deployed to meet a range of different circumstances. Outlook Our financial performance in the period ahead is likely to be influenced by a number of themes in line with the guidance we provided at our half year results:
clear evidence of more sustained competition within the mortgage market, resulting in further margin pressure during 2016/17
as a modern mutual we will continue to invest in order to meet our members’ current and future needs by providing good, long term value products, services and security
these two factors combine such that we anticipate profits are likely to moderate in the period ahead. The continual evolution of technology, changing customer preferences and regulatory change will affect the whole industry, and we will continue to invest to ensure we are able to deliver value to our members and maintain excellent relationships with regulators. The threat of cyber-attacks has increased, and will require ongoing focus and investment as we seek constantly to maintain the resilience of our systems and protect the interests of our members. Uncertainty surrounding the EU referendum and the global economic outlook are likely to have some impact on UK economic activity in the near term. Our central expectation is that if this uncertainty lifts and the global economy gradually strengthens, UK economic growth will move back towards its long term trend rate of 2% to 2.5% per annum. The household sector is expected to remain a main driving force, underpinned by continued healthy gains in employment and rising real earnings. We expect the housing market to remain resilient, with any dampening of activity from modest increases in interest rates offset by a strengthening labour market and an under-supply of housing. Nationwide is a unique organisation with a proud history and an optimistic future. We have the potential to build an even stronger Society serving the needs of today’s and tomorrow’s members, by championing the right thing to do and continuing to deliver tangible service excellence and long term value. We are committed to serving members and the wider society.

Nationwide Building Society – Preliminary Results Announcement
Page 9 of 108
2016 Financial Review OVERALL GROUP PERFORMANCE Our 2015/16 financial performance has been strong with statutory profit before tax up 23% year on year, reflecting a 7% increase in net interest income, underpinned by our strong operating performance, and an improvement in asset quality with impairments falling 71%. The underlying cost income ratio has deteriorated to 53.9% (2015: 51.4%) reflecting our investment in new products and services such as Nationwide Now and Apple Pay functionality, our ongoing investment in improving and strengthening our IT infrastructure, increasing sales and service capacity and our response to new regulation. Total assets have grown by £13 billion to £209 billion at 4 April 2016. This increase is largely attributable to £9.3 billion growth in residential mortgage lending, reinforcing our position as second largest mortgage lender in the UK. The remaining growth is driven by an increase in high quality liquid assets, with the Liquidity Coverage Ratio (LCR) increasing to 142.6% (2015: 119.3%). Our capital strength has improved during the year through retained earnings and a continued improvement in asset quality. As a result our CET1 and leverage ratios have reached 23.2% and 4.2% respectively (2015: 19.8% and 4.1% respectively), well in excess of current regulatory requirements. We also believe we are well placed to meet foreseeable regulatory capital requirements. We anticipate that profits are likely to moderate in the period ahead as competition maintains pressure on margins and we focus on delivering value to members, including investment in service enhancements, whilst maintaining our capital strength. Underlying and statutory results Year to
4 April 2016 Year to
4 April 2015* £m £mNet interest income 3,086 2,872Net other income 247 291Total underlying income 3,333 3,163Underlying administrative expenses (1,796) (1,626)Impairment losses (73) (251)Underlying provisions for liabilities and charges (127) (59)Underlying profit before tax 1,337 1,227Bank levy (note i) (41) (28)Transformation costs (note i) (10) (52)FSCS (note ii) (46) (83)Gains/(losses) from derivatives and hedge accounting (note iii) 39 (20)Statutory profit before tax 1,279 1,044Taxation (294) (205)Profit after tax 985 839 *Comparatives have been restated for the reclassification of foreign currency retranslation amounts from net interest income to gains/losses from derivatives and hedge accounting as described in note 2 to the preliminary results announcement. Notes: i. Within the statutory results presented in the preliminary results announcement, bank levy and transformation costs are included
within administrative expenses. ii. Within the statutory results presented in the preliminary results announcement, FSCS costs are included within provisions for
liabilities and charges. iii. Within the statutory results presented in the preliminary results announcement, gains/losses from derivatives and hedge accounting
are presented separately within total income.
Nationwide Building Society – Preliminary Results Announcement
Page 10 of 108
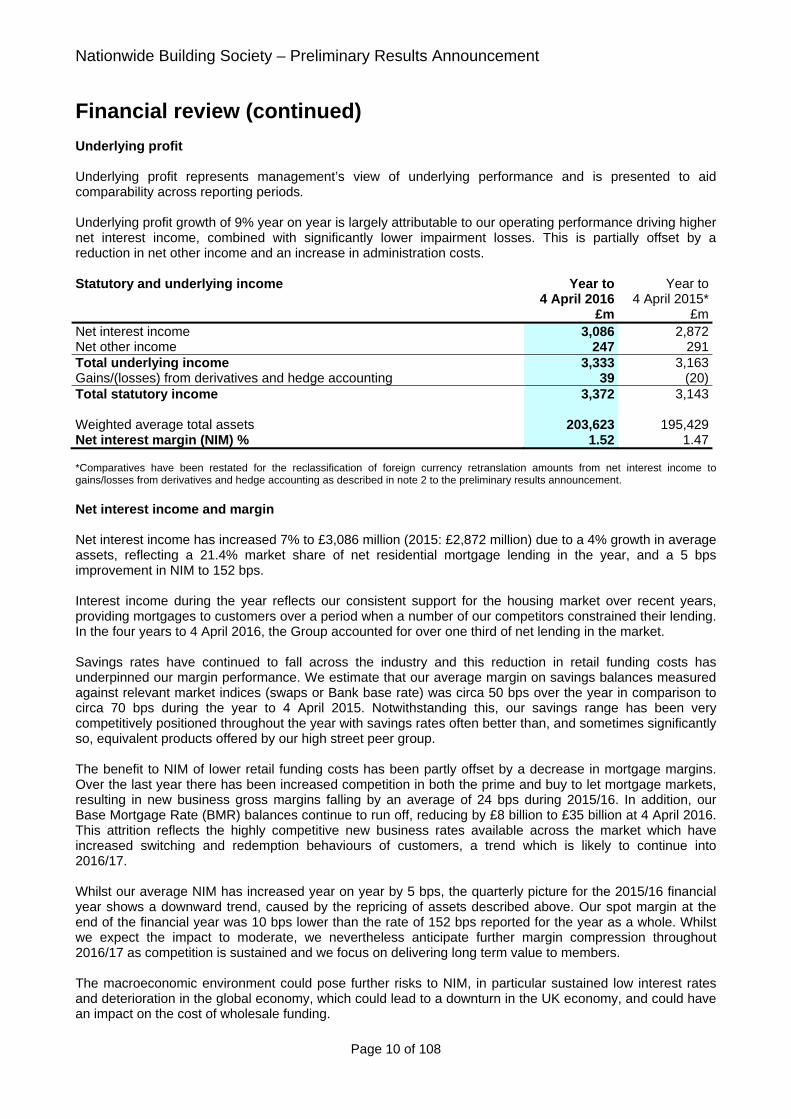
Financial review (continued) Underlying profit Underlying profit represents management’s view of underlying performance and is presented to aid comparability across reporting periods. Underlying profit growth of 9% year on year is largely attributable to our operating performance driving higher net interest income, combined with significantly lower impairment losses. This is partially offset by a reduction in net other income and an increase in administration costs. Statutory and underlying income Year to
4 April 2016 Year to
4 April 2015* £m £mNet interest income 3,086 2,872Net other income 247 291Total underlying income 3,333 3,163Gains/(losses) from derivatives and hedge accounting 39 (20)Total statutory income 3,372 3,143 Weighted average total assets 203,623 195,429Net interest margin (NIM) % 1.52 1.47 *Comparatives have been restated for the reclassification of foreign currency retranslation amounts from net interest income to gains/losses from derivatives and hedge accounting as described in note 2 to the preliminary results announcement. Net interest income and margin Net interest income has increased 7% to £3,086 million (2015: £2,872 million) due to a 4% growth in average assets, reflecting a 21.4% market share of net residential mortgage lending in the year, and a 5 bps improvement in NIM to 152 bps. Interest income during the year reflects our consistent support for the housing market over recent years, providing mortgages to customers over a period when a number of our competitors constrained their lending. In the four years to 4 April 2016, the Group accounted for over one third of net lending in the market. Savings rates have continued to fall across the industry and this reduction in retail funding costs has underpinned our margin performance. We estimate that our average margin on savings balances measured against relevant market indices (swaps or Bank base rate) was circa 50 bps over the year in comparison to circa 70 bps during the year to 4 April 2015. Notwithstanding this, our savings range has been very competitively positioned throughout the year with savings rates often better than, and sometimes significantly so, equivalent products offered by our high street peer group. The benefit to NIM of lower retail funding costs has been partly offset by a decrease in mortgage margins. Over the last year there has been increased competition in both the prime and buy to let mortgage markets, resulting in new business gross margins falling by an average of 24 bps during 2015/16. In addition, our Base Mortgage Rate (BMR) balances continue to run off, reducing by £8 billion to £35 billion at 4 April 2016. This attrition reflects the highly competitive new business rates available across the market which have increased switching and redemption behaviours of customers, a trend which is likely to continue into 2016/17. Whilst our average NIM has increased year on year by 5 bps, the quarterly picture for the 2015/16 financial year shows a downward trend, caused by the repricing of assets described above. Our spot margin at the end of the financial year was 10 bps lower than the rate of 152 bps reported for the year as a whole. Whilst we expect the impact to moderate, we nevertheless anticipate further margin compression throughout 2016/17 as competition is sustained and we focus on delivering long term value to members. The macroeconomic environment could pose further risks to NIM, in particular sustained low interest rates and deterioration in the global economy, which could lead to a downturn in the UK economy, and could have an impact on the cost of wholesale funding.

Nationwide Building Society – Preliminary Results Announcement
Page 11 of 108
Financial review (continued) Net other income Net other income has reduced by 15% to £247 million (2015: £291 million). We have chosen to improve our current account and credit card propositions during the period by removing unauthorised overdraft fees and removing fees on our credit card associated with spending above authorised credit limits. Interchange income associated with current account and credit card transactions has also reduced following the introduction of regulatory caps. As a result, despite increasing the number of active current accounts and credit cards, fee income has reduced on these products. Reduction in our general insurance income is largely due to lower profit share following a higher level of claims due to adverse weather conditions. Gains/losses from derivatives and hedge accounting Although the Group only uses derivatives to hedge risks, income statement volatility can still arise due to hedge accounting ineffectiveness or because hedge accounting is not achievable. This volatility is largely attributable to accounting rules which do not fully reflect the economic reality of the Group’s hedging strategy. Details of fair value gains and losses relating to derivatives and hedge accounting are provided in note 5 to the preliminary results announcement. Administrative expenses Year to
4 April 2016 Year to
4 April 2015* £m £mEmployee costs 736 671Other administrative expenses 735 661Depreciation and amortisation 325 294Total underlying administrative expenses 1,796 1,626Bank levy 41 28Transformation costs 10 52Total statutory administrative expenses 1,847 1,706 % %Cost income ratio – underlying basis* 53.9 51.4Cost income ratio – statutory basis 54.8 54.3 *Comparatives have been restated for the reclassification of foreign currency retranslation amounts from net interest income to gains/losses from derivatives and hedge accounting as described in note 2 to the preliminary results announcement. Total underlying administrative expenses have increased by £170 million to £1,796 million, driven by continued investment in the business. At a statutory level administrative expenses have increased by £141 million to £1,847 million. Employee costs have increased by £65 million to £736 million reflecting the impact of annual pay awards averaging 3.0% and 2.5% in each of the last two years and higher costs resulting from enhancements to the Nationwide Group Personal Pension Plan. In addition, employee numbers have increased by 3% year on year as the Group continues to build greater capacity to support our members’ needs and strengthen risk and control functions. Other administrative expenses have increased by £74 million to £735 million, driven by increased brand development costs and revenue costs associated with our ongoing commitment to a targeted programme of strategic investment. During the year, this investment has included enhancements in our digital capability, including Nationwide Now, Apple Pay functionality and PayM, IT resilience and investment in core product platforms to meet additional business volumes, and ensuring compliance with UK and European Union regulatory requirements. Depreciation charges have risen by £31 million to £325 million as a consequence of strategic investment in the business. Transformation costs are significantly lower than the prior year as a result of the successful completion of the integration of the Dunfermline, Cheshire and Derbyshire brands which have resulted in ongoing savings of £20 million per annum. Activities relating to changes in the Group’s IT service delivery model have also completed which has enabled the Group to deliver increased investment in the business at a lower cost through the utilisation of strategic partner capabilities.

Nationwide Building Society – Preliminary Results Announcement
Page 12 of 108
Financial review (continued) The cost income ratio, on an underlying basis, has deteriorated to 53.9% (2015: 51.4%) as a result of the growth in administrative expenses described above, which reflects our focus on improving product propositions and services for members whilst remaining strong, safe and secure. Impairment losses/reversals Year to
4 April 2016 £m
Year to4 April 2015
£mResidential lending 18 58Consumer banking 96 89Retail lending 114 147Commercial lending (34) 52Other lending 1 34Impairment losses on loans and advances 81 233Impairment (reversals)/losses on investment securities (8) 18Total 73 251 Impairment losses for the year of £73 million are 71% lower than in the year ended 4 April 2015 primarily as a result of an improvement in asset quality and divestment of our commercial lending portfolio. Residential lending impairment charges of £18 million (2015: £58 million) comprise a reduction in provision requirement of £9 million as a result of moderate house price growth combined with the continued reduction in our mortgage arrears to 0.45% (2015: 0.49%). This has been more than offset by increased provisions of £27 million due to refinements in our credit risk impairment assumptions to take account of the impacts of a prolonged period of low interest rates and the risks attaching to interest only mortgages. Consumer banking impairments have increased by 8% to £96 million (2015: £89 million). Of this charge, £29 million reflects a reassessment of assumptions embedded within provisioning models across each of the consumer banking products to ensure that they remain appropriate in a low interest rate environment. Excluding these model changes, the underlying consumer banking impairment charge has reduced by 25%, predominantly a result of improving economic conditions combined with improved credit underwriting for personal loans. Commercial lending impairments relate exclusively to commercial real estate (CRE) lending, with no arrears in our registered social landlords and Project Finance portfolios. The continued improvement in market conditions for CRE, as asset values improve and liquidity strengthens, has driven a high level of provision reversals and recoveries. Provisions for liabilities and charges Year to
4 April 2016 £m
Year to4 April 2015
£mUnderlying provisions for liabilities and charges – customer redress 127 59FSCS levy 46 83Total provisions for liabilities and charges 173 142 Customer redress We hold provisions for customer redress to cover the costs of remediation and redress in relation to past sales of financial products and post sales administration, including compliance with consumer credit legislation and other regulatory requirements. The £127 million charge in the period predominantly relates to updated estimates for provisions previously recognised, with £95 million of the increase relating to Payment Protection Insurance (PPI). Of the total charge a significant proportion relates to the cost of administering claims. When assessing the adequacy of our PPI provision we have considered the implications of the proposals published by the Financial Conduct Authority (FCA) in its November 2015 consultation, including the expected impact of the Plevin case. The remainder of the charge for the year is in respect of claims relating to consumer credit legislation.

Nationwide Building Society – Preliminary Results Announcement
Page 13 of 108
Financial review (continued) Financial Services Compensation Scheme (FSCS) The FSCS charge has reduced by 45% to £46 million, reflecting the Group’s expected share of interest costs in relation to the 2016/17 FSCS scheme year and final confirmation of previous scheme year charges. During the year, the FSCS have confirmed that the non-Bradford & Bingley loan was fully repaid and any excess dividends received from the wind-up of these failed institutions will be used to pay the outstanding balance of the Dunfermline capital. As a result no capital costs have been included in the charge. More information on FSCS is included in note 8 to the preliminary results announcement. Taxation The statutory tax charge for the year of £294 million (2015: £205 million) represents an effective tax rate of 23% (2015: 19.6%) which is higher than the statutory rate in the UK of 20% (2015: 21%). The higher effective rate is due principally to the banking surcharge of 8% effective from 1 January 2016, equivalent to £22 million (2015: £nil), together with the tax effect of disallowable bank levy and customer redress costs of £8 million and £7 million (2015: £6 million and £nil) respectively. Further information is provided in note 9 to the preliminary results announcement.

Nationwide Building Society – Preliminary Results Announcement
Page 14 of 108
Financial review (continued) BALANCE SHEET Total assets have increased 7% year on year to reach £209 billion at 4 April 2016 (2015: £196 billion). This growth largely reflects increases in residential mortgage lending which grew by over £9 billion as a result of the strong operating performance. This is combined with an increase in high quality on balance sheet liquid assets of £4 billion. In line with our mutual model, strong retail funding flows have largely supported the strategic growth in retail assets as we continue to introduce attractive savings products to both new and existing members. Member balances have grown by £6 billion, of which £2 billion is attributable to our award winning current account proposition as we continue to demonstrate our position as a modern mutual, improving our market share of main current accounts from 6.8% to 7.1%. ASSETS 4 April 2016 4 April 2015 £m % £m %Residential mortgages 162,164 91 152,885 89Commercial lending 13,197 7 14,594 9Consumer banking 3,869 2 3,791 2Other lending 20 - 29 - 179,250 100 171,299 100Impairment provisions (443) (652)Loans and advances to customers 178,807 170,647Other financial assets 27,782 22,721Other non-financial assets 2,350 2,212Total assets 208,939 195,580 Asset quality Residential mortgages: % %
Proportion of residential mortgage accounts 3 months+ in arrears 0.45 0.49Average indexed loan to value of residential mortgage book (by value) 55 56Impairment provisions as a % of non-performing balances 3.2 3.1
Commercial real estate (CRE) lending: £m £mGross balances 3,009 4,043Impaired balances 171 608Individual provisions as a % of impaired balances 32% 51%
Other key ratios % %Loan to deposit ratio (note i) 117.2 115.6Return on assets 0.47 0.43Liquidity coverage ratio 142.6 119.3 Note: i. The loan to deposit ratio represents loans and advances to customers divided by (shares + other deposits + amounts due to
customers).

Nationwide Building Society – Preliminary Results Announcement
Page 15 of 108
Financial review (continued) Residential mortgages Residential mortgages include prime and specialist loans, with the specialist portfolio primarily comprising buy to let (BTL) lending. Gross mortgage lending in the period was £32.6 billion (2015: £27.1 billion), representing an increased market share of 13.7% (2015: 13.4%). Net of repayment and redemptions, mortgage balances grew by £9.3 billion, of which £5.4 billion was prime lending and £3.9 billion related to specialist lending. The loan to value (LTV) profile of new lending, weighted by value, remained at 69% (2015: 69%). Annual house price growth over the financial year was 5.3%, contributing to the reduction in the average LTV of the total portfolio which fell to 55% (2015: 56%). Our residential mortgage arrears have reduced to 0.45% (2015: 0.49%) and continue to be significantly lower than the Council of Mortgage Lenders industry average which stood at 1.04% at 31 March 2016. The performance of our residential portfolios continues to be underpinned by the sustained low interest rate environment and is also now benefiting from broader market conditions, including low levels of unemployment and a return to growth in household incomes. The level of impaired balances fell by £117 million to £778 million (2015: £895 million) reflecting lower arrears. Impairment provisions have fallen by £8 million to £102 million (2015: £110 million) reflecting strong underlying asset performance, in part offset by refinements in provision modelling assumptions to take account of the impacts of a prolonged period of low interest rates and the risks attaching to interest only mortgages. Commercial lending Commercial lending includes commercial real estate (CRE) loans of £3.0 billion (2015: £4.0 billion), a reduction of 25% during the year achieved through deleveraging and repayment. Commercial lending balances also include loans to housing associations of £7.6 billion (2015: £7.8 billion) and a portfolio of loans made under the Government’s Project Finance initiative amounting to £1.2 billion (2015: £1.4 billion). The balance sheet total for commercial lending also includes £1.4 billion (2015: £1.4 billion) of fair value adjustments relating to loans where we have hedged associated financial risks, typically interest rate risk, using derivatives which are carried at fair value on the balance sheet. We have undertaken minimal amounts of new lending during the year, with activity being concentrated on ongoing management of the existing portfolio and with focus on the managed work out of weak CRE exposures. During the year, we have deleveraged over £1.0 billion of non-core CRE loans and we have reduced other CRE exposures by a further £1.0 billion through repayment and managed workout of individual exposures. The level of impaired balances as a proportion of our total CRE exposure has fallen from 15% to 6%, reflecting deleveraging and resolution of impaired asset positions. Individual provision coverage against impaired balances has fallen from 51% to 32% reflecting the work out of our higher risk cases. Consumer banking There has been particularly intense competition in the consumer banking environment in recent months; however the Group has maintained broadly stable balances reflecting our attractive pricing propositions and loyalty offers. Consumer banking comprises personal loans of £1.9 billion (2015: £1.8 billion), credit cards of £1.7 billion (2015: £1.7 billion) and current account overdrafts of £0.2 billion (2015: £0.2 billion). Asset quality remains high as we see the benefit of improved credit policies contributing to the Group’s low risk, high quality asset balance sheet. Further details of our lending and lending risks are provided in the ‘Lending risk’ section of the Business and Risk Report.

Nationwide Building Society – Preliminary Results Announcement
Page 16 of 108
Financial review (continued) Other financial assets Other financial assets total £27.8 billion (2015: £22.7 billion) and comprise liquidity and investment assets held by our Treasury Division amounting to £23.1 billion (2015: £18.8 billion), derivatives with positive fair values of £3.9 billion (2015: £3.3 billion) and fair value adjustments and other assets of £0.8 billion (2015: £0.6 billion). Derivatives largely comprise interest rate and other derivatives with positive fair values, taken out to hedge financial risks inherent in our core lending and funding activities. The increase in liquidity and investment assets reflects both the transition to Liquidity Coverage Ratio (LCR) requirements and an element of pre-funding of wholesale and Bank of England Funding for Lending Scheme (FLS) maturities to de-risk our funding plans ahead of the EU referendum in June 2016. For all these reasons we have taken opportunities to increase both the quality and duration of wholesale funding on our balance sheet over the last year with a consequent increase in liquidity. This has increased the LCR to 142.6% (2015: 119.3%). Further details of our treasury portfolios are included in the ‘Treasury assets’ section of the Business and Risk Report.

Nationwide Building Society – Preliminary Results Announcement
Page 17 of 108
Financial review (continued) LIABILITIES 4 April 2016
£m 4 April 2015
£mMember deposits 138,715 132,373Debt securities in issue 36,085 28,105Other financial liabilities 21,637 23,767Other liabilities 1,572 1,594Total liabilities 198,009 185,839Members’ interests and equity 10,930 9,741Total members’ interests, equity and liabilities 208,939 195,580 Key ratio % %Wholesale funding ratio (note i) 24.8 23.3 Note: i. The wholesale funding ratio includes all balance sheet sources of funding (including securitisations) but excludes Funding for
Lending Scheme (FLS) drawings which, as an asset swap, are not included on the Group’s balance sheet, reflecting the substance of the arrangement. Off balance sheet FLS drawings totalling £8.5 billion are unchanged from the prior year.
Member deposits Member deposits have increased by £6.3 billion to £138.7 billion (2015: £132.4 billion) as we continue to offer competitive savings and current account propositions which provide long term good value and seek to support members in the current low base rate environment. The Group has continued to attract inflows from both new and existing members through the introduction of successful products such as our Help to Buy ISA and our range of loyalty regular saver products. We estimate our share of the balance growth in the UK deposit market for the year to be 8.7% (2015: 3.4%). Of this balance growth, £2.2 billion relates to inflows into our current account products as we have increased our market share of main standard and packaged accounts from 6.8% to 7.1%, with in-credit balances on those accounts amounting to £14.8 billion (2015: £12.6 billion). Debt securities in issue Debt securities in issue of £36.1 billion (2015: £28.1 billion) are used to raise funding in wholesale markets in order to finance core activities. The increase in outstanding amounts reflects increased issuance activity in the wholesale markets during the year to support increased liquidity. The wholesale funding ratio has increased to 24.8% (2015: 23.3%), as a result of the wholesale issuance activity. Further details on the Group’s wholesale funding mix and liquidity holdings are included in the ‘Liquidity and funding risk’ section of the Business and Risk Report. Other financial liabilities Other financial liabilities include customer and bank deposits of £15.9 billion (2015: £17.2 billion), permanent interest bearing shares (PIBS) of £0.4 billion (2015: £0.4 billion), subordinated debt of £1.8 billion (2015: £2.1 billion) and derivatives and fair value adjustments of £3.5 billion (2015: £4.0 billion). Derivatives and fair value adjustments largely comprise interest rate and other derivatives with negative fair values, taken out to hedge financial risks inherent in our core lending and funding activities.

Nationwide Building Society – Preliminary Results Announcement
Page 18 of 108
Financial review (continued) CAPITAL STRUCTURE 4 April 2016
£m 4 April 2015
£mCapital resources (note i) Common Equity Tier 1 (CET1) capital 8,013 7,279Total Tier 1 capital 9,005 8,271Total regulatory capital 10,654 9,950Risk weighted assets (RWAs) 34,475 36,804Leverage exposure 213,181 200,665 CRD IV capital ratios % %CET1 ratio 23.2 19.8Leverage ratio (note ii) 4.2 4.1 Notes: i. Data in the table is reported under CRD IV on an end point basis. ii. The leverage ratio is calculated using the Capital Requirements Regulation definition of Tier 1 for the capital amount and the
Delegated Act definition of the exposure measure. CET1 capital resources have increased over the period by approximately £0.7 billion mainly as a result of a strong operating performance with £985 million of profit after tax for the period. Risk weighted assets (RWAs) reduced over the period by approximately £2.3 billion due to reduced commercial RWAs, lower retail unsecured RWAs (resulting from model development) and lower residential lending RWAs as a result of house price inflation, which more than offset portfolio growth. The movements described above have resulted in an increase in the CET1 ratio to 23.2% (2015: 19.8%). The leverage ratio has increased to 4.2% (2015: 4.1%) as growth in Tier 1 capital has outstripped the balance sheet growth, which has been driven by increases in residential mortgage and liquidity balances. The Group continues to monitor regulatory developments that could lead to an increased level of capital requirements. Whilst there are a number of areas where potential requirements are yet to be finalised, regulatory announcements during the financial year mean that we have better visibility of expectations for future capital requirements. The Group will remain engaged in the development of the regulatory approach to ensure we are prepared for any change. We expect to have a steady state leverage ratio requirement of 3.75% from 2019, which comprises a minimum requirement of 3%, a supplementary leverage ratio buffer of 0.35% and countercyclical leverage ratio buffer of 0.4%. The Financial Policy Committee could set a countercyclical leverage buffer up to 0.9%, but has so far set the buffer at 0.2%, which is expected to apply from March 2017. The Group’s strategic leverage ratio target of 4.5% reflects its desire to maintain strong levels of capital relative to maximum regulatory expectations (4.25%). Further details of the capital position are included in the ‘Solvency risk’ section of the Business and Risk Report.

Nationwide Building Society – Preliminary Results Announcement
Page 19 of 108
BUSINESS AND RISK REPORT
Contents
Page
Introduction 20
Principal risks 21
Top and emerging risks 23
Lending risk 26
Residential mortgages 29
Consumer banking 40
Commercial lending 44
Treasury assets 51
Financial risk 57
Liquidity and funding risk 58
Solvency risk 68

Nationwide Building Society – Preliminary Results Announcement
Page 20 of 108
Introduction
This Business and Risk Report explains the Group’s business, the risks it is exposed to and how it manages those risks. As the risks of the organisation are managed on a Group basis, and given the dominant position of the Society within the Group structure, the disclosures in the Business and Risk Report are on a consolidated basis covering the activities of both the Group and the Society.
The Group is organised into three business operating segments: Retail, Commercial and Head office functions. The Group is predominantly a retail focused operation which trades almost exclusively within the UK. Wholesale funding is accessed by the Group from both UK and overseas markets.
The chart below shows the Group’s business operating segments and how these activities are reflected in its risk measures. The regulatory risk weighted assets (RWAs) below indicate the relative risks each area carries as at 4 April 2016. Please see the ‘Solvency risk’ section of this report for further details regarding the Group’s capital position.
Note: No amounts are shown for market risk RWAs as the Group has elected to set these to zero, as permitted by the Capital Requirements Regulation (CRR) where the exposure is below the threshold of 2% of own funds.
Nationwide Building Society
Operating segment Retail Commercial Head office functions
Business activities Project Finance lending
Prime residential lending Specialist residential
lending Consumer banking Savings products Insurance Investments
Treasury including funding,liquidity and market riskmanagement
Central support functions
Commercial real estate lending
Social housing lending
Regulatory risk weighted assets as at 4 April 2016
£m Credit risk 19,707 Operational risk 4,575
£m Credit risk 6,194 Operational risk 29
£m Credit risk 3,970 Operational risk -

Nationwide Building Society – Preliminary Results Announcement
Page 21 of 108
Principal risks Whilst the Group accepts that all of its business activities involve risk, it seeks to protect its members by managing the risks that arise from its activities appropriately. The principal risks inherent within the business, and the Group’s attitude to managing them, are set out below: Risk category Definition Attitude Lending The risk that a borrower or
counterparty fails to pay the interest or to repay the principal on a loan or other financial instrument (such as a bond) on time. Lending risk also encompasses extension risk and concentration risk.
The Group lends responsibly only taking risks that are well understood.
The Group builds prudent portfolios, primarily focused on residential mortgages, without creating undue risk concentrations and controls exposure to higher risk portfolios.
The Group will participate in non-member business only where it has existing capabilities and earns a premium return on capital or provides valuable services to members.
Financial The risk of the Group having inadequate earnings, cash flow or capital to meet current or future requirements and expectations. This includes loss or damage to the earnings capacity, market value or liquidity of the Group, arising from mismatches between assets, funding and other commitments, and which may be exposed by changes in market rates, market conditions or the Group’s credit profile.
The Group maintains a strong balance sheet with prudent levels of liquidity, diverse sources of funding.
The Group maintains a strong capital base above regulatory requirements and ensuring the Group can withstand a severe stress event without any significant disruption to products and services.
Operational The risk of loss resulting from inadequate or failed internal processes, people and systems, or from external events.
The Group operates its business to ensure a minimum level of serious disruption to customers, brand and reputation with systems and services designed to achieve defined levels of availability and performance.

Nationwide Building Society – Preliminary Results Announcement
Page 22 of 108
Principal risks (continued) Risk category Definition Attitude Conduct and compliance
The risk that the Group exercises inappropriate judgement or makes errors in the execution of its business activities, leading to non-compliance with regulation or legislation, market integrity being undermined, or an unfair outcome being created for customers.
The Group never knowingly creates unfair outcomes for customers.
The Group's products, services and distribution channels are designed, monitored and managed to provide value over time, accessibility, and meet the needs and experience expectations of its customers.
The Group aims to have a strong, focused conduct culture, where conduct risk is embedded in governance frameworks, to ensure adequate consideration, identification, management and mitigation of conduct risks.
The Group aims to have customers at the heart of everything it does, and this is reflected in its conduct outcomes of: o protecting customers o meeting customer needs and doing what
we say o creating and nurturing fair customer
relationships o rebalancing unfair outcomes, and o protecting markets.
Strategic The risk of significant loss or damage arising from business decisions that impact the long term interests of the membership, or from an inability to adapt to external developments.
The Group is committed to a mutual business model, and ensuring this model remains sustainable within legal and regulatory requirements.
The Group focuses strategic decisions on achieving the best long term outcome for its membership.
The frameworks for the above risks, including associated risk appetite, limits and supporting policies, are reviewed at least annually, and are subject to continuous monitoring by the relevant governance committees. In addition to the above principal risks that are inherent in the Group’s business, the Group identifies, monitors and manages the top and emerging risks that could affect delivery of the Corporate Plan as an integral element of its risk and management strategy. More details are set out the following section.

Nationwide Building Society – Preliminary Results Announcement
Page 23 of 108
Top and emerging risks The Group’s top and emerging risks are identified through the process outlined in the ‘Managing risk’ section, and are closely tracked throughout the governance structure. The Group continues to keep these risks under close observation through risk reporting. Whilst the Group accepts that all of its business activities involve risk, it seeks to protect its members by managing risks that arise from its activities appropriately. Against this background, during the last year the Group’s financial strength has continued to grow and lending performance has further improved with low arrears, reflecting high quality underwriting and management. Risk management activity has focused on strengthening business resilience and managing regulatory and conduct challenges. As a result the Group’s top and emerging risks remain largely unchanged and fall within four themes: macroeconomic, cyber attack and business resilience, the changing face of financial services, and conduct and compliance challenges. These themes are outlined further below.
Macroeconomic The Group’s financial position remains strong, with increasing profitability and robust capital and liquidity positions. However, uncertainty both globally and in the UK present two main areas that could affect the Group: Sustained low interest rates could impact the Group
If rates stay at the current low rate for longer, this could constrain margins and, although not expected, a move to zero or negative rates may result in changing customer attitudes to savings, potentially impacting the Group’s business model.
A deterioration in the global economy could lead to a downturn in the UK economy
A number of global factors could impact the UK economy, for example, a divergence in monetary policy between Europe and the US, a slow-down in China as well as the referendum on UK membership of the EU. Any slowdown could temporarily affect access to and pricing of wholesale funding or reduce confidence and activity in property markets. A deterioration in the housing market or unwinding of property hotspots, such as London, could affect new business volumes and credit losses in the Group’s mortgage portfolios. The Group’s exposure in central London, although within appetite, remains an area that is closely monitored.

Nationwide Building Society – Preliminary Results Announcement
Page 24 of 108
Top and emerging risks (continued)
Cyber attack and business resilience The Group’s strategy is to use new and existing technology to deliver a market leading proposition. At the same time cyber security threats are increasing and this, coupled with the pace of technological development, creates risk across the financial services industry. In particular the Group sees two key areas which pose risks to achieving its goals: The increased frequency and sophistication of cyber attacks increases perceived and real
exposure Recent high-profile cyber attacks serve to illustrate the increasing sophistication in this area and also prompt greater regulator and member concerns about security. The interconnectivity of banking and payments infrastructures and links between wider business providers and banking data mean that a successful attack anywhere in the supply chain could impact members and damage confidence in the sector as a whole. This requires the Group to ensure that it can defend against attacks and also detect and respond to any threats.
Rising customer expectations could exceed the Group’s ability to provide a highly reliable and
widely available service in an increasingly digital environment Customer and regulator tolerance for service disruption continues to reduce within the financial services industry and, as the business becomes increasingly digital, the reliance on industry-wide systems is greater. Together these issues increase the risks that: • planned and unplanned IT outages fail to meet availability expectations, causing financial and
reputational damage to the Group • the failure of an external system could have a detrimental impact on the Group’s operations and the
service level that customers expect • maintaining IT systems and infrastructure becomes increasingly time-consuming and expensive.
Changing face of financial services The Group has delivered significant digital change over the past year, including updates to mobile and internet banking and new payment technology. The branch experience has also evolved with the introduction of digital technology such as Nationwide Now, whilst still offering more traditional products and services that are so important to many of the Group’s members. The Group will continue to develop new and existing technology to deliver a market-leading proposition. However, there are a number of challenges from new and changing competition and technology, in particular: The Group faces a range of direct and indirect challengers as the financial services industry
evolves For example: • Traditional banking competitors may pose an increasing challenge to the Group’s core markets as the
requirement to ring-fence their retail operations leads them to refocus their activities. • Collectively, challenger banks may impact product pricing, and accelerate changes in customer
expectations. • FinTech firms may also impact product pricing and customer propositions.
New technology and new models, such as peer-to-peer lending or robo-advice, may mean that
customer interactions deviate significantly from expectations This could potentially mean that: • The cost of keeping up with widespread technology changes may prove unsustainable and require
investment choices that do not match member expectations. • The economics of branch distribution could be undermined. • Retail deposit balances may become more volatile due to a combination of digital savings propositions
and responses to adverse social media coverage, impacting the business model and placing a strain on short term liquidity.

Nationwide Building Society – Preliminary Results Announcement
Page 25 of 108
Top and emerging risks (continued)
Conduct and compliance challenges The Group’s culture places conduct and compliance as central to its values and behaviours. The Group’s risk governance and control framework drives a strong customer-focused conduct culture at each stage of a customer’s interaction from product design, through sales and to post-sales servicing. The member-focused nature of the Group’s business model places it in a good position to meet current and future conduct requirements. However, the following are seen as key conduct and compliance risks for the Group: The regulatory landscape is changing
The scale and quantity of changing regulation affecting the industry continues apace. This change needs to reflect innovation in the industry that is designed to meet changing customer demands and behaviours. There is a risk that industry developments proceed ahead of regulatory change resulting in uncertainty and potential delays in the development and launch of products designed to meet customers’ needs.
The Group’s digital strategy may not meet the changing behaviours of customers
Customers expect to be able to access products and services at a time, and through a medium, of their choosing. It is critical that these services remain resilient to meet demands and prevent customer detriment. As new channels are developed to meet evolving demands it is essential that fair customer outcomes continue to be delivered.
The Group’s business model may not address the developing needs of its customers
There is a risk that the Group’s business model fails to develop to meet the changing needs of customers across their life stages. In particular the Group should ensure that it is able to quickly identify customers who may, at any time during their relationship with the Group, be in vulnerable circumstances.

Nationwide Building Society – Preliminary Results Announcement
Page 26 of 108
Lending risk Lending risk is the risk that a borrower or counterparty fails to pay interest or to repay the principal on a loan or other financial instrument (such as a bond) on time. Lending risk also encompasses extension risk and concentration risk. This section provides information on the Group’s exposure to lending risk arising from loans and advances, together with details of the level of collateral held, and impairment charges raised against these loans during the period. It also provides information about the lead risk factors and key performance indicators for each of the Group’s loan portfolios. The Group manages lending risk for each of the following portfolios: Portfolio Definition Residential mortgages Loans secured on residential property; the Group separately manages prime and
specialist lending Consumer banking Unsecured lending including current account overdrafts, personal loans and credit
cards Commercial lending Commercial real estate, loans to registered social landlords and loans made under
the Project Finance initiative Other lending Lending in respect of structured portfolios Treasury Treasury liquidity and discretionary portfolios
Maximum exposure to lending risk Lending risk largely arises from the Group’s exposure to loans and advances to customers, which account for 87.3% (2015: 88.8%) of the Group’s total lending risk exposure. Within this, the Group’s exposure relates primarily to residential mortgages, which account for 90.7% (2015: 89.5%) of total loans and advances to customers and which are comprised of high quality assets with low occurrences of arrears and possessions. The increase in the proportion of residential mortgages reflects the continued growth in mortgage lending and the strategic decision to exit from non-core commercial lending. In addition to loans and advances to customers and banks, the Group is exposed to lending risk on all other financial assets. For financial assets recognised on the balance sheet, the maximum exposure to lending risk represents the balance sheet carrying value after allowance for impairment. For off-balance sheet guarantees, the maximum exposure is the maximum amount that the Group would have to pay if the guarantees were to be called upon. For loan commitments and other credit related commitments that are irrevocable over the life of the respective facilities, the maximum exposure is the full amount of the committed facilities. The Group’s maximum exposure to lending risk has risen from £207 billion to £220 billion. This is due to the growth in residential mortgage loans described above, as well as an increase in the Group’s holding of liquidity assets reflecting the transition to Liquidity Coverage Ratio (LCR) requirements and the decision to pre-fund long term wholesale maturities.

Nationwide Building Society – Preliminary Results Announcement
Page 27 of 108
Lending risk (continued) Maximum exposure to lending risk
2016Gross
balances Less:
Impairment provisions
Carrying value
Commitments (note i)
Maximum lending risk
exposure
% of total lending risk
exposure £m £m £m £m £m %Cash 8,797 - 8,797 - 8,797 4Loans and advances to banks 3,591 - 3,591 115 3,706 2Investment securities – AFS 10,612 - 10,612 - 10,612 5Derivative financial instruments 3,898 - 3,898 - 3,898 2Fair value adjustment for portfolio hedged risk (note ii) 756 - 756 - 756 -Investments in equity shares 126 - 126 - 126 - 27,780 - 27,780 115 27,895 13 Loans and advances to customers: Residential mortgages 162,164 (102) 162,062 12,336 174,398 79Consumer banking 3,869 (281) 3,588 39 3,627 2Commercial lending (note ii) 13,197 (59) 13,138 1,065 14,203 6Other lending 20 (1) 19 75 94 - 179,250 (443) 178,807 13,515 192,322 87 Total 207,030 (443) 206,587 13,630 220,217 100
Maximum exposure to lending risk 2015
Gross balances
Less: Impairment provisions
Carrying value
Commitments (notes i & iii)
Maximum lending risk
exposure
% of total lending risk
exposure £m £m £m £m £m %Cash 4,325 - 4,325 - 4,325 2Loans and advances to banks 3,392 - 3,392 408 3,800 2Investment securities – AFS 11,037 - 11,037 - 11,037 5Derivative financial instruments 3,337 - 3,337 - 3,337 2Fair value adjustment for portfolio hedged risk (note ii) 592 - 592 - 592 -Investments in equity shares 26 - 26 - 26 - 22,709 - 22,709 408 23,117 11 Loans and advances to customers: Residential mortgages 152,885 (110) 152,775 11,796 164,571 79Consumer banking 3,791 (216) 3,575 32 3,607 2Commercial lending (note ii) 14,594 (322) 14,272 1,379 15,651 8Other lending 29 (4) 25 75 100 - 171,299 (652) 170,647 13,282 183,929 89 Total 194,008 (652) 193,356 13,690 207,046 100 Notes: i. In addition to the amounts shown above, the Group has, as part of its retail operations, revocable commitments of £8,513 million
(2015: £8,081 million) in respect of credit card and overdraft facilities. These commitments represent agreements to lend in the future, subject to certain considerations. Such commitments are cancellable by the Group, subject to notice requirements, and given their nature are not expected to be drawn down to the full level of exposure.
ii. The fair value adjustment for portfolio hedged risk and the fair value adjustment for micro hedged risk (included within the carrying value of the commercial lending portfolio) represent hedge accounting adjustments. They are indirectly exposed to lending risk through the relationship with the underlying loans covered by the Group’s hedging programmes.
iii. Off-balance sheet commitments at 4 April 2015 have been restated from £7,570 million to £13,690 million. The original disclosure omitted commitments of £6,120 million which related to customer overpayments on residential mortgages where the borrower is entitled to drawdown amounts overpaid.

Nationwide Building Society – Preliminary Results Announcement
Page 28 of 108
Movements in all impaired loans by lending risk segment The table below shows the movements throughout the year of all loans classified as impaired. The balance shown represents the entire financial asset rather than just the overdue elements. Movements in impaired loan balances
Primemortgages
Specialist mortgages
Consumer banking
Commercial lending
Other lending
Total
£m £m £m £m £m £mAt 5 April 2015 396 499 225 608 10 1,738Classified as impaired during the year 343 391 113 38 - 885Transferred from impaired to unimpaired (344) (410) (27) (70) - (851)Amounts written off (23) (66) (41) (283) (5) (418)Disposals - - - - - -Repayments (6) (2) (10) (122) - (140)At 4 April 2016 366 412 260 171 5 1,214 Movements in impaired loan balances
Primemortgages
Specialist mortgages
Consumer banking
Commercial lending
Other lending
Total
£m £m £m £m £m £mAt 5 April 2014 504 651 182 3,065 107 4,509Classified as impaired during the year 370 461 118 112 5 1,066Transferred from impaired to unimpaired (431) (513) (14) (194) (8) (1,160)Amounts written off (39) (102) (51) (638) (42) (872)Disposals - - - (1,452) (43) (1,495)Repayments (8) 2 (10) (285) (9) (310)At 4 April 2015 396 499 225 608 10 1,738 Note: Loans that were classified as impaired and loans that have transferred into or out of the impaired classification are based on the relevant status at each month end, when compared to the previous month end. Amounts written off reflect cases where the loan has been removed from the balance sheet, for example a residential property repossessed and sold. Repayments reflect payments made by the customer, reducing the outstanding balance.

Nationwide Building Society – Preliminary Results Announcement
Page 29 of 108
Residential mortgages
Summary The Group’s residential mortgages comprise prime and specialist loans. Prime residential mortgages are mainly Nationwide branded advances made through the Group’s branch network and intermediary channels; all new specialist lending is limited to buy to let mortgages originated under The Mortgage Works (UK) plc (TMW) brand. Strong levels of new lending across prime and buy to let have seen the residential mortgage portfolio continue to grow, from £153 billion to £162 billion over the year. The geographical distribution across the UK is unchanged and the average loan to value (LTV), weighted by value, is marginally lower at 55% (2015: 56%), attributable to the increase in house prices over the year. Buy to let lending has accounted for 22% of total new business, up from 18% in 2015, primarily due to the growing importance of the private rental sector for UK housing needs as a whole, reflecting long term economic and social trends. New lending performance was boosted in the final quarter as many investors sought to complete purchases ahead of the imposition of the additional 3% stamp duty for buy to let properties at the end of March. Within prime lending, first time buyers accounted for an increased share of overall lending, up to 28% compared to 26% in 2015. The Group has widened its offering of mortgages at 90 to 95% LTV, and revised its existing Save to Buy proposition to align to the government’s Help to Buy ISA to give first time buyers a further contribution to a deposit. As a consequence the average LTV of new business, the proportion of lending at higher LTVs and the loan to income metric have increased and are likely to continue to do so as the Group maintains its support for first time buyers, whilst remaining within its risk appetite. Arrears have continued to fall across both prime and specialist lending over the period reflecting the continuing favourable economic conditions and low interest rate environment, supported by a robust credit assessment and affordability controls at the point of lending. The proportion of loans that are more than three months in arrears fell from 0.49% to 0.45%; the proportion of non-performing loans and overall levels of impairment loss also fell. The Group has taken action during the year to increase the provision for losses which have been incurred but not specifically reported at the balance sheet date; this limited the fall in provisions which ended the year at £102 million (2015: £110 million). In March of this year the PRA issued a consultation paper aimed at strengthening buy to let underwriting standards across the industry. It would require lenders to ensure their approach to affordability includes a provision for the usual costs associated with a buy to let property together with suitable allowances for tax liabilities. This follows changes to income tax relief on buy to let properties announced by the Chancellor in 2015 which are due to be phased in from April 2017 to March 2021. These changes will impact existing landlords and may also impact investor demand as net rental yields are reduced. As tax will be charged on rental income without deducting mortgage interest payments, it is likely to cause a number of investors to move from a basic rate to high rate tax band, and some borrowers may find that the tax charge exceeds the current net profit they make from rent after interest payments. The Group’s buy to let lending continues to benefit from a number of enhanced controls implemented since the financial crisis, including the use of a stressed interest rate when applying interest cover ratio criteria. However the Group recognises that the changes to tax relief will materially affect the cash flow and affordability of many investors, and has taken steps to ensure that buy to let borrowing remains sustainable and affordable for landlords as the tax changes are phased in. The Group has increased its minimum interest coverage ratio (ICR) from 125% to 145% with effect from 11 May 2016, and also lowered its maximum LTV for buy to let borrowing from 80% to 75%. The Group will continue to review its approach to underwriting as the PRA consultation concludes to ensure that asset quality is maintained and new regulations are met.

Nationwide Building Society – Preliminary Results Announcement
Page 30 of 108
Residential mortgages (continued) House prices in London have been outstripping the wider UK market in recent years. The gap between the price of a typical London house and the UK equivalent is at, or close to, record levels, with London houses worth twice as much on average as houses in the UK as a whole. The house price to earnings ratio for London has increased above 11, above its previous pre-crisis peak of 8.3, and rental yields have dropped below 3.5%. Demand in London has in part been driven by the growth in buy to let activity (which is more heavily concentrated in London) and there is a risk that the stretched affordability and yield metrics, combined with a change in economic conditions or reduced investor demand, could cause a correction to house prices. Exposures in London are controlled through maximum loan sizes for new business tiered by LTV which limit individual exposures, and mean that where prices are higher, higher equity coverage is required. Both prime and buy to let lending is subject to affordability assessments using stressed interest rates (based on a five year forward view) to ensure that lending will remain affordable for borrowers even in the event of an increase in interest rates. The Group has conducted stress tests which demonstrate that even in the event of a reduction in house prices of around 40%, any losses that were to occur would not undermine the Group’s capital strength. The Group continues to monitor potential levels of negative equity should three years' of house price increases reverse, and will take steps to control the concentration of lending in London should this become necessary. The Group is exposed to higher LTV lending (up to 95% for new business) and is a strong participant in schemes designed to support first time buyers, such as the Help to Buy (Shared Equity) scheme where a deposit of 5% from the borrower is supported by an equity loan of up to 20% from the government. The Group believes that these schemes are well designed and offer valuable support to buyers, as well as providing additional credit protection for the lender. The Group controls its risk exposure to higher LTV business and shared equity schemes through a combination of risk appetite limits, credit scoring controls, and exposure limits on large new build development sites. The table below summarises the Group’s residential mortgages portfolio: Lending and new business Residential mortgage lending 2016 2015 £m % £m %Prime 129,973 80 124,549 81 Specialist: Buy to let 28,646 18 24,370 16Self-certified 2,338 1 2,634 2Near prime 859 1 952 1Sub prime 348 - 380 - 32,191 20 28,336 19 Total residential mortgages 162,164 100 152,885 100 Note: Self-certified, near prime and sub prime lending were discontinued in 2009. The Chancellor’s autumn statement announced that a 3% stamp duty surcharge on buy to let property was to be introduced from April 2016. This triggered an increase in the volume of applications as investors sought to complete ahead of the deadline and has contributed to the proportion of buy to let lending increasing over the period to 18% (2015: 16%) of total lending.

Nationwide Building Society – Preliminary Results Announcement
Page 31 of 108
Residential mortgages (continued) Distribution of new business by borrower type (by value) 2016 2015 % %Prime: Home movers 31 32First time buyers 28 26Remortgagers 18 23Other 1 1Total prime 78 82 Specialist: Buy to let new purchases 8 8Buy to let remortgagers 14 10Total specialist 22 18 Total new business 100 100 Note: All new business measures exclude existing customers who are only switching products and further advances. In October 2014, the Financial Policy Committee (FPC) introduced a 15% limit on the proportion of new lending that may be written at income multiples of 4.5 and above. This limit applies to residential mortgages, excluding buy to let. The Group’s proportion of new lending at income multiples of 4.5 or higher has averaged 7% (2015: 5%). The increase is principally driven by a higher proportion of lending to first time buyers as the Group continues to support this segment of the market. The proportion of new lending at income multiples of 4.5 or higher is likely to continue to increase but will remain within the FPC limit and in line with the Group’s overall approach to lending.
Lending risk Residential mortgage lending in the Group continues to have a low risk profile as demonstrated by a low level of arrears compared to the industry average. The Group’s residential mortgages portfolio comprises a large number of relatively small loans which are broadly homogenous, have low volatility of credit risk outcomes and are intrinsically highly diversified in terms of the UK market and geographic segments. LTV and lending risk concentration The Group calculates LTV by weighting the borrower level LTV by the individual loan balance to arrive at an average LTV. This approach is considered to most appropriately reflect the exposure at risk to the Group. Average LTV of loan stock 2016 2015
% %Prime 54 54Specialist 61 63Group 55 56 Average LTV of new business 2016 2015
% %Prime 71 70Specialist (buy to let) 65 67Group 69 69 Note: The LTV of new business excludes further advances. The average LTV of buy to let new lending reduced by 2%. This is due in part to the impact of stricter affordability checks for higher LTV lending implemented in November 2014.

Nationwide Building Society – Preliminary Results Announcement
Page 32 of 108
Residential mortgages (continued) LTV distribution of new business 2016 2015
% %0% to 60% 26 2660% to 75% 40 4275% to 80% 9 1080% to 85% 12 1085% to 90% 11 1190% to 95% 2 1Over 95% - -Total 100 100 The maximum LTV for new customers is 95%, the proportion of lending greater than 90% LTV has increased to 2% (2015: 1%) as a direct result of the Group’s strategy to support the first time buyer market. Buy to let lending is restricted to a maximum LTV of 80%, with only 4% (2015: 4%) of lending greater than 75% LTV. Geographical concentration Residential mortgage balances by LTV and region
Greater London
Central England
Northern England
South East
England
South West
England
Scotland Wales Northern Ireland
Total
2016 £m £m £m £m £m £m £m £m £m % Performing loans Fully collateralised LTV ratio: Up to 50% 26,991 8,795 5,866 7,855 5,051 2,711 1,178 785 59,23250% to 60% 12,350 4,971 3,402 4,262 2,733 1,547 637 346 30,24860% to 70% 8,465 6,636 5,052 4,363 3,460 2,095 903 390 31,36470% to 80% 4,062 5,454 6,282 2,211 2,359 2,776 1,273 371 24,78880% to 90% 1,559 2,210 3,135 894 918 1,380 657 271 11,02490% to 100% 85 177 901 66 60 232 212 151 1,884 53,512 28,243 24,638 19,651 14,581 10,741 4,860 2,314 158,540 97.7 Not fully collateralised - Over 100% LTV (A) 7 8 80 1 4 31 13 301 445 0.3- Collateral value on A 6 7 73 1 3 29 13 248 380- Negative equity on A 1 1 7 - 1 2 - 53 65 Total performing loans 53,519 28,251 24,718 19,652 14,585 10,772 4,873 2,615 158,985 98.0 Non-performing loans Fully collateralised LTV ratio: Up to 50% 522 161 107 127 73 43 27 26 1,08650% to 60% 245 100 68 74 52 28 13 12 59260% to 70% 110 131 108 76 60 42 20 12 55970% to 80% 29 114 139 42 48 46 24 12 45480% to 90% 7 74 98 7 17 28 19 12 26290% to 100% 1 14 73 1 2 13 16 7 127 914 594 593 327 252 200 119 81 3,080 1.9 Not fully collateralised - Over 100% LTV (B) - 3 25 2 1 3 5 60 99 0.1- Collateral value on B - 3 22 1 1 3 5 46 81- Negative equity on B - - 3 1 - - - 14 18 Total non-performing loans 914 597 618 329 253 203 124 141 3,179 2.0 Total residential mortgages 54,433 28,848 25,336 19,981 14,838 10,975 4,997 2,756 162,164 100.0 Geographical concentrations 33% 18% 16% 12% 9% 7% 3% 2% 100%

Nationwide Building Society – Preliminary Results Announcement
Page 33 of 108
Residential mortgages (continued) Residential mortgage balances by LTV and region
Greater London
Central England
Northern England
South East
England
South West
England
Scotland Wales Northern Ireland
Total
2015 £m £m £m £m £m £m £m £m £m % Performing loans Fully collateralised LTV ratio: Up to 50% 21,388 8,168 5,778 6,752 4,528 2,716 1,144 780 51,25450% to 60% 11,785 4,345 3,164 3,479 2,283 1,481 572 328 27,43760% to 70% 9,490 6,470 4,864 4,594 3,191 2,102 830 381 31,92270% to 80% 4,582 5,535 6,079 2,788 2,592 2,688 1,203 392 25,85980% to 90% 1,476 2,148 3,000 821 952 1,192 676 236 10,50190% to 100% 42 228 860 41 76 249 197 126 1,819 48,763 26,894 23,745 18,475 13,622 10,428 4,622 2,243 148,792 97.3 Not fully collateralised - LTV more than 100% (A) 9 13 105 3 5 36 23 366 560 0.4- Collateral value on A 7 11 97 3 4 34 22 300 478- Negative equity on A 2 2 8 - 1 2 1 66 82 Total performing loans 48,772 26,907 23,850 18,478 13,627 10,464 4,645 2,609 149,352 97.7 Non-performing loans Fully collateralised LTV ratio: Up to 50% 441 156 111 115 68 44 25 27 98750% to 60% 287 98 69 70 44 26 13 12 61960% to 70% 210 141 115 90 66 43 20 13 69870% to 80% 78 138 148 69 56 53 25 12 57980% to 90% 12 93 116 24 35 32 22 13 34790% to 100% 1 26 91 1 4 14 18 13 168 1,029 652 650 369 273 212 123 90 3,398 2.2 Not fully collateralised - LTV more than 100% (B) 1 7 33 2 1 4 9 78 135 0.1- Collateral value on B 1 6 29 2 1 3 8 59 109- Negative equity on B - 1 4 - - 1 1 19 26 Total non-performing loans 1,030 659 683 371 274 216 132 168 3,533 2.3 Total residential mortgages 49,802 27,566 24,533 18,849 13,901 10,680 4,777 2,777 152,885 100.0 Geographical concentrations 33% 18% 16% 12% 9% 7% 3% 2% 100%
The value of partially collateralised non-performing loans has reduced to £99 million (2015: £135 million), following the growth in house prices and a reduction in arrears cases. Arrears Number of cases more than 3 months in arrears as % of total book 2016 2015
% %Prime 0.35 0.36Specialist 0.90 1.12Group 0.45 0.49 CML industry average 1.04 1.30 Supported by favourable economic conditions and a continued low interest environment, the arrears performance of both the prime and specialist mortgage portfolios continues to improve. The Group’s combined arrears rate of 0.45% remains less than half of the Council of Mortgage Lenders’ (CML) industry average rate of 1.04%.

Nationwide Building Society – Preliminary Results Announcement
Page 34 of 108
Residential mortgages (continued) Impaired loans Impaired and non-performing loans are identified primarily by arrears status. Impaired accounts are defined as those greater than three months in arrears and include accounts subject to possession. Non-performing accounts include all impaired loans and also loans which are past due but not impaired, including any asset where a payment due is received late or missed. The non-performing loan amount represents the entire financial asset rather than just the payment overdue. Loans on interest only or payment holiday concessions are initially categorised according to their payment status as at the date of concession, with subsequent revisions to this category assessed against the terms of the concession. The Group holds impairment provisions in relation to both the performing and non-performing segments of the residential mortgage portfolio. Provisions reflect losses which have been incurred at the balance sheet date, based on objective evidence. Individual impairment provisions are assigned to accounts in possession and a collective provision is assigned to all other accounts. For currently performing loans, the provision reflects losses arising from impairment events that have occurred within the portfolio but are not identifiable at the reporting date. Residential mortgages by payment status 2016
Prime Specialist Total £m £m £m %Performing:
Neither past due nor impaired 127,986 30,999 158,985 98.0 Non-performing:
Past due up to 3 months 1,621 780 2,401 1.5 Impaired: Past due 3 to 6 months 170 188 358 0.2Past due 6 to 12 months 115 115 230 0.2Past due over 12 months 75 91 166 0.1Possessions 6 18 24 -
Total non-performing loans 1,987 1,192 3,179 2.0 Total residential mortgages 129,973 32,191 162,164 100.0 Non-performing loans as a % of total residential mortgages 1.5% 3.7% 2.0%Impairment provisions (£m) 25 77 102Impairment provisions as a % of non-performing balances 1.3% 6.5% 3.2%Impairment provisions as a % of total residential mortgages 0.02% 0.24% 0.06%

Nationwide Building Society – Preliminary Results Announcement
Page 35 of 108
Residential mortgages (continued) Residential mortgages by payment status 2015
Prime Specialist Total £m £m £m %Performing:
Neither past due nor impaired 122,424 26,928 149,352 97.7 Non-performing:
Past due up to 3 months 1,729 909 2,638 1.7 Impaired: Past due 3 to 6 months 190 207 397 0.3Past due 6 to 12 months 120 143 263 0.2Past due over 12 months 72 97 169 0.1Possessions 14 52 66 -
Total non-performing loans 2,125 1,408 3,533 2.3 Total residential mortgages 124,549 28,336 152,885 100.0 Non-performing loans as a % of total residential mortgages 1.7% 5.0% 2.3% Impairment provisions (£m) 22 88 110 Impairment provisions as a % of non-performing balances 1.0% 6.3% 3.1% Impairment provisions as a % of total residential mortgages 0.02% 0.31% 0.07% The improved performance of the book has meant that during the period the Group’s proportion of non-performing loans has reduced to 2.0% (2015: 2.3%). The provision balance has fallen to £102 million (2015: £110 million). This reflects the continued improvement in the quality of the book, evidenced by a continued decline in instances of arrears. However, whilst credit risk metrics have improved, they have reached a level from which the rate of further improvement is likely to slow. In addition, the Group has reviewed and updated its provision models and assumptions to ensure they appropriately reflect incurred losses within the portfolio. Specific areas of focus included interest only loans which are approaching maturity as well as accounts which have recently returned to performing status, supported by the low interest environment. The updates have resulted in provision increases for losses incurred but not identified at the balance sheet date. The impairment charge for the year reflects both the improved performance of the book and the refinements to provision models and assumptions. Impairment loss for the year 2016 2015 £m £mPrime 8 13Specialist 10 45Total 18 58

Nationwide Building Society – Preliminary Results Announcement
Page 36 of 108
Residential mortgages (continued) Possessions Number of properties in possession as % of total book
2016 2015 Number of properties
% Number of properties
%
Prime 57 0.01 151 0.01Specialist 117 0.04 258 0.10Group 174 0.01 409 0.03 CML industry average 0.03 0.05 Repossession numbers have reduced partly due to the strong performance of the portfolio in the current economic environment, consistent with the low arrears and impairment rates. The Group is also currently reviewing repossession processes which will have delayed possession in some cases and contributed to the drop in volumes over this period. Provisions have been adjusted to ensure they remain adequate in light of this change in process. Interest only mortgages The Group does not offer any new advances for prime residential mortgages on an interest only basis. However, the Group has historical balances which were originally advanced as interest only mortgages or where the Group agreed a change in terms to an interest only basis (this option was withdrawn in 2012). The Group manages maturities on interest only mortgages closely, engaging regularly with customers to ensure the loan is redeemed or to agree a strategy for repayment. The majority of the specialist portfolio is made up of buy to let loans, of which approximately 90% are advanced on an interest only basis. Interest only mortgages
Term expired
(still open)
Due within one year
Due after one year
and before two years
Due after two years
and before five years
Due after more than five years
Total % oftotal book
2016 £m £m £m £m £m £m %Prime 58 396 475 1,731 16,178 18,838 14.5Specialist 98 174 254 1,002 27,084 28,612 88.9Total 156 570 729 2,733 43,262 47,450 29.3 Interest only mortgages
Term expired
(still open)
Due within one year
Due after one year
and before two years
Due aftertwo years
and before five years
Due after more than five years
Total % oftotal book
2015 £m £m £m £m £m £m %Prime 57 376 538 1,898 19,217 22,086 17.7Specialist 95 122 220 953 23,520 24,910 87.9Total 152 498 758 2,851 42,737 46,996 30.7 The proportion of prime residential interest only mortgages has fallen to 14.5% (2015: 17.7%). Interest only loans which are ‘term expired (still open)’ are, to the extent they are not otherwise in arrears, considered to be performing. They are included within the ‘Repair: Term extensions’ category in the renegotiated loans tables on the following pages.

Nationwide Building Society – Preliminary Results Announcement
Page 37 of 108
Residential mortgages (continued) Negative equity on non-performing loans Negative equity of non-performing residential mortgages
2016 2015 Prime Specialist Prime Specialist
£m £m £m £mPast due but not impaired 2 4 2 7Impaired 1 10 2 9Possessions - 1 - 6Total 3 15 4 22 Note: Collateral is capped at the amount outstanding on an individual loan basis. The improving arrears position and growth in house prices have combined to reduce the value of non-performing loans in negative equity to £18 million (2015: £26 million).
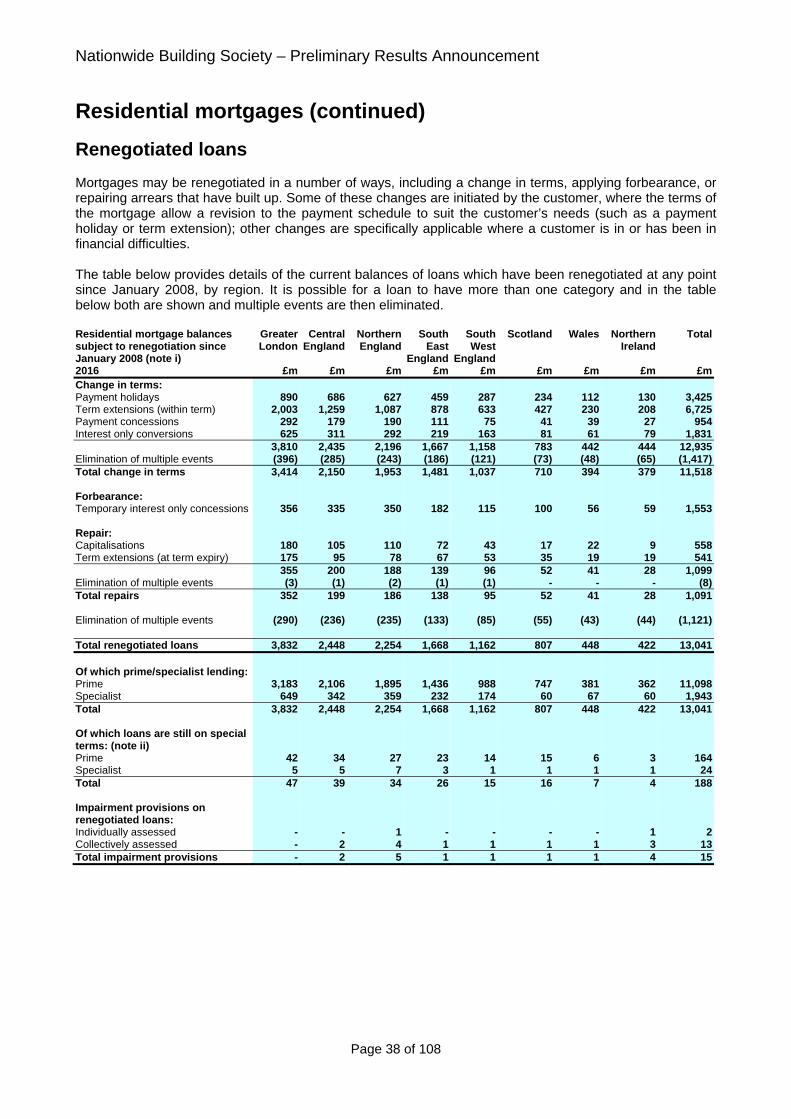
Nationwide Building Society – Preliminary Results Announcement
Page 38 of 108
Residential mortgages (continued)
Renegotiated loans Mortgages may be renegotiated in a number of ways, including a change in terms, applying forbearance, or repairing arrears that have built up. Some of these changes are initiated by the customer, where the terms of the mortgage allow a revision to the payment schedule to suit the customer’s needs (such as a payment holiday or term extension); other changes are specifically applicable where a customer is in or has been in financial difficulties. The table below provides details of the current balances of loans which have been renegotiated at any point since January 2008, by region. It is possible for a loan to have more than one category and in the table below both are shown and multiple events are then eliminated. Residential mortgage balances subject to renegotiation since January 2008 (note i)
Greater London
Central England
Northern England
South East
England
South West
England
Scotland Wales Northern Ireland
Total
2016 £m £m £m £m £m £m £m £m £mChange in terms: Payment holidays 890 686 627 459 287 234 112 130 3,425Term extensions (within term) 2,003 1,259 1,087 878 633 427 230 208 6,725Payment concessions 292 179 190 111 75 41 39 27 954Interest only conversions 625 311 292 219 163 81 61 79 1,831 3,810 2,435 2,196 1,667 1,158 783 442 444 12,935Elimination of multiple events (396) (285) (243) (186) (121) (73) (48) (65) (1,417)Total change in terms 3,414 2,150 1,953 1,481 1,037 710 394 379 11,518 Forbearance: Temporary interest only concessions 356 335 350 182 115 100 56 59 1,553 Repair: Capitalisations 180 105 110 72 43 17 22 9 558Term extensions (at term expiry) 175 95 78 67 53 35 19 19 541 355 200 188 139 96 52 41 28 1,099Elimination of multiple events (3) (1) (2) (1) (1) - - - (8)Total repairs 352 199 186 138 95 52 41 28 1,091 Elimination of multiple events (290) (236) (235) (133) (85) (55) (43) (44) (1,121) Total renegotiated loans 3,832 2,448 2,254 1,668 1,162 807 448 422 13,041 Of which prime/specialist lending: Prime 3,183 2,106 1,895 1,436 988 747 381 362 11,098Specialist 649 342 359 232 174 60 67 60 1,943Total 3,832 2,448 2,254 1,668 1,162 807 448 422 13,041 Of which loans are still on special terms: (note ii) Prime 42 34 27 23 14 15 6 3 164Specialist 5 5 7 3 1 1 1 1 24Total 47 39 34 26 15 16 7 4 188 Impairment provisions on renegotiated loans: Individually assessed - - 1 - - - - 1 2Collectively assessed - 2 4 1 1 1 1 3 13Total impairment provisions - 2 5 1 1 1 1 4 15
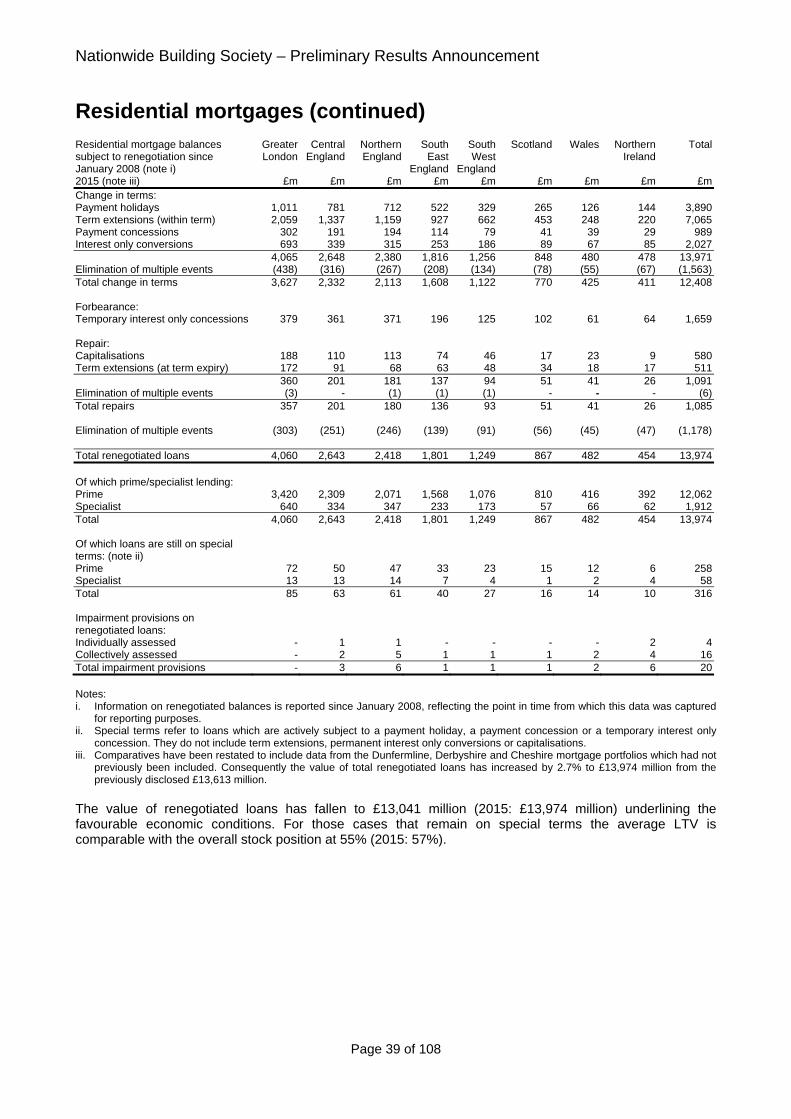
Nationwide Building Society – Preliminary Results Announcement
Page 39 of 108
Residential mortgages (continued) Residential mortgage balances subject to renegotiation since January 2008 (note i)
Greater London
Central England
Northern England
South East
England
South West
England
Scotland Wales Northern Ireland
Total
2015 (note iii) £m £m £m £m £m £m £m £m £mChange in terms: Payment holidays 1,011 781 712 522 329 265 126 144 3,890Term extensions (within term) 2,059 1,337 1,159 927 662 453 248 220 7,065Payment concessions 302 191 194 114 79 41 39 29 989Interest only conversions 693 339 315 253 186 89 67 85 2,027 4,065 2,648 2,380 1,816 1,256 848 480 478 13,971Elimination of multiple events (438) (316) (267) (208) (134) (78) (55) (67) (1,563)Total change in terms 3,627 2,332 2,113 1,608 1,122 770 425 411 12,408 Forbearance: Temporary interest only concessions 379 361 371 196 125 102 61 64 1,659 Repair: Capitalisations 188 110 113 74 46 17 23 9 580Term extensions (at term expiry) 172 91 68 63 48 34 18 17 511 360 201 181 137 94 51 41 26 1,091Elimination of multiple events (3) - (1) (1) (1) - - - (6)Total repairs 357 201 180 136 93 51 41 26 1,085 Elimination of multiple events (303) (251) (246) (139) (91) (56) (45) (47) (1,178) Total renegotiated loans 4,060 2,643 2,418 1,801 1,249 867 482 454 13,974 Of which prime/specialist lending: Prime 3,420 2,309 2,071 1,568 1,076 810 416 392 12,062Specialist 640 334 347 233 173 57 66 62 1,912Total 4,060 2,643 2,418 1,801 1,249 867 482 454 13,974 Of which loans are still on special terms: (note ii) Prime 72 50 47 33 23 15 12 6 258Specialist 13 13 14 7 4 1 2 4 58Total 85 63 61 40 27 16 14 10 316 Impairment provisions on renegotiated loans: Individually assessed - 1 1 - - - - 2 4Collectively assessed - 2 5 1 1 1 2 4 16Total impairment provisions - 3 6 1 1 1 2 6 20 Notes: i. Information on renegotiated balances is reported since January 2008, reflecting the point in time from which this data was captured
for reporting purposes. ii. Special terms refer to loans which are actively subject to a payment holiday, a payment concession or a temporary interest only
concession. They do not include term extensions, permanent interest only conversions or capitalisations. iii. Comparatives have been restated to include data from the Dunfermline, Derbyshire and Cheshire mortgage portfolios which had not
previously been included. Consequently the value of total renegotiated loans has increased by 2.7% to £13,974 million from the previously disclosed £13,613 million.
The value of renegotiated loans has fallen to £13,041 million (2015: £13,974 million) underlining the favourable economic conditions. For those cases that remain on special terms the average LTV is comparable with the overall stock position at 55% (2015: 57%).

Nationwide Building Society – Preliminary Results Announcement
Page 40 of 108
Consumer banking
Summary The Group’s consumer banking portfolio includes balances relating to the unsecured portfolios for overdrawn current accounts, personal loans and credit cards. Total balances across these portfolios have grown by 2.1% during the period to £3,869 million (2015: £3,791 million), despite the continued intense competition across all lenders in the unsecured market. This is evident in the increasing duration of introductory offers for credit cards, switching incentives for current accounts and lower rates for personal loans. Portfolio performance and risk profile has continued to improve as a result of previous policy and pricing changes, alongside the favourable economic environment. This has led to a 13.5% reduction in non-performing balances (excluding charged off accounts), from £171 million to £148 million, and forbearance levels have remained stable over this period. The Group actively monitors and manages emerging risks in the UK and the potential impacts on its exposure to lending risk, including the potential effect of interest rate rises and a reversal in current trends, such as unemployment. Due to the prolonged low interest environment and the associated improvement in portfolio performance, the Group has conducted a comprehensive review of its credit risk impairment assumptions to ensure they remain appropriate. This has led to an increase in provisions of £29 million in relation to the up to date book and total provisions have increased to £281 million (2015: £216 million). The regulatory environment for unsecured lending continues to evolve with the Competition & Markets Authority assessment of competitive practices, fees charged and assistance for vulnerable customers, alongside the FCA market review due for publication later this year. The Group considers that its focus on responsible lending and its commitment to ensuring good outcomes for customers will be consistent with the direction of any regulatory changes. The table below summarises the Group’s consumer banking portfolio: Consumer banking balances 2016 2015 £m % £m %Overdrawn current accounts 247 6 248 7Personal loans 1,901 49 1,799 47Credit cards 1,721 45 1,744 46Total consumer banking 3,869 100 3,791 100

Nationwide Building Society – Preliminary Results Announcement
Page 41 of 108
Consumer banking (continued)
Lending risk Impaired loans The Group monitors and reports lending risk on consumer banking portfolios primarily on delinquency status, since no security is held against the loans. Impaired accounts are defined as those greater than three months in arrears. Non-performing accounts include all impaired loans and also loans which are past due but not impaired, including any asset where a payment due is received late or missed. The non-performing loan amount represents the entire financial asset rather than just the payment overdue. The performance of the portfolios is closely monitored, with corrective action taken when appropriate to ensure adherence with risk appetite. The Group holds impairment provisions for both the performing and non-performing segments of the consumer banking portfolio. Provisions reflect losses which have been incurred at the balance sheet date, based on objective evidence. For currently performing loans, the provision reflects the Group’s assessment of losses arising from impairment events that have occurred but which have not been specifically identified at the reporting date. Consumer banking by payment due status 2016
Overdrawn current
accounts
Personal loans
Credit cards
Total
£m £m £m £m %Performing:
Neither past due nor impaired 206 1,742 1,576 3,524 91 Non-performing:
Past due up to 3 months 16 42 27 85 Impaired: Past due 3 to 6 months 4 11 11 26Past due 6 to 12 months 3 11 3 17Past due over 12 months 4 16 - 20
27 80 41 148 4 Charged off (note i) 14 79 104 197 5Total non-performing 41 159 145 345 Total consumer banking lending 247 1,901 1,721 3,869 100 Non-performing loans as % of total (excluding charged off balances) 11% 4% 2% 4% Impairment provisions excluding charged off balances 13 46 38 97Impairment provisions on charged off balances 12 75 97 184Total impairment provisions 25 121 135 281 Provision coverage ratio on total non-performing loans (excluding charged off balances) 48% 58% 93% 66%Provision coverage ratio on total non-performing loans (including charged off balances) 61% 76% 93% 81%Impairment provisions as % of total consumer banking lending 10% 6% 8% 7%

Nationwide Building Society – Preliminary Results Announcement
Page 42 of 108
Consumer banking (continued) Consumer banking by payment due status 2015 Overdrawn
current accounts
Personal loans
Credit cards
Total
£m £m £m £m %Performing: Neither past due nor impaired 198 1,646 1,623 3,467 91 Non-performing: Past due up to 3 months 16 53 30 99Impaired: Past due 3 to 6 months 4 14 12 30Past due 6 to 12 months 4 18 3 25Past due over 12 months 3 14 - 17 27 99 45 171 5 Charged off (note i) 23 54 76 153 4Total non-performing 50 153 121 324 Total consumer banking lending 248 1,799 1,744 3,791 100 Non-performing loans as % of total (excluding charged off balances) 11% 6% 3% 5% Impairment provisions excluding charged off balances 11 37 29 77Impairment provisions on charged off balances 20 50 69 139Total impairment provisions 31 87 98 216 Provision coverage ratio on total non-performing loans (excluding charged off balances) 41% 37% 64% 45%Provision coverage ratio on total non-performing loans (including charged off balances) 62% 57% 81% 67%Impairment provisions as % of total consumer banking lending 13% 5% 6% 6% Note: i. Charged off balances relate to accounts which are closed to future transactions and are held on the balance sheet for an extended
period (up to 36 months, depending on the product) whilst recovery procedures take place. Total non-performing balances excluding charged off balances have decreased to £148 million (2015: £171 million). This is largely due to improved quality across the current account and personal loan portfolios following the implementation of enhanced pricing and risk policies, together with a favourable economy. Whilst metrics indicating the quality of the Group’s consumer banking portfolio have improved, a review of the credit risk impairment assumptions was undertaken during the year, with particular focus on up to date accounts. This has led to an increase in provision of £29 million as a consequence of changes to model assumptions. Total balances in charge off and the provisions held against these balances continue to grow across the personal loan and credit card portfolios. This is in line with expectations following the change, during 2014, to hold balances on the balance sheet for an extended period of up to 36 months, whilst recovery activity is completed. It is expected that charged off balances and associated provisions will reduce in the next financial year as accounts which have met the 36 month threshold are written off.

Nationwide Building Society – Preliminary Results Announcement
Page 43 of 108
Consumer banking (continued) Charged off balances for current account overdrafts have fallen to £14 million (2015: £23 million). This is due to a higher value of accounts being written off, having reached the 24 month threshold during the year, than new accounts entering charge off. Impairment losses Impairment losses for the period Overdrawn
current accounts
Personal loans
Credit cards
Total
£m £m £m £mYear to 4 April 2016 14 38 44 96Year to 4 April 2015 16 34 39 89 The provision charge is £7 million higher than the previous year, reflecting the impact of the assumption changes referred to above.
Renegotiated loans The Group’s approach is to reduce lending risk through good lending decisions. Where it is considered likely that a customer may face financial difficulty the Group seeks to find a solution to support the customer and to mitigate losses, including proactive management of exposure, forbearance or arrears management. The balances at the balance sheet date which have been subject to a change in terms, forbearance or repair at any point since March 2010 are summarised in the table below. It is possible for borrowers to have more than one type of renegotiation and in this instance they are shown in both categories and multiple events are eliminated. Balances subject to renegotiation since March 2010 (note i)
Overdrawn current
accounts
Personalloans
Credit cards
Total
2016 £m £m £m £mChange in terms 29 126 8 163Forbearance 16 30 23 69Repair 21 1 19 41Gross total 66 157 50 273Elimination of multiple events (32) (19) (8) (59)Total 34 138 42 214 Of which loans still on renegotiated terms 21 95 17 133 Balances subject to renegotiation since March 2010 (note i)
Overdrawn current
accounts
Personalloans
Credit cards
(note ii)
Total
2015 £m £m £m £mChange in terms 31 131 11 173Forbearance 15 27 24 66Repair 18 1 20 39Gross total 64 159 55 278Elimination of multiple events (30) (18) (10) (58)Total 34 141 45 220 Of which loans still on renegotiated terms 21 106 22 149 Notes: i. Renegotiated balances information for consumer banking is reported since March 2010, reflecting the point in time from which this
data was captured for reporting purposes. ii. Amounts have been restated following a review of the balances reported for credit cards. The previously reported total of £87 million
was found to have included accounts which had been written-off.

Nationwide Building Society – Preliminary Results Announcement
Page 44 of 108
Commercial lending
Summary The Group has continued its strategy of developing a diverse commercial real estate portfolio by selectively entering into new lending, whilst reducing exposures which are outside of its current risk appetite or do not align to its existing lending strategy. The Group’s commercial loan portfolio comprises the following: Commercial lending balances
2016 2015 £m % £m %
Commercial real estate (CRE) 3,009 25 4,043 31Registered social landlords (note i) 7,625 65 7,786 59Project Finance (note ii) 1,197 10 1,383 10Total commercial lending 11,831 100 13,212 100Fair value adjustment for micro hedged risk 1,366 1,382 Total 13,197 14,594 Notes: i. Loans to registered social landlords are secured on residential property. ii. Loans advanced in relation to Project Finance are secured on cash flows from government or local authority backed contracts. CRE loans have reduced, net of new lending, by £1,034 million to £3,009 million (2015: £4,043 million). This reduction, which includes managed exit activity, scheduled repayments and redemptions, has resulted in an increase in the percentage of commercial lending represented by the registered social landlord and Project Finance portfolios to 75% (2015: 69%). Over the year the commercial property market has remained buoyant with investor confidence holding up well, supported by the availability of lending for commercial real estate. Non-performing loans have reduced to £226 million (2015: £685 million), non-performing loans over 100% LTV have reduced to £126 million (2015: £506 million) and impaired negative equity has fallen to £38 million (2015: £241 million). These improvements result from both previous deleveraging activity and the improvement in market conditions. The registered social landlord portfolio, which represents 65% (2015: 59%) of total commercial lending balances, is fully performing and remains stable, reflecting its long term, low risk nature. The portfolio is risk rated using the Group’s internal rating models with the major drivers being financial strength, independent viability assessment ratings provided by the Homes and Communities Agency and the type and size of the registered social landlord. The distribution of exposures is weighted more towards the stronger risk ratings and, against a backdrop of a long history of zero defaults, the risk profile of the portfolio has remained low even through the recent economic downturn. There have been no losses incurred on either the registered social landlord or Project Finance portfolios, no amounts are in arrears and there are no instances of forbearance. The remaining core CRE portfolio is well spread across geographic locations and property sectors and is of robust credit quality. Over the period since 2012 the Group has concluded its deleveraging of non-core CRE assets and given the small residual non-core balances, no longer separates the management of its non-core and core businesses.

Nationwide Building Society – Preliminary Results Announcement
Page 45 of 108
Commercial lending (continued)
Lending risk Lending risk in the commercial loan portfolio is linked to delinquency and the availability of collateral to cover any loan balances. The Group adopts robust credit management policies and processes designed to recognise and manage the risks arising, or likely to arise, from the portfolio. Loan to Value The following table shows the CRE portfolio split by LTV and region: CRE lending balances by LTV and region
London South East
Rest of UK
(note i)
Non-UK Total
2016 £m £m £m £m £m %Performing loans Fully collateralised LTV ratio (note ii): Less than 25% 136 24 60 - 22025% to 50% 1,021 219 419 - 1,65951% to 75% 329 111 390 - 83076% to 90% 3 13 46 - 6291% to 100% 1 - 5 - 6 1,490 367 920 - 2,777 92 Not fully collateralised - Over 100% LTV (A) - 3 3 - 6 -- Collateral value on A - 2 2 - 4- Negative equity on A - 1 1 - 2 Total performing loans 1,490 370 923 - 2,783 92 Non-performing loans Fully collateralised LTV ratio (note iii): Less than 25% 17 - 2 - 1925% to 50% 10 9 5 - 2451% to 75% 8 5 17 - 3076% to 90% 3 - 18 - 2191% to 100% - - 6 - 6 38 14 48 - 100 4 Not fully collateralised - Over 100% LTV (B) 7 52 67 - 126 4- Collateral value on A 5 36 47 - 88- Negative equity on A 2 16 20 - 38 Total non-performing loans 45 66 115 - 226 8 Total CRE loans 1,535 436 1,038 - 3,009 100 Geographical concentration 51% 14% 35% - 100%

Nationwide Building Society – Preliminary Results Announcement
Page 46 of 108
Commercial lending (continued) CRE lending balances by LTV and region
London South East
Rest of UK
(note i)
Non-UK Total
2015 £m £m £m £m £m %Performing loans Fully collateralised LTV ratio (note ii) Less than 25% 255 19 47 - 32125% to 50% 877 189 351 - 1,41751% to 75% 510 249 449 - 1,20876% to 90% 117 25 220 - 36291% to 100% - 6 17 - 23 1,759 488 1,084 - 3,331 82 Not fully collateralised - Over 100% LTV (A) 2 - 25 - 27 1- Collateral value on A 1 - 24 - 25- Negative equity on A 1 - 1 - 2 Total performing loans 1,761 488 1,109 - 3,358 83 Non-performing loans (note iii) Fully collateralised LTV ratio: Less than 25% - - 1 - 125% to 50% 18 14 20 - 5251% to 75% 14 16 15 - 4576% to 90% 5 6 39 - 5091% to 100% 3 2 26 - 31 40 38 101 - 179 4 Not fully collateralised - Over 100% LTV (B) 3 140 354 9 506 13- Collateral value on B 2 92 162 9 265- Negative equity on B 1 48 192 - 241 Total non-performing loans 43 178 455 9 685 17 Total CRE loans 1,804 666 1,564 9 4,043 100 Geographical concentration 45% 16% 39% - 100% Notes: i. Includes lending to borrowers in the Channel Islands. ii. The LTV ratio is calculated using the on-balance sheet carrying amount of the loan divided by the indexed value of the most recent
independent external collateral valuation. The Investment Property Databank (IPD) monthly index is used. iii. Non-performing loans include impaired loans and loans with arrears of less than three months which are not impaired. There have been no significant changes to geographic concentrations in the book and overall credit quality has improved over the year. In particular, non-performing loans have reduced and now represent 8% of CRE balances (2015: 17%), whilst both the proportion of partially collateralised non-performing loans and the shortfall on collateral for non-performing loans have also reduced. These improvements reflect the impact of improving book performance and previous deleveraging activity to reduce exposure to assets that are outside of the Group’s current risk appetite or do not align to the Group’s current lending strategy.

Nationwide Building Society – Preliminary Results Announcement
Page 47 of 108
Commercial lending (continued) Registered social landlords The registered social landlord portfolio is secured against portfolios of residential real estate owned and let by UK housing associations. Collateral is typically re-valued at least every five years based on standard social housing methodologies, which generally assume that the properties continue to be let. If the valuation were based upon normal residential use the valuation would be considerably higher. In all cases, registered social landlord collateral is in excess of the loan balance. Project Finance The Project Finance portfolio is secured against contractual cash flows from projects procured under the UK Private Finance Initiative rather than physical assets. The majority of loans are secured on projects which are now operational and benefiting from secure long term cash flows, with only one case remaining in the construction phase. Credit risk concentrations The following table provides details of the Group’s sectoral and regional CRE concentrations together with an impairment analysis in respect of these concentrations: CRE lending balances and impairment provisions by type and region
London South East Rest of UK
(note i)
Non-UK Total
2016 £m £m £m £m £mRetail 459 235 317 - 1,011Office 201 69 208 - 478Residential 666 71 256 - 993Industrial and warehouse 29 36 158 - 223Leisure and hotel 88 25 87 - 200Other 92 - 12 - 104Total CRE lending 1,535 436 1,038 - 3,009 Impairment provision: Retail 2 12 8 - 22Office 4 1 3 - 8Residential 1 - 5 - 6Industrial and warehouse - - 12 - 12Leisure and hotel 1 - 7 - 8Other - - 3 - 3Total impairment provisions 8 13 38 - 59

Nationwide Building Society – Preliminary Results Announcement
Page 48 of 108
Commercial lending (continued) CRE lending balances and impairment provisions by type and region
London South East Rest of UK (note i)
Non-UK Total
2015 £m £m £m £m £mRetail 596 376 422 9 1,403Office 223 105 339 - 667Residential 613 103 309 - 1,025Industrial and warehouse 55 46 331 - 432Leisure and hotel 185 34 151 - 370Other 132 2 12 - 146Total CRE lending 1,804 666 1,564 9 4,043 Impairment provision: Retail 2 41 39 4 86Office 2 18 64 - 84Residential 1 2 25 - 28Industrial and warehouse - 1 84 - 85Leisure and hotel 1 1 36 - 38Other - - 1 - 1Total impairment provisions 6 63 249 4 322 Note: i. Includes lending to borrowers based in the Channel Islands. Notwithstanding the reduction in CRE lending, the Commercial lending exposure remains well spread across sectors, and geographic regions. Arrears and impairment The Group holds impairment provisions in relation to both the performing and non-performing segments of the commercial lending portfolio. Provisions reflect losses which have been incurred at the balance sheet date, based on objective evidence. Individual impairment provisions are assigned to facilities exhibiting signs of financial difficulty and a collective provision is assigned to all other accounts. For currently performing loans, the collective provision reflects losses arising from impairment events that have occurred within the portfolio but are not identifiable at the reporting date. No losses have been experienced on the registered social landlord or Project Finance portfolios and there is no non-performance within these portfolios. As a result, impairment provisions are only needed against the CRE portfolio.
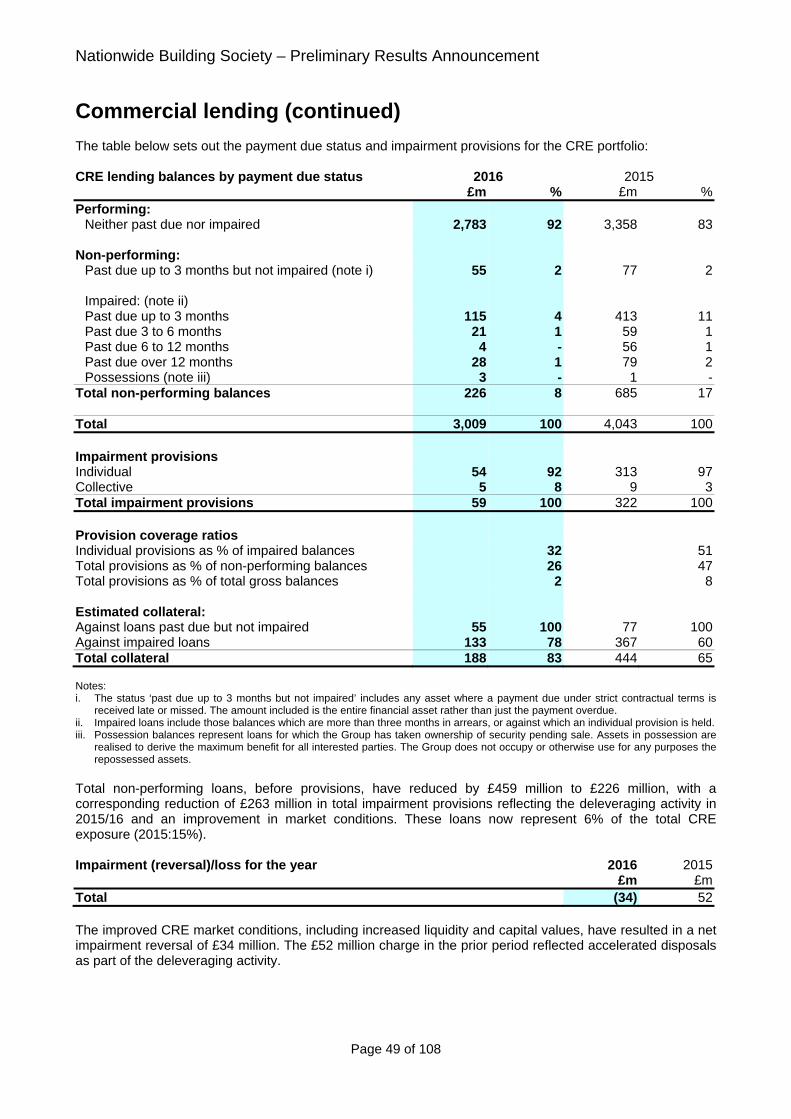
Nationwide Building Society – Preliminary Results Announcement
Page 49 of 108
Commercial lending (continued) The table below sets out the payment due status and impairment provisions for the CRE portfolio: CRE lending balances by payment due status
2016 2015 £m % £m %
Performing: Neither past due nor impaired 2,783 92 3,358 83
Non-performing:
Past due up to 3 months but not impaired (note i) 55 2 77 2 Impaired: (note ii) Past due up to 3 months 115 4 413 11Past due 3 to 6 months 21 1 59 1Past due 6 to 12 months 4 - 56 1Past due over 12 months 28 1 79 2Possessions (note iii) 3 - 1 -
Total non-performing balances 226 8 685 17 Total 3,009 100 4,043 100 Impairment provisions Individual 54 92 313 97Collective 5 8 9 3Total impairment provisions 59 100 322 100 Provision coverage ratios Individual provisions as % of impaired balances 32 51Total provisions as % of non-performing balances 26 47Total provisions as % of total gross balances 2 8 Estimated collateral: Against loans past due but not impaired 55 100 77 100Against impaired loans 133 78 367 60Total collateral 188 83 444 65 Notes: i. The status ‘past due up to 3 months but not impaired’ includes any asset where a payment due under strict contractual terms is
received late or missed. The amount included is the entire financial asset rather than just the payment overdue. ii. Impaired loans include those balances which are more than three months in arrears, or against which an individual provision is held. iii. Possession balances represent loans for which the Group has taken ownership of security pending sale. Assets in possession are
realised to derive the maximum benefit for all interested parties. The Group does not occupy or otherwise use for any purposes the repossessed assets.
Total non-performing loans, before provisions, have reduced by £459 million to £226 million, with a corresponding reduction of £263 million in total impairment provisions reflecting the deleveraging activity in 2015/16 and an improvement in market conditions. These loans now represent 6% of the total CRE exposure (2015:15%). Impairment (reversal)/loss for the year
2016 2015£m £m
Total (34) 52 The improved CRE market conditions, including increased liquidity and capital values, have resulted in a net impairment reversal of £34 million. The £52 million charge in the prior period reflected accelerated disposals as part of the deleveraging activity.

Nationwide Building Society – Preliminary Results Announcement
Page 50 of 108
Commercial lending (continued) Negative equity loans The level of negative equity based upon indexed property values for the non-performing and impaired assets is detailed below: Negative equity on CRE lending 2016 2015 £m £mPast due but not impaired - -Impaired 38 240Possessions - 1Total 38 241 The reduction in impaired negative equity reflects the improving book performance, previous deleveraging activity and positive economic environment where commercial properties have increased in value.
Forbearance Forbearance occurs when concessions are made, on the contractual terms of a loan, when the borrower is facing or about to face difficulties in meeting its financial commitments. Exposures are only removed from being in forbearance when specified conditions have been met including:
a minimum 2 year probation period has passed from the date the forborne exposure was classified as performing;
at least 1 years repayments of capital or interest have been made; none of the exposures to the borrower are more than 30 days past-due.
The table below provides details of the CRE lending that is currently subject to forbearance, split by the concession events agreed: Lending subject to forbearance 2016 2015
£m % £m %Covenant breach 54 9 180 18Extension at maturity 42 7 87 9Multiple forbearance events 484 82 639 63Other 8 2 106 10Total 588 100 1,012 100 There are no instances of forbearance in either the registered social landlord or Project Finance portfolios. CRE exposures currently subject to forbearance have decreased to £588 million, principally as a result of the controlled exit from non-core, higher risk loans, and now represent 20% of CRE loan balances (2015: 25%).

Nationwide Building Society – Preliminary Results Announcement
Page 51 of 108
Treasury assets
Summary The Group’s treasury portfolio is held primarily for liquidity management purposes and, in the case of derivatives, for market risk management. As at 4 April 2016 treasury assets represent 12.9% (2015: 11.3%) of the Group’s total assets. Treasury asset balances 2016 2015 £m £mCash 8,797 4,325Loans and advances to banks 3,591 3,392Investment securities 10,738 11,063Treasury liquidity and investment portfolio 23,126 18,780Derivative assets 3,898 3,337Total treasury portfolio 27,024 22,117 Note: Derivatives are classified as assets where their fair value is positive and liabilities where their fair value is negative. At 4 April 2016, the Group had derivative liabilities of £3,463 million (2015: £4,048 million). Investment activity is restricted to high quality primary liquidity securities comprising central bank reserves and highly rated debt securities issued by a limited range of governments, central banks and multilateral development banks. A secondary portfolio is also held offering access to central bank funding operations and a second tier of liquidity. The total balance of out of policy legacy assets (investment securities acquired prior to the financial crisis and no longer approved within the Group’s risk appetite) has reduced from £640 million to £423 million during the year through ongoing sales, maturities and amortisation. An £8 million reversal of impairment (2015: £18 million charge) has been recognised in the income statement from legacy asset disposals. Although the out of policy portfolio risk profile has improved, opportunities to exit positions continue to be assessed against prevailing market conditions and the financial implications for the Group. As part of the Group’s risk management, derivatives are used to reduce exposure to market risks; the Group does not use any derivatives for trading or speculative purposes. The Group has no exposure to emerging markets, hedge funds or credit default swaps.
Managing treasury credit risks Liquidity and investment portfolio The Group’s liquidity and investment portfolio held on the balance sheet at 4 April 2016 of £23,126 million (2015: £18,780 million) is held in three separate portfolios: primary liquidity, other central bank eligible assets and other securities. The size of the portfolio has increased, predominantly via higher cash balances held as a strategic response to potential market volatility in the run up to the EU referendum in June 2016. Primary liquidity comprises cash held at central banks and highly rated debt securities issued by governments or multi-lateral development banks. The remaining two portfolios comprise available for sale investment securities, with movements reflecting legacy asset disposals, market prices and the Group’s operational and strategic liquidity requirements.
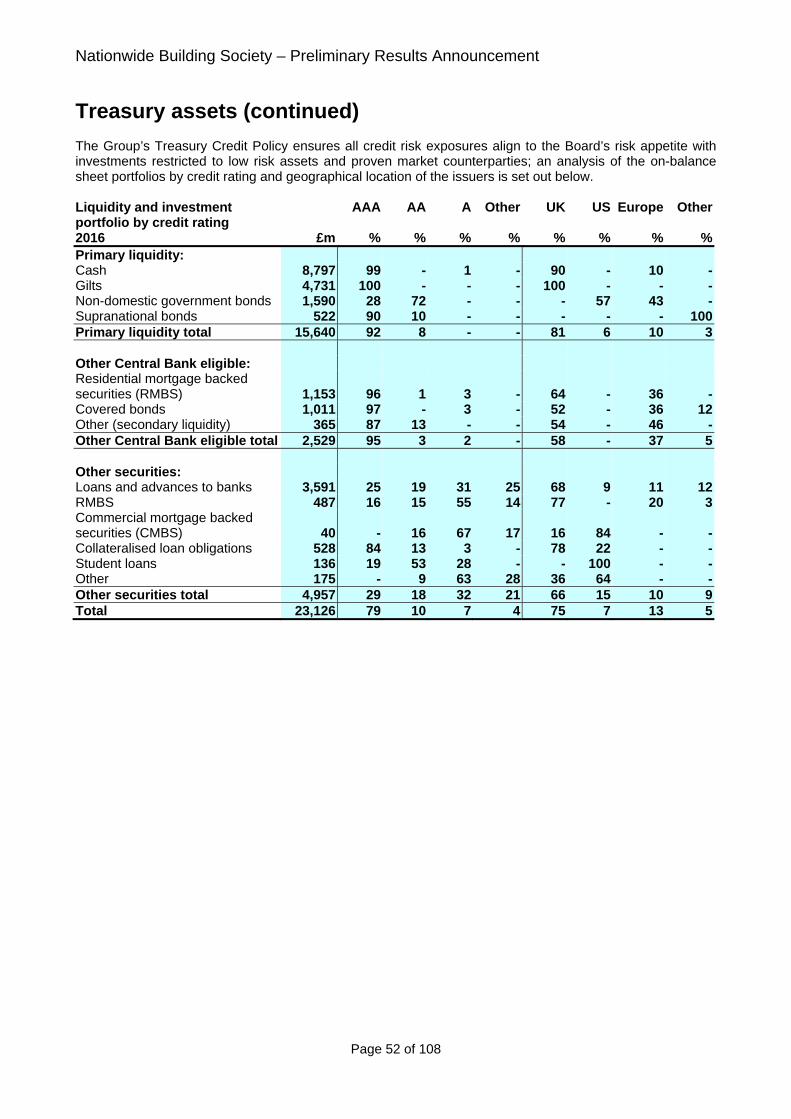
Nationwide Building Society – Preliminary Results Announcement
Page 52 of 108
Treasury assets (continued) The Group’s Treasury Credit Policy ensures all credit risk exposures align to the Board’s risk appetite with investments restricted to low risk assets and proven market counterparties; an analysis of the on-balance sheet portfolios by credit rating and geographical location of the issuers is set out below. Liquidity and investment portfolio by credit rating
AAA AA A Other UK US Europe Other
2016 £m % % % % % % % %Primary liquidity: Cash 8,797 99 - 1 - 90 - 10 -Gilts 4,731 100 - - - 100 - - -Non-domestic government bonds 1,590 28 72 - - - 57 43 -Supranational bonds 522 90 10 - - - - - 100Primary liquidity total 15,640 92 8 - - 81 6 10 3 Other Central Bank eligible: Residential mortgage backed securities (RMBS) 1,153 96 1 3 - 64 - 36 -Covered bonds 1,011 97 - 3 - 52 - 36 12Other (secondary liquidity) 365 87 13 - - 54 - 46 -Other Central Bank eligible total 2,529 95 3 2 - 58 - 37 5 Other securities: Loans and advances to banks 3,591 25 19 31 25 68 9 11 12RMBS 487 16 15 55 14 77 - 20 3Commercial mortgage backed securities (CMBS) 40 - 16 67 17 16 84 - -Collateralised loan obligations 528 84 13 3 - 78 22 - -Student loans 136 19 53 28 - - 100 - -Other 175 - 9 63 28 36 64 - -Other securities total 4,957 29 18 32 21 66 15 10 9Total 23,126 79 10 7 4 75 7 13 5

Nationwide Building Society – Preliminary Results Announcement
Page 53 of 108
Treasury assets (continued) Liquidity and investment portfolio by credit rating
AAA AA A Other UK US Europe Other
2015 £m % % % % % % % %Primary liquidity: Cash 4,325 100 - - - 100 - - -Gilts 5,031 100 - - - 100 - - -Non-domestic government bonds 1,200 21 79 - - - 25 75 -Supranational bonds 495 90 10 - - - - - 100Primary liquidity total 11,051 91 9 - - 85 3 8 4 Other Central Bank eligible: Residential mortgage backed securities (RMBS) 1,189 82 12 6 - 38 - 62 -Covered bonds 993 96 - - 4 44 - 48 8Other (secondary liquidity) 239 90 - - 10 35 - 65 -Other Central Bank eligible total 2,421 88 6 3 3 40 - 57 3 Other securities: Loans and advances to banks 3,392 10 30 60 - 49 16 15 20RMBS 876 35 7 53 5 86 - 11 3Commercial mortgage backed securities (CMBS) 60 - 19 70 11 15 78 7 -Collateralised loan obligations 556 75 21 4 - 59 41 - -Covered bonds 40 100 - - - 100 - - -Student loans 163 - 64 36 - - 100 - -Other 221 42 25 13 20 40 13 47 -Other securities total 5,308 22 26 50 2 55 19 13 13Total 18,780 71 13 15 1 70 7 16 7 Note: Ratings used are obtained from Standard & Poor’s in the majority of cases, from Moody’s if there is no Standard & Poor’s rating available, and internal ratings are used if neither is available. The above analysis does not include off balance sheet funding, including £8.5 billion (2015: £8.5 billion) of primary liquidity representing short dated UK Treasury bills held as a result of FLS drawings. These are included in the analysis of funding in the ‘Financial Risk’ section of this report. Credit quality has improved with 79% of investments rated at AAA (2015: 71%). Primary liquidity exposure makes up 68% of the total portfolio (2015: 59%). Collateral held as security for treasury assets is determined by the nature of the instrument. Treasury liquidity portfolio assets are generally unsecured with the exception of reverse repos, asset backed securities and similar instruments, which are secured by pools of financial assets. Within loans and advances to banks is a reverse repo of £0.1 billion (2015: £0.1 billion) which is secured by gilts. Available for sale reserve Out of a total of £23,126 million (2015: £18,780 million) on balance sheet treasury liquidity and investment portfolio, £10,738 million (2015: £11,063 million) is held as available for sale (AFS). Under IFRS, AFS assets are marked to market through other comprehensive income and fair value movements are accumulated in reserves. Of the £10,738 million of AFS assets, £125 million (2015: £12 million) are classified as Level 3 (valuation not based on observable market data) for the purposes of IFRS 13. This increase is primarily caused by an £81 million gain connected with the impending disposal of the Society’s investment in Visa Europe, further details of which can be found in note 21 to the preliminary results announcement. Details of fair value movements can be found in notes 12 and 13 to the preliminary results announcement.

Nationwide Building Society – Preliminary Results Announcement
Page 54 of 108
Treasury assets (continued) The table below shows the fair value carrying amount and AFS reserve for the treasury liquidity and investment portfolio. Fair value of treasury assets and AFS reserve 2016 2015
Fair value on balance sheet
CumulativeAFS reserve
Fair value on balance sheet
CumulativeAFS reserve
£m £m £m £mCash 8,797 (note i) 4,325 (note i)Gilts 4,731 (374) 5,031 (468)Non-domestic government bonds 1,590 (48) 1,200 (91)Supranational bonds 522 (3) 495 (6)Primary liquidity portfolio total 15,640 (425) 11,051 (565) Residential mortgage backed securities (RMBS) 1,153 10 1,189 4Covered bonds 1,011 (15) 993 (21)Other investments 365 1 239 -Other central bank eligible liquidity portfolio total 2,529 (4) 2,421 (17) Loans and advances to banks 3,591 (note i) 3,392 (note i)RMBS 487 23 876 (2)Commercial mortgage backed securities (CMBS) 40 6 60 8Covered bonds - - 40 -Collateralised loan obligations (CLO) 528 5 556 1Student loans 136 11 163 7Other investments 175 (97) 221 (1)Other portfolio total 4,957 (52) 5,308 13Total treasury liquidity portfolio 23,126 (481) 18,780 (569) AFS reserve before hedge accounting and taxation (481) (569)Hedge accounting adjustment for interest rate risk 498 544 Taxation (9) (1)AFS reserve (net) 8 (26) Note: i. Not applicable for ‘Cash’ and ‘Loans and advances to banks’. As at 4 April 2016, the balance on the AFS reserve had moved to an £8 million loss, net of tax (2015: £26 million gain). The movements in the AFS reserve reflect general market movements and the disposal of legacy assets. The fair value movement of AFS assets that are not impaired has no effect on the Group’s profit.

Nationwide Building Society – Preliminary Results Announcement
Page 55 of 108
Treasury assets (continued) Country exposures The Group holds £162 million (2015: £315 million) of securities which are domiciled in the peripheral Eurozone countries; these are held outside of primary liquidity. Of the £162 million, 79% is rated single A or above (2015: 74%). This exposure has reduced by 49% in the year to 4 April 2016 due primarily to the disposal of legacy Spanish assets, maturities and fair value and exchange rate movements. The Group continues to actively manage these exposures which remain outside of current credit policy. The following table summarises the Group’s exposure to issuers in the peripheral Eurozone countries; the Group has no direct sovereign exposure to these countries. The exposures are shown at their balance sheet carrying values. Country exposures (peripheral Eurozone) Italy Portugal Spain Total2016 £m £m £m £mMortgage backed securities 21 22 85 128Covered bonds - - 31 31Other corporate 3 - - 3Total 24 22 116 162 Country exposures (peripheral Eurozone) Italy Portugal Spain Total2015 £m £m £m £mMortgage backed securities 45 32 206 283Covered bonds - - 29 29Other corporate 3 - - 3Total 48 32 235 315 None of the Group’s exposures to the peripheral Eurozone countries detailed in the table above are in default, and the Group has not incurred any impairment on these assets in the period. In addition to exposure to peripheral Eurozone countries, the Group’s total exposure in respect of the other Eurozone and rest of the world countries is shown below at the balance sheet carrying value. Country exposures (other than peripheral Eurozone)
Finland France Germany Netherlands USA Rest of world
Total
2016 £m £m £m £m £m £m £mGovernment bonds 242 - 365 82 902 - 1,591Mortgage backed securities - - - 385 35 17 437Covered bonds 23 52 - - - 383 458Senior debt - - - - - 522 522Loans to banks - 60 107 - 350 627 1,144Other corporate - 4 3 - - - 7Other assets - 66 102 - 365 - 533Total 265 182 577 467 1,652 1,549 4,692 Country exposures (other than peripheral Eurozone)
Finland France Germany Netherlands
USA Rest of world
Total
2015 £m £m £m £m £m £m £mGovernment bonds 231 - 253 411 305 - 1,200Mortgage backed securities - 4 - 551 49 27 631Covered bonds 21 125 37 27 - 315 525Senior debt - - - - - 495 495Loans to banks - 146 229 - 527 823 1,725Other corporate 2 7 5 3 - - 17Other assets - 88 169 - 420 - 677Total 254 370 693 992 1,301 1,660 5,270 Note: Rest of world exposure is to Australia, Canada, Denmark, Norway, Sweden and Switzerland.

Nationwide Building Society – Preliminary Results Announcement
Page 56 of 108
Treasury assets (continued) Derivative financial instruments The Group uses derivatives to reduce exposure to market risks, although the application of accounting rules can create volatility in the income statement in a particular financial year. The fair value of derivative assets at 4 April 2016 was £3.9 billion (2015: £3.3 billion) and the fair value of derivative liabilities was £3.5 billion (2015: £4.0 billion). The International Swaps and Derivatives Association (ISDA) Master Agreement is the Group’s preferred agreement for documenting derivative transactions. A Credit Support Annex (CSA) is always executed in conjunction with the ISDA Master Agreement. Under a CSA, collateral is passed between parties to mitigate the market contingent counterparty risk inherent in the outstanding positions. The Group’s CSAs are two-way agreements where both parties post collateral dependent on the exposure of the derivative. Collateral is paid or received on a regular basis (typically daily) to mitigate the mark to market exposures on derivatives. The Group’s CSA legal documentation for derivative transactions grants legal rights of set off for transactions with the same overall counterparty. Accordingly, the credit risk associated with such positions is reduced to the extent that negative mark to market values offset positive mark to market values in the calculation of credit risk within each netting agreement. As a result of CSA netting arrangements, outstanding transactions with the same counterparty can be offset and settled net following a default or other predetermined event. Under CSA arrangements netting benefits of £2.0 billion (2015: £1.9 billion) are available and £1.8 billion of collateral is held (2015: £1.3 billion) is available; cash is the only collateral held. The following table shows the exposure to counterparty credit risk for derivative contracts after netting benefits and collateral: Derivative credit exposure 2016 2015 Counterparty credit quality AA A Total AA A Total £bn £bn £bn £bn £bn £bnGross positive fair value of contracts 1.1 2.8 3.9 0.4 2.9 3.3Netting benefits (0.5) (1.5) (2.0) (0.3) (1.6) (1.9)Net current credit exposure 0.6 1.3 1.9 0.1 1.3 1.4Collateral held (0.6) (1.2) (1.8) (0.1) (1.2) (1.3)Net derivative credit exposure - 0.1 0.1 - 0.1 0.1

Nationwide Building Society – Preliminary Results Announcement
Page 57 of 108
Financial risk The Group is exposed to financial risks as follows: Risk category Definition Liquidity and funding
Liquidity risk is the risk that the Group is unable to meet its liabilities as they fall due and maintain member and stakeholder confidence. Funding risk is the risk that the Group is unable to maintain diverse funding sources in wholesale and retail markets and manage retail funding risk that can arise from excessive concentrations of higher risk deposits.
Solvency The risk that the Group fails to maintain sufficient capital to absorb losses throughout a full economic cycle and sufficient to maintain the confidence of current and prospective investors, the Board and regulators.
Market The risk that the net value of, or net income arising from, the Group’s assets and liabilities is impacted as a result of market price or rate changes.
Pension The risk that the value of the Fund’s assets will be insufficient to meet the estimated liabilities of the Fund. Pension risk can adversely impact the Group’s capital position and/or result in increased cash funding obligations to the Fund.
Earnings The risk that a source of income or value is unable to continue to add the expected value, due to changes in market, regulatory or other environmental factors.
Financial risk is managed within a framework of approved assets, currencies and capital instruments supported by detailed limits set by either the Board or the Assets and Liabilities Committee (ALCO) under its delegated mandate. The Board retains responsibility for approval of derivative classes that may be used for market risk management purposes, restrictions over the use of such derivative classes (within the limitations imposed under the Building Societies Act, Section 9A) and for asset classes that may be classified as liquidity.

Nationwide Building Society – Preliminary Results Announcement
Page 58 of 108
Liquidity and funding risk
Summary The Group’s liquidity and funding levels continue to be within Board risk appetite and regulatory requirements. The Group monitors its position relative to internal risk appetite and the regulatory short term liquidity stress metric, the Liquidity Coverage Ratio (LCR), which was implemented on 1 October 2015. The Group’s LCR at 4 April 2016 was 142.6% (2015: 119.3%), which reflects the Group’s strategy of maintaining a LCR of at least 100% and represents a surplus to the UK regulatory minimum requirement of 80%, rising to 100% by January 2018. The Group also monitors its position against the longer-term funding metric, the Net Stable Funding Ratio (NSFR), which is due to become a regulatory standard in January 2018. Based on current interpretations of regulatory requirements and guidance, the Group’s NSFR at 4 April 2016 was 127.9% (2015: 121.9%) which exceeds the expected 100% minimum future requirement. The Group monitors liquidity and funding risks on an ongoing basis. This includes the current geopolitical uncertainty, such as a sustained economic slowdown in China and the Eurozone and the forthcoming EU referendum, which could have an impact on funding markets. The Bank of England has recently consulted on the UK framework for banks and building societies to hold a minimum level of liabilities which can be bailed-in to recapitalise it in the event of failure, known as the minimum requirement for own funds and eligible liabilities (MREL). The Group is confident that it will be able to meet the full requirements when implemented in 2020. Overall, the Group’s stable and diverse funding base and sufficient holdings of high-quality liquid assets combine to ensure that there is no significant risk that liabilities cannot be met as they fall due.
Funding risk Funding strategy The Group’s strategy is to remain predominantly retail funded; retail customer loans and advances are therefore largely funded by customer deposits. Non-retail lending, including treasury assets and commercial customer loans, are largely funded by wholesale debt, as set out below. Funding profile Assets 2016
£bn2015
£bnLiabilities 2016
£bn2015
£bnRetail mortgages 162.1 152.8 Retail funding 144.9 138.5Treasury assets (including liquidity portfolio) 23.1 18.8 Wholesale funding 45.8 39.2Other retail lending 3.6 3.6 Capital and reserves 13.2 12.3Commercial/Other lending 13.1 14.2 Other liabilities 5.0 5.6Other assets 7.0 6.2 208.9 195.6 208.9 195.6 The Group’s loan to deposit ratio at 4 April 2016 was 117.2% (2015: 115.6%).

Nationwide Building Society – Preliminary Results Announcement
Page 59 of 108
Liquidity and funding risk (continued) Wholesale funding On-balance sheet wholesale funding has increased by £6.6 billion to £45.8 billion, as set out in the table below. This reflects the ongoing management of the Group’s liquidity and an element of pre-funding of wholesale and Bank of England Funding for Lending Scheme (FLS) maturities to de-risk our funding plans ahead of the EU referendum in June 2016. The wholesale funding portfolio is made up of a range of unsecured and secured instruments to ensure the Group has a diversified funding base across a range of currencies, maturities and investor types. Wholesale funding sources 2016 2015 £bn % £bn %Deposits, including PEB balances 9.7 21.2 11.0 28.1Certificates of deposit 5.1 11.2 3.1 7.9Commercial paper 1.3 2.8 2.4 6.1Covered bonds 13.8 30.1 11.3 28.8Medium term notes 9.9 21.6 5.2 13.3Securitisations 4.7 10.3 4.8 12.2Other 1.3 2.8 1.4 3.6Total 45.8 100.0 39.2 100.0 At 4 April 2016 ‘Deposits, including PEB balances’ comprised deposits of £3.6 billion (2015: £4.5 billion), PEBS of £1.9 billion (2015: £3.3 billion), business savings of £2.4 billion (2015: £1.3 billion) and other deposits of £1.8 billion (2015: £1.9 billion). The table below sets out an analysis by currency of the Group’s wholesale funding. Wholesale funding currency
2016 2015 GBP EUR USD Other Total GBP EUR USD Other Total
£bn £bn £bn £bn £bn £bn £bn £bn £bn £bnDeposits, including PEB balances 9.0 0.5 0.2 - 9.7 10.1 0.6 0.3 - 11.0Certificates of deposit 4.7 - 0.4 - 5.1 2.9 0.1 0.1 - 3.1Commercial paper 0.2 - 1.1 - 1.3 0.1 0.6 1.7 - 2.4Covered bonds 2.5 11.1 - 0.2 13.8 1.8 9.4 - 0.1 11.3Medium term notes 2.3 4.8 2.2 0.6 9.9 1.2 2.4 1.4 0.2 5.2Securitisations 1.9 1.2 1.6 - 4.7 1.7 1.3 1.8 - 4.8Other 0.2 1.0 0.1 - 1.3 0.3 1.0 0.1 - 1.4Total 20.8 18.6 5.6 0.8 45.8 18.1 15.4 5.4 0.3 39.2 To mitigate cross-currency refinancing risk, the Group ensures it holds liquidity in each currency to cover at least the next ten business days of wholesale funding maturities.
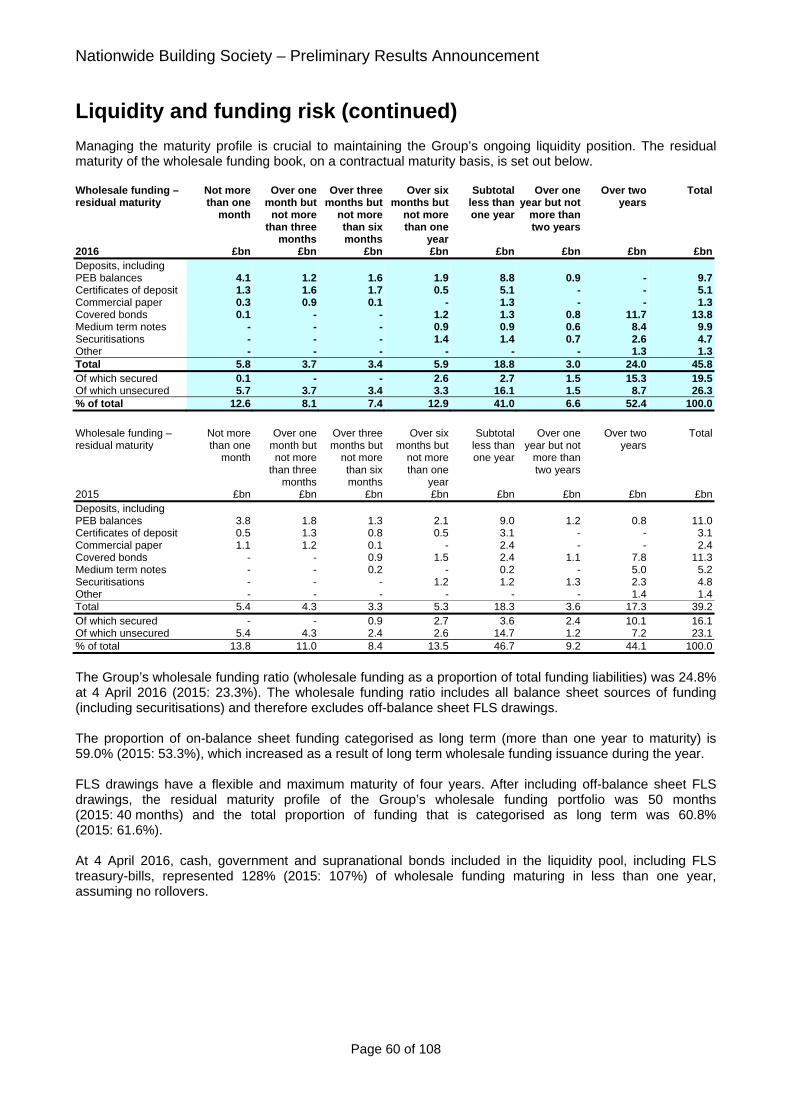
Nationwide Building Society – Preliminary Results Announcement
Page 60 of 108
Liquidity and funding risk (continued) Managing the maturity profile is crucial to maintaining the Group’s ongoing liquidity position. The residual maturity of the wholesale funding book, on a contractual maturity basis, is set out below. Wholesale funding – residual maturity
Not more than one
month
Over one month but
not more than three
months
Over three months but
not more than six months
Over six months but
not more than one
year
Subtotal less than one year
Over one year but not
more than two years
Over two years
Total
2016 £bn £bn £bn £bn £bn £bn £bn £bnDeposits, including PEB balances 4.1 1.2 1.6 1.9 8.8 0.9 - 9.7Certificates of deposit 1.3 1.6 1.7 0.5 5.1 - - 5.1Commercial paper 0.3 0.9 0.1 - 1.3 - - 1.3Covered bonds 0.1 - - 1.2 1.3 0.8 11.7 13.8Medium term notes - - - 0.9 0.9 0.6 8.4 9.9Securitisations - - - 1.4 1.4 0.7 2.6 4.7Other - - - - - - 1.3 1.3Total 5.8 3.7 3.4 5.9 18.8 3.0 24.0 45.8Of which secured 0.1 - - 2.6 2.7 1.5 15.3 19.5Of which unsecured 5.7 3.7 3.4 3.3 16.1 1.5 8.7 26.3% of total 12.6 8.1 7.4 12.9 41.0 6.6 52.4 100.0
Wholesale funding – residual maturity
Not more than one
month
Over one month but not more
than three months
Over three months but
not more than six months
Over six months but
not more than one
year
Subtotalless than one year
Over one year but not
more than two years
Over two years
Total
2015 £bn £bn £bn £bn £bn £bn £bn £bnDeposits, including PEB balances 3.8 1.8 1.3 2.1 9.0 1.2 0.8 11.0Certificates of deposit 0.5 1.3 0.8 0.5 3.1 - - 3.1Commercial paper 1.1 1.2 0.1 - 2.4 - - 2.4Covered bonds - - 0.9 1.5 2.4 1.1 7.8 11.3Medium term notes - - 0.2 - 0.2 - 5.0 5.2Securitisations - - - 1.2 1.2 1.3 2.3 4.8Other - - - - - - 1.4 1.4Total 5.4 4.3 3.3 5.3 18.3 3.6 17.3 39.2Of which secured - - 0.9 2.7 3.6 2.4 10.1 16.1Of which unsecured 5.4 4.3 2.4 2.6 14.7 1.2 7.2 23.1% of total 13.8 11.0 8.4 13.5 46.7 9.2 44.1 100.0
The Group’s wholesale funding ratio (wholesale funding as a proportion of total funding liabilities) was 24.8% at 4 April 2016 (2015: 23.3%). The wholesale funding ratio includes all balance sheet sources of funding (including securitisations) and therefore excludes off-balance sheet FLS drawings. The proportion of on-balance sheet funding categorised as long term (more than one year to maturity) is 59.0% (2015: 53.3%), which increased as a result of long term wholesale funding issuance during the year. FLS drawings have a flexible and maximum maturity of four years. After including off-balance sheet FLS drawings, the residual maturity profile of the Group’s wholesale funding portfolio was 50 months (2015: 40 months) and the total proportion of funding that is categorised as long term was 60.8% (2015: 61.6%). At 4 April 2016, cash, government and supranational bonds included in the liquidity pool, including FLS treasury-bills, represented 128% (2015: 107%) of wholesale funding maturing in less than one year, assuming no rollovers.

Nationwide Building Society – Preliminary Results Announcement
Page 61 of 108
Liquidity and funding risk (continued)
Liquidity risk Total liquidity The Group ensures it has sufficient resources to meet day-to-day cash flow needs and to meet internal and regulatory liquidity requirements which are calibrated to ensure the Group has sufficient liquidity, both in terms of amount and quality, in a range of stress scenarios and across multiple time horizons. The table below sets out the sterling equivalent fair value of the liquidity portfolio, categorised by issuing currency. It includes off-balance sheet liquidity (FLS treasury bills) and excludes encumbered assets. Liquid assets 2016 2015 GBP EUR USD Total GBP EUR USD Total £bn £bn £bn £bn £bn £bn £bn £bnCash and reserves at central banks 7.9 0.9 - 8.8 4.3 - - 4.3Government bonds 13.4 0.5 0.9 14.8 13.7 0.8 0.3 14.8Supranational bonds 0.4 - 0.1 0.5 0.4 - 0.1 0.5Other Central Bank eligible assets 1.4 1.0 0.1 2.5 0.7 1.5 0.1 2.3Other securities 0.4 0.6 0.3 1.3 1.5 0.6 0.5 2.6Total 23.5 3.0 1.4 27.9 20.6 2.9 1.0 24.5 The Group’s liquid assets are held and managed centrally by the Group’s Treasury Division. The Group maintains a high quality liquidity portfolio through continued investment in highly liquid assets, predominantly comprising:
reserves held at central banks, and highly rated debt securities issued by a restricted range of governments, central banks and
supranationals/multilateral development banks. Government bonds in the table above include £8.5 billion of off-balance sheet treasury bills held through FLS participation. The average combined month end balance of cash and reserves at central banks, government and supranational bonds during the year was £22.8 billion (2015: £22.0 billion). The Group also holds a portfolio of other central bank eligible covered bonds and asset backed securities that are eligible for use in the funding operations of those central banks that it has access to. In terms of their relative liquidity characteristics, these assets may be viewed as the second tier of liquidity after cash reserves and highly rated debt securities. Other securities, such as RMBS, are held that are not eligible for central bank operations but can be monetised through repurchase agreements with third parties or through sale. For contingent funding purposes, unencumbered mortgage assets are pre-positioned at the Bank of England and represent eligible collateral which can be used in the Bank of England’s liquidity operations if market liquidity is severely disrupted.

Nationwide Building Society – Preliminary Results Announcement
Page 62 of 108
Liquidity and funding risk (continued) Residual maturity of liquidity assets and liabilities The table below segments the carrying value of financial assets and financial liabilities into relevant maturity groupings based on the final contractual maturity date (residual maturity). In practice, customer behaviours mean that liabilities are often retained for longer than their contractual maturities and assets are repaid faster. This gives rise to funding gaps on the Group’s balance sheet. The balance sheet structure and risks are managed and monitored by ALCO. For forecasting purposes, the Group uses judgement and past behavioural performance of each asset and liability class to anticipate likely cash flow requirements of the Group. The analysis below excludes certain non-financial assets (including property, plant and equipment, intangible assets, investment property, other assets, deferred tax assets and accrued income and expenses prepaid) and non-financial liabilities (including provisions for liabilities and charges, accruals and deferred income, current tax liabilities, other liabilities and retirement benefit obligations). Residual maturity Due less
than one month
(note i)
Due between one and
three months
Due between
three and six
months
Due between
six and nine
months
Due between nine and
twelve months
Due between one and
two years
Due between two and
five years
Due after
more than five years
Total
2016 £m £m £m £m £m £m £m £m £mFinancial assets: Cash 8,797 - - - - - - - 8,797 Loans and advances to banks 3,179 87 - - - - - 325 3,591 Available for sale investment securities 6 15 14 1 178 352 3,680 6,366 10,612 Loans and advances to customers 2,825 1,256 1,929 1,810 1,823 7,124 20,237 141,803 178,807 Derivative financial instruments 25 151 128 102 30 227 994 2,241 3,898 Other financial assets 5 15 107 17 65 142 234 299 884 Total financial assets 14,837 1,524 2,178 1,930 2,096 7,845 25,145 151,034 206,589 Financial liabilities: Shares 103,296 1,632 5,875 4,608 5,122 10,731 6,251 1,200 138,715 Deposits from banks 1,658 184 168 41 19 - 25 - 2,095 Of which repo 122 - 5 - - - - - 127Other deposits 2,549 1,392 1,843 716 391 737 7 - 7,635 Due to customers 3,563 543 1,347 345 215 126 62 - 6,201 Secured funding – ABS and covered bonds 65 19 43 2,238 323 1,524 7,002 8,263 19,477 Senior unsecured funding 1,637 2,478 1,810 315 1,040 632 3,878 4,818 16,608 Derivative financial instruments 31 9 23 33 84 338 647 2,298 3,463 Other financial liabilities 2 2 1 1 (1) - 8 - 13 Subordinated liabilities - - - - - 114 669 1,034 1,817 Subscribed capital (note ii) - - - - - - - 413 413 Total financial liabilities 112,801 6,259 11,110 8,297 7,193 14,202 18,549 18,026 196,437 Off-balance sheet commitments (note iii) 13,630 - - - - - - - 13,630 Net liquidity difference (111,594) (4,735) (8,932) (6,367) (5,097) (6,357) 6,596 133,008 (3,478)Cumulative liquidity difference (111,594) (116,329) (125,261) (131,628) (136,725) (143,082) (136,486) (3,478)
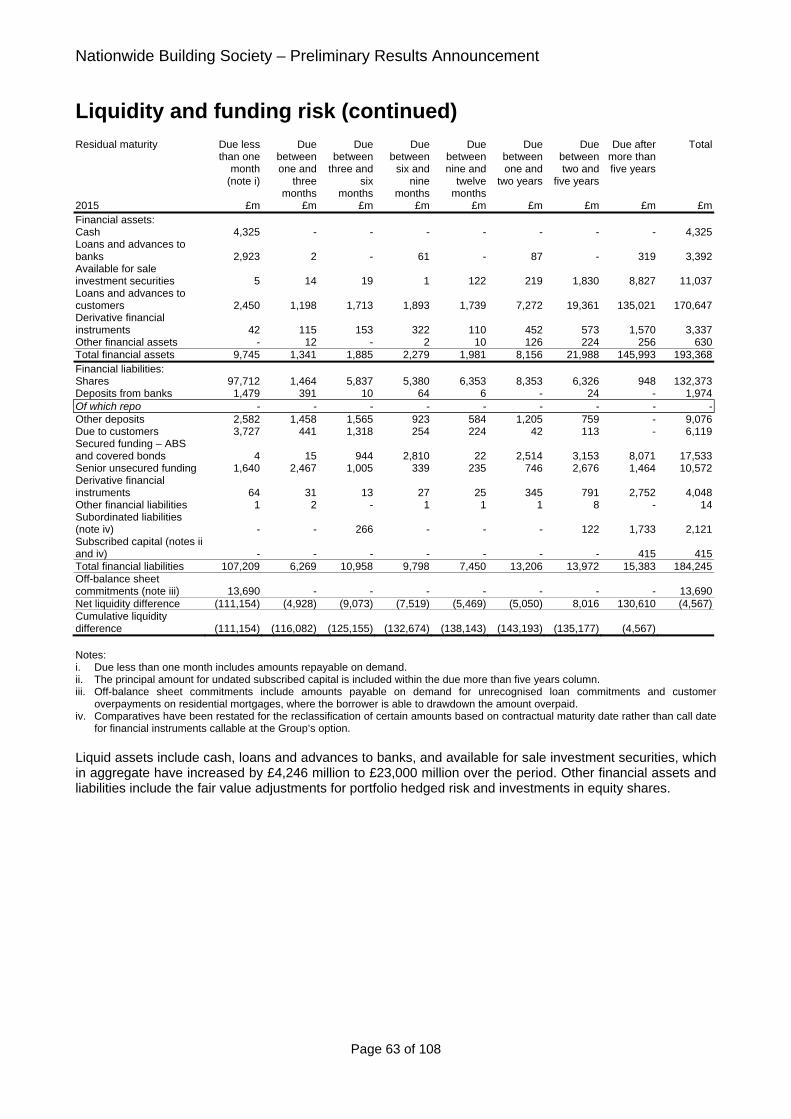
Nationwide Building Society – Preliminary Results Announcement
Page 63 of 108
Liquidity and funding risk (continued) Residual maturity Due less
than one month
(note i)
Due between one and
three months
Due between
three and six
months
Due between
six and nine
months
Due between nine and
twelve months
Due between one and
two years
Due between two and
five years
Due after more than five years
Total
2015 £m £m £m £m £m £m £m £m £mFinancial assets: Cash 4,325 - - - - - - - 4,325Loans and advances to banks 2,923 2 - 61 - 87 - 319 3,392Available for sale investment securities 5 14 19 1 122 219 1,830 8,827 11,037Loans and advances to customers 2,450 1,198 1,713 1,893 1,739 7,272 19,361 135,021 170,647Derivative financial instruments 42 115 153 322 110 452 573 1,570 3,337Other financial assets - 12 - 2 10 126 224 256 630Total financial assets 9,745 1,341 1,885 2,279 1,981 8,156 21,988 145,993 193,368Financial liabilities: Shares 97,712 1,464 5,837 5,380 6,353 8,353 6,326 948 132,373Deposits from banks 1,479 391 10 64 6 - 24 - 1,974Of which repo - - - - - - - - -Other deposits 2,582 1,458 1,565 923 584 1,205 759 - 9,076Due to customers 3,727 441 1,318 254 224 42 113 - 6,119Secured funding – ABS and covered bonds 4 15 944 2,810 22 2,514 3,153 8,071 17,533Senior unsecured funding 1,640 2,467 1,005 339 235 746 2,676 1,464 10,572Derivative financial instruments 64 31 13 27 25 345 791 2,752 4,048Other financial liabilities 1 2 - 1 1 1 8 - 14Subordinated liabilities (note iv) - - 266 - - - 122 1,733 2,121Subscribed capital (notes ii and iv) - - - - - - - 415 415Total financial liabilities 107,209 6,269 10,958 9,798 7,450 13,206 13,972 15,383 184,245Off-balance sheet commitments (note iii) 13,690 - - - - - - - 13,690Net liquidity difference (111,154) (4,928) (9,073) (7,519) (5,469) (5,050) 8,016 130,610 (4,567)Cumulative liquidity difference (111,154) (116,082) (125,155) (132,674) (138,143) (143,193) (135,177) (4,567) Notes: i. Due less than one month includes amounts repayable on demand. ii. The principal amount for undated subscribed capital is included within the due more than five years column. iii. Off-balance sheet commitments include amounts payable on demand for unrecognised loan commitments and customer
overpayments on residential mortgages, where the borrower is able to drawdown the amount overpaid. iv. Comparatives have been restated for the reclassification of certain amounts based on contractual maturity date rather than call date
for financial instruments callable at the Group’s option. Liquid assets include cash, loans and advances to banks, and available for sale investment securities, which in aggregate have increased by £4,246 million to £23,000 million over the period. Other financial assets and liabilities include the fair value adjustments for portfolio hedged risk and investments in equity shares.

Nationwide Building Society – Preliminary Results Announcement
Page 64 of 108
Liquidity and funding risk (continued) Financial liabilities – gross undiscounted contractual cash flows The tables below provide an analysis of gross contractual cash flows. The totals differ from the analysis of residual maturity as they include interest, accrued at current rates for the average period until maturity, on the balances outstanding at the balance sheet date. Amounts are allocated to the relevant maturity band based on the timing of individual contractual cash flows. Gross contractual cash flows
Due less than one
month (note i)
Due between one and
three months
Due between
three and six
months
Due between
six and nine
months
Due between nine and
twelve months
Duebetween one and
two years
Due between two and
five years
Due after more than five years
Total
2016 £m £m £m £m £m £m £m £m £mShares 103,296 1,723 5,956 4,675 5,177 10,866 6,387 1,369 139,449 Deposits from banks 1,657 184 169 41 19 - 25 - 2,095 Other deposits 2,550 1,398 1,846 717 391 737 7 - 7,646 Due to customers 3,563 549 1,351 347 216 127 63 - 6,216 Secure funding – ABS and covered bonds 70 23 68 2,282 503 1,832 7,683 8,444 20,905 Senior unsecured funding 1,638 2,583 1,769 332 1,152 854 4,292 5,336 17,956 Subordinated liabilities - - 38 - 49 212 233 1,704 2,236 Subscribed capital (note ii) 1 5 4 7 4 22 67 362 472 Total non-derivative financial liabilities 112,775 6,465 11,201 8,401 7,511 14,650 18,757 17,215 196,975Derivative financial liabilities: Gross settled derivatives – outflows 26 244 101 27 889 1,221 2,079 1,015 5,602Gross settled derivatives –inflows (25) (234) (88) (14) (830) (1,088) (1,858) (897) (5,034)Gross settled derivatives –net flows 1 10 13 13 59 133 221 118 568Net settled derivatives liabilities 56 119 188 163 170 489 840 1,257 3,282Total derivative financial liabilities 57 129 201 176 229 622 1,061 1,375 3,850Total financial liabilities 112,832 6,594 11,402 8,577 7,740 15,272 19,818 18,590 200,825 Off-balance sheet commitments (note iii) 13,630 - - - - - - - 13,630Total financial liabilities including off-balance sheet commitments 126,462 6,594 11,402 8,577 7,740 15,272 19,818 18,590 214,455

Nationwide Building Society – Preliminary Results Announcement
Page 65 of 108
Liquidity and funding risk (continued) Gross contractual cash flows
Due less than one
month (note i)
Due between one and
three months
Due between
three and six months
Due between
six and nine
months
Due between nine and
twelve months
Due between one and
two years
Due between two and
five years
Due after more than five years
Total
2015 £m £m £m £m £m £m £m £m £mShares 97,712 1,568 5,930 5,456 6,411 8,494 6,478 977 133,026Deposits from banks 1,479 392 10 64 6 - 25 - 1,976Other deposits 2,582 1,477 1,579 933 591 1,223 773 - 9,158Due to customers 3,727 448 1,322 256 225 44 115 - 6,137Secure funding – ABS and covered bonds 36 20 971 2,846 187 2,797 3,771 8,068 18,696Senior unsecured funding 1,640 2,471 1,048 344 337 897 3,053 1,640 11,430Subordinated liabilities (note iv) - 4 315 4 50 96 390 1,811 2,670Subscribed capital (notes ii and iv) 1 5 4 7 4 22 68 363 474Total non-derivative financial liabilities 107,177 6,385 11,179 9,910 7,811 13,573 14,673 12,859 183,567Derivative financial liabilities: Gross settled derivatives – outflows 1,503 1,653 29 101 38 1,026 3,634 5,649 13,633Gross settled derivatives –inflows (1,452) (1,610) (15) (70) (19) (815) (3,021) (4,912) (11,914)Gross settled derivatives –net flows 51 43 14 31 19 211 613 737 1,719Net settled derivatives liabilities 50 123 212 150 185 487 712 1,319 3,238Total derivative financial liabilities 101 166 226 181 204 698 1,325 2,056 4,957Total financial liabilities 107,278 6,551 11,405 10,091 8,015 14,271 15,998 14,915 188,524Off-balance sheet commitments (note iii) 13,690 - - - - - - - 13,690Total financial liabilities including off-balance sheet commitments 120,968 6,551 11,405 10,091 8,015 14,271 15,998 14,915 202,214 Notes: i. Due less than one month includes amounts repayable on demand. ii. The principal amount for undated subscribed capital is included within the due more than five years column. iii. Off-balance sheet commitments include amounts payable on demand for unrecognised loan commitments and customer
overpayments on residential mortgages, where the borrower is able to drawdown the amount overpaid. iv. Comparatives have been restated for the reclassification of certain amounts based on contractual maturity date rather than call date
for financial instruments callable at the Group’s option.

Nationwide Building Society – Preliminary Results Announcement
Page 66 of 108
Liquidity and funding risk (continued) Asset encumbrance Asset encumbrance arises from collateral pledged against secured funding and other collateralised obligations. The majority of asset encumbrance within the Group arises from the use of prime mortgage pools to collateralise the Covered Bond and Silverstone asset-backed funding programmes and from participation in the FLS. Encumbrance also results from repurchase transactions, voluntary excess collateral balances, participation in payment schemes and collateral posted for derivative margin requirements. Assets that have been used for any of these purposes cannot be utilised for other purposes and are classified as encumbered. All other assets are by definition unencumbered. These comprise assets that are readily available to secure funding or meet collateral requirements, and assets that are capable of being encumbered with a degree of further management action. Any remaining assets which do not fall into either of these categories are classified as not being capable of being encumbered. An analysis of the Group's encumbered and unencumbered on-balance sheet assets is set out below. The table does not include off-balance sheet assets received by the Group as part of its participation in the FLS, which the Group is permitted to re-use. This disclosure is not intended to identify assets that would be available in the event of a resolution or bankruptcy. Asset encumbrance Assets encumbered as a result of
transactions with counterparties other than central banks
Other assets (comprising assets encumbered at the central bank and unencumbered assets)
Total
As a result of covered
bonds
As a result of
securitis-ations
Other Total Assets positioned at
the central bank (i.e. preposit-
ioned and encumbered)
Assets not positioned at the central bank
Total
Readily available for
encumbrance
Other assets that
are capable of being
encumbered
Cannot be encumbered
2016 £m £m £m £m £m £m £m £m £m £mCash 1,328 397 - 1,725 - 6,851 - 221 7,072 8,797Loans and advances to banks - - 1,511 1,511 765 - - 1,315 2,080 3,591Available for sale investment securities - - 128 128
42 10,442 - - 10,484 10,612
Loans and advances to customers 18,996 12,368 - 31,364 28,387 70,312 48,744 - 147,443 178,807Derivative financial instruments - - - - - - 3,898 3,898 3,898Other financial assets - - - - - - - 884 884 884Non-financial assets - - - - - - - 2,350 2,350 2,350Total 20,324 12,765 1,639 34,728 29,194 87,605 48,744 8,668 174,211 208,939
Asset encumbrance Assets encumbered as a result of
transactions with counterparties other than central banks
Other assets (comprising assets encumbered at the central bank and unencumbered assets)
Total
As a result of covered
bonds
As a result of
securitis- ations
Other Total Assets positioned at the
central bank (i.e. preposit-
ioned and encumbered)
Assets not positioned at the central bank
Total
Readily available for
encumbrance
Other assets that are
capable of being
encumbered
Cannot be encumbered
2015 £m £m £m £m £m £m £m £m £m £mCash 1,804 414 - 2,218 - 1,947 - 160 2,107 4,325Loans and advances to banks - - 2,308 2,308 327 - - 757 1,084 3,392Available for sale investment securities - - - - 266 10,771 - - 11,037 11,037Loans and advances to customers 17,161 14,902 - 32,063 29,797 62,548 46,239 - 138,584 170,647Derivative financial instruments - - - - - - - 3,337 3,337 3,337Other financial assets - - - - - - - 630 630 630Non-financial assets - - - - - - - 2,212 2,212 2,212Total 18,965 15,316 2,308 36,589 30,390 75,266 46,239 7,096 158,991 195,580

Nationwide Building Society – Preliminary Results Announcement
Page 67 of 108
Liquidity and funding risk (continued) External credit ratings The Society’s short and long term credit ratings from the major rating agencies at 23 May 2016 are as follows: Credit ratings Long term Short term Tier 2 Date of last rating
action / confirmation Outlook
Standard & Poor’s A A-1 BBB January 2016 StableMoody’s A1 P-1 Baa1 February 2016 PositiveFitch A F1 A- June 2015 Stable Standard & Poor’s affirmed the Society’s A long term and A-1 short term ratings with a stable outlook in January 2016. In February 2016, Moody’s affirmed the Society’s A1 long term and P-1 short term ratings and changed the outlook to positive from stable. The positive outlook reflects the potential for increased senior and subordinated debt issuance to result in lower expected loss levels for the Society’s deposits and senior unsecured debt. The table below sets out the amount of additional collateral the Group would need to provide in the event of a one and two notch downgrade by external credit rating agencies. Cumulative adjustment for
a one notch downgrade£bn
Cumulative adjustment for a two notch downgrade
£bn2016 4.1 4.52015 3.8 4.2
The contractually required cash outflow would not necessarily match the actual cash outflow as a result of management actions that could be taken to reduce the impact of the downgrades.
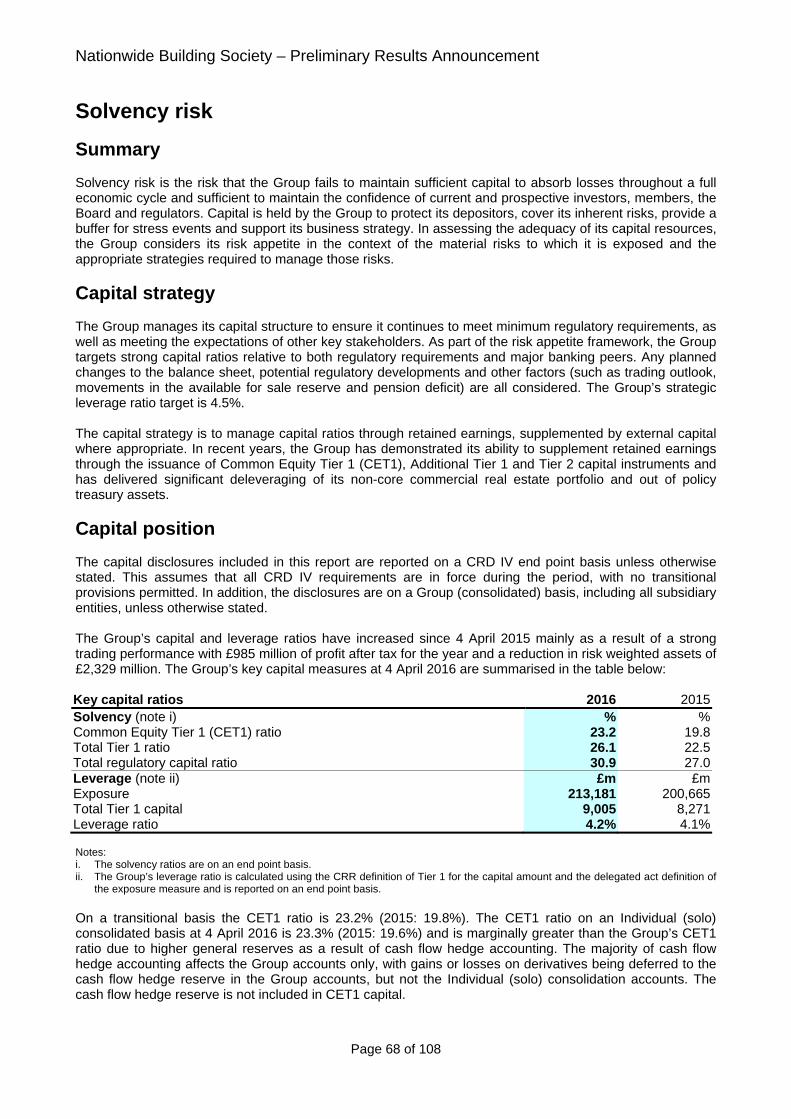
Nationwide Building Society – Preliminary Results Announcement
Page 68 of 108
Solvency risk
Summary Solvency risk is the risk that the Group fails to maintain sufficient capital to absorb losses throughout a full economic cycle and sufficient to maintain the confidence of current and prospective investors, members, the Board and regulators. Capital is held by the Group to protect its depositors, cover its inherent risks, provide a buffer for stress events and support its business strategy. In assessing the adequacy of its capital resources, the Group considers its risk appetite in the context of the material risks to which it is exposed and the appropriate strategies required to manage those risks.
Capital strategy The Group manages its capital structure to ensure it continues to meet minimum regulatory requirements, as well as meeting the expectations of other key stakeholders. As part of the risk appetite framework, the Group targets strong capital ratios relative to both regulatory requirements and major banking peers. Any planned changes to the balance sheet, potential regulatory developments and other factors (such as trading outlook, movements in the available for sale reserve and pension deficit) are all considered. The Group’s strategic leverage ratio target is 4.5%. The capital strategy is to manage capital ratios through retained earnings, supplemented by external capital where appropriate. In recent years, the Group has demonstrated its ability to supplement retained earnings through the issuance of Common Equity Tier 1 (CET1), Additional Tier 1 and Tier 2 capital instruments and has delivered significant deleveraging of its non-core commercial real estate portfolio and out of policy treasury assets.
Capital position The capital disclosures included in this report are reported on a CRD IV end point basis unless otherwise stated. This assumes that all CRD IV requirements are in force during the period, with no transitional provisions permitted. In addition, the disclosures are on a Group (consolidated) basis, including all subsidiary entities, unless otherwise stated. The Group’s capital and leverage ratios have increased since 4 April 2015 mainly as a result of a strong trading performance with £985 million of profit after tax for the year and a reduction in risk weighted assets of £2,329 million. The Group’s key capital measures at 4 April 2016 are summarised in the table below: Key capital ratios 2016 2015Solvency (note i) % %Common Equity Tier 1 (CET1) ratio 23.2 19.8Total Tier 1 ratio 26.1 22.5Total regulatory capital ratio 30.9 27.0Leverage (note ii) £m £mExposure 213,181 200,665Total Tier 1 capital 9,005 8,271Leverage ratio 4.2% 4.1% Notes: i. The solvency ratios are on an end point basis. ii. The Group’s leverage ratio is calculated using the CRR definition of Tier 1 for the capital amount and the delegated act definition of
the exposure measure and is reported on an end point basis. On a transitional basis the CET1 ratio is 23.2% (2015: 19.8%). The CET1 ratio on an Individual (solo) consolidated basis at 4 April 2016 is 23.3% (2015: 19.6%) and is marginally greater than the Group’s CET1 ratio due to higher general reserves as a result of cash flow hedge accounting. The majority of cash flow hedge accounting affects the Group accounts only, with gains or losses on derivatives being deferred to the cash flow hedge reserve in the Group accounts, but not the Individual (solo) consolidation accounts. The cash flow hedge reserve is not included in CET1 capital.

Nationwide Building Society – Preliminary Results Announcement
Page 69 of 108
Solvency risk (continued) CET1 capital has increased from £7,279 million to £8,013 million over the year primarily due to increased retained earnings, driven by a strong trading performance for the year and a reduction in the pension deficit. This was partly offset by an increase in intangible assets and the prudent valuation adjustment as well as a reduction in the value of the available for sale reserve. The increases in total Tier 1 capital and total regulatory capital include the increase in CET1 resources, offset at a total regulatory capital level by a reduction in Tier 2 capital, due to amortisation of subordinated debt. Total exposure used to calculate the leverage ratio, which consists of balance sheet assets, off-balance sheet items and other regulatory adjustments, has increased by £12,516 million to £213,181 million. Balance sheet assets have grown by £13,359 million to £208,939 million since 4 April 2015, mainly driven by increases in mortgage balances, together with higher deposits with central banks held for liquidity purposes as a result of the Group’s pre-funding of wholesale maturities ahead of the EU referendum. The leverage ratio has increased to 4.2% (2015: 4.1%) as growth in Tier 1 capital has outstripped the balance sheet growth. The leverage ratio at 4 April 2016 is lower than that reported at 31 December 2015 (4.3%) due to balance sheet growth during the fourth quarter. The Group holds capital to meet Pillar 1 requirements (for credit, operational and market risks). In addition, the PRA requires firms to hold capital to meet Pillar 2A requirements, which are set out in the Individual Capital Guidance (ICG). This is a point in time estimate, set by the PRA on an annual basis, of the amount of capital required to be held to meet risks partly covered by Pillar 1 such as credit concentration and operational risk, and risks not covered by Pillar 1 such as pension and interest rate risk. The Group’s current ICG equates to £2.2 billion, of which at least £1.2 billion must be met by CET1 capital (previously around £1.9 billion, of which at least approximately £1.1 billion had to be met by CET1 capital). This amount is equivalent to 6.4% of RWAs as at 4 April 2016 (2015: 5.2%), reflecting the Group’s low average risk weight given that approximately 76% (2015: 76%) of the Group’s exposure is in the form of secured residential mortgages, of which 80% (2015: 81%) are prime. In order to protect against the risk of consuming Pillar 1 or Pillar 2A requirements (thereby breaching ICG), firms are subject to regulatory capital buffers which are set out in CRD IV. In addition, the PRA may set a firm-specific buffer based upon supervisory judgement informed by the impact of stress scenarios on a firm’s capital requirements and resources, and taking into account other factors including leverage, systemic importance and any weaknesses in firms’ risk management and governance procedures.

Nationwide Building Society – Preliminary Results Announcement
Page 70 of 108
Solvency risk (continued) The table below reconciles the general reserves to total regulatory capital. Both 2016 and 2015 have been presented on an end point basis and so do not include grandfathered instruments. Total regulatory capital
2016 2015£m £m
General reserve (note i) 8,921 7,995Core capital deferred shares (CCDS) 531 531Revaluation reserve 64 68Available for sale reserve (8) 26Regulatory adjustments and deductions:
Foreseeable distributions (note ii) (42) (44)Prudent valuation adjustment (note iii) (55) (1)Own credit and debit valuation adjustments (note iv) (2) (11)Intangible assets (note v) (1,120) (982)Goodwill (note v) (12) (12)Excess of regulatory expected losses over impairment provisions (note vi) (264) (291)
Total regulatory adjustments and deductions (1,495) (1,341)Common Equity Tier 1 capital 8,013 7,279Additional Tier 1 capital securities (AT1) 992 992Total Tier 1 capital 9,005 8,271 Dated subordinated debt (note vii) 1,628 1,653Collectively assessed impairment allowances 21 26Tier 2 capital 1,649 1,679 Total regulatory capital 10,654 9,950 Notes: i. The general reserve includes independently verified profits for the year to 4 April 2016. ii. Foreseeable distributions in respect of CCDS and AT1 securities are deducted from CET1 capital under CRD IV. iii. A prudent valuation adjustment (PVA) is applied in respect of fair valued instruments as required under regulatory capital rules.
Following publication of the PVA Regulatory Technical Standard in January 2016, this revised methodology has been applied for April 2016 reporting which accounts for the increase.
iv. Own credit and debit valuation adjustments are applied to remove balance sheet gains or losses of fair valued liabilities and derivatives that result from changes in the Group’s own credit standing and risk, in accordance with CRD IV rules.
v. Intangible assets and goodwill do not qualify as capital for regulatory purposes. vi. Under CRD IV the net regulatory capital expected loss in excess of accounting impairment provisions is deducted from CET1
capital, gross of tax. vii. Subordinated debt includes fair value adjustments related to changes in market interest rates, adjustments for unamortised
premiums and discounts that are included in the consolidated balance sheet, and any amortisation of the capital value of Tier 2 instruments required by regulatory rules for instruments with less than five years to maturity. It does not include instruments that are subject to CRD IV grandfathering provisions, as this table is presented on an end point basis.
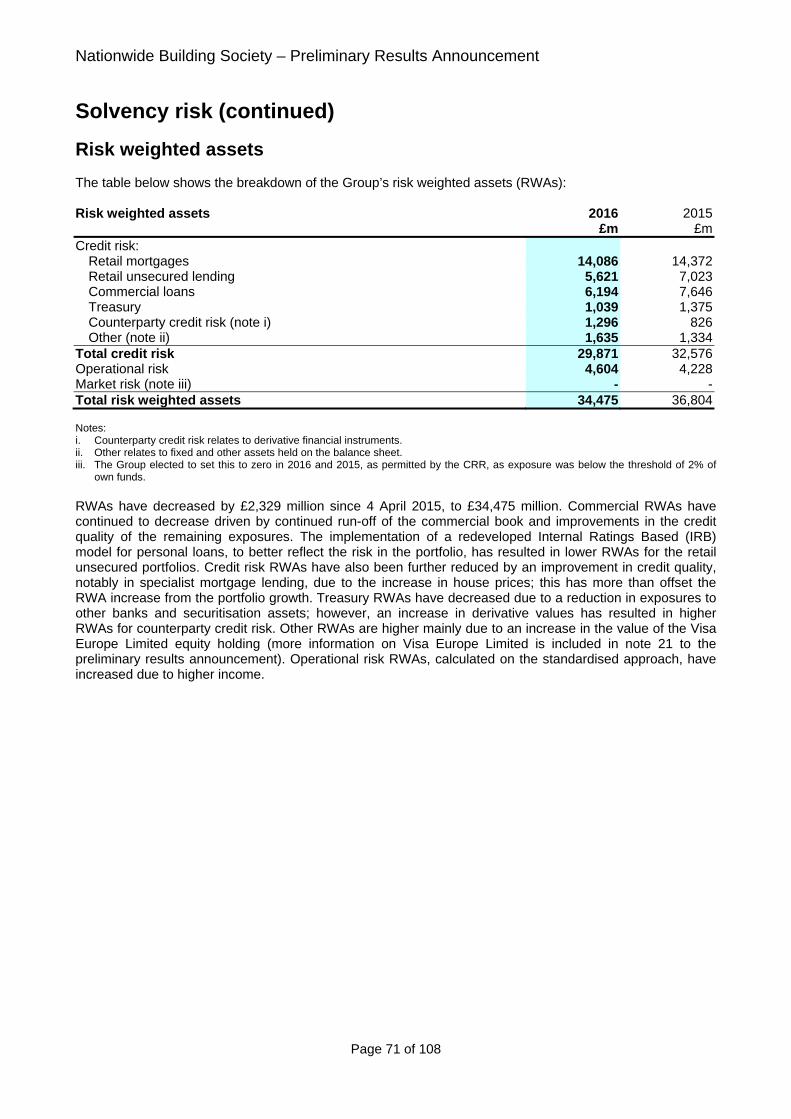
Nationwide Building Society – Preliminary Results Announcement
Page 71 of 108
Solvency risk (continued)
Risk weighted assets The table below shows the breakdown of the Group’s risk weighted assets (RWAs): Risk weighted assets 2016 2015 £m £mCredit risk:
Retail mortgages 14,086 14,372 Retail unsecured lending 5,621 7,023 Commercial loans 6,194 7,646 Treasury 1,039 1,375 Counterparty credit risk (note i) 1,296 826 Other (note ii) 1,635 1,334
Total credit risk 29,871 32,576Operational risk 4,604 4,228Market risk (note iii) - -Total risk weighted assets 34,475 36,804 Notes: i. Counterparty credit risk relates to derivative financial instruments. ii. Other relates to fixed and other assets held on the balance sheet. iii. The Group elected to set this to zero in 2016 and 2015, as permitted by the CRR, as exposure was below the threshold of 2% of
own funds. RWAs have decreased by £2,329 million since 4 April 2015, to £34,475 million. Commercial RWAs have continued to decrease driven by continued run-off of the commercial book and improvements in the credit quality of the remaining exposures. The implementation of a redeveloped Internal Ratings Based (IRB) model for personal loans, to better reflect the risk in the portfolio, has resulted in lower RWAs for the retail unsecured portfolios. Credit risk RWAs have also been further reduced by an improvement in credit quality, notably in specialist mortgage lending, due to the increase in house prices; this has more than offset the RWA increase from the portfolio growth. Treasury RWAs have decreased due to a reduction in exposures to other banks and securitisation assets; however, an increase in derivative values has resulted in higher RWAs for counterparty credit risk. Other RWAs are higher mainly due to an increase in the value of the Visa Europe Limited equity holding (more information on Visa Europe Limited is included in note 21 to the preliminary results announcement). Operational risk RWAs, calculated on the standardised approach, have increased due to higher income.
Nationwide Building Society – Preliminary Results Announcement
Page 72 of 108
Solvency risk (continued)
Regulatory developments The Group continues to monitor regulatory developments that could lead to an increased level of capital requirements. Whilst there are a number of areas where potential requirements are yet to be finalised, regulatory announcements during the financial year mean that we have better visibility on expectations for future capital requirements. However, the Group will remain engaged in the development of the regulatory approach to ensure it is prepared for any change. We expect to have a steady state leverage ratio requirement of 3.75% from 2019, which comprises a minimum requirement of 3%, a supplementary leverage ratio buffer of 0.35% and countercyclical leverage ratio buffer of 0.4%. Whilst the Financial Policy Committee could set a countercyclical leverage buffer up to 0.9%, in March 2016 it set the buffer at 0.2%, which is expected to apply from March 2017. The Basel Committee on Banking Supervision and the European Banking Authority are currently reviewing the leverage ratio requirement for banks and building societies, but it is expected that the PRA leverage framework will remain the Group’s binding requirement. The Group’s strategic leverage ratio target of 4.5% reflects its desire to maintain strong levels of capital relative to maximum regulatory expectations (4.25%). As part of the European BRRD, the Bank of England, in its capacity as the UK resolution authority, has consulted on setting the Minimum Requirement for Eligible Liabilities (MREL). This consultation proposed that a firm of Nationwide’s size should, from 2020, have a MREL requirement equal to double minimum capital requirements. The Group is confident it has a strong foundation from which to meet MREL requirements. The Basel Committee is expected to finalise its revisions to the standardised approach for credit and operational risks in late 2016. We do not believe that these will lead to a material increase in capital requirements for the Group. Whilst the revised standardised approach is due to be used as a basis for a floor for minimum capital requirements, the precise calibration of this has not yet been published. In addition, a Basel Committee consultation proposing constraints on the use of IRB approaches for credit risk was published in March 2016, which could lead to higher risk weights for certain portfolios. In October 2015, the Bank of England published its medium term approach to concurrent stress testing: ‘The Bank of England’s approach to stress testing the UK banking system’. Two additional hurdle rates have been introduced for this year’s exercise (firms must meet Pillar 2A capital requirements and Global Systemically Important Bank (G-SIB) buffers in addition to CET1 and leverage ratios), and the Bank of England has clarified its approach to scenario setting. Each year the participating firms will be required to model a stress scenario that is linked to the UK’s position in the economic cycle, and on a biannual basis an additional ‘exploratory scenario’ will be published that will explore specific areas of risk or vulnerability in the economy that may not be captured in the annual scenario. The Group continues to develop its approach to stress testing to ensure it responds to increasing regulatory expectations and it remains a valuable tool for the management of risk within its business.

Nationwide Building Society – Preliminary Results Announcement
Page 73 of 108
CONSOLIDATED FINANCIAL STATEMENTS
Contents
Page
Consolidated income statement 74
Consolidated statement of comprehensive income 75
Consolidated balance sheet 76
Consolidated statement of movements in members’ interests and equity 77
Consolidated cash flow statement 78
Notes to the consolidated financial statements 79

Nationwide Building Society – Preliminary Results Announcement
Page 74 of 108
CONSOLIDATED INCOME STATEMENT For the year ended 4 April 2016 Notes 2016 2015* £m £m
Interest receivable and similar income 3 5,294 5,347Interest expense and similar charges 4 (2,208) (2,475)Net interest income 3,086 2,872Fee and commission income 428 447Fee and commission expense (192) (169)Income from investments 3 4Other operating income 8 9Gains/(losses) from derivatives and hedge accounting 5 39 (20)Total income 3,372 3,143Administrative expenses 6 (1,847) (1,706)Impairment losses on loans and advances 7 (81) (233)Impairment recoveries/(losses) on investment securities 8 (18)Provisions for liabilities and charges 8 (173) (142)Profit before tax 1,279 1,044Taxation 9 (294) (205)Profit after tax 985 839 *Comparatives have been restated as detailed in note 2.

Nationwide Building Society – Preliminary Results Announcement
Page 75 of 108
CONSOLIDATED STATEMENT OF COMPREHENSIVE INCOME For the year ended 4 April 2016 2016 2015
£m £mProfit after tax 985 839 Other comprehensive income/(expense): Items that will not be reclassified to the income statement Remeasurements of retirement benefit obligations:
Retirement benefit remeasurements before tax 42 (136)Taxation 9 21
51 (115)Revaluation of property:
Revaluation before tax 4 5Taxation (7) 1
(3) 6Other items through the general reserve, including effect of corporation tax rate change
(1) (1)
47 (110)Items that may subsequently be reclassified to the income statement Cash flow hedge reserve:
Fair value movements taken to members’ interests and equity 2,099 (503)Amount transferred to income statement (1,666) 664Taxation (132) (32)
301 129Available for sale reserve:
Fair value movements taken to members’ interests and equity (60) (79)Amount transferred to income statement 19 183Taxation 7 (27)
(34) 77 Other comprehensive income 314 96 Total comprehensive income 1,299 935
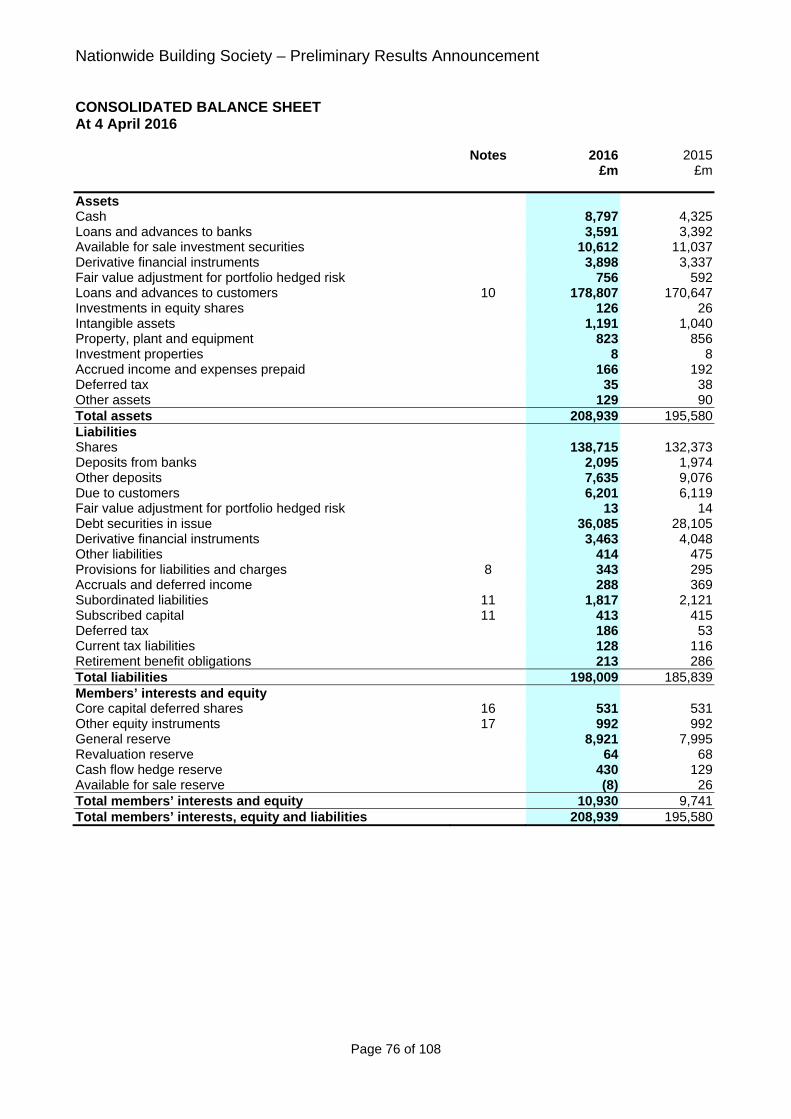
Nationwide Building Society – Preliminary Results Announcement
Page 76 of 108
CONSOLIDATED BALANCE SHEET At 4 April 2016 Notes 2016 2015 £m £m
Assets Cash 8,797 4,325Loans and advances to banks 3,591 3,392Available for sale investment securities 10,612 11,037Derivative financial instruments 3,898 3,337Fair value adjustment for portfolio hedged risk 756 592Loans and advances to customers 10 178,807 170,647Investments in equity shares 126 26Intangible assets 1,191 1,040Property, plant and equipment 823 856Investment properties 8 8Accrued income and expenses prepaid 166 192Deferred tax 35 38Other assets 129 90Total assets 208,939 195,580Liabilities Shares 138,715 132,373Deposits from banks 2,095 1,974Other deposits 7,635 9,076Due to customers 6,201 6,119Fair value adjustment for portfolio hedged risk 13 14Debt securities in issue 36,085 28,105Derivative financial instruments 3,463 4,048Other liabilities 414 475Provisions for liabilities and charges 8 343 295Accruals and deferred income 288 369Subordinated liabilities 11 1,817 2,121Subscribed capital 11 413 415Deferred tax 186 53Current tax liabilities 128 116Retirement benefit obligations 213 286Total liabilities 198,009 185,839Members’ interests and equity Core capital deferred shares 16 531 531Other equity instruments 17 992 992General reserve 8,921 7,995Revaluation reserve 64 68Cash flow hedge reserve 430 129Available for sale reserve (8) 26Total members’ interests and equity 10,930 9,741Total members’ interests, equity and liabilities 208,939 195,580

Nationwide Building Society – Preliminary Results Announcement
Page 77 of 108
CONSOLIDATED STATEMENT OF MOVEMENTS IN MEMBERS’ INTERESTS AND EQUITY For the year ended 4 April 2016
Core capital
deferred shares
Otherequity
instruments
General reserve
Revaluation reserve
Cash flow hedge
reserve
Available for sale reserve
Total
£m £m £m £m £m £m £mAt 5 April 2015 531 992 7,995 68 129 26 9,741Profit for the year - - 985 - - - 985Net movement in available for sale reserve
- - - - - (34) (34)
Net movement in cash flow hedge reserve
- - - - 301 - 301
Net revaluation of property - - - (3) - - (3)Reserve transfer - - 1 (1) - - -Effect of tax rate change on other items through the general reserve
- - (1) - - - (1)
Net remeasurements of retirement benefit obligations
- - 51 - - - 51
Total comprehensive income - - 1,036 (4) 301 (34) 1,299Distribution to the holders of core capital deferred shares
- - (56) - - - (56)
Distribution to the holders of Additional Tier 1 capital*
- - (54) - - - (54)
At 4 April 2016 531 992 8,921 64 430 (8) 10,930
CONSOLIDATED STATEMENT OF MOVEMENTS IN MEMBERS’ INTERESTS AND EQUITY For the year ended 4 April 2015 Core capital
deferred shares
Otherequity
instruments
General reserve
Revaluation reserve
Cash flow hedge
reserve
Available for sale reserve
Total
£m £m £m £m £m £m £mAt 5 April 2014 531 992 7,363 71 - (51) 8,906Profit for the year - - 839 - - - 839Net movement in available for sale reserve
- - - - - 77 77
Net movement in cash flow hedge reserve
- - - - 129 - 129
Net revaluation of property - - - 6 - - 6Reserve transfer - - 9 (9) - - -Effect of tax rate change on other items through the general reserve
- - (1) - - - (1)
Net remeasurements of retirement benefit obligations
- - (115) - - - (115)
Total comprehensive income - - 732 (3) 129 77 935Distribution to the holders of core capital deferred shares
- - (58) - - - (58)
Distribution to the holders of Additional Tier 1 capital*
- - (42) - - - (42)
At 4 April 2015 531 992 7,995 68 129 26 9,741 *The distribution to holders of Additional Tier 1 capital is shown net of an associated tax credit of £14 million (2015: £11 million).

Nationwide Building Society – Preliminary Results Announcement
Page 78 of 108
CONSOLIDATED CASH FLOW STATEMENT For the year ended 4 April 2016 2016 2015* Notes £m £m Cash flows (used in)/generated from operating activities Profit before tax 1,279 1,044 Adjustments for:
Non-cash items included in profit before tax 20 240 (164)Changes in operating assets and liabilities 20 (2,413) 427Interest paid on subordinated liabilities (102) (117)Interest paid on subscribed capital (26) (38)Taxation (254) (165)
Net cash flows (used in)/generated from operating activities (1,276) 987 Cash flows generated from/(used in) investing activities Purchase of investment securities (4,202) (4,385)Sale and maturity of investment securities 4,905 4,204Purchase of property, plant and equipment (134) (142)Sale of property, plant and equipment 14 20Purchase of intangible assets (334) (246)Dividends received 3 4Net cash flows generated from/(used in) investing activities 252 (545) Cash flows generated from/(used in) financing activities Distributions paid to the holders of core capital deferred shares (56) (58)Distributions paid to the holders of Additional Tier 1 capital (68) (53)Issue of debt securities 35,350 32,465Redemption of debt securities in issue (28,983) (32,335)Redemption of subordinated liabilities (406) -Redemption of subscribed capital - (200)Net cash flows generated from/(used in) financing activities 5,837 (181) Net increase in cash and cash equivalents 4,813 261Cash and cash equivalents at start of year 7,250 6,989Cash and cash equivalents at end of year 20 12,063 7,250 *Comparatives have been restated as detailed in note 2.

Nationwide Building Society – Preliminary Results Announcement
Page 79 of 108
NOTES TO THE PRELIMINARY RESULTS ANNOUNCEMENT 1 Reporting period These results have been prepared as at 4 April 2016 and show the financial performance for the year from, and including, 5 April 2015 to this date. 2 Basis of preparation The 2016 preliminary results have been prepared in accordance with International Financial Reporting Standards (IFRS) and interpretations (IFRICs) issued by the Interpretations Committee, as published by the International Accounting Standards Board (IASB), and adopted by the European Union, and with those parts of the Building Societies (Accounts and Related Provisions) Regulations 1998 (as amended) applicable to organisations reporting under IFRS. The accounting policies adopted for use in the preparation of this Preliminary Results Announcement and which will be used in preparing the Annual Report and Accounts for the year ended 4 April 2016 were included in the ‘Annual Report and Accounts 2015’ document except as detailed below. Copies of this document are available at nationwide.co.uk/about_nationwide/results_and_accounts Adoption of new and revised IFRSs The following IFRS pronouncements, relevant to the Group, were adopted with effect from 5 April 2015:
Amendments to IAS 19 Employee Benefits: The amendments clarify the requirements for attributing employee/third party contributions that are linked to service to the relevant accounting period. Applying the requirements of the amendments to IAS 19 has had no impact for the Group.
Annual improvements to IFRSs 2010-2012 and 2011-2013 cycles: Several small amendments were adopted with no significant impact for the Group.

Nationwide Building Society – Preliminary Results Announcement
Page 80 of 108
NOTES TO THE PRELIMINARY RESULTS ANNOUNCEMENT 2 Basis of preparation (continued) Change of accounting policy Foreign exchange retranslation The Group holds monetary items denominated in foreign currencies which are retranslated to sterling at the reporting date. Any resulting foreign exchange gains and losses from the retranslation have previously been presented within ‘interest expense and similar charges’ in the income statement. The Group utilises derivatives to economically hedge this foreign exchange exposure with fair value gains and losses on these derivatives presented within ‘gains/losses from derivatives and hedge accounting’ in the income statement. To provide a more meaningful presentation of the Group’s residual economic foreign exchange exposure, amounts in relation to the retranslation of foreign currency monetary items have been reclassified from ‘interest expense and similar charges’ to ‘gains/losses from derivatives and hedge accounting’ in the income statement to offset against the movement in derivative values. Comparatives have been restated to reflect this reclassification as shown below: Income statement extract for the year ended 4 April 2015
Notes
Previously published
£m
Adjustment
£m
Restated
£mInterest expense and similar charges 4 (2,486) 11 (2,475)Losses from derivatives and hedge accounting 5 (9) (11) (20) This reclassification has no impact on the Group’s net assets or members’ interests and equity at 4 April 2015 and no impact on the Group’s net cash flows generated from operating activities or cash and cash equivalents for the year ended 4 April 2015. Other adjustments to comparative information Off balance sheet commitments Off balance sheet commitments at 4 April 2015, shown in the ‘maximum exposure to lending risk’ and the ‘residual maturity’ tables within the ‘Lending risk’ and ‘Liquidity and funding risk’ sections of the Business and Risk Report respectively, have been updated to include commitments of £6,120 million which relate to customer overpayments on residential mortgages where the borrower is entitled to drawdown amounts overpaid. Commitments in respect of loans and advances to customers have been restated from £7,162 million to £13,282 million and total commitments have been restated from £7,570 million to £13,690 million.

Nationwide Building Society – Preliminary Results Announcement
Page 81 of 108
NOTES TO THE PRELIMINARY RESULTS ANNOUNCEMENT 2 Basis of preparation (continued) Future accounting developments An overview of pronouncements that will be relevant to the Group in future periods was provided in the 2015 Annual Report and Accounts. The IASB has issued further pronouncements; however other than the areas listed below, the Group does not expect adoption of the new requirements to have a significant impact on its results. As at 23 May 2016, the pronouncements listed below are awaiting EU endorsement. IFRS 9 Financial Instruments IFRS 9 will be implemented in the financial statements for the year ending 4 April 2019 and will replace IAS 39 Financial Instruments: Recognition and Measurement. It includes requirements for the classification and measurement of financial instruments, impairment of financial assets and hedge accounting. The principal requirements of IFRS 9 are as follows: Classification and measurement The classification of financial assets will be based on the objectives of the Group’s business model and the contractual cash flow characteristics of the instruments. Financial assets will then be classified as held at amortised cost, at fair value through other comprehensive income (FVOCI), or at fair value through profit or loss (FVTPL). The changes from the accounting treatment under IAS 39 are not expected to be significant. There are a limited number of financial assets with contractual cash flow characteristics that will result in a reclassification from amortised cost to FVTPL. The only changes to the classification and measurement of financial liabilities are where liabilities are elected to be measured at fair value, in which case changes in valuation relating to changes in the entity’s own credit risk will be presented separately in other comprehensive income rather than in the income statement. Impairment of financial assets IFRS 9 changes the basis of recognition of impairment on financial assets from an incurred loss to an expected credit loss (ECL) approach for amortised cost and FVOCI financial assets. This introduces a number of new concepts and changes to the approach to provisioning compared with the current methodology under IAS 39: Expected credit losses are based on an assessment of the probability of default, loss given default and
exposure at default, discounted to give a net present value. The estimation of ECL should be unbiased and probability-weighted, taking into account all reasonable and supportable information, including forward looking economic assumptions and a range of possible outcomes. IFRS 9 has the effect of bringing forward recognition of impairment losses relative to IAS 39 which requires provisions to be recognised only when there is objective evidence of credit impairment.
On initial recognition, and for financial assets where there has not been a significant increase in credit risk since the date of advance, IFRS 9 provisions will be made for expected credit default events within the next 12 months.
A key requirement of IFRS 9 compared with the existing provision approach under IAS 39 relates to assets where there has been a significant increase in credit risk since the date of origination. Provisions will be made for those assets expected to default at any point over their lifetime reflecting the asset’s full expected loss. This change to lifetime loss provisions for significantly credit deteriorated assets is expected to lead to increases in impairment provisions, and to increased volatility in provisions, although the size of the change will depend on a number of factors, including the composition of asset portfolios and the view of the economic outlook at the date of implementation.
For assets where there is evidence of credit impairment, provisions will be made under IFRS 9 on the basis of lifetime expected credit losses, taking account of forward looking economic assumptions and a range of possible outcomes. Under IAS 39 provisions are based on the asset’s carrying value and the present value of the estimated future cash flows. IAS 39 does not explicitly take account of a range of possible economic outcomes including forecasts of any downturn of the economic cycle.

Nationwide Building Society – Preliminary Results Announcement
Page 82 of 108
NOTES TO THE PRELIMINARY RESULTS ANNOUNCEMENT 2 Basis of preparation (continued) Hedge accounting The hedge accounting requirements of IFRS 9 are designed to create a stronger link with financial risk management. A separate financial reporting standard will be developed on accounting for dynamic risk management (macro hedge accounting) and IFRS 9 allows the option to continue to apply the existing hedge accounting requirements of IAS 39 until this is implemented. Therefore no changes are currently being implemented to hedge accounting policies and methodologies. Implementation Strategy The Group’s implementation strategy for IFRS 9 is based on an integrated solution using common systems, tools and data to assess credit risk and account for ECLs. This is consistent with guidance issued by the Basel Committee on Banking Supervision which sets an expectation of a high quality strategic implementation, and will entail changes to the governance, controls, models and business processes relating to credit loss provisioning. An extensive period of internal dual reporting is planned in advance of the implementation date. Responsibilities and accountabilities The Group has an established IFRS 9 implementation programme with formal governance reporting to the Group Finance Director and Chief Risk Officer. Progress is reported regularly to the Audit Committee. Extensive work is being carried out to complete technical analysis, including methodologies for ECL models, develop models and design the required changes to systems, data, business processes, reporting and governance of impairment provisions. During the next financial year work will include building and testing of models and validating outputs, development of management information and implementation of business process changes. The financial impact of IFRS 9 will be quantified once models and systems allow the Group to provide reliable estimates, and expected impacts will be disclosed in the financial statements no later than the year ending 4 April 2018.

Nationwide Building Society – Preliminary Results Announcement
Page 83 of 108
NOTES TO THE PRELIMINARY RESULTS ANNOUNCEMENT 2 Basis of preparation (continued) Other pronouncements Pronouncement Nature of change Effective dateDisclosure Initiative (Amendments to IAS 7)
The initiative amends IAS 7 Statement of Cash Flows to clarify that entities shall provide disclosures that enable users of financial statements to evaluate changes in liabilities arising from financing activities. The Group is currently assessing the impact of this amendment.
AP beginning on or after 1 January 2017
IFRS 15 Revenue from Contracts with Customers
IFRS 15 was issued in May 2014. The new standard provides a principles-based approach for revenue recognition, and introduces the concept of recognising revenue for obligations as they are satisfied. The standard requires retrospective application, with certain practical expedients available. During July 2015, the IASB confirmed the deferral of the effective date by one year to 1 January 2018. During April 2016 the IASB issued amendments to IFRS 15 to clarify the guidance on identifying performance obligations, licences of intellectual property and principal versus agent considerations. The Group is currently assessing the impact of this standard; however, it is expected that it will result in the earlier recognition of certain types of income.
AP beginning on or after 1 January 2018
IFRS 16 Leases
In January 2016, the IASB issued IFRS 16 to replace IAS 17 Leases. Under IFRS 16, accounting for finance leases will remain substantially the same. Operating leases will be brought on balance sheet through the recognition of assets representing the contractual rights of use and liabilities will be recognised for the contractual payments. The Group is currently assessing the impact of this standard.
AP beginning on or after 1 January 2019

Nationwide Building Society – Preliminary Results Announcement
Page 84 of 108
NOTES TO THE PRELIMINARY RESULTS ANNOUNCEMENT 2 Basis of preparation (continued) Judgements in applying accounting policies and critical accounting estimates The Group has to make judgements in applying its accounting policies which affect the amounts recognised in the Preliminary Results Announcement. In addition, estimates and assumptions are made that could affect the reported amounts of assets and liabilities within the following financial year. Disclosure of significant areas where judgements and estimates are made is included in the related notes. Going concern The Group’s business activities and financial position, the factors likely to affect its future development and performance, its objectives and policies in managing the financial risks to which it is exposed, and its capital, funding and liquidity positions are discussed in the Business and Risk Report in this document. In the light of current and anticipated economic conditions, the Directors have assessed the Group’s ability to continue as a going concern. The Directors confirm they are satisfied that the Group has adequate resources to continue in business for the foreseeable future and that therefore, it is appropriate to adopt the going concern basis in preparing this preliminary financial information. 3 Interest receivable and similar income 2016
£m
2015£m
On residential mortgages 5,009 4,981On other loans 835 953On investment securities 403 412On other liquid assets 33 28Net expense on financial instruments hedging assets (986) (1,027)Total 5,294 5,347 Included within interest receivable and similar income is interest income on impaired financial assets of £41 million (2015: £82 million). 4 Interest expense and similar charges 2016
£m
2015*£m
On shares held by individuals On subscribed capital
1,577 26
1,897 42
On deposits and other borrowings: Subordinated liabilities Other
99
577
115 171
On debt securities in issue 690 725Net income on financial instruments hedging liabilities (768) (481)Interest on net defined benefit pension liability 7 6Total 2,208 2,475
*Comparatives have been restated as detailed in note 2. Other interest on deposits and other borrowings includes an expense of £439 million (2015: £50 million) in relation to the redemption and maturity of PEB deposits which have returns linked to the performance of specified stock market indices. The PEBs are economically hedged using equity-linked derivatives. Net income on financial instruments hedging liabilities includes income of £398 million (2015: £1 million) in relation to the associated derivatives. Further details are included in note 13.

Nationwide Building Society – Preliminary Results Announcement
Page 85 of 108
NOTES TO THE PRELIMINARY RESULTS ANNOUNCEMENT 5 Gains/losses from derivatives and hedge accounting 2016 2015* £m £m Gains/(losses) from fair value hedge accounting (note i) 85 (46)Ineffectiveness from cash flow hedge accounting (note ii) 1 (3)Net loss from mortgage pipeline (note iii) (46) (53)Fair value (losses)/gains from other derivatives (note iv) (37) 93Foreign exchange differences 36 (11)Total 39 (20) *Comparatives have been restated as detailed in note 2. Notes: i. Gains or losses from fair value hedges can arise where there is an IFRS hedge accounting relationship in place and either:
the relationship passed all the monthly effectiveness tests but the fair value movement of the derivative was not exactly offset by the change in fair value of the asset or liability being hedged (sometimes referred to as hedge ineffectiveness); or
the relationship failed a monthly effectiveness test which, for that month, disallows recognition of the change in fair value of the underlying asset or liability being hedged and in following months leads to the amortisation of existing balance sheet positions.
ii. The Group commenced cash flow hedge accounting in the year ended 4 April 2015, deferring the effective portion of the fair value movement of designated derivatives to the cash flow hedge reserve. The fair value movement is subsequently recycled to the income statement when the underlying hedged asset or liability is recognised in the income statement. The ineffective portion of the fair value movement is recognised immediately in the income statement.
iii. The Group elects to fair value certain mortgage commitments in order to reduce the accounting mismatch caused when derivatives are used to hedge these commitments.
iv. Other derivatives are those used for economic hedging but which are not in an IAS 39 hedge accounting relationship because hedge accounting is not currently achievable.
Although the Group only uses derivatives for the hedging of risks, income statement volatility can still arise due to hedge accounting ineffectiveness or because hedge accounting is either not currently applied or is not currently achievable. This volatility does not reflect the economic reality of the Group’s hedging strategy. Included within the gain of £39 million (2015: loss of £20 million) was the impact of the following:
Gains of £85 million (2015: losses of £46 million) from fair value hedge accounting. This includes gains of £66 million (2015: losses of £30 million) from macro hedges, due to hedge ineffectiveness and the amortisation of existing balance sheet amounts. In addition, further gains of £19 million relate to micro hedges (2015: losses of £16 million) due to a combination of hedge ineffectiveness, maturities and disposals.
Losses of £46 million (2015: £53 million) relating to the mortgage pipeline. The income statement includes the full fair value movement of forward starting interest rate swaps economically hedging the pipeline; however the Group only elects to fair value certain underlying mortgage business within the pipeline.
Losses of £37 million (2015: gains of £93 million) from portfolio valuation adjustments and volatility on other derivatives which are not currently in an IAS 39 hedge accounting relationship.
Gains of £36 million (2015: losses of £11 million) from the retranslation of foreign currency monetary items.
The overall impact of derivatives will remain volatile from period to period as new derivative transactions replace those which mature to ensure that interest rate and other market risks are continually managed.

Nationwide Building Society – Preliminary Results Announcement
Page 86 of 108
NOTES TO THE PRELIMINARY RESULTS ANNOUNCEMENT 6 Administrative expenses 2016
£m 2015
£m Employee costs: Wages and salaries 486 456Bonuses 76 74Social security costs 55 54Pension costs 119 87 736 671Other administrative expenses 745 713Bank levy (note 8) 41 28 1,522 1,412Depreciation, amortisation and impairment 325 294Total 1,847 1,706 Administrative expenses include £10 million (2015: £52 million) of transformation costs. The reduction in transformation costs is driven primarily by the completion of the integration of the Derbyshire, Cheshire and Dunfermline brands and activities relating to the strategic change to the Group’s IT service delivery model.

Nationwide Building Society – Preliminary Results Announcement
Page 87 of 108
NOTES TO THE PRELIMINARY RESULTS ANNOUNCEMENT 7 Impairment provisions on loans and advances to customers The following provisions have been deducted from the appropriate asset values in the balance sheet: 2016
£m 2015
£m Impairment charge for the year Prime residential 8 13Specialist residential 10 45Consumer banking 96 89Commercial lending (34) 52Other lending 1 34Total 81 233Impairment provision at the end of the year Prime residential 25 22Specialist residential 77 88Consumer banking 281 216Commercial lending 59 322Other lending 1 4At 4 April 2016 443 652 The Group impairment provision of £443 million at 4 April 2016 (2015: £652 million) comprises individual provisions of £75 million (2015: £341 million) and collective provisions of £368 million (2015: £311 million). The impairment provision charges for prime and specialist residential loans include £27 million in relation to a refinement of provision model assumptions to ensure they continue to reflect appropriately the incurred losses within the portfolio. The impairment charge for consumer banking impairment includes £29 million resulting from a reassessment of provision model assumptions in relation to up to date accounts. The decrease in impairment provisions held against commercial lending is driven by continued improvement in market conditions for commercial real estate, together with deleveraging activity undertaken during the prior year which has resulted in a reduction in the size of the commercial real estate portfolio.

Nationwide Building Society – Preliminary Results Announcement
Page 88 of 108
NOTES TO THE PRELIMINARY RESULTS ANNOUNCEMENT 7 Impairment provisions on loans and advances to customers (continued) Critical accounting estimates and judgements Impairment provisions on loans and advances Impairment is measured as the difference between an asset’s carrying amount and the present value of management’s estimate of future cash flows. Key assumptions included in the measurement of impairment include the probability of any account going into default, the probability of defaulted accounts progressing to possession and the eventual loss incurred in the event of forced sale or write off. These assumptions are based on observed historical data and updated as management considers appropriate to reflect current conditions and the Group’s strategy for the book. The accuracy of the impairment provision will therefore be affected by unexpected changes in these assumptions. To the extent that actual cash flows in relation to the Group’s retail loans and advances differ from those estimated by 10%, the impairment provision would change by an estimated £41 million. For residential mortgages the estimate of future house price index (HPI) movements is also a key assumption in estimating the eventual loss. The Group does not take account of projected future HPI increases in establishing provisions. If future HPI increases do materialise then this will reduce the amount of actual loss incurred. If provisions were based on an assumption that future HPI would decrease by 10%, the provision at the balance sheet date would increase by an estimated £9 million. In calculating the provisions for commercial loans, estimates of discounted cash flows are made on the basis of the planned strategy for each loan. These estimates include assumptions for underlying property values and future expected cash flows for rental income and any maintenance, redevelopment or refurbishment expenditure on the properties. To the extent that actual cash flows differ from those estimated by 10% on impaired loans, the impairment provision would change by an estimated £13 million.

Nationwide Building Society – Preliminary Results Announcement
Page 89 of 108
NOTES TO THE PRELIMINARY RESULTS ANNOUNCEMENT 8 Provisions for liabilities and charges Bank levy FSCS Customer
redress Other
provisions Total
£m £m £m £m £m At 5 April 2015 13 126 140 16 295Provisions utilised (32) (88) (40) (5) (165)Charge for the year 41 46 138 3 228Release for the year - - (11) (4) (15)Net income statement charge 41 46 127 (1) 213At 4 April 2016 22 84 227 10 343 At 5 April 2014 6 142 124 38 310Provisions utilised (21) (99) (43) (24) (187)Charge for the year 28 83 72 3 186Release for the year - - (13) (1) (14)Net income statement charge 28 83 59 2 172At 4 April 2015 13 126 140 16 295 The income statement charge for provisions for liabilities and charges of £173 million (2015: £142 million) includes the FSCS charge of £46 million (2015: £83 million) and the customer redress net income statement charge of £127 million (2015: £59 million). The income statement charge for bank levy of £41 million (2015: £28 million) and other provisions credit of £1 million (2015: charge of £2 million) are included within administrative expenses in the income statement. Financial Services Compensation Scheme (FSCS) The FSCS, the UK’s independent statutory compensation fund for customers of authorised financial services firms, pays compensation if a firm is unable to pay claims against it. Following the default of a number of deposit takers, the FSCS borrowed funds from HM Treasury; approximately £16 billion of borrowings remain outstanding relating to the default of Bradford & Bingley plc. The FSCS recovers the interest cost, together with ongoing management expenses, by way of annual levies on member firms. In addition, over the last three years, member firms have been funding expected shortfalls in recoveries from the failed institutions to repay the borrowings. All known shortfalls have now been met, resulting in a reduction in the annual charge to £46 million (2015: £83 million). This includes £41 million of interest and management expenses relating to FSCS scheme year 2016/17 and £5 million relating to the final confirmation of previous scheme year charges. The prior year amount included £41 million in relation to expected shortfalls. The balance sheet amount provided by the Group of £84 million (2015: £126 million) comprises £41 million of levies relating to the 2016/17 FSCS scheme year and £43 million relating to the 2015/16 scheme year. The amount relating to the 2015/16 scheme year is payable by 1 September 2016. In the March 2016 Budget, HM Treasury confirmed that UK Asset Resolution (UKAR) is exploring the possibility of a major sales programme of Bradford & Bingley plc. The Group will continue to monitor the progress of this and will assess the financial impact as more information becomes available.

Nationwide Building Society – Preliminary Results Announcement
Page 90 of 108
NOTES TO THE PRELIMINARY RESULTS ANNOUNCEMENT 8 Provisions for liabilities and charges (continued) Customer redress During the course of its business, the Group receives complaints from customers in relation to past sales or conduct. The Group is also subject to enquiries from and discussions with its regulators, governmental and other public bodies, including the Financial Ombudsman Service (FOS), on a range of matters. Customer redress provisions are recognised where the Group considers it is probable that payments will be made as a result of such complaints and other matters. The Group holds provisions of £227 million (2015: £140 million) in respect of the potential costs of remediation and redress in relation to historic sales of financial products and post sales administration. This includes amounts for past sales of PPI, non-compliance with consumer credit legislation and other regulatory matters. The income statement charge for the year mainly reflects the Group’s updated assumptions for provisions previously recognised. This includes a £95 million charge in relation to PPI, largely in response to the announcements made by the Financial Conduct Authority (FCA) during the year and specifically the consultation paper CP15/39 issued in November 2015. In this consultation the FCA proposed an industry-funded communications campaign, combined with a deadline for any further complaints. It also proposed new rules and guidance in light of the Supreme Court’s decision in the case of Plevin v Paragon Personal Finance Limited (‘Plevin’). In light of these latest developments, it is considered appropriate for the Group to provide for the estimated total amount required to deal with all ongoing and future PPI complaints. The amount provided at 4 April 2016 therefore reflects the compensation and administrative costs associated with cases that the Group expects to uphold and the cost of processing invalid claims which the Group expects to receive. This estimate will be re-assessed on an ongoing basis as the FCA finalises its position and actual claims levels are observed. Previously, costs relating to the processing of invalid claims were expensed as incurred. The remainder of the charge for the year is in respect of claims relating to consumer credit legislation. Other provisions Other provisions include provisions for severance costs and a number of property related provisions. Provisions are made for the expected severance costs in relation to the Group’s restructuring activities where there is a present obligation and it is probable that the expenditure will be made. Critical accounting estimates and judgements Customer redress provisions The amount of the provision related to past sales of PPI is calculated based upon management’s best estimate of complaint volumes incorporating the expected impact of the 2015 FCA consultation paper, referral rates to the Financial Ombudsman Service (FOS), uphold rates internally and with the FOS, response rates from customer contact activity relating to previous sales, average redress payments and complaint handling costs. The total amount provided for PPI represents management’s best estimate of the likely future cost. However, there is some uncertainty around the impact of the proposed FCA media campaign on complaint volumes in the lead up to the proposed timebar. If the total volume of PPI complaints was 5% higher than currently estimated, the customer redress provision would increase by £19 million. Other amounts that are provided as an estimate of the potential costs of remediation are subject to ongoing review of various matters, including consumer credit regulations. For these matters, the ultimate amount of redress that will be payable will depend upon a number of internal and external factors. These include the conclusion of legal interpretations and actions to be taken, the time periods to which any redress should apply, the level of complaints that the Group expects to receive from customers and the estimate of amounts of redress and associated costs that will be payable.

Nationwide Building Society – Preliminary Results Announcement
Page 91 of 108
NOTES TO THE PRELIMINARY RESULTS ANNOUNCEMENT 9 Taxation Tax charge in the income statement 2016 2015 £m £m
Current tax: UK corporation tax Corporation tax – adjustment in respect of prior years
330 (8)
215(22)
Total current tax 322 193Deferred tax:
Current year (credit)/charge Adjustment in respect of prior years
Effect of corporation tax rate change
(35)
5 -
136
(7)Effect of banking surcharge on deferred tax balances 2 -Total deferred taxation (28) 12Tax charge 294 205 The actual tax charge differs from the theoretical amount that would arise using the standard rate of corporation tax in the UK as follows: Reconciliation of tax charge 2016 2015 £m £m
Profit before tax 1,279 1,044Tax calculated at a tax rate of 20% (2015: 21%) 256 219Adjustments in respect of prior years (3) (16)Banking surcharge 22 -Expenses not deductible for tax purposes/(income not taxable):
Depreciation on non-qualifying assets Bank levy Other
1 8 8
261
Effect of corporation tax rate change - (7)Effect of banking surcharge on deferred tax balances 2 -Tax charge 294 205 The Finance (No. 2) Act 2015 introduced legislation to impose a surcharge of 8% on the profits of banking companies after 1 January 2016. As a result, a banking surcharge of £22 million is included in the UK corporation tax charge shown above.

Nationwide Building Society – Preliminary Results Announcement
Page 92 of 108
NOTES TO THE PRELIMINARY RESULTS ANNOUNCEMENT 10 Loans and advances to customers 2016 2015
£m £m
Prime residential mortgages 129,948 124,527Specialist residential mortgages 32,114 28,248Consumer banking 3,588 3,575Commercial lending 11,772 12,890Other lending 19 25 177,441 169,265Fair value adjustment for micro hedged risk 1,366 1,382Total 178,807 170,647 Loans and advances to customers in the table above are shown net of impairment provisions held against them. The fair value adjustment for micro hedged risk relates to commercial lending. Asset backed funding Certain prime residential mortgages have been pledged to the Group's asset backed funding programmes or utilised as whole mortgage loan pools for the Bank of England’s (BoE) Funding for Lending Scheme (FLS). The programmes have enabled the Group to obtain secured funding or to create additional collateral which could be used to source additional funding. Mortgages pledged and the nominal values of the notes in issue are as follows: 2016
Notes in issue Mortgages pledged
Held by third parties
Held by the Group
Total notes in issue
£m
£m
Drawn£m
Undrawn £m £m
Covered bond programme 18,996 13,709 - - 13,709Securitisation programme 12,368 4,705 - 1,635 6,340Whole mortgage loan pools 12,344 - 10,749 1,595 12,344Total 43,708 18,414 10,749 3,230 32,393 2015
Mortgages pledged
Notes in issue
Held by third parties
Held by the Group
Total notes in issue
£m £m
Drawn£m
Undrawn £m £m
Covered bond programme 17,161 11,305 - - 11,305Securitisation programme 14,902 4,839 - 1,839 6,678Whole mortgage loan pools 13,455 - 12,080 1,375 13,455Total 45,518 16,144 12,080 3,214 31,438 The securitisation programme notes are issued by Silverstone Master Issuer plc. Silverstone Master Issuer plc is fully consolidated into the accounts of the Group.

Nationwide Building Society – Preliminary Results Announcement
Page 93 of 108
NOTES TO THE PRELIMINARY RESULTS ANNOUNCEMENT 10 Loans and advances to customers (continued) The whole mortgage loan pools are pledged at the BoE under the FLS. Notes are not issued when pledging the mortgage loan pools at the BoE. Instead, the whole loan pool is pledged to the BoE and drawings are made directly against the eligible collateral, subject to a haircut. Therefore, values shown under notes in issue are the whole mortgage loan pool notional balances. Mortgages pledged include £7.4 billion (2015: £9.5 billion) in the covered bond and securitisation programmes that are in excess of the amount contractually required to support notes in issue. Mortgages pledged are not derecognised from the Group balance sheet as the Group has retained substantially all the risks and rewards of ownership. The Group continues to be exposed to the liquidity risk, interest rate risk and credit risk of the mortgages. No gain or loss has been recognised on pledging the mortgages to the programmes. Notes in issue, held by the Group and drawn are whole mortgage loan pools securing amounts drawn under the FLS. At 4 April 2016 the Group had outstanding FLS drawings of £8.5 billion (2015: £8.5 billion). Notes in issue, held by the Group and undrawn, are debt securities issued by the programmes to the Group and mortgage loan pools that have been pledged to the BoE but not utilised. In accordance with accounting standards, notes in issue and held by the Group are not recognised by the Group in its balance sheet. The Group established the Nationwide Covered Bond programme in November 2005. Mortgages pledged provide security for issues of covered bonds made by the Group. During the year ended 4 April 2016 €3.3 billion (£2.4 billion sterling equivalent) of notes matured. During the year ended 4 April 2016 £0.8 billion and €4.3 billion (£3.9 billion sterling equivalent) of notes were issued. The Group established the Silverstone Master Trust securitisation programme in July 2008. Notes are issued under the programme and the issuance proceeds are used to purchase, for the benefit of note holders, a share of the beneficial interest in the mortgages pledged by the Group. The remaining beneficial interest in the pledged mortgages of £6.3 billion (2015: £8.2 billion) stays with the Group and includes its required minimum seller share in accordance with the rules of the programme. The Group is under no obligation to support losses incurred by the programme or holders of the notes and does not intend to provide such further support. The entitlement of note holders is restricted to payment of principal and interest to the extent that the resources of the programme are sufficient to support such payment and the holders of the notes have agreed not to seek recourse in any other form. During the year ended 4 April 2016 £0.2 billion, €1.1 billion and $0.6 billion (total £1.4 billion sterling equivalent) of notes matured. During the year ended 4 April 2016 £0.3 billion, €0.7 billion and $0.3 billion (total £1.0 billion sterling equivalent) of notes were issued.

Nationwide Building Society – Preliminary Results Announcement
Page 94 of 108
NOTES TO THE PRELIMINARY RESULTS ANNOUNCEMENT 11 Subordinated liabilities and subscribed capital
2016 £m
2015£m
Subordinated liabilities Subordinated notes 1,750 2,043Fair value adjustment for micro hedged risk 77 89Unamortised premiums and issue costs (10) (11)Total 1,817 2,121Subscribed capital Permanent interest bearing shares 362 362Fair value adjustment for micro hedged risk 68 74Unamortised premiums and issue costs (17) (21)Total 413 415 All of the Society’s subordinated notes and permanent interest bearing shares (PIBS) are unsecured. The Society may, with the prior consent of the Prudential Regulation Authority (PRA), repay the PIBS and redeem the subordinated notes early. The subordinated notes rank pari passu with each other and behind claims against the Society of all depositors, creditors and investing members, other than the holders of PIBS, Additional Tier 1 (AT1) capital and core capital deferred shares (CCDS). The PIBS rank pari passu with each other and the AT1 instruments, behind claims against the Society of the subordinated note holders but ahead of claims by the holders of CCDS. 12 Fair value hierarchy of financial assets and liabilities held at fair value IFRS 13 requires an entity to classify assets and liabilities held at fair value and those not measured at fair value but for which the fair value is disclosed according to a hierarchy that reflects the significance of observable market inputs in calculating those fair values. The three levels of the fair value hierarchy are defined below: Level 1 – Valuation using quoted market prices Assets and liabilities are classified as Level 1 if their value is observable in an active market. Such instruments are valued by reference to unadjusted quoted prices for identical assets or liabilities in active markets where the quoted price is readily available, and the price reflects actual and regularly occurring market transactions on an arm’s length basis. An active market is one in which transactions occur with sufficient volume and frequency to provide pricing information on an ongoing basis. Level 2 – Valuation technique using observable inputs Assets and liabilities classified as Level 2 have been valued using models whose inputs are observable in an active market. Valuations based on observable inputs include derivative financial instruments such as swaps and forwards which are valued using market standard pricing techniques, and options that are commonly traded in markets where all the inputs to the market standard pricing models are observable. They also include investment securities valued using consensus pricing or other observable market prices. Level 3 – Valuation technique using significant unobservable inputs Assets and liabilities are classified as Level 3 if their valuation incorporates significant inputs that are not based on observable market data (‘unobservable inputs’). A valuation input is considered observable if it can be directly observed from transactions in an active market, or if there is compelling external evidence demonstrating an executable exit price. An input is deemed significant if it is shown to contribute more than 10% to the valuation of a financial instrument. Unobservable input levels are generally determined based on observable inputs of a similar nature, historical observations or other analytical techniques.

Nationwide Building Society – Preliminary Results Announcement
Page 95 of 108
NOTES TO THE PRELIMINARY RESULTS ANNOUNCEMENT 12 Fair value hierarchy of financial assets and liabilities held at fair value (continued) The following tables show the Group's financial assets and liabilities that are held at fair value by fair value hierarchy, balance sheet classification and product type: Fair values based on Level 1 Level 2 Level 3 Total2016 £m £m £m £m
Financial assets
Government and supranational investments 6,843 - - 6,843
Other debt investment securities 1,011 2,758 - 3,769
Available for sale investment securities 7,854 2,758 - 10,612
Investments in equity shares (note i) - - 125 125
Interest rate swaps - 2,180 - 2,180
Cross currency interest rate swaps - 1,238 - 1,238
Forward foreign exchange - 44 - 44
Equity index swaps - - 436 436
Total derivative financial instruments - 3,462 436 3,898Other financial assets (note ii) - 2 - 2Total financial assets 7,854 6,222 561 14,637 Financial liabilities
Interest rate swaps - (3,103) (4) (3,107)
Cross currency interest rate swaps - (338) - (338)
Forward foreign exchange - (4) - (4)
Swaptions - (8) - (8)
Equity index swaps - - (1) (1)
Index linked swaps - (5) - (5)
Total derivative financial instruments - (3,458) (5) (3,463)
Other deposits - PEBs (note iii) - - (1,885) (1,885)Total financial liabilities - (3,458) (1,890) (5,348)

Nationwide Building Society – Preliminary Results Announcement
Page 96 of 108
NOTES TO THE PRELIMINARY RESULTS ANNOUNCEMENT 12 Fair value hierarchy of financial assets and liabilities held at fair value (continued) Fair values based on Level 1 Level 2 Level 3 Total2015 £m £m £m £m
Financial assets
Government and supranational investments 6,726 - - 6,726
Other debt investment securities (note iv) 1,033 3,266 12 4,311
Available for sale investment securities 7,759 3,266 12 11,037
Investments in equity shares (note i) - - 25 25
Interest rate swaps - 2,022 - 2,022
Cross currency interest rate swaps - 328 - 328
Forward foreign exchange - 76 - 76
Equity index swaps - - 911 911
Total derivative financial instruments - 2,426 911 3,337
Other financial assets (note ii) - 12 - 12
Total financial assets 7,759 5,704 948 14,411
Financial liabilities Interest rate swaps - (3,044) - (3,044)Cross currency interest rate swaps - (910) - (910)Forward foreign exchange - (76) - (76)Swaptions - (8) - (8)Equity index swaps - - (1) (1)Index linked swaps - (9) - (9)Total derivative financial instruments - (4,047) (1) (4,048)Other deposits - PEBs (note iii) - - (3,332) (3,332)Total financial liabilities - (4,047) (3,333) (7,380) Notes: i. Investments in equity shares are held at fair value and exclude £1 million of investments in equity shares which are held at cost. ii. Other financial assets represent the fair value of certain mortgage commitments included within other assets in the balance sheet. iii. Other deposits comprise PEBs which are held at fair value through the income statement. The remaining other deposits are held at
amortised cost and are included in note 14. iv. The prior year fair value for covered bond investment securities has been reclassified to Level 1, to better reflect the valuation
approach, consistent with the current year presentation. The Group’s Level 1 portfolio comprises liquid securities for which traded prices are readily available. Asset valuations for Level 2 available for sale investment securities are sourced from consensus pricing or other observable market prices. None of the Level 2 available for sale assets are valued from models. Level 2 derivative assets and liabilities are valued from discounted cash flow models using yield curves based on observable market data. More detail on the Level 3 portfolio is provided in note 13. Transfers between fair value hierarchies Instruments move between fair value hierarchies primarily due to increases or decreases in market activity or changes to the significance of unobservable inputs to valuation. There were no significant transfers between the Level 1 and Level 2 portfolios during the year.

Nationwide Building Society – Preliminary Results Announcement
Page 97 of 108
NOTES TO THE PRELIMINARY RESULTS ANNOUNCEMENT 13 Fair value hierarchy of financial assets and liabilities held at fair value – Level 3 portfolio The main constituents of the Level 3 portfolio are as follows: Available for sale investment securities The Group did not hold any Level 3 available for sale investment securities at 4 April 2016. During the period all investments were transferred from Level 3 to Level 2 due to changes in the availability of observable market prices. For the purpose of reporting movements between levels of the fair value hierarchy, transfers are recognised at the beginning of the reporting period in which they occur. Investments in equity shares The Level 3 investments in equity shares of £125 million at 4 April 2016 consist primarily of the investment in Visa Europe Limited and an interest in a fund which is supported by zero coupon bonds of an A rated bank. External valuations are used to obtain the fair value of this instrument. Derivative financial instruments Level 3 assets and liabilities in this category are primarily equity linked derivatives with external counterparties which economically match the investment return payable by the Group to investors in the PEBs product. The derivatives are linked to the performance of specified stock market indices and have been valued by an external third party. Fair value changes are recognised within gains/losses from derivatives and hedge accounting. Upon maturity the gain/loss is transferred to interest expense and similar charges. Other deposits – PEBs This category relates to deposit accounts with the potential for stock market correlated growth linked to the performance of specified stock market indices. The PEBs liability of £1,885 million (2015: £3,332 million) is valued at a discount to reflect the time value of money, overlaid by a fair value adjustment representing the expected return payable to the customer. The fair value adjustment has been constructed from the valuation of the associated derivatives as valued by an external third party. Fair value changes are recognised within gains/losses from derivatives and hedge accounting. Upon maturity the gain/loss is transferred to interest expense and similar charges. The minimum amount on an undiscounted basis that the Group is contractually required to pay at maturity for the PEBs is £1,551 million (2015: £2,585 million). The maximum additional amount which would also be payable at maturity in respect of additional investment returns is £636 million (2015: £1,080 million). The payment of additional investment returns is dependent upon performance of certain specified stock indices during the period of the PEBs. As noted above, the Group has entered into equity-linked derivatives with external counterparties which economically match the investment returns on the PEBs.

Nationwide Building Society – Preliminary Results Announcement
Page 98 of 108
NOTES TO THE PRELIMINARY RESULTS ANNOUNCEMENT 13 Fair value hierarchy of financial assets and liabilities held at fair value – Level 3 portfolio (continued) The tables below set out movements in the Level 3 portfolio, including transfers in and out of Level 3. Movements in Level 3 portfolio
Available for sale
investment securities
Investmentsin equity
shares
Net derivative financial
instruments
Otherdeposits -
PEBs
£m £m £m £m
At 5 April 2015 12 25 910 (3,332)Gains/(losses) recognised in the income statement:
Net interest income/(expense) - - 398 (439)(Losses)/gains from derivatives and hedge accounting - - (476) 465
Gains/(losses) recognised in other comprehensive income:
Fair value movement taken to members’ interests and equity - 100 - -
Settlements - - (401) 1,421
Transfers out of Level 3 portfolio (12) - - -At 4 April 2016 - 125 431 (1,885) Movements in Level 3 portfolio
Available for sale
investment securities
Investmentsin equity
shares
Net derivative financial
instruments
Otherdeposits -
PEBs
£m £m £m £m
At 5 April 2014 71 28 669 (3,222)Gains/(losses) recognised in the income statement:
Net interest income/(expense) - - 1 (50)Gains/(losses) from derivatives and hedge accounting - - 241 (245)Net impairment losses on investment securities (5) - - -
Gains/(losses) recognised in other comprehensive income:
Fair value movement taken to members’ interests and equity 1 (3)
- -
Settlements (55) - (1) 185At 4 April 2015 12 25 910 (3,332)
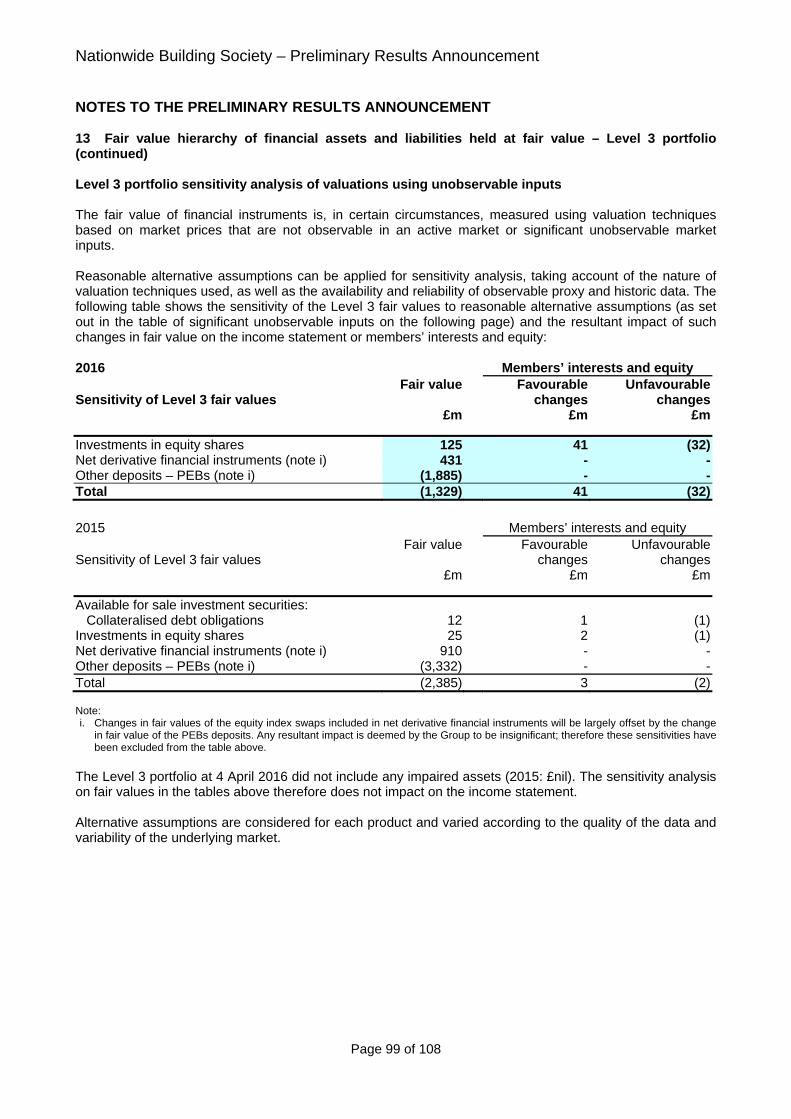
Nationwide Building Society – Preliminary Results Announcement
Page 99 of 108
NOTES TO THE PRELIMINARY RESULTS ANNOUNCEMENT 13 Fair value hierarchy of financial assets and liabilities held at fair value – Level 3 portfolio (continued) Level 3 portfolio sensitivity analysis of valuations using unobservable inputs The fair value of financial instruments is, in certain circumstances, measured using valuation techniques based on market prices that are not observable in an active market or significant unobservable market inputs. Reasonable alternative assumptions can be applied for sensitivity analysis, taking account of the nature of valuation techniques used, as well as the availability and reliability of observable proxy and historic data. The following table shows the sensitivity of the Level 3 fair values to reasonable alternative assumptions (as set out in the table of significant unobservable inputs on the following page) and the resultant impact of such changes in fair value on the income statement or members’ interests and equity: 2016 Members’ interests and equity
Sensitivity of Level 3 fair values Fair value Favourable
changes Unfavourable
changes £m £m £m
Investments in equity shares 125 41 (32)Net derivative financial instruments (note i) 431 - -Other deposits – PEBs (note i) (1,885) - -Total (1,329) 41 (32)
Note: i. Changes in fair values of the equity index swaps included in net derivative financial instruments will be largely offset by the change
in fair value of the PEBs deposits. Any resultant impact is deemed by the Group to be insignificant; therefore these sensitivities have been excluded from the table above.
The Level 3 portfolio at 4 April 2016 did not include any impaired assets (2015: £nil). The sensitivity analysis on fair values in the tables above therefore does not impact on the income statement. Alternative assumptions are considered for each product and varied according to the quality of the data and variability of the underlying market.
2015 Members’ interests and equity
Sensitivity of Level 3 fair values Fair value Favourable
changes Unfavourable
changes £m £m £m
Available for sale investment securities: Collateralised debt obligations 12 1 (1)Investments in equity shares 25 2 (1)Net derivative financial instruments (note i) 910 - -Other deposits – PEBs (note i) (3,332) - -Total (2,385) 3 (2)

Nationwide Building Society – Preliminary Results Announcement
Page 100 of 108
NOTES TO THE PRELIMINARY RESULTS ANNOUNCEMENT 13 Fair value hierarchy of financial assets and liabilities held at fair value – Level 3 portfolio (continued) The following table discloses the significant unobservable inputs underlying the above alternative assumptions for assets and liabilities recognised at fair value and classified as Level 3 along with the range of values for those significant unobservable inputs. Where sensitivities are described the inverse relationship will also generally apply.
2016
Total assets
£m
Totalliabilities
£m
Valuationtechnique
.
Significantunobservable
inputs
Range (note ii)
Weightedaverage(note iii)
Units(note iv)
Investments in equity shares
18 Mark to market Price 93.30 107.00 98.00 Points
107 Discounted cash flows Discount rate 10.00 12.00 11.00 %
Share conversion - 100.00 77.30 % Execution risk - 30.00 12.41 %
125 Net derivative financial instruments (note i) 431
Other deposits – PEBs (note i) (1,885)
2015
Total assets
£m
Totalliabilities
£m
Valuationtechnique
.
Significantunobservable
inputs
Range (note ii)
Weightedaverage(note iii)
Units(note iv)
Available for sale investment securities: Collateralised debt obligations 12 Mark to market Price 66.00 75.00 69.00 Points
Investments in equity shares 25 Mark to market Price 99.00 114.00 104.00 PointsNet derivative financial instruments (note i) 910
Other deposits – PEBs (note i) (3,332) Notes: i. Changes in fair values of the equity index swaps included in net derivative financial instruments will be largely offset by the change
in fair value of the PEBs deposits. Any resultant impact is deemed by the Group to be insignificant; therefore these sensitivities have been excluded from the table above.
ii. The range represents the values of the highest and lowest levels used in the calculation of favourable and unfavourable changes as presented in the previous table.
iii. Weighted average represents the input values used in calculating the fair values for the above financial instruments. iv. Points are a percentage of par; for example 100 points equals 100% of par. One basis point (bps) equals 0.01%; for example, 125
basis points (bps) equals 1.25%.

Nationwide Building Society – Preliminary Results Announcement
Page 101 of 108
NOTES TO THE PRELIMINARY RESULTS ANNOUNCEMENT 13 Fair value hierarchy of financial assets and liabilities held at fair value – Level 3 portfolio (continued) Some of the significant unobservable inputs used in fair value measurement are interdependent. Where this is the case, a description of those interrelationships is included below. Price Prices for securities that are marked to market, where the market is illiquid, and supporting price information is scarce, are typically subject to significant uncertainty. An increase in the price will directly cause an increase in fair value and vice versa. Discount rate The discount rate is used to determine the present value of future cash flows. The level of the discount rate takes into account the time value of money, but also the risk or uncertainty of future cash flows. Typically, the greater the uncertainty, the higher the discount rate. A higher discount rate leads to a lower valuation and vice versa. Share conversion Where the conversion of a security into an underlying instrument is subject to underlying security market pricing and contingent litigation risk, share conversion is factored in to the fair value. The higher the share conversion, the higher the valuation and vice versa. Execution risk Where a security is dependent on a future transaction taking place, and the occurrence of this is not certain, execution risk is factored into the security’s valuation. The greater the execution risk, the lower the valuation and vice versa.
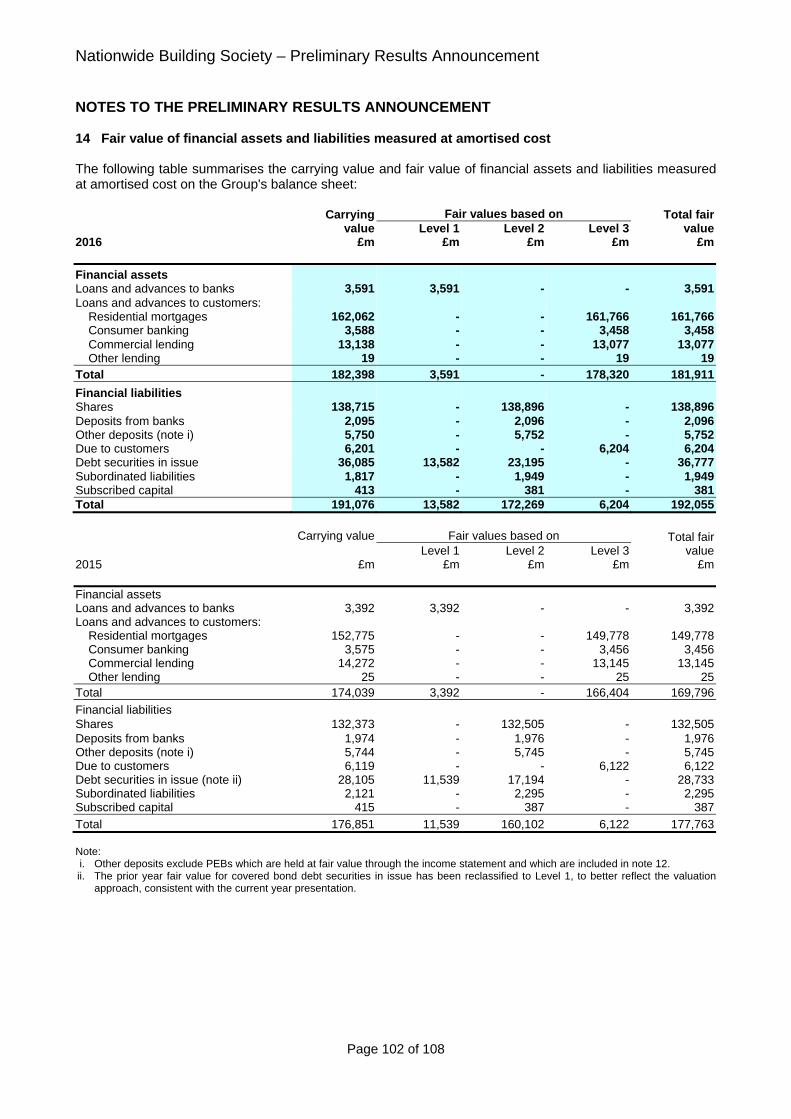
Nationwide Building Society – Preliminary Results Announcement
Page 102 of 108
NOTES TO THE PRELIMINARY RESULTS ANNOUNCEMENT 14 Fair value of financial assets and liabilities measured at amortised cost The following table summarises the carrying value and fair value of financial assets and liabilities measured at amortised cost on the Group's balance sheet: Carrying
valueFair values based on Total fair
value Level 1 Level 2 Level 3 2016 £m £m £m £m £m
Financial assets Loans and advances to banks 3,591 3,591 - - 3,591Loans and advances to customers:
Residential mortgages 162,062 - - 161,766 161,766Consumer banking 3,588 - - 3,458 3,458Commercial lending 13,138 - - 13,077 13,077Other lending 19 - - 19 19
Total 182,398 3,591 - 178,320 181,911
Financial liabilities Shares 138,715 - 138,896 - 138,896Deposits from banks 2,095 - 2,096 - 2,096Other deposits (note i) 5,750 - 5,752 - 5,752Due to customers 6,201 - - 6,204 6,204Debt securities in issue 36,085 13,582 23,195 - 36,777Subordinated liabilities 1,817 - 1,949 - 1,949Subscribed capital 413 - 381 - 381Total 191,076 13,582 172,269 6,204 192,055
Carrying value Fair values based on Total fair
value Level 1 Level 2 Level 3 2015 £m £m £m £m £m
Financial assets Loans and advances to banks 3,392 3,392 - - 3,392Loans and advances to customers:
Residential mortgages 152,775 - - 149,778 149,778Consumer banking 3,575 - - 3,456 3,456Commercial lending 14,272 - - 13,145 13,145Other lending 25 - - 25 25
Total 174,039 3,392 - 166,404 169,796
Financial liabilities Shares 132,373 - 132,505 - 132,505Deposits from banks 1,974 - 1,976 - 1,976Other deposits (note i) 5,744 - 5,745 - 5,745Due to customers 6,119 - - 6,122 6,122Debt securities in issue (note ii) 28,105 11,539 17,194 - 28,733Subordinated liabilities 2,121 - 2,295 - 2,295Subscribed capital 415 - 387 - 387
Total 176,851 11,539 160,102 6,122 177,763 Note: i. Other deposits exclude PEBs which are held at fair value through the income statement and which are included in note 12. ii. The prior year fair value for covered bond debt securities in issue has been reclassified to Level 1, to better reflect the valuation
approach, consistent with the current year presentation.

Nationwide Building Society – Preliminary Results Announcement
Page 103 of 108
NOTES TO THE PRELIMINARY RESULTS ANNOUNCEMENT 14 Fair value of financial assets and liabilities measured at amortised cost (continued) Loans and advances to customers The Group estimates the fair value of loans and advances to customers using consistent modelling techniques across the different loan books. The estimates take into account expected future cash flows and future lifetime expected losses, based on historic trends and discount rates appropriate to the loans, to reflect a hypothetical exit price value on an asset by asset basis. Variable rate loans are modelled on estimated future cash flows, discounted at current market interest rates. Variable rate retail mortgages are discounted at the currently available market standard variable interest rate (SVR) which, for example, in the case of the Group’s residential base mortgage rate (BMR) mortgage book generates a fair value lower than the amortised cost value as those mortgages are priced below the SVR. For fixed rate loans, discount rates have been based on the expected funding and capital cost applicable to the book. When calculating fair values on fixed rate loans, no adjustment has been made to reflect interest rate risk management through internal natural hedges or external hedging via derivatives. Shares, deposits and borrowings The estimated fair value of shares and deposits with no stated maturity, including non-interest bearing deposits, is the amount repayable on demand. The estimated fair value of fixed interest rate shares, deposits and other borrowings without quoted market prices represents the discounted amount of estimated future cash flows based on expectations of future interest rates, customer withdrawals and interest capitalisation. For variable interest rate deposits, estimated future cash flows are discounted using current market interest rates for new debt with similar remaining maturity. For fixed rate shares and deposits, the estimated future cash flows are discounted based on market offer rates currently available for equivalent deposits. Debt securities in issue The estimated fair values of longer dated liabilities are calculated based on quoted market prices where available or using similar instruments as a proxy for those liabilities that are not of sufficient size or liquidity to have an active market quote. For those notes for which quoted market prices are not available, a discounted cash flow model is used based on a current yield curve appropriate for the remaining term to maturity. 15 Offsetting financial assets and financial liabilities The Group has financial assets and liabilities for which there is a legally enforceable right to set off the recognised amounts, and which may be settled net. However the netting arrangements do not result in an offset of balance sheet assets and liabilities for accounting purposes as the right to set off is not unconditional in all circumstances. Therefore, in accordance with IAS 32 Financial Instruments: Presentation, there are no financial assets or liabilities which are offset with the net amount presented on the balance sheet. All financial assets and liabilities are presented on a gross basis. In accordance with IFRS 7 Financial Instruments: Disclosures, the following table shows the impact on derivative financial instruments and total return swaps relating to transactions where: there is an enforceable master netting arrangement or similar agreement in place but the offset criteria
are otherwise not satisfied, and financial collateral is paid and received. Master netting arrangements consist of agreements such as an ISDA Master Agreement, global master repurchase agreements and global master securities lending agreements, whereby outstanding transactions with the same counterparty can be offset and settled net following a default or other predetermined event.

Nationwide Building Society – Preliminary Results Announcement
Page 104 of 108
NOTES TO THE PRELIMINARY RESULTS ANNOUNCEMENT 15 Offsetting financial assets and financial liabilities (continued) Financial collateral on derivative financial instruments consists of cash and securities settled, typically daily or weekly, to mitigate the mark to market exposures. Financial collateral on total return swaps typically comprises highly liquid securities which are legally transferred and can be liquidated in the event of counterparty default. The net amounts after offsetting under IFRS 7 presented below show the exposure to counterparty credit risk for derivative contracts after netting benefits and collateral, and are not intended to represent the Group's actual exposure to credit risk. This is due to a variety of credit mitigation strategies which are employed in addition to netting and collateral arrangements. 2016 Gross and net
amounts reported on the balance
sheet
Master netting arrangements
Financial collateral
Net amounts after offsetting
under IFRS 7
£m £m £m £m Financial assets Derivative financial instruments 3,898 (2,020) (1,804) 74Total return swaps 87 - (87) -Reverse repurchase agreements 450 - (450) -Total financial assets 4,435 (2,020) (2,341) 74 Financial liabilities Derivative financial liabilities 3,463 (2,020) (1,391) 52Repurchase agreements 127 - (127) -Total financial liabilities 3,590 (2,020) (1,518) 52
2015 Gross and net
amounts reported on the balance sheet
Master netting arrangements
Financial collateral
Net amountsafter offsetting under IFRS 7
£m £m £m £m Financial assets Derivative financial instruments 3,337 (1,900) (1,386) 51Total return swaps 149 - (149) -Total financial assets 3,486 (1,900) (1,535) 51 Financial liabilities Derivative financial liabilities 4,048 (1,900) (2,129) 19Total financial liabilities 4,048 (1,900) (2,129) 19 The fair value of the financial collateral is the same as the values shown in the table above, except for the total return swaps collateral which has a fair value of £127 million (2015: £210 million) and the repurchase agreements collateral which has a fair value of £128 million (2015: £nil).

Nationwide Building Society – Preliminary Results Announcement
Page 105 of 108
NOTES TO THE PRELIMINARY RESULTS ANNOUNCEMENT 16 Core capital deferred shares (CCDS) Number of
sharesCCDS Share premium Total
£m £m £m At 4 April 2016 5,500,000 6 525 531At 4 April 2015 5,500,000 6 525 531 CCDS are a form of Common Equity Tier 1 (CET1) capital which have been developed to enable the Group to raise capital from the capital markets. Previously issued Tier 1 capital instruments, PIBS, no longer meet the regulatory capital requirements of CRD IV and are being gradually phased out of the calculation of capital resources under transitional rules. CCDS are perpetual instruments. They rank pari passu to each other and are junior to claims against the Society of all depositors, creditors and investing members. Each holder of CCDS has one vote, regardless of the number of CCDS held. In the event of a winding up or dissolution of the Society and if there was surplus available, the amount that the investor would receive for each CCDS held is limited to the average principal amount in issue, which is currently £100 per share. There is a cap placed on the amount of distributions that can be paid to holders of CCDS in any financial year. The cap is currently set at £15.32 per share and is adjusted annually in line with CPI. A final distribution of £28 million (£5.125 per share) for the financial year ended 4 April 2015 was paid on 22
June 2015 and an interim distribution of £28 million (£5.125 per share) in respect of the period to 30 September 2015 was paid on 21 December 2015. These distributions have been recognised in the statement of movements in members’ interests and equity. The directors have declared an unconditional final distribution of £5.125 per share in respect of the financial year ended 4 April 2016, amounting in aggregate to £28 million. The distribution will be recognised in the statement of movements in members’ interests and equity in the financial year ended 4 April 2017. 17 Other equity instruments Total £m At 4 April 2016 992At 4 April 2015 992 AT1 instruments rank pari passu to each other and to PIBS. They are junior to claims against the Society of all depositors, creditors and investing members, other than the holders of CCDS. AT1 instruments pay a fully discretionary, non-cumulative fixed coupon at an initial rate of 6.875% per annum. The rate will reset on 20 June 2019 and every five years thereafter to the five year mid swap rate plus 4.88%. Coupons are paid semi-annually in June and December. A coupon of £34 million, covering the period to 19 June 2015, was paid on 22 June 2015 and a coupon of £34 million, covering the period to 20 December 2015, was paid on 21 December 2015. These payments have been recognised in the statement of movements in members’ interests and equity. A coupon payment of £34 million, covering the period to 20 June 2016, is expected to be paid on 20 June 2016 and will be recognised in the statement of movements in members’ interests and equity in the financial year ended 4 April 2017. The coupons paid and declared represent the maximum non-cumulative fixed coupon of 6.875%.

Nationwide Building Society – Preliminary Results Announcement
Page 106 of 108
NOTES TO THE PRELIMINARY RESULTS ANNOUNCEMENT 17 Other equity instruments (continued) AT1 instruments have no maturity date. They are repayable at the option of the Society on 20 June 2019 and on every fifth anniversary thereafter. AT1 instruments are only repayable with the consent of the PRA. If the fully-loaded CET1 ratio for the Society, on either a consolidated or unconsolidated basis, falls below 7% the AT1 instruments convert to CCDS instruments at the rate of one CCDS share for every £80 of AT1 holding. 18 Contingent liabilities During the ordinary course of business the Group is subject to complaints and threatened or actual legal proceedings, as well as regulatory reviews, challenges and investigations. All such material matters are periodically reassessed, with the assistance of external professional advisers where appropriate, to determine the likelihood of incurring a liability. Where it is concluded that it is more likely than not that a payment will be made a provision is recognised based on management’s best estimate of the amount that will be payable. For other matters no provision is recognised but disclosure is made of items which are potentially material, either individually or in aggregate, except in cases where the likelihood of a liability crystallising is considered to be remote. Currently the Group does not expect the ultimate resolution of any such matters to have a material adverse impact on its financial position. 19 Related party transactions Related party transactions in the year ended 4 April 2016 are similar in nature to those included in the Annual Report and Accounts 2015. Loans to key management personnel, undertaken on normal commercial terms, were £1.4 million (4 April 2015: £0.9 million).

Nationwide Building Society – Preliminary Results Announcement
Page 107 of 108
NOTES TO THE PRELIMINARY RESULTS ANNOUNCEMENT 20 Notes to the cash flow statement
2016 2015 £m £mNon-cash items included in profit before tax Net decrease in impairment provisions (209) (636)Net increase/(decrease) in provisions for liabilities and charges 48 (15)Impairment (recoveries)/losses on investment securities (8) 18Depreciation, amortisation and impairment 325 294Profit on sale of property, plant and equipment (5) (2)Loss on the revaluation of land and buildings 3 -Interest on subordinated liabilities 99 115Interest on subscribed capital 26 42(Gains)/losses from derivatives and hedge accounting (note i) (39) 20Total 240 (164) Changes in operating assets and liabilities Loans and advances to banks 142 (4)Net derivative financial instruments and fair value adjustment for portfolio hedged risk (note ii)
(971) 1,059
Loans and advances to customers (7,951) (3,470)Other operating assets (420) (198)Shares 6,342 1,905 Deposits from banks, customers and others (1,238) 1,842 Debt securities in issue 1,613 (582)Deferred taxation (note ii) 136 23Retirement benefit obligations (73) 51Other operating liabilities 7 (199)Total (note ii) (2,413) 427 Cash and cash equivalents
Cash 8,797 4,325Loans and advances to banks repayable in 3 months or less 3,266 2,925Total 12,063 7,250 Notes: i. Comparatives have been restated as detailed in note 2. ii. Amounts in relation to derivative financial instruments and fair value adjustment for portfolio hedged risk and deferred taxation are
presented on a net basis; comparative information has been reclassified to conform to the current year presentation. Accordingly, changes in operating assets and liabilities are presented on a net basis, whereas in the prior year operating assets and liabilities were presented separately.
The Group is required to maintain balances with the Bank of England and certain other central banks which, at 4 April 2016, amounted to £325 million (2015: £319 million). These balances are included within loans and advances to banks on the balance sheet and are not included in the cash and cash equivalents in the cash flow statement as they are not liquid in nature. 21 Other matters On 2 November 2015, Visa Inc. announced the proposed acquisition of Visa Europe Limited. The Group is a principal member and shareholder of Visa Europe Limited and in exchange for its share will receive a combination of cash and preferred stock. The Group’s share of the consideration payable on completion is approximately 1% of the total proceeds. The preferred stock will be convertible into Visa Inc. common stock at a future date provided conditions to the transaction closing are met. The conversion of the preferred stock remains subject to potential reduction for certain litigation losses that may be incurred by Visa Europe Limited. On completion of the transaction, the Group expects to recognise a gain in the income statement.

Nationwide Building Society – Preliminary Results Announcement
Page 108 of 108
RESPONSIBILITY STATEMENT The Directors confirm that the financial statements, prepared in accordance with International Financial Reporting Standards as adopted by the EU, give a true and fair view of the assets, liabilities, financial position and income and expenditure of the Group as required by the Disclosure and Transparency rules (DTR 4.1.12). The Chief Executive’s Review and the Financial Review together include a fair review of the development and performance of the business and the Group, and taken together with the primary financial statements, supporting notes and the Business and Risk Report provide a description of the principal risks and uncertainties faced. A full list of the board of directors will be disclosed in the Annual Report and Accounts 2016. Signed on behalf of the Board by Mark Rennison Group Finance Director 23 May 2016 OTHER INFORMATION The financial information set out in this announcement which was approved by the Board on 23 May 2016 does not constitute accounts within the meaning of section 73 of the Building Societies Act 1986. The Annual Report and Accounts 2015 have been filed with the Financial Conduct Authority and the Prudential Regulation Authority. The Independent Auditors’ Report on the Annual Report and Accounts 2015 was unqualified. The Annual Report and Accounts 2016 will be lodged with the Financial Conduct Authority and the Prudential Regulation Authority following publication. A copy of this Preliminary report is placed on the website of Nationwide Building Society, nationwide.co.uk, from 24 May 2016. The Directors are responsible for the maintenance and integrity of information on the Society’s website. Information published on the internet is accessible in many countries with different legal requirements. Legislation in the United Kingdom governing the preparation and dissemination of financial statements may differ from legislation in other jurisdictions. CONTACTS Media queries: Stuart Williamson Tel: 0207 261 6215 Mobile: 07545 740 195 [email protected] Alan Oliver Tel: 0207 261 6201 Mobile: 07850 810 745 [email protected]
Investor queries: Sarah Gardiner Tel: 0845 602 9053 Mobile: 07720 426 180 [email protected]