national subsea research initiative · mike reuss-newland, ... • case study 1 –loss of...
TRANSCRIPT

www.nsri.co.uk
National Subsea Research Initiative
Condition Monitoring Workshop - Aberdeen
NSRI – the focal point for Research and Development for the UK subsea industry
Dr. Gordon Drummond
2017

www.nsri.co.uk
No fire alarms
Safety stuff

www.nsri.co.uk
AGENDA
10:00 - Introduction & Welcome
10:10 - The size of the prize: our performance in terms of subsea equipment failures
10:30 - How “Smart Data” has become the new “Big Data”
11:00 - Sensory Systems, Existing Subsea Capability, and the Opportunity for development
11:30 - Data analytics and Intelligence, Existing state of the art, what might it
bring to subsea Integrity Management
12:00 - NERC Funding opportunities to support monitoring
12:20 - Lunch
13:15 - Table Workshops
14:30 - Coffee & Networking
15:00 - Wash-up & review of ideas from tables
15:45 - Who’s doing what?
16:00 - ENDS

www.nsri.co.uk
A ‘not for profit’, industry led, expertly guided organisation
To enhance the UK’s position as the leading technology provider for the subsea industry
The technology arm of Subsea UK
Who we are
www.nsri.co.uk
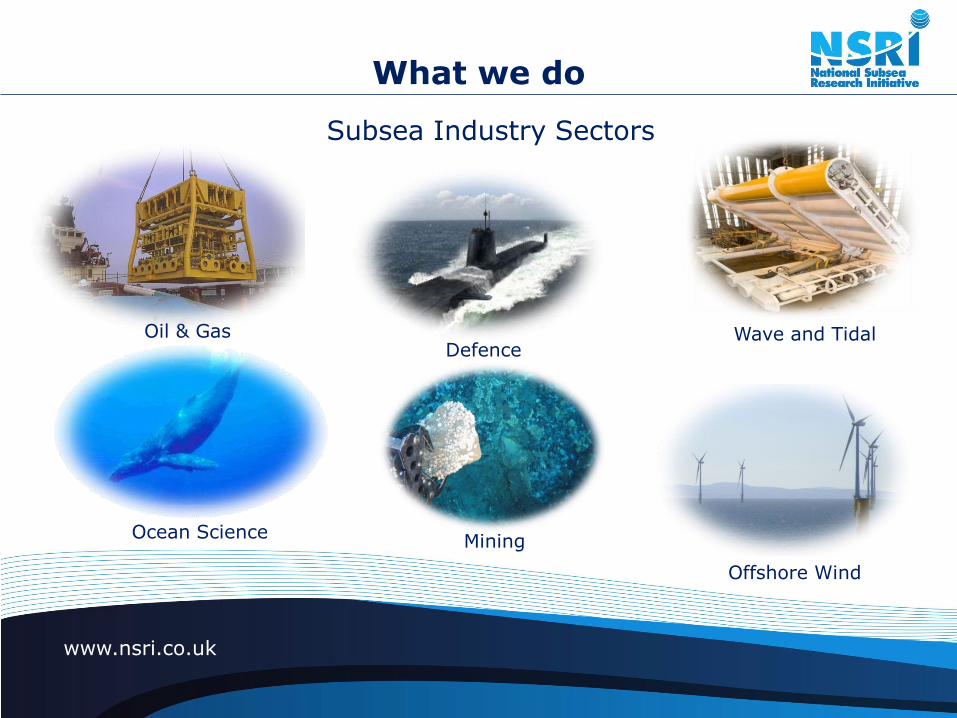
Oil & GasDefence
Wave and Tidal
Ocean Science
Offshore Wind
Mining
What we do
Subsea Industry Sectors

www.nsri.co.uk
Determine the barriers / challenges / issues preventing widespread usage of condition
monitoring and predictive maintenance and therefrom develop a list of the technical issues
that need to be overcome and how to overcome them
Form collaborative teams to pursue projects
Objective of the day

www.nsri.co.uk
• Issued to all delegates a “technology roadmap” of issues, their resolution and further work.
Deliverable from the day

www.nsri.co.uk
• The size of the prize: our performance in terms of subsea equipment failures
• How “Smart Data” has become the new “Big Data”
• Sensory Systems, Existing Subsea Capability, and the Opportunity for development
• Data analytics and Intelligence, Existing state of the art, what might it bring to subsea Integrity Management
• NERC Funding opportunities to support monitoring
Format of the day

www.nsri.co.uk
• Lunch• Workshop
• Tables chaired and scribed in the following themes:
2 x Integrity Management
2 x Sensors & devices
2 x Communications
2 x Data Analytics
• Swap at half time
Format of the day

www.nsri.co.uk
Overview • Economics
• Governing Law
• Failure modes

www.nsri.co.uk
17 million Boe in 2015 deferred production
= 46,500 Boe per day ; £2.8 million per day
Sounds like a prize worth pursuing
But, 1 well ~5000 bbpdTherefore ~10 wells out of service out of a
population of 500 ~ 2%
UKCS numbers

www.nsri.co.uk
One new generation Operator
Barriers to achieving full potential;
1. Optimised production possible if all key data was available from all subsea wells every day as per original design.
2. Intervention to changeout/modify/repair subsea hardware continues to have significant economic obstacle with vessel costs.
Estimate 1% lost potential Production”
Some snippets of information

www.nsri.co.uk
Worldwide Subsea Performance: Major operator 2010-16

www.nsri.co.uk
Uptime > 95%
Therefore:
Scheduled and Unscheduled < 5%
Some snippets of information
www.nsri.co.uk
Overview • Economics
• Governing Law
• Failure modes

www.nsri.co.uk
The Management of Health and Safety at work Regulations 1999
requires every employer to
• Make a suitable and sufficient risk assessment• Make and give effect to such arrangements as are
appropriate…for the effective planning, organisation, control, monitoring and review of preventative and protective measures
in order to ensure, as far as reasonably practicable, the health safety and welfare of all his employees (and those not in his employ, but affected by his activities)
Governing law

www.nsri.co.uk
The Management of Health and Safety at work Regulations 1999
• Corrosion
• Defective conditions
• Human Error (includes flow assurance)
Failure to Comply

www.nsri.co.uk
Failure to Comply
Threats
Time
dependent Stable Random

www.nsri.co.uk
Leakage (DNV RP116)
• Impact = trawling
• Anchors drags (separate)
• Corrosion dominated by internal corrosion (twice
as many)
• Ref Parloc 1069 steel lines

www.nsri.co.uk
Incidents – (not necessarily leaks) DNV RP 116
www.nsri.co.uk
Overview • Economics
• Governing Law
• Failure modes

www.nsri.co.uk
Failure modes
Human Error Time
Dependent
Stable Random /
Time Independent
Trawler damage x
Dropped objects x
Anchor damage x
Design errors X
Operator pressure overload x

www.nsri.co.uk
Failure modes
Human Error Time
Dependent
Stable Random /
Time Independent
Wax x x
Hydrates x x

www.nsri.co.uk
Failure modes
Corrosion Time
Dependent
Stable Random /
Time Independent
Internal corrosion x
External corrosion x
Internal erosion x
Microbiological induced corrosion (SRB) x
Internal Stress Corrosion Cracking (SCC) x

www.nsri.co.uk
Failure modes
Corrosion Time
Dependent
Stable Random /
Time Independent
Hydrogen Embrittlement x
AC corrosion x

www.nsri.co.uk
Failure modes
Defective conditions Time
Dependent
Stable Random /
Time Independent
Free spans - vibration x
Free spans – self weight yield x
Fatigue of material, construction defect x
Material, manufacturing, construction
defects
x

How smart data has become the new big data
Presented by
Gavin Rogers, Research, Development and Innovation Manager
Mike Reuss-Newland, Lead Controls Engineer

From Industry 1.0 to Industry 4.0
30

Smart Data is the new Big Data
31

High costs following sustained industry growth
Oil/gas oversupply driving low prices
- Higher bandwidth communications (fibre optics)
- Higher processing power
- Connectivity, offshore and onshore
- Technology gains in monitoring and inspection
- Availability of Data:
- Much more data available than ever before,
only a small amount of which is used
- Value-driven environment
- Efficient technology solutions
- Data-driven environment
- Safety-driven improvements
- Key enabler to development and continued
production
- Innovation in inspection and condition monitoring
is an enabler to efficiency
- So is optimal data use. Big data is not smart
data “typical offshore rig has 30,000 sensors
capturing millions of data points yet less than 1%
of this data is used for decision making.”
(McKinsey)

33
CASE STUDY # 1

Insulation Resistance Example
34
Power Distribution
1. Umbilical
2. UTA to SDU jumper
3. SDU
4. TSCJ to 901
5. TSCJ to 902

Insulation Resistance Example
35
• Case study 1 – Loss of insulation resistance:
• EPU insulation resistance
• MCS communications failure rate
• SCM house keeping data

Insulation Resistance Example
36
• Case study 1 – Loss of insulation resistance:
• EPU insulation resistance
• MCS communications failure rate
• SCM house keeping data

Insulation Resistance Example
37
Limit of LIM device 1 MΩ
LIM alarm 250 kΩ
LIM trip 50 kΩ

Insulation Resistance Example
38
One month trend,
February 2011

Insulation Resistance Example
39
Three year trend.

Insulation Resistance Example
40
February 2011.

Insulation Resistance Example
41
15 month period.
1 MΩ.
400 kΩ.
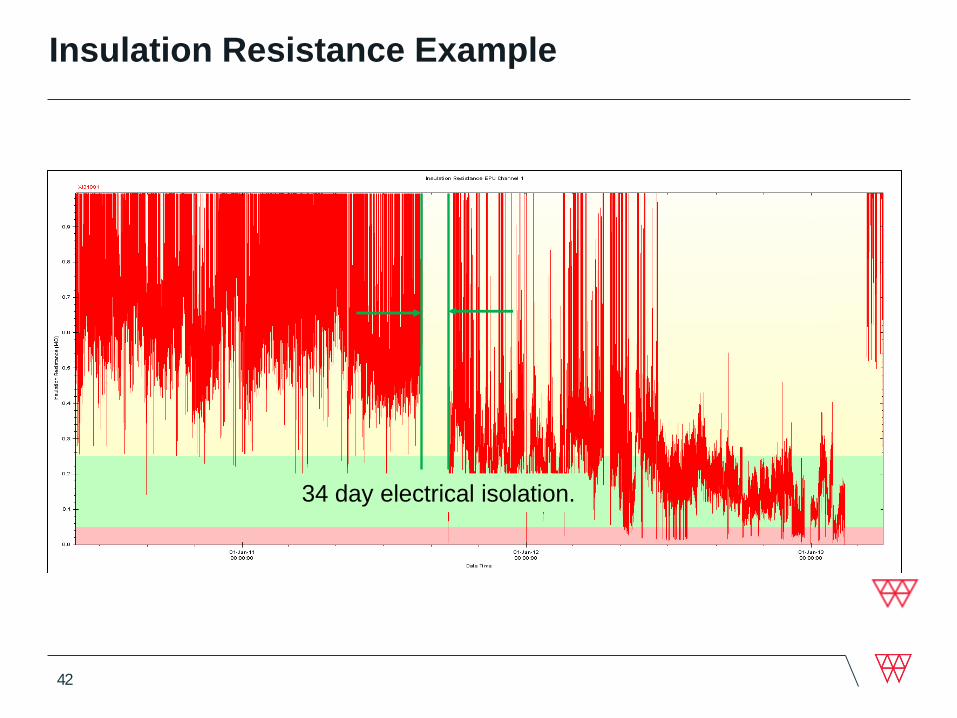
Insulation Resistance Example
42
34 day electrical isolation.

Insulation Resistance Example
43
22nd September 2011.

Insulation Resistance Example
44
5 kΩ.22nd September 2011.

Insulation Resistance Example
45
1st January 2012.

Insulation Resistance Example
46
3 day electrical
isolation
500 Ω
1st January
2012.

Insulation Resistance Example
47
Location of the fault
1. Umbilical
2. UTA to SDU jumper
3. SDU
4. TSCJ to 901
5. TSCJ to 902

Insulation Resistance Example
48
10 month
falling trend.
Insulation Resistance Example
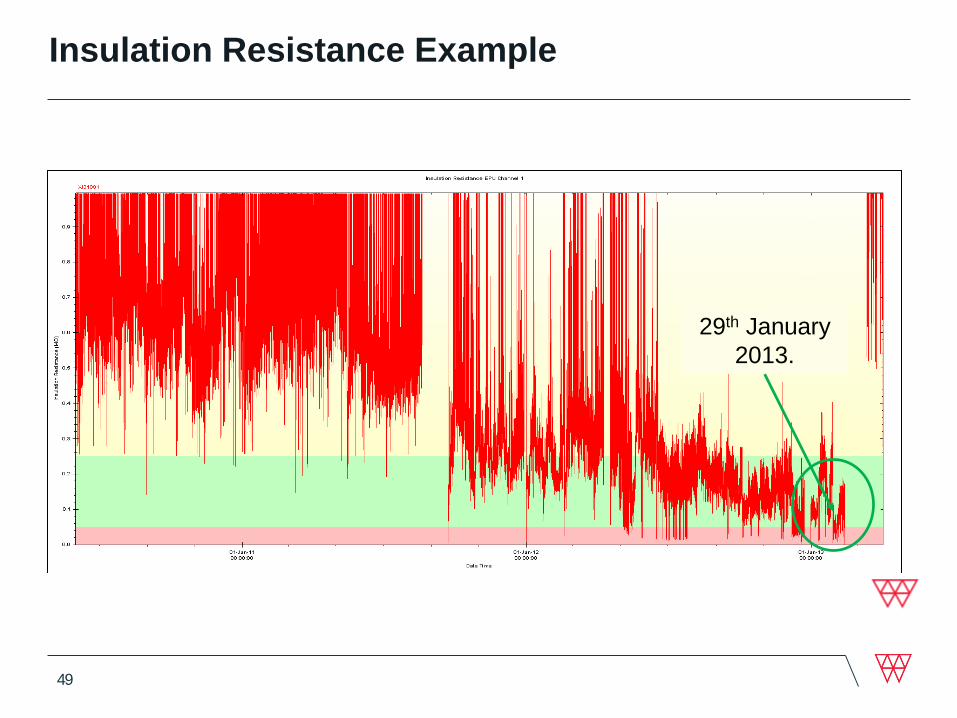
49
29th January
2013.

Insulation Resistance Example
50
Insulation resistance drop
no shutdown

Insulation Resistance Example
51
Insulation resistance drop
no shutdown
29/01/2013 at 09:30

Insulation Resistance Example
52
• Case study 1 – Loss of insulation resistance:
• EPU insulation resistance
• MCS communications failure rate
• SCM house keeping data

Insulation Resistance Example
53
Separate power and
communications
distribution
systems

Insulation Resistance Example
54
Only one component
in common:
Subsea Distribution
Unit (SDU).

Insulation Resistance Example
55
SCM 902
SCM 901
Communications errors
running total

Insulation Resistance Example
56
SCM 902
SCM 901
Flat line
No new errors recorded

Insulation Resistance Example
57
SCM 902
SCM 901
29/01/2013 at 09:30

Insulation Resistance Example
58
SCM 901
More communications errors on
SCM 902
SCM 902

Insulation Resistance Example
59
• Case study 1 – Loss of insulation resistance:
• EPU insulation resistance
• MCS communications failure rate
• SCM house keeping data
Insulation Resistance Example
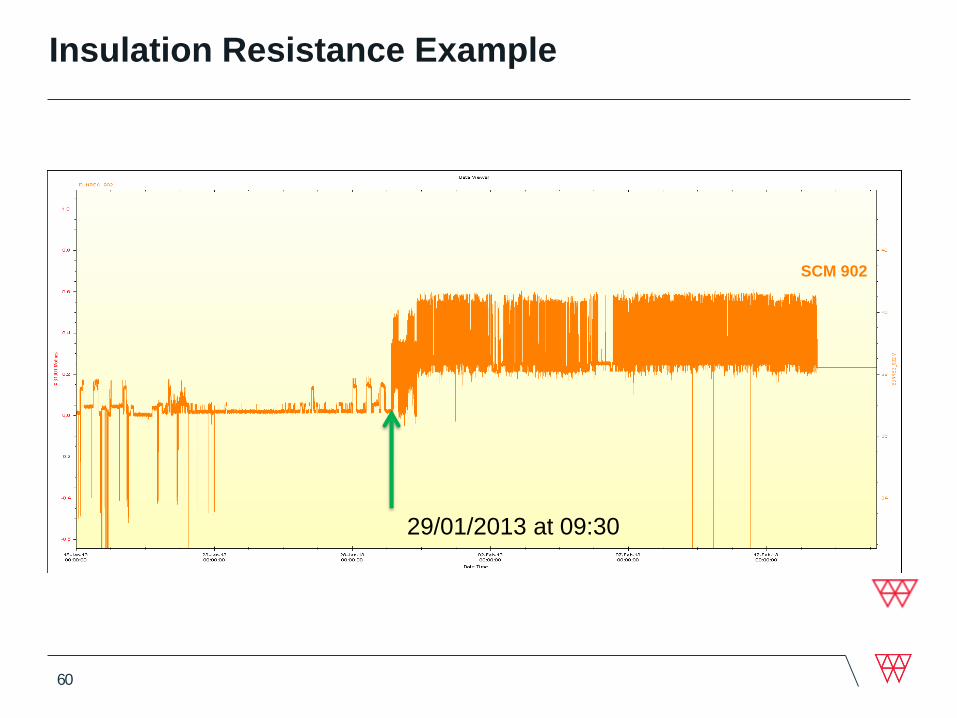
60
29/01/2013 at 09:30
SCM 902

Insulation Resistance Example
61
Sudden jump in voltageSCM 902

Insulation Resistance Example
62
Sudden increase in
interference
SCM 902

Insulation Resistance Example
63
SCM 902 effected more than SCM 901
SCM 901
SCM 902

Insulation Resistance Example
64
• Insulation resistance
• Communication failure rate
• SCM house keeping
• All implicate SCM 902 more than SCM 901
• Due to inductive couplers at the SCMMB the
SCM can be ruled out
• This identified the SDU or TSCJ for SCM 902
as the most probable source of the fault
Insulation Resistance Example
65
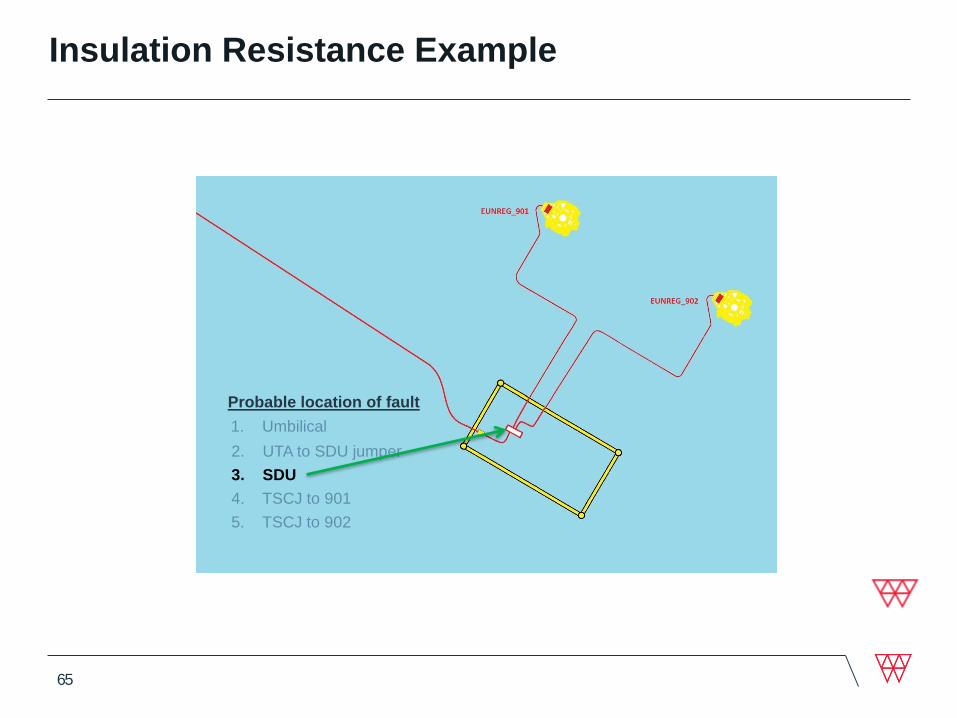
Probable location of fault
1. Umbilical
2. UTA to SDU jumper
3. SDU
4. TSCJ to 901
5. TSCJ to 902

Insulation Resistance Example
66
1. Umbilical
2. UTA to SDU jumper
3. SDU
4. TSCJ to 901
5. TSCJ to 902
Probable location of fault

Insulation Resistance Example
67
Location of the fault
TSCJ connector to SDU

Insulation Resistance Example
68

Insulation Resistance Example
69
• No condition monitoring:
• Long lead items 16 week delivery
• Manufacturing 2 to 4 weeks
• Lost production 10,250 bpd
• Lost production £59,340,000Note:
• Calculation based on 20 weeks lost production, Brent Crude oil price (19/04/2017) of $53.01 per barrel and
an exchange rate of $1 = £0.78 the lost production would have been £59,334,093.
• Based on the Brent Crude oil price at the time of the event, 29/01/2013 of $115.22 per barrel and an
exchange rate of $1 = £0.6351 the lost production would have been £105,007,878.

Insulation Resistance Example
70
• With condition monitoring:
• Condition monitoring gave 17 months notice of a
failure
• Spares were purchased and dive procedures
written;
• The most probable location of the failure was
identified prior to the DSV sailing

Insulation Resistance Example
71
• With condition monitoring:
• Production was restored within 8 days of the failure
• Lost production £3,390,000
• Saving £55,950,000
Note:
• Based on the Brent Crude oil price on 29/01/2013 of $115.22 per barrel and an exchange rate of $1 = £0.6351 the savings
were £99,007,427.

72
CASE STUDY # 2

73
Joint Cognitive
System Approach
(Human + Ai)
Post-doc data scientists working with Wood Group
dedicated to predictive maintenance development
Data
analyst
SME

Time Series Data Analysis, Diagnostics and Prediction74
Asset map view dashboard
reading latest CBM data /
reporting
Degrading, failed or other watch list
equipment flagged with clickable links
to key sensor data
Summary data for
all map components
available on hover

75
CASE STUDY # 3

76
ASD pattern
detection signal
parameter tuning
GUI
Choke valve movement
+ ASD event
Automated alarm
signal extraction
and classificationAutomated detection and
visualization of concurrent events

Driving disruptive change in inspection and
monitoring
- Less focused
- Value-driven, inspection and monitoring
- Why to inspect and what for?
- Focus on leading / lagging indicators of failure
- Subsea infrastructure
- AUV Pipeline inspections
- Infield ROV for normal infield inspection
Using machine vision to automatically detect
anomalies
- Drone inspection of onshore
pipelines/infrastructure
- Safety-driven inspection innovation

Evolution from all data flowing back to value
data flows enabled by analytics in the field
(requiring less bandwidth)
Data is only as good as the sensors
producing it and their reliability
- Communications
- Discrete sensing
- Distributed sensing
- Relatively low cost and reliable
- Potential for all-fibre-optic monitoring
systems? (could this be a realistic offering?)

• Industry and economic forces driving disruptive change
• Search for efficient, lower cost, risk-based, innovative and reliable solutions
• Key developments– value-driven (smart) inspection and monitoring
– autonomous and robotic vehicles and inspection systems
– data analytics and edge analytics
– Fibre-optics monitoring/sensing and comms.
– Innovative technologies that deliver value
• Need to adapt to survive….
Summary
79


Subsea Condition Monitoring and Predictive analysis
Subsea UK, NSRI, The DataLab and CENSIS workshop 25 April 2017

The Innovation Centres
Introduction & what we do
Case studies
Trends in SIS
Subsea, trends and sensing

The Innovation Centres

Innovation ecosystem - Scotland
Scottish
Government
Highlands
& Islands
Enterprise
Scottish
Enterprise
Scottish
Funding
Council
SFC
Innovation
Centres
SAIC
IBioIC
OGIC
SMS-IC
The
Data
Lab
DHI
CSIC
CENSIS
UK
Government
Innovate
UK
Scotland
Europa
SDI
SMAS
European
Union
Scottish
Universities
Interface
Scottish
Businesses
Catapult
Centres
ORE
HVM
SoXSA
Trade
Associations
ScotlandIS
Transport
Systems
Precision
Medicine
Medicines
Discovery
Future
Cities
Energy
Systems
Digital
CSA
Cell &
Gene
Therapy
SULSA SINAPSE
MASTS
ScotCHEM
SICSA
ETP SUPA
SRPE
SAGES
SIRE
Scottish
Energy
Association
Scotland
Food &
Drink
Scottish
Engineering
Scottish
Renewables
AFRC
Scottish Innovation Ecosystem
KTP
Centres
North of
Scotland
East of
Scotland
West of
Scotland
LINC
Scotland
Intermediaries
CeeD
SHIL
Technology
Scotland
Fisheries
Innovation
Scotland
Industry
Technology
Facilitator
Targeting
Innovation
RTOs Scottish
Association
Marine
Science
Fraunhofer
Applied
Photonics
Moredun
Research
Institute
TUV
NEL
James
Hutton
Institute
Roslin
Institute
Scotch
Whisky
Research
Institute

Direct Support: Glasgow and Aberdeen
Supply Chain & Research Staff
Space, Skills and Software
Stakeholders and Support
• Full Scottish supply chain
• Researchers across all HEIs
• IoT Centre• Industry-experienced engineers
•Hardware, software and tools
•Hot desk space
• Integration - SE/HIE/SDI and Govt packages
•Engagement & referral- incCatapults, other ICs and industry bodies

Progressing new products and markets

IoT Centre
An Identified need for end to end mentoringEnabled delivery of IoT BoostSME challenges fast tracked into IoT products and services
• Demo space, drop-in centre, seminars, mentoring
• Engineering support
Developed with support that includes:
Av. 1 per month since launch mid 2015

R
A
D
I
O
M
I
C
R
O
S
E
N
S
O
R
Intel Galileo
Arduino
Freescale Freedom
Beaglebone
Libellium Waspmote Raspberry Pi
TI CC3200
Gas
WifiXbee Zigbee WifiBLE
TI CC2650
Wifi, BLE, 6lowpan,Zigbee
9 DOF IMU
6lowpan
GPS
Ultrasonic range finder Camera
Barometric Pressure
Temperature Humidity
Red Pitaya
IR camera
PIR (motion)
Multi protocol platform
RTK
Using best in class /disruptive IoT device enablement tools and kits

Engagement models
Supporting projects
Vision
Feasibility
Review & Positioning
Funding and Partnering
IoT Centre
Demonstrators and test beds
Planning & Scoping

Case studies

Partners: Thales UK Glasgow, CENSIS and the University of the West of Scotland
Challenge Project Impact
• Low-pixel automatic target and recognition
• Recognition of objects based on data from sensors
• Auto detect people and vehicles
• Identify vehicle type
• Operate in real time with limited processing hardware
• UWS expertise in image processing and object detection algorithms
• Develop algorithms using low-resolution thermal image data

Partners: Topolytics, University of St Andrews and CENSIS
• Environmental sensing measures CO2, wind speed, precipitation, humidity, sulphates, particulates etc.
• ‘Data noise’ creates challenges: how do we filter innocuous readings from those requiring action?
• Sensors age and degrade over time: how do we ensure data reflects conditions on the ground?
• Sensing Environmental Risk
• Statistical models from St Andrews Uniincorporated to Topolytics SW platform for real-time, accurate gas emissions
• In collaboration with:
• Increase confidence in data.
• Better understanding of environmental impact
• More effectively monitor waste
• Potential new commercial offerings in a market valued at $20Bn by 2020
Challenge Project Impact
ANE FOR A'

Challenge Project Impact
• Data gathered by Scottish Water in operational environments is not being used to extract maximum value
• SW assets often situated in remote/demanding environments
• Signal processing advances can bring new value to existing data
• New techniques will identify key signatures in data
• Decision support for management ofwater and wastewater assets
• The establishment of a high-qualitydecision support environment tooptimise equipment in the field
• Transforming asset management
• Timely and planned intervention for repairs and maintenance
• Significant cost savings
• Potential worldwide interest
Partners: Scottish Water, CENSIS and University of Strathclyde

Trends in SIS

Trends Challenges Drivers
Trends and drivers
Power efficiency
Fusion &Miniaturisation
Cost reduction
Diverse communications
Battery life, deep sleep, energy harvesting
Packaging, accuracy and sensitivity
Local processing, bandwidth considerations
Spectrum space, bandwith, range, quality of signal, real time & more
Intelligent edge devices
Ubiquity, ’lick and stick’
Smart devices, wearables
LPWAN, distributed networks
Sense everything
Remote monitoring
IoT, wireless sensing

Servitisation
Source: PWC Industry 4.0 Building The Digital Enterprise

Mass Production
$

Product with Parts
$
$$

Product with SLA - Servitisation
$
$

Connectivity and Service Optimisation
$
$

Data Monetisation
$$
$
Information Ecosystem
$$
$
$

Subsea trends and sensors

Subsea Trends
Unprecedented level of cost-focus is changing the dynamics of the market
There is an increasing interest in sensor data to enable reduction in total cost of ownership (CAPEX and OPEX) of subsea assets.
Data transformed to useful information is now seen as higher value and is changing how partnerships are formed in the subsea ecosystem.
Move towards standardisation and modularity to reduce costs

LPWAN position in Topside Wireless?
Licensed exempt ISM bands globally• 868MHz EU, 915MHz USA, ASIA 470MHz
Sub 1GHz has exceptional RF characteristics
• Ideal for connecting sensors in:
Remote locations, long range >10Km
Deep inside buildings or underground
Designed for small IoT data packets • Less than 1000 bytes a day (typical)
• Long Battery life – up to 10 years
Simple network infrastructure • >10K end devices per base station/gateway
Low cost Capex and Opex
Essential for a heterogeneous IoTnetwork
• Up to 75% of IoT connections are predicted to be viable for LPWAN in 2022
Data rate (Mbps)0.01 100
RFID
NFC
Bluetooth
ZigBeeWiFi
GSM – LTECellular
2G, 3G. 4G
IoTLPWAN
Satellite
LAN
WAN

Wireless in the subsea world
100bps
1kbps
10Mbps
100Mbps
1Mbps
100kbps
10kbps
1 10 100 1000 10000
Ban
dw
idth
Distance (meters)
Source: D. Moodie (TechnipFMC), CENSIS Tech Summit 2016
Optical
E/M Acoustics
Acoustics (OFDM)

Distance
Bandwidth
Environment Pressure, turbidity
Ambient noise
Power
Length of stay
Energy per bit
Alignment
Beam divergence
Transmitter size
Wireless in the subsea world
But there are a lot of other factors – not
just BW and loss
Size, weight and power are always a trade off
Source: D. Moodie (TechnipFMC), CENSIS Tech Summit 2016

Challenging but has some advantages
AdvantagesConnector and Cabling costs
Retrofit (lick-and-stick)
Retrievable (no shut down)
Configurable networking
DisadvantagesBattery Life (energy harvesting options)
Non-critical use only
Environment (Immunity to interference)
Security
Generic Industrial Fibre-Optic Connector
5 USD
Subsea wet-mateableFibre-Optic Connector
25,000 USD

CPM: No Sensors = No Data
Standard
Pressure, Temperature, Single Phase Flow
Additional
Leakage
Erosion/Corrosion
Fatigue
Actuator Position (valve, choke)
Multi-phase flow
Sand Detection
Pig detection
Process (oil-in-water, level monitoring)
Downhole fibre-optic
Video inspection
Capacitive
hydrocarbon
detector
Multiphase meter
Sand
Detector
On
Jumper
XT Mounted
Pressure and
Temperature
Sensors
Pig
Detector

Sensors for condition monitoring
Parameters
Technologies
Accuracy
Power and cost
Deploying
Getting the data
Future proofing?

@CENSIS121 censis.org.uk

The Data Lab
Understanding the Business Case for
Data Analytics@DataLabScotland
Duncan Hart

CEBR Report – February 2016

Innovation Centre Programme
Approach
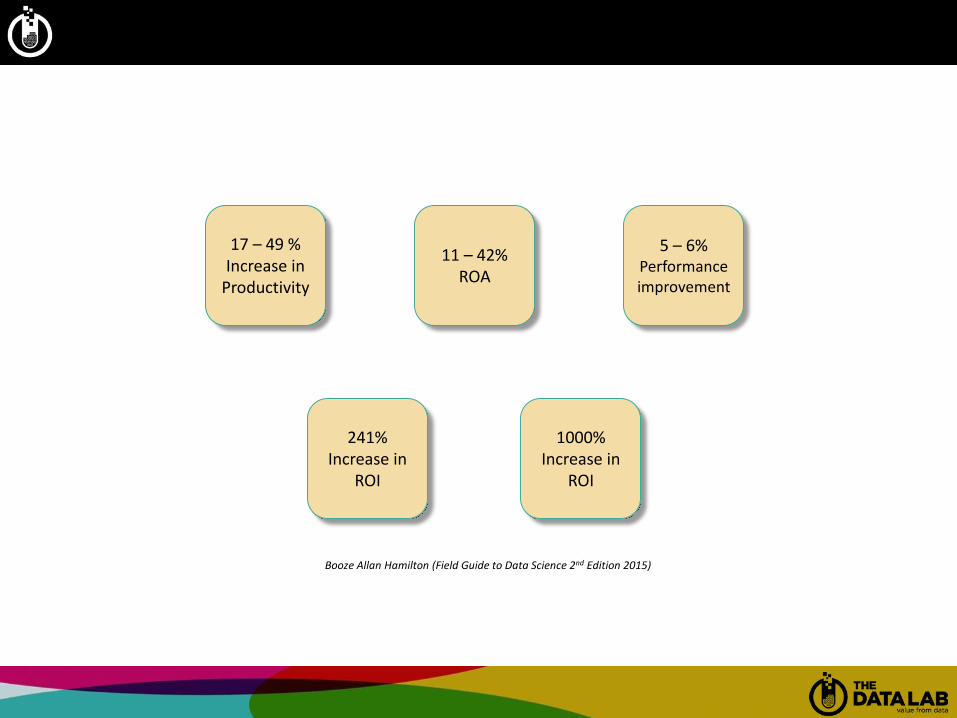
Data Drives Business Performance
17 – 49 %Increase in
Productivity
11 – 42% ROA
5 – 6%Performanceimprovement
241%Increase in
ROI
1000% Increase in
ROI
Booze Allan Hamilton (Field Guide to Data Science 2nd Edition 2015)

It is not about the size of the data, it’s about the value within the data.
What do I want my data to do?

• What is the burning question
Generate greater revenue?Retain or acquire customers?Increase production?Reduce costs?Reduce administration?Deploy assets more efficiently?
• What value would it generate for the business if you could solve the problem Financially
• Think laterally and don’t be afraid to think big
• Quick wins can help generate internal buy in
What do I want my data to do?

Some Examples

Some Examples

Some Examples

Some Examples

xDesign
Aims
“Deliver an app that uses the accelerometer in
mobiles to automatically monitor road quality”
- Take 2.5s (100Hz) accelerometer data segments (x, y, z,
time) and distinguish between ‘potholes’ and ‘other’.

xDesign
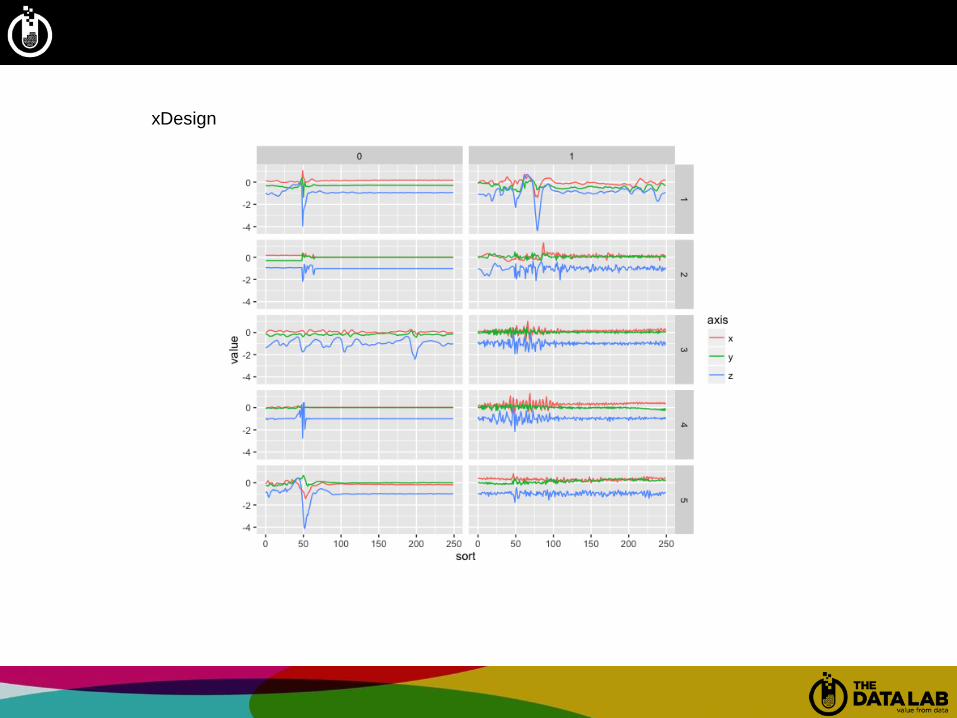
xDesign

xDesign

xDesign
Success!
Simple amplitude filter
~ 80% accuracy
with machine learning filter
~ 95% accuracy
Outcomes
- New product
- New company

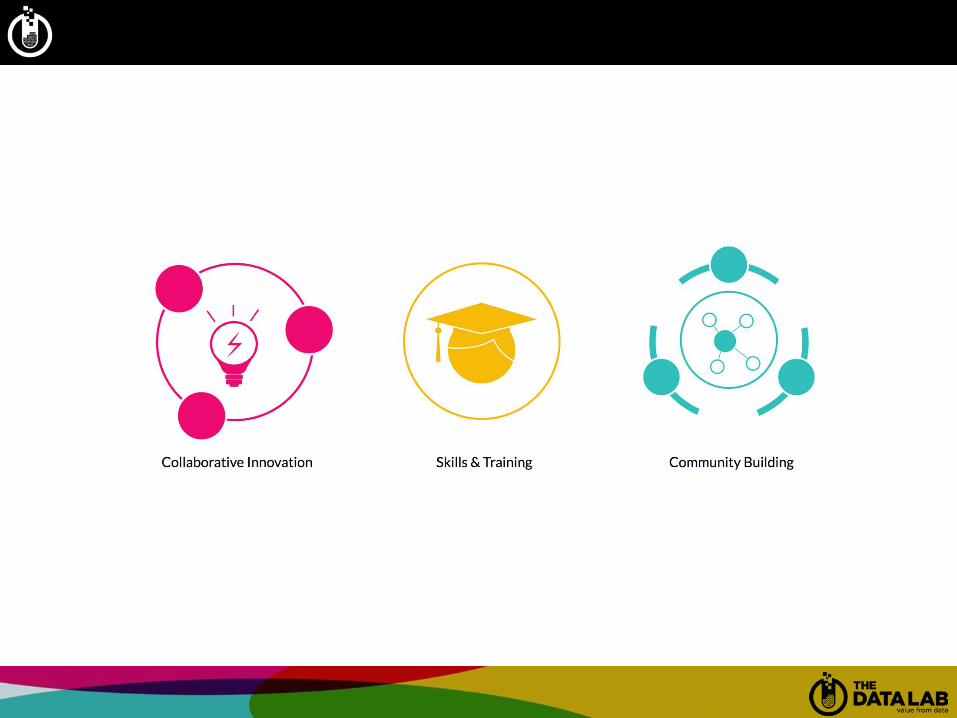
Collaborative Innovation
Agriculture
Cybercrime
Law Energy, Oil & Gas
Financial
Services
Healthcare
Telecoms


Innovative Monitoring Approaches
Sarah Keynes
Senior Programme Manager (Energy Innovation)
Tel: 07748 704321 | Email: [email protected]
Subsea Condition monitoring for Predictive Failure and Maintenance Workshop
25 April 2017, Aberdeen

UK Research Councils

Our vision
To place environmental
science at the heart of
responsible management
of our planet

• Benefiting from natural resources
• Resilience to environmental hazards
• Managing environmental change
• Discovery science
Meeting society’s needs

We support
• 3000 scientists & 1000 PhD students
• 1000 research projects and 60 UK or
international programmes
• 55 universities, 20 research institutes
• UK national capability: 4 ships, 7
aircraft, 6 polar bases, 6 data
centres, 32 community facilities

Our centres
British Antarctic Survey
British Geological Survey
Centre for Ecology & Hydrology
National Centre for Atmospheric Science
National Centre for Earth Observation
National Oceanography Centre

Strategic
Research
Translation and
Innovation

“Enhancing the impact of NERC’s investments by transforming the knowledge, data, capabilities and
skills of our community into new value-adding approaches, tools and solutions.”

Understand needs
How can science, knowledge and evidence help?
Broker access
To data, expertise and skills
Translate existing research
Develop innovative tools, approaches and solutions
Co-design research
Where new knowledge is needed
NERC Innovation
Partner with business to help
them find and use environmental
science they need
http://www.nerc.ac.uk/business/

Innovative monitoring approaches for infrastructure,
oil and gas and renewable energy
• Application of existing environmental
science monitoring capabilities and
expertise
– technologies,
– techniques and tools for measuring
and modelling,
– deployment and interpretation.
• 3 sectors:
– infrastructure,
– oil & gas and
– offshore renewable energy
http://www.nerc.ac.uk/innovation/activities/naturalresources/oilandgasprog/roundtwo/

Proposals must meet the needs of an end-user project partner
Assessment criteria:• Impact and Innovation Potential• Mechanisms for delivery
Call now open!
Innovative Monitoring Approaches Call
Existing environmental
science and research
Innovative approaches,
solutions and tools
Real issues and opportunities
facing end-users

Predictive jellyfish bloom dispersal maps
for UK coastal electricity generating
facilities
• 2011 – EDF Energy’s Torness
nuclear power plant closed for
1 week = £1m per day
• NERC investment £160k
• 18 month project to develop
early warning tool
“Jellyfish swarms are an occasional but
challenging issue for our power stations.
They can have an impact on the amount
of electricity we are able to supply to
consumers. . [we] are pleased to be
working with the University of Bristol to
develop a tool that will allow us to
continue delivering, safe, secure and
responsible nuclear electricity.”
Pietro Bernadara, EDF Energy
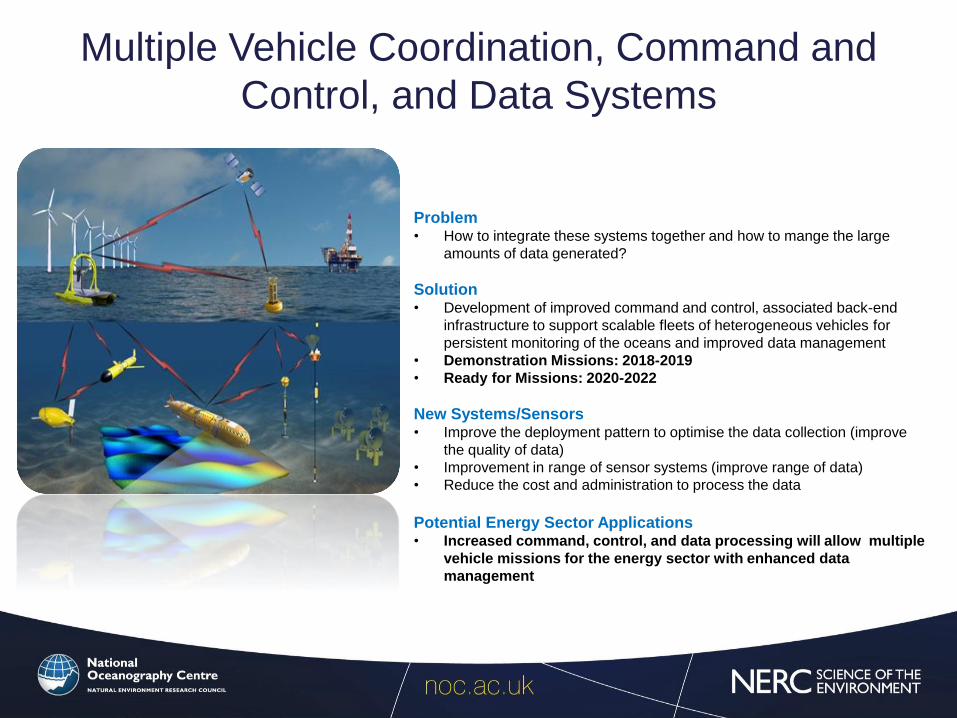
Multiple Vehicle Coordination, Command and
Control, and Data Systems
Problem• How to integrate these systems together and how to mange the large
amounts of data generated?
Solution• Development of improved command and control, associated back-end
infrastructure to support scalable fleets of heterogeneous vehicles for
persistent monitoring of the oceans and improved data management
• Demonstration Missions: 2018-2019
• Ready for Missions: 2020-2022
New Systems/Sensors• Improve the deployment pattern to optimise the data collection (improve
the quality of data)
• Improvement in range of sensor systems (improve range of data)
• Reduce the cost and administration to process the data
Potential Energy Sector Applications• Increased command, control, and data processing will allow multiple
vehicle missions for the energy sector with enhanced data
management

Innovative Monitoring Approaches Call
NERC Investment:
£3.5M
Outline Bids deadline:
15 June 2017
6-18 month duration
Max £350k per project
Further information: http://www.nerc.ac.uk/innovation/activities/naturalresources/oilandgasprog/roundtwo/

Any questions?
Sarah Keynes
Senior Programme Manager (Energy Innovation)
Tel: 07748 704321 | Email: [email protected]
Lizzie Hinchcliffe
Programme Manager – Innovative Monitoring Approaches Funding Call
Tel: 01793 411940 | Email: [email protected]

www.nsri.co.uk
NSRI- the focal point for Subsea Research and Development activity in the UK
Thanks to our sponsors:
BPShellTotalSubsea 7Subsea UK Scottish EnterpriseWood Group