national study / paper · pdf file... the study reviews the bank, capital market, ... hidcl...
TRANSCRIPT

This paper was prepared for the National Workshop on Financing Strategies for Sustainable Development in Nepal jointly organized by the National Planning Commission (NPC) of Nepal and the United Nations Economic and Social
Commission for Asia and the Pacific (ESCAP) on 24 January 2017 in Kathmandu. The author would like to acknowledge the support and inputs provided by Mr. Mathieu Verougstraete, Economic Affairs Officer, ESCAP Macroeconomic Policy
and Financing for Development Division as well as comments and suggestions from Honourable Dr. Min Bahadur Shrestha, Vice Chairman, Honourable Dr. Swarnim Wagle, Member and Mr. LS Ghimrie, Joint Secretary of the National
Planning Commission of Nepal. The views expressed in this document are those of the author and do not necessarily reflect the views of NPC and ESCAP. Also, the paper has been issued with no formal editing.
National Study / Paper
Infrastructure Finance Strategies for Sustainable Development in Nepal
By Mr. Ashutosh Mani Dixit
February 2017

2
Table of Contents
Executive Summary ....................................................................................................................................... 5 Acronyms and Abbreviations ........................................................................................................................ 6 Background: .................................................................................................................................................. 7 1. Methodology: ........................................................................................................................................ 8 2. Assessment of Infrastructure Need / Gaps in Nepal............................................................................. 8 3. Availability/ Sources of Funds for Infrastructure Development ......................................................... 11
3.1 Government Expenditure and Fiscal Space ................................................................................ 12 3.2 Public Procurement..................................................................................................................... 16 3.3 Fiscal Space ................................................................................................................................. 17
3.4 Public Private Partnerships ......................................................................................................... 21 3.5 Assessment of Banking Sector and Capital Market .................................................................... 23 3.6 Institutional Investors ................................................................................................................. 28 3.7 State Owned Enterprises ............................................................................................................ 31
4. Overview of Regulatory Environment:................................................................................................ 33 4.1 Monetary Policy: ......................................................................................................................... 33 4.2 Hydro: Hydropower Development Policy ................................................................................... 34 4.3 Road: National Transport Policy 2001/2002 ............................................................................... 34 4.4 BOOT Act ..................................................................................................................................... 35 4.5 Investment Board Act ................................................................................................................. 36 4.6 Land Acquisition: ......................................................................................................................... 36
Land Acquisition Act ............................................................................................................................ 36 5. Financing Strategies ............................................................................................................................ 38
5.1 Mobilizing Domestic Resources: Institutional Investors and Commercial Banks ....................... 38 5.2 Strengthening PPP Enabling Environment .................................................................................. 39 5.3 Improving Public Expenditure Efficiency .................................................................................... 42
5.3.1 Improving project prioritization .......................................................................................... 42 5.3.2 Making the most of infrastructure assets ........................................................................... 43 5.3.3 Streamlining infrastructure project delivery ....................................................................... 45
5.4 Leveraging Climate Finance ........................................................................................................ 46 5.5 Financial Intermediary for local and urban infrastructure financing .......................................... 47 5.6 Broadening the revenue base ..................................................................................................... 48
6. Conclusions, and the way forward ...................................................................................................... 49 ANNEX ......................................................................................................................................................... 51 References .................................................................................................................................................. 52
3
List of Figures Figure 1 Supply-side contribution to growth (Figures in percentage points) ............................................... 7 Figure 2 Per Capita Electricity Consumption (Kwh per capita) ..................................................................... 9 Figure 3 South Asia Urbanization trend ...................................................................................................... 10 Figure 4 Competitiveness Mapping (2016) (World Economic Forum , 2016)............................................. 10 Figure 5 Actual Capital expenditure against allocation as percent of Budgeted Expenditure (left) and, as a percent of GDP (right) ................................................................................................................................. 12 Figure 6 Monthly capital expenditure 2015-2016 (left), and Gap line (right) (Figures in NRS Millions) .... 13 Figure 7 Impulse responses of Recurrent Expenditure and Efficiency Ratio .............................................. 13 Figure 8 Capital expenditure breakdown (Economic Classification) (Percentage of GDP) ......................... 15 Figure 9 Project classification (Figures in percentage) .............................................................................. 16 Figure 10 Fiscal Indicators (percent of GDP) ............................................................................................... 18 Figure 11 Current Account/ Current Account Composition (percentage of GDP) ...................................... 18 Figure 12 Revenue to GDP .......................................................................................................................... 19 Figure 13 PPP sector wise (Nepal) .............................................................................................................. 23 Figure 14 Composition of Liabilities Figure 15 Composition of Deposits ............................................ 24 Figure 16 Composition of loans and advances (2010-2016) ....................................................................... 25 Figure 17 Mandate Vs Current Investment - Commercial Banks (In NRS Billions) ..................................... 26 Figure 18 Capital Market Capitalization to GDP (In percentage) ................................................................ 26 Figure 19 Primary market trend (In NRS Ten million) ................................................................................. 27 Figure 20 Institutions holding government securities (percentage) .......................................................... 27 Figure 21 Utilization of Insurance companies (in NRS Ten million); Insurance Premium to GDP (right) ... 29 Figure 22 EPF -Loan and Investment (in NRS Ten million) .......................................................................... 30 Figure 23 PPP process in BOOT Law and Regulation .................................................................................. 35 Figure 24 Current Investment and Potential Investment in Hydropower (in NRS ten million) .................. 38 Figure 25: Return on Net Transfer- in individual PEs (percentage)-Left, and Total Return on Net-Transfer-Right ............................................................................................................................................................ 49

4
List of Tables Table 1 Infrastructure Access (South Asia) ................................................................................................... 9 Table 2 Yearly Infrastructure Investment Needs as a Percent of Estimated GDP (2010-2020) ................. 11 Table 3 Capital Expenditure by Infrastructure Sectors (NRS Million) ......................................................... 14 Table 4 Highlights of PPP Policy (2015) ....................................................................................................... 22 Table 5 Public Enterprises- Utilities and Infrastructure .............................................................................. 31 Table 6 Minimum Paid-up Capital as per Monetary Policy ........................................................................ 33 Table 7 Process Highlight (Land Acquisition) .............................................................................................. 37 Table 8 Available- Investable Financial Resource (approximation) ............................................................ 39 Table 9 Optimal Organizational Form for Service Provision ....................................................................... 40 Table 10 Cost and Benefit- Infrastructure Projects .................................................................................... 43 Table 11 Optimize Infrastructure - Best Practices ...................................................................................... 44 Table 12 Best practices in streamlining delivery ........................................................................................ 45 Table 13 Cyclicality of NTR .......................................................................................................................... 48
5
Executive Summary
Infrastructure gaps present a significant challenge for Nepal’s short and longer term development goals. To provide a comprehensive picture of the required investments, the study reviews the period plans, development reports, and updated data from the Ministry of Finance. It also assesses the available resources in the economy, as well as the financing strategies, to fund the infrastructure deficit through domestic and international resources. In doing so, the study reveals that Nepal has to invest between 8 to 12 percent of GDP until 2020, well over a billion dollar annually, to adequately develop its infrastructure. To meet such burgeoning financial requirement the government has been increasing its budget and expenditure over time. However, this study finds the evidence that jerry-built capital investment can make public spending suboptimal and that project selection and implementation need to be improved. While assessing the fiscal space in the economy, the study notices that the government has still room to undertake more productive infrastructure investments although fiscal deficits are likely in the coming years. The study also discusses the tax incentives provided to the infrastructure sector, in particular for the hydropower sector, and points that these kinds of tax expenditures, have eroded the revenue base of the country. The study then analyses the current level of private sector participation in Nepal infrastructure development and sketches the current PPP policy process. Subsequently, the study reviews the bank, capital market, and institutional investor capacity to further finance infrastructure projects. Such review shows that apart from the maturity mismatch and lack of capacity to assess the infrastructure projects, the regulatory norms also restricts these institutions to provide long-term project finance. The study also examines the role of state-owned enterprises in infrastructure development as well as the state policy in this area. Following this in-depth analysis, the study proposes six financing strategies for infrastructure development in Nepal. It first recommends mobilizing the available domestic resource up to the regulatory limit, then suggests filling part of the gap through further private sector involvement. It also identifies measures to improve public expenditure efficiency by enhancing project prioritization, making the most of the infrastructure assets and streamlining infrastructure project delivery. It also considers ways to mobilize the growing climate finance-related sources of funds as well as the possibility of establishing intermediary institutions for local and urban infrastructure financing. The study also highlights the scope for increasing Non-Tax revenues as another means to free resources for infrastructure development. Given the amount required, the study concludes by recognizing that all these strategies will have to be considered as none of them can tackle the Nepal infrastructure challenges on its own.
6
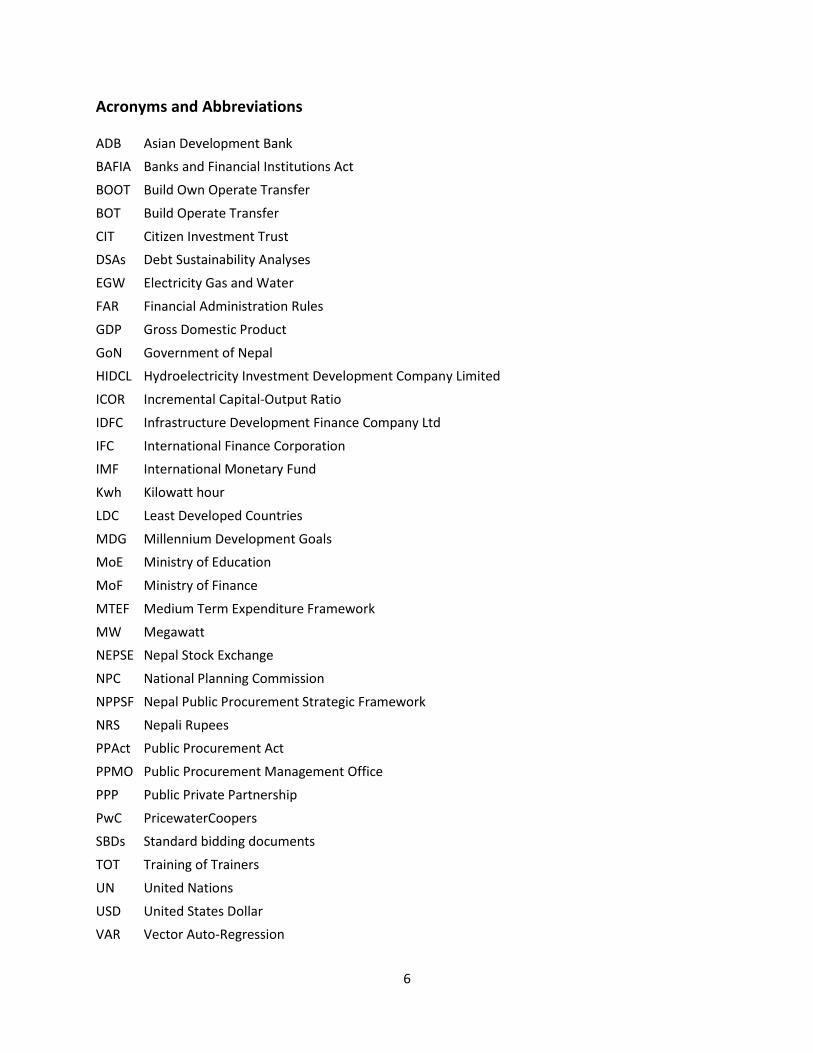
Acronyms and Abbreviations
ADB Asian Development Bank BAFIA Banks and Financial Institutions Act BOOT Build Own Operate Transfer BOT Build Operate Transfer CIT Citizen Investment Trust DSAs Debt Sustainability Analyses EGW Electricity Gas and Water FAR Financial Administration Rules GDP Gross Domestic Product
GoN Government of Nepal HIDCL Hydroelectricity Investment Development Company Limited ICOR Incremental Capital-Output Ratio IDFC Infrastructure Development Finance Company Ltd IFC International Finance Corporation IMF International Monetary Fund Kwh Kilowatt hour LDC Least Developed Countries MDG Millennium Development Goals MoE Ministry of Education MoF Ministry of Finance
MTEF Medium Term Expenditure Framework MW Megawatt NEPSE Nepal Stock Exchange NPC National Planning Commission NPPSF Nepal Public Procurement Strategic Framework NRS Nepali Rupees PPAct Public Procurement Act PPMO Public Procurement Management Office PPP Public Private Partnership PwC PricewaterCoopers SBDs Standard bidding documents TOT Training of Trainers UN United Nations USD United States Dollar VAR Vector Auto-Regression
7
Background
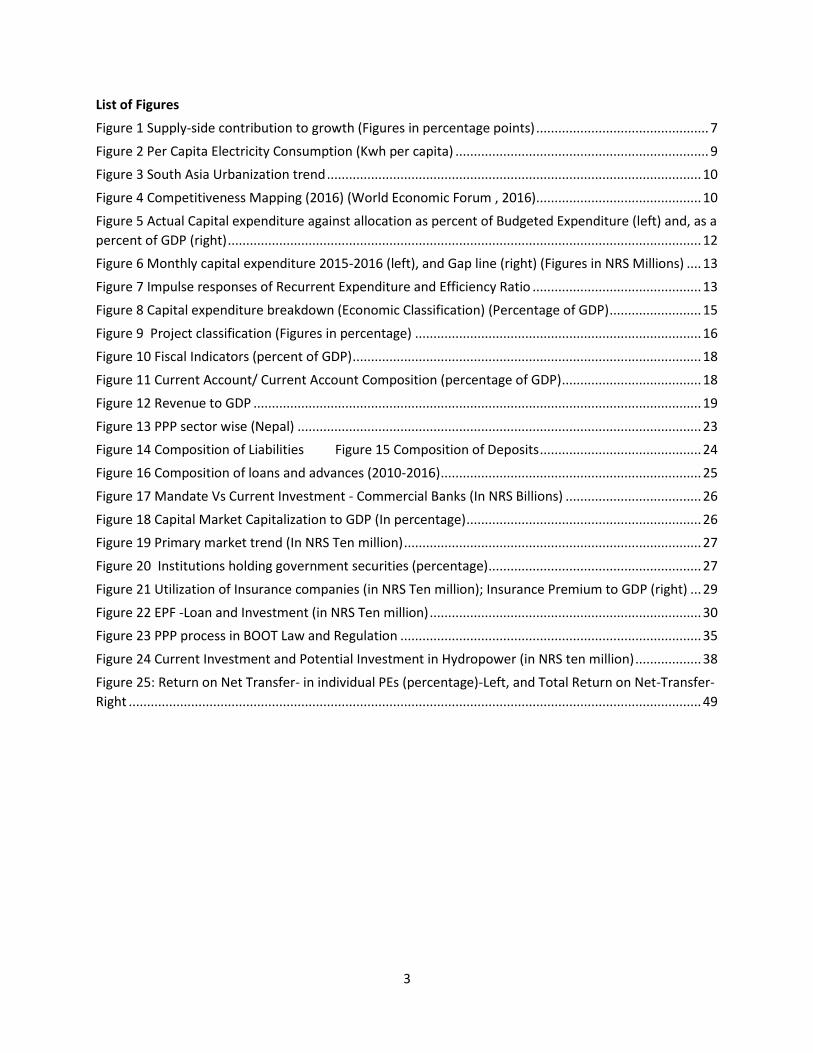
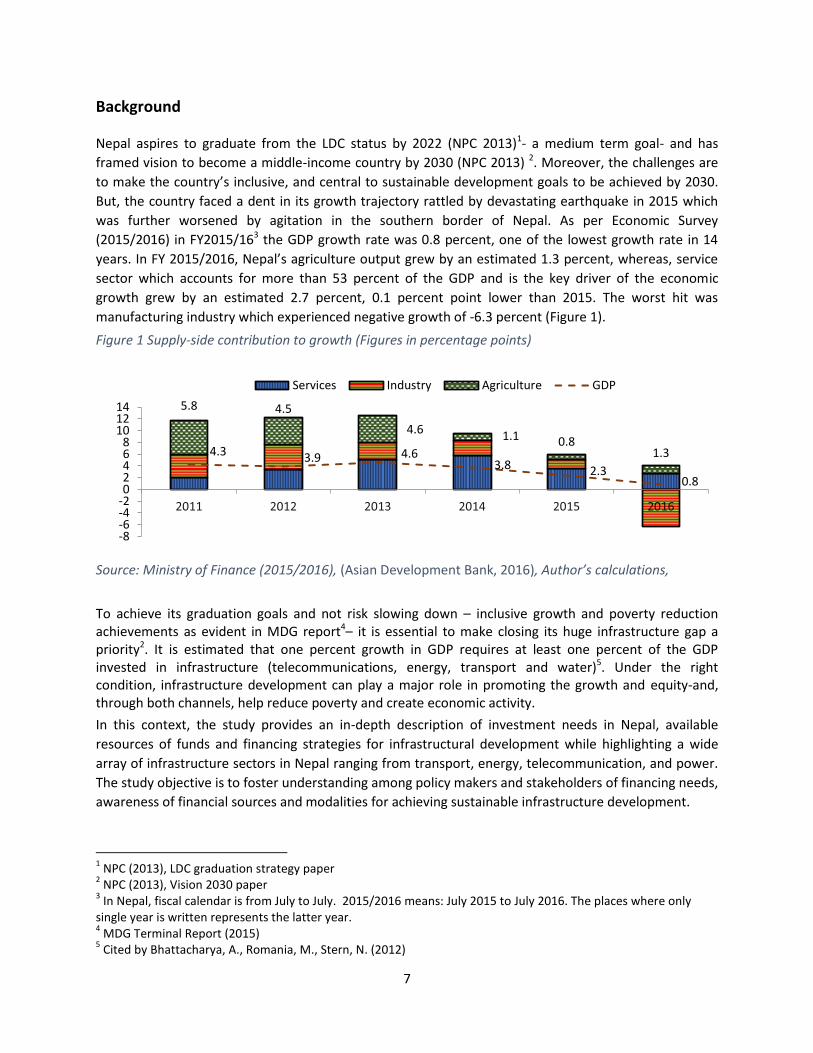
Nepal aspires to graduate from the LDC status by 2022 (NPC 2013)1- a medium term goal- and has framed vision to become a middle-income country by 2030 (NPC 2013) 2. Moreover, the challenges are to make the country’s inclusive, and central to sustainable development goals to be achieved by 2030. But, the country faced a dent in its growth trajectory rattled by devastating earthquake in 2015 which was further worsened by agitation in the southern border of Nepal. As per Economic Survey (2015/2016) in FY2015/163 the GDP growth rate was 0.8 percent, one of the lowest growth rate in 14 years. In FY 2015/2016, Nepal’s agriculture output grew by an estimated 1.3 percent, whereas, service sector which accounts for more than 53 percent of the GDP and is the key driver of the economic growth grew by an estimated 2.7 percent, 0.1 percent point lower than 2015. The worst hit was manufacturing industry which experienced negative growth of -6.3 percent (Figure 1). Figure 1 Supply-side contribution to growth (Figures in percentage points)
Source: Ministry of Finance (2015/2016), (Asian Development Bank, 2016), Author’s calculations, To achieve its graduation goals and not risk slowing down – inclusive growth and poverty reduction achievements as evident in MDG report4– it is essential to make closing its huge infrastructure gap a priority2. It is estimated that one percent growth in GDP requires at least one percent of the GDP invested in infrastructure (telecommunications, energy, transport and water)5. Under the right condition, infrastructure development can play a major role in promoting the growth and equity-and, through both channels, help reduce poverty and create economic activity. In this context, the study provides an in-depth description of investment needs in Nepal, available resources of funds and financing strategies for infrastructural development while highlighting a wide array of infrastructure sectors in Nepal ranging from transport, energy, telecommunication, and power. The study objective is to foster understanding among policy makers and stakeholders of financing needs, awareness of financial sources and modalities for achieving sustainable infrastructure development.
1 NPC (2013), LDC graduation strategy paper 2 NPC (2013), Vision 2030 paper 3 In Nepal, fiscal calendar is from July to July. 2015/2016 means: July 2015 to July 2016. The places where only single year is written represents the latter year. 4 MDG Terminal Report (2015) 5 Cited by Bhattacharya, A., Romania, M., Stern, N. (2012)
5.8 4.5 4.6 1.1 0.8
1.3 4.3 3.9 4.6 3.8 2.3
0.8
-8-6-4-202468
101214
Services Industry Agriculture GDP
8
The study is structured as follows: the immediate section presents the methodology, the second section provides an overview of infrastructure need/ gaps in Nepal, the third section presents an in-depth analysis of the sources and availability of the funds, fourth and fifth section inquiries about regulatory environment and feasible financing strategies respectively, sixth provides recommendation and concluding comments.
1. Methodology
This research is based on periodic Three-year plans, MDG reports, SDG reports, and updated data from Central Bank of Nepal, Ministry of Finance, Office of comptroller general (MoF) and Ministry of Physical Infrastructure. The periodic national surveys including Economic Survey Reports, Publications from NPC, NRB, and various government agencies related to infrastructure and development were also reviewed. Furthermore, relevant Financial Acts and Policies, reports and studies from research institutions and development partners (such as ADB, World Bank, and UN agencies) were studied. To obtain deeper insights, key stakeholders were consulted individually and collectively. The study also includes quantitative analysis with the use of Vector Auto-Regression (VAR), which is an ordinary least square regression where each variable is regressed on lag value of itself. Through VAR, the paper explores the relationship between the following variables: capital expenditure, recurrent expenditure, efficiency ratio, public capital stock and GDP. The naive estimate is based on 34 years’ annual data spanning from 1974 to 2011. The methodology is presented in Annex.
2. Assessment of Infrastructure Need / Gaps in Nepal
Infrastructure Gaps
A majority of the population in Nepal does not have reliable and adequate access to adequate infrastructure services. For example, even though an estimated 83 percent of population has access to basic water services, only 16 percent of the population has access to higher/medium quality water services. The Terai region has comparatively good access to water, but in the case of improved sanitation, the service is clustered around the Western hill region (Andres, et al., 2014). Rural households are even more deprived of highly capital intensive infrastructure services like sewerage or piped water and electricity. Regarding fixed telephone lines, only 3 percent have access to fixed telephone subscription for 100 people in Nepal. Although number of subscription for fixed telephone has been decreasing in the world, replaced by mobile/cellular services, fixed-telephone subscriptions are still a critical infrastructure indicator because they remain essential for voice traffic and provide a basis for upgrading fixed-broadband infrastructure. Fixed broadband subscription stands at 1.06 per 100 people in Nepal compared to 1.38 in South Asia (Table 1). Regarding road connectivity, according to the 14th Plan -approach paper (FY2016-FY2019), presently there are about 29031 km of roads (53 percent paved roads) and 1952 bridges in the country. But, two more districts are yet to be connected to the roadways. Regarding, availability of road infrastructure, measured by road density, Nepal stands at 139 km per 1000 km2 (UNESCAP, 2016), where more than 60 percent of the road network is concentrated in the lowland (Terai) areas of the country.

9
105
258
684
490
0
200
400
600
800
Nepal Bangladesh India Srilanka
Table 1 Infrastructure Access (South Asia)
Nepal South Asia
Percentage of population
Improved Sanitation 45 44
Improved Sources of Water 91 92
Access to Electricity 76 74
Per 100 people
Fixed telephone lines 3 2
Fixed Broadband 1.06 1.38
Per 1000 km2
Road Density (km) 139 1123
Source: (UNESCAP, 2016) (The World Bank, 2016) Andres et.al (2013) highlights that if benefits are to be sized in real terms, gaining access is not enough; the quality and sustainability of services needs to improve with substantial and efficient investment. For instance, 76 percent of Nepali have access to electricity but the situation has not improved since long, for instance since 2002, almost no transmission lines have been built by NEA or private, and only 92 MW of generation capacity has been added to the system whereas 13000 Mw of hydropower license has been issued6. Furthermore, despite having lowest per capita electricity consumption in South Asia (Figure 2)- Nepal faces 18 hours’ load shedding a day7, which has devastated industrial growth and created a huge cost to Nepal’s economy. It is necessary to give citizens, and deprived sectors regular access to infrastructure services like electricity, and roads which ultimately help increase private capital durability, labor productivity, and economic development in the longer run. Likewise, substantial work needs to be done in order to increase the real benefit of access to high-quality water and sanitation services in the country. Figure 2 Per Capita Electricity Consumption (Kwh per capita)
.
Source: (The World Bank, 2016)
6 Power Sector Development Scenario of Nepal- Presentation by Rabin Shrestha (Senior Energy Specialist-WB), 26th February, 2015 7 Although the load shedding has significantly decreased in recent months (in valley and some regions), the country needs a sustainable and inclusive solution.
10
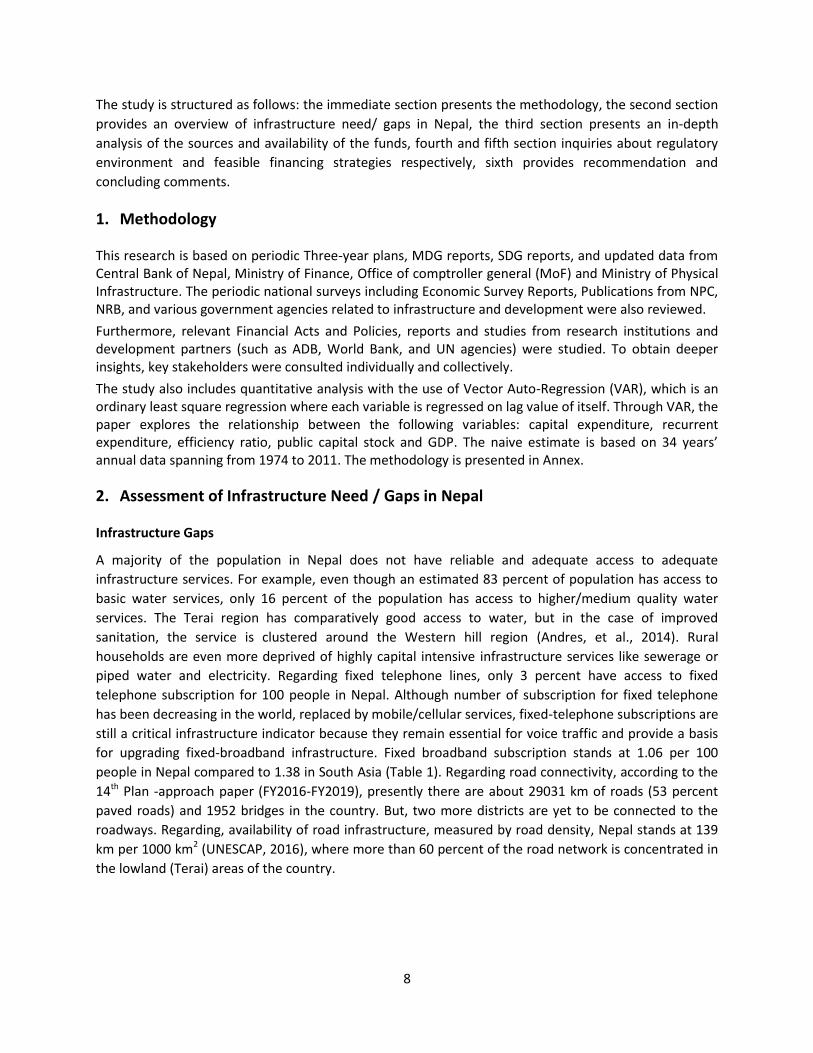
Figure 3 South Asia Urbanization trend
Source: (World Bank and Aus-Aid 2012)
Another important aspect while discussing infrastructure need is the extent to which the country is urbanizing and growing. Nepal is both, least urbanized country with approximately 20 percent population living in the urban area and fastest urbanizing country with the growth rate of 5 percent per annum on an average since the 1970s (World Bank and Aus-Aid 2012) (Figure 3). The infrastructure deficit is alarming in the sense that access to pipeline water services is rapidly decreasing in urban areas. For instance: Kathmandu valley has the worst water supply system. The treatment is poor and most of the water flows untreated into Bagmati river (World Bank and Aus-Aid 2012). Moreover, lack of proper sewage system has polluted the urban regions with the possibility of higher socio-economic cost. As urban population continues to increase and the country aspires to economically develop over the years, it is imperative for Nepal to improve its infrastructure services.
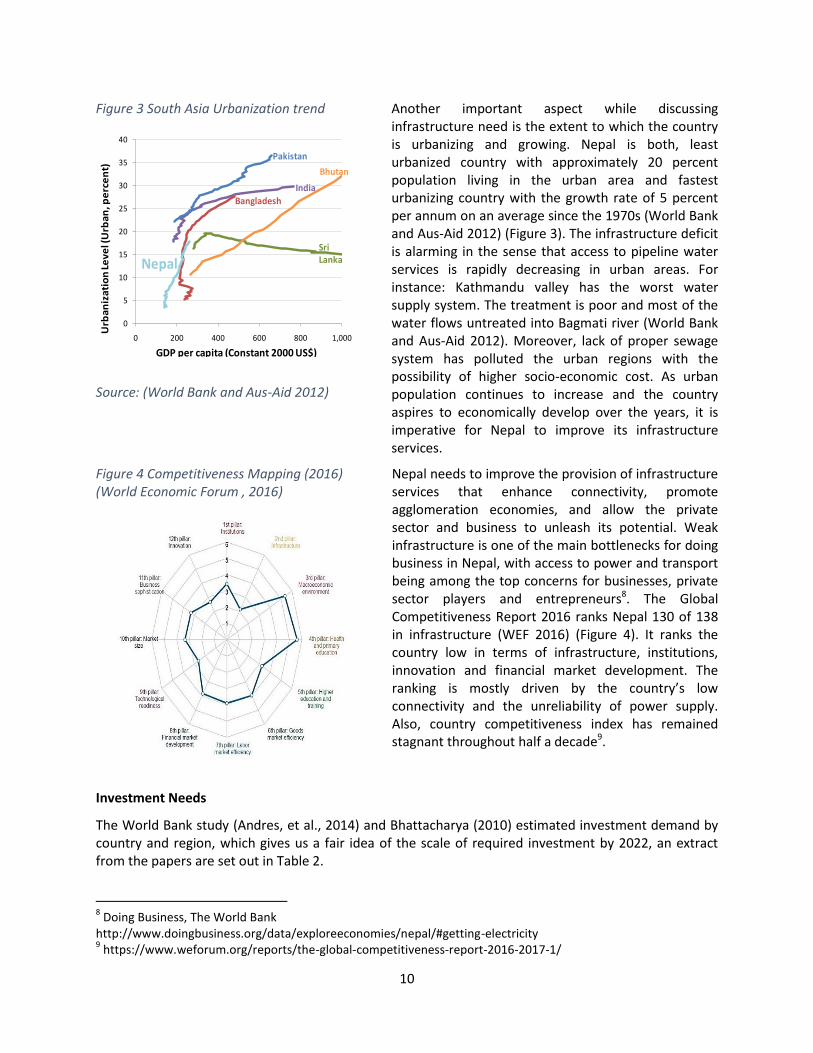
Figure 4 Competitiveness Mapping (2016) (World Economic Forum , 2016)
Nepal needs to improve the provision of infrastructure services that enhance connectivity, promote agglomeration economies, and allow the private sector and business to unleash its potential. Weak infrastructure is one of the main bottlenecks for doing business in Nepal, with access to power and transport being among the top concerns for businesses, private sector players and entrepreneurs8. The Global Competitiveness Report 2016 ranks Nepal 130 of 138 in infrastructure (WEF 2016) (Figure 4). It ranks the country low in terms of infrastructure, institutions, innovation and financial market development. The ranking is mostly driven by the country’s low connectivity and the unreliability of power supply. Also, country competitiveness index has remained stagnant throughout half a decade9.
Investment Needs
The World Bank study (Andres, et al., 2014) and Bhattacharya (2010) estimated investment demand by country and region, which gives us a fair idea of the scale of required investment by 2022, an extract from the papers are set out in Table 2.
8 Doing Business, The World Bank http://www.doingbusiness.org/data/exploreeconomies/nepal/#getting-electricity 9 https://www.weforum.org/reports/the-global-competitiveness-report-2016-2017-1/
0
5
10
15
20
25
30
35
40
0 200 400 600 800 1,000
GDP per capita (Constant 2000 US$)
Urb
aniz
atio
n Le
vel (
Urb
an,p
erce
nt)
Pakistan
IndiaBangladesh
NepalSri Lanka
Bhutan
11
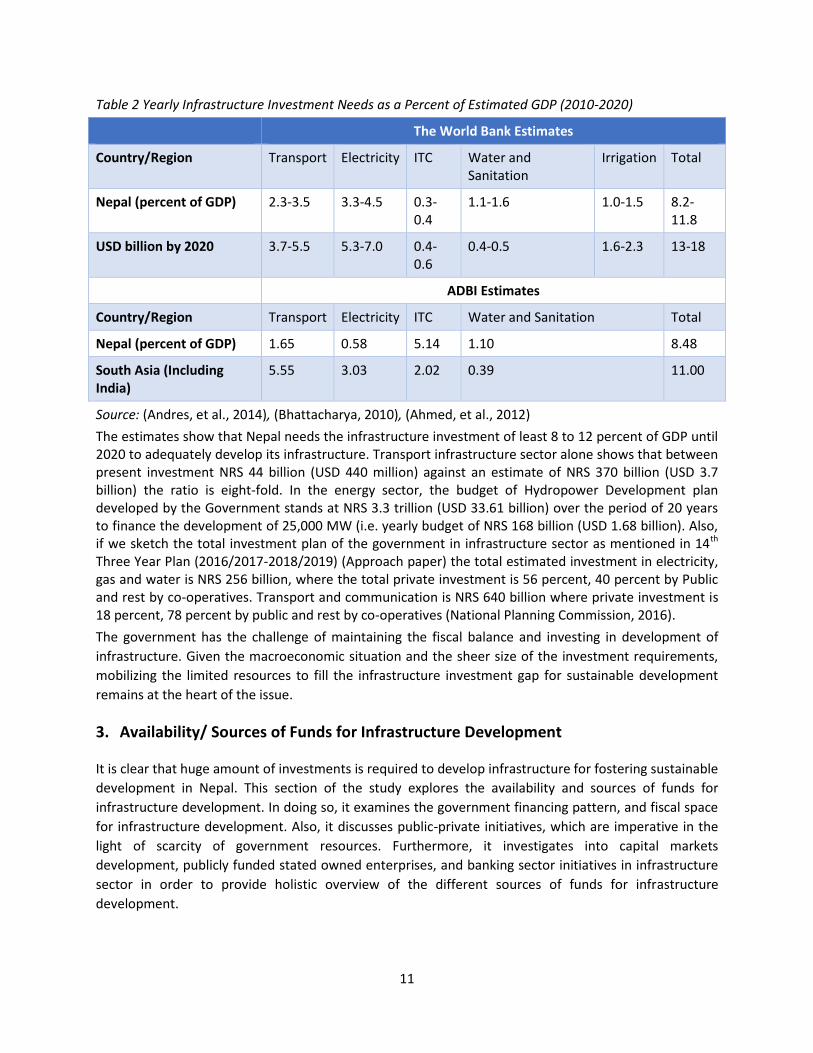
Table 2 Yearly Infrastructure Investment Needs as a Percent of Estimated GDP (2010-2020)
The World Bank Estimates
Country/Region Transport Electricity ITC Water and Sanitation
Irrigation Total
Nepal (percent of GDP) 2.3-3.5 3.3-4.5 0.3-0.4
1.1-1.6 1.0-1.5 8.2-11.8
USD billion by 2020 3.7-5.5 5.3-7.0 0.4-0.6
0.4-0.5 1.6-2.3 13-18
ADBI Estimates
Country/Region Transport Electricity ITC Water and Sanitation Total
Nepal (percent of GDP) 1.65 0.58 5.14 1.10 8.48
South Asia (Including India)
5.55 3.03 2.02 0.39 11.00
Source: (Andres, et al., 2014), (Bhattacharya, 2010), (Ahmed, et al., 2012) The estimates show that Nepal needs the infrastructure investment of least 8 to 12 percent of GDP until 2020 to adequately develop its infrastructure. Transport infrastructure sector alone shows that between present investment NRS 44 billion (USD 440 million) against an estimate of NRS 370 billion (USD 3.7 billion) the ratio is eight-fold. In the energy sector, the budget of Hydropower Development plan developed by the Government stands at NRS 3.3 trillion (USD 33.61 billion) over the period of 20 years to finance the development of 25,000 MW (i.e. yearly budget of NRS 168 billion (USD 1.68 billion). Also, if we sketch the total investment plan of the government in infrastructure sector as mentioned in 14th Three Year Plan (2016/2017-2018/2019) (Approach paper) the total estimated investment in electricity, gas and water is NRS 256 billion, where the total private investment is 56 percent, 40 percent by Public and rest by co-operatives. Transport and communication is NRS 640 billion where private investment is 18 percent, 78 percent by public and rest by co-operatives (National Planning Commission, 2016). The government has the challenge of maintaining the fiscal balance and investing in development of infrastructure. Given the macroeconomic situation and the sheer size of the investment requirements, mobilizing the limited resources to fill the infrastructure investment gap for sustainable development remains at the heart of the issue.
3. Availability/ Sources of Funds for Infrastructure Development
It is clear that huge amount of investments is required to develop infrastructure for fostering sustainable development in Nepal. This section of the study explores the availability and sources of funds for infrastructure development. In doing so, it examines the government financing pattern, and fiscal space for infrastructure development. Also, it discusses public-private initiatives, which are imperative in the light of scarcity of government resources. Furthermore, it investigates into capital markets development, publicly funded stated owned enterprises, and banking sector initiatives in infrastructure sector in order to provide holistic overview of the different sources of funds for infrastructure development.
12
3.1 Government Expenditure and Fiscal Space
Review of Government Expenditure:
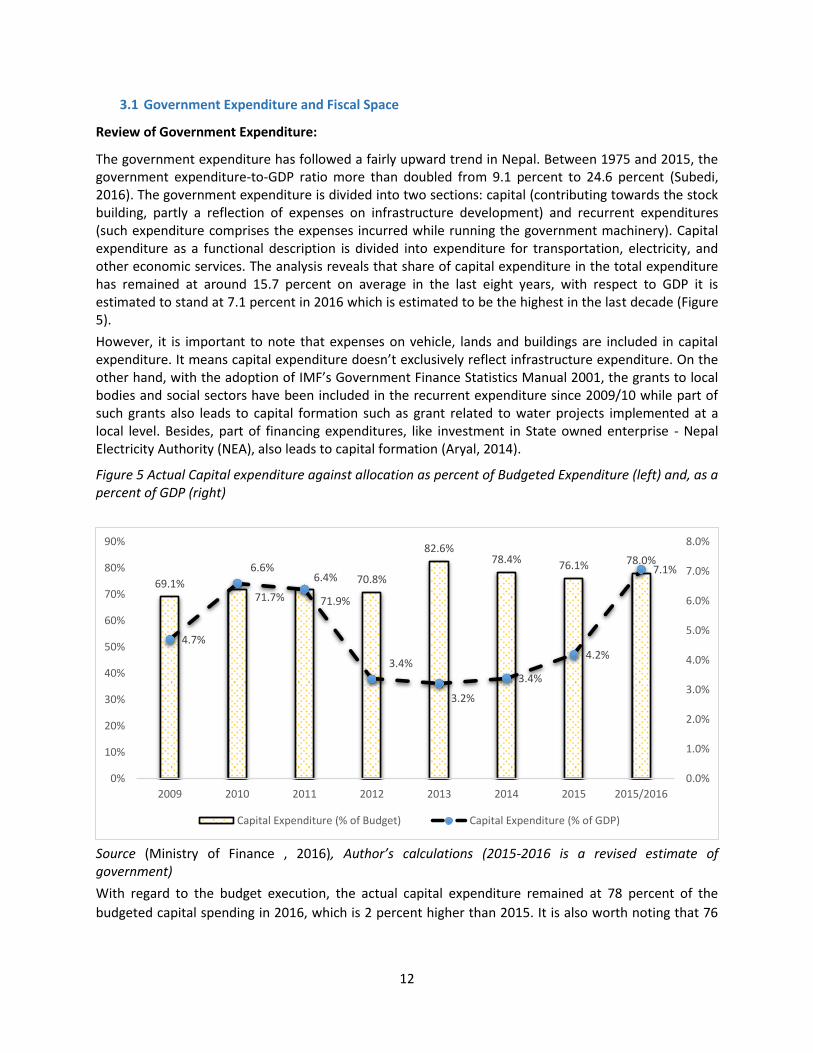
The government expenditure has followed a fairly upward trend in Nepal. Between 1975 and 2015, the government expenditure-to-GDP ratio more than doubled from 9.1 percent to 24.6 percent (Subedi, 2016). The government expenditure is divided into two sections: capital (contributing towards the stock building, partly a reflection of expenses on infrastructure development) and recurrent expenditures (such expenditure comprises the expenses incurred while running the government machinery). Capital expenditure as a functional description is divided into expenditure for transportation, electricity, and other economic services. The analysis reveals that share of capital expenditure in the total expenditure has remained at around 15.7 percent on average in the last eight years, with respect to GDP it is estimated to stand at 7.1 percent in 2016 which is estimated to be the highest in the last decade (Figure 5). However, it is important to note that expenses on vehicle, lands and buildings are included in capital expenditure. It means capital expenditure doesn’t exclusively reflect infrastructure expenditure. On the other hand, with the adoption of IMF’s Government Finance Statistics Manual 2001, the grants to local bodies and social sectors have been included in the recurrent expenditure since 2009/10 while part of such grants also leads to capital formation such as grant related to water projects implemented at a local level. Besides, part of financing expenditures, like investment in State owned enterprise - Nepal Electricity Authority (NEA), also leads to capital formation (Aryal, 2014).
Figure 5 Actual Capital expenditure against allocation as percent of Budgeted Expenditure (left) and, as a percent of GDP (right)
Source (Ministry of Finance , 2016), Author’s calculations (2015-2016 is a revised estimate of government) With regard to the budget execution, the actual capital expenditure remained at 78 percent of the budgeted capital spending in 2016, which is 2 percent higher than 2015. It is also worth noting that 76
69.1% 71.7% 71.9%
70.8%
82.6% 78.4% 76.1% 78.0%
4.7%
6.6% 6.4%
3.4%
3.2%
3.4%
4.2%
7.1%
0.0%
1.0%
2.0%
3.0%
4.0%
5.0%
6.0%
7.0%
8.0%
0%
10%
20%
30%
40%
50%
60%
70%
80%
90%
2009 2010 2011 2012 2013 2014 2015 2015/2016
Capital Expenditure (% of Budget) Capital Expenditure (% of GDP)

13
percent of capital expenditures were incurred in last 2 months10 of 201611 (Figure 6). The analysis gap line (blue line: the difference between actual expenditure and the budgeted expenditure) decreased sharply at the last two months of the fiscal year due to hasty capital spending.
Figure 6 Monthly capital expenditure 2015-2016 (left), and Gap line (right) (Figures in NRS Millions)
Source: Financial comptroller general office (Ministry of Finance 2016). Note: Budget revision takes place throughout the year. The heavy bunching of capital expenditure drags the timeline of infrastructure development and increases the likelihood of poor quality projects, which can result in escalated future recurrent expenditure.
Figure 7 Impulse responses of Recurrent Expenditure and Efficiency Ratio
The hasty and unplanned capital spending brings inefficiency in budget execution. The impulse response calculated by deploying Vector Auto Regression (VAR) in E-views shows that the recurrent expenditure shoots up when there is a positive shock on capital expenditure (Figure 7- left). The significant positive impulse response of the recurrent expenditure, might be attributed to jerry built capital expenditure which increases “likelihood of sub-standard projects and an increase in recurrent spending, in operations and maintenance costs, for next few years” (Asian Development Bank, 2016). Additionally, the impulse response of the efficiency ratio, calculated as ratio of recurrent expenditure to public capital stock, increases higher than the increase in impulse response of the recurrent expenditure (Figure 7-right). The significant positive and higher impulse response of ratio means that the recurrent expenditure increases over time as a percentage of public capital stock, implying that the efficiency in maintaining infrastructure is decreasing over time. The response also takes more time to converge to normalcy, meaning that the impact of hasty and inefficient capital expenditure lasts longer in the real sense. 10 http://admin.myrepublica.com/economy/story/42463/capital-spending-at-22-percent-till-mid-may.html 11 Although, the externalities- earthquake and agitation in the southern border of Nepal- affected public spending and reconstruction process in 2014/2015 and 2015/2016, the patterns of the heavy bunching of capital expenditure at the last period to meet the fiscal target is not surprising.
0
20000
40000
60000
80000
100000
120000
0
20000
40000
60000
80000
100000
120000
140000
160000
180000
200000
Actual Budget Gap

14
Source: Author’s calculations
Sector-wise Infrastructure spending
In recent years, efforts have been made by the Government of Nepal (GoN) to step-up capital expenditure in infrastructure, which have increased from 2009 to 2016. In particular, sectors like water, communication, transportation and electricity from 2009 to 2016 received greater priorities (Table 3). Along with an increase in GDP, government expenditure grew in the transportation and electricity sectors (each comprised more than 1percent of GDP on an average). Concurrently, the spending in drinking water remained 0.6 percent of GDP on an average throughout the period and investment in the communication sector contributed up to 0.03 percent of GDP. Overall, the capital expenditure in drinking water, communication, transportation, and electricity has exceeded 4 percent of GDP since 2015. Table 3 Capital Expenditure by Infrastructure Sectors (NRS Million)
2009
2010
2011
2012
2013
2014
2015
2016
Drinking Water 5658 5334 6115 7052 7052 10539 12398 14377
Communication 331 406 376 257 289 517 404 411
Transportation 9894 17017 20184 21847 21794 26437 44239 61057
Electricity 6073 12503 11291 182 224 14861 33091 35912
Total 21956 35260 37966 29338 29359 52354 90132 111757
GDP (Current Prices) 818401 960011 1170993 1345767 1558174 1701191 1928517 2124650
Percent GDP
Drinking Water 0.69 0.56 0.52 0.52 0.45 0.62 0.64 0.68
Communication 0.04 0.04 0.03 0.02 0.02 0.03 0.02 0.02
15
Transportation 1.21 1.77 1.72 1.62 1.40 1.55 2.29 2.87
Electricity 0.74 1.30 0.96 0.01 0.01 0.87 1.72 1.69
Total 2.7 3.7 3.2 2.2 1.9 3.1 4.7 5.3
Source: Economic Survey (Ministry of Finance, 2016)), Budget Speech (Ministry of Finance , 2016) ; (Ahmed, et al., 2012)
Budget 2016/2017
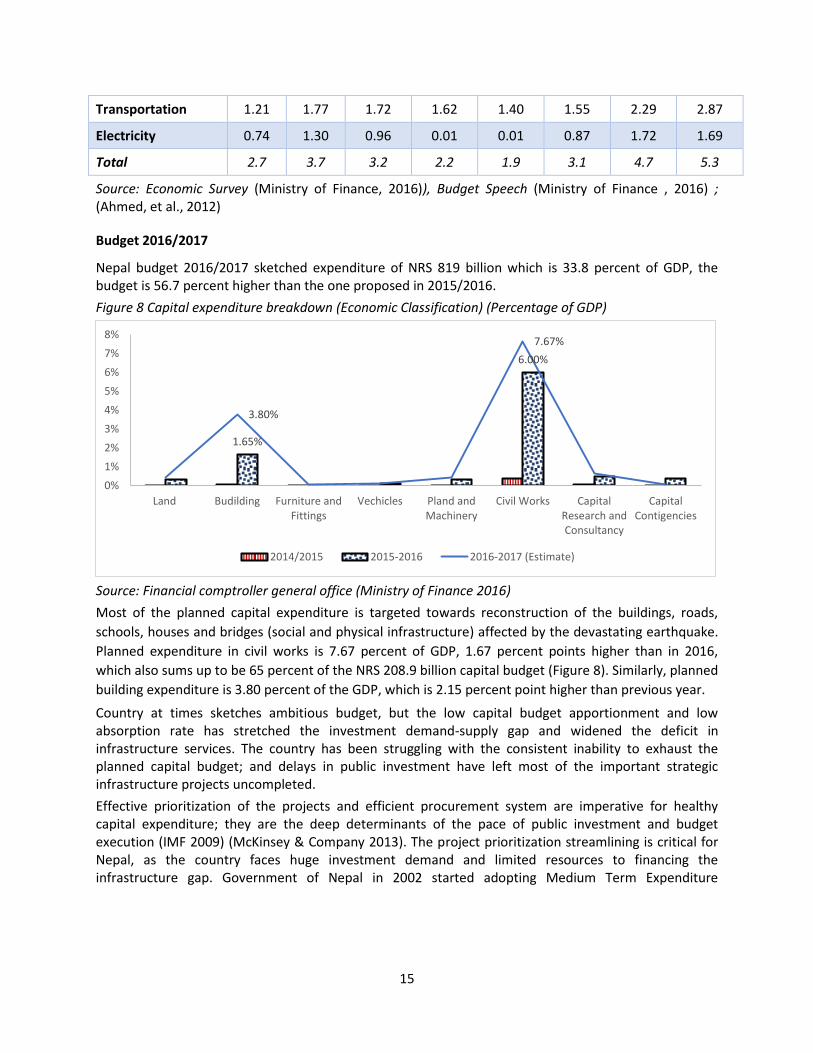
Nepal budget 2016/2017 sketched expenditure of NRS 819 billion which is 33.8 percent of GDP, the budget is 56.7 percent higher than the one proposed in 2015/2016. Figure 8 Capital expenditure breakdown (Economic Classification) (Percentage of GDP)
Source: Financial comptroller general office (Ministry of Finance 2016) Most of the planned capital expenditure is targeted towards reconstruction of the buildings, roads, schools, houses and bridges (social and physical infrastructure) affected by the devastating earthquake. Planned expenditure in civil works is 7.67 percent of GDP, 1.67 percent points higher than in 2016, which also sums up to be 65 percent of the NRS 208.9 billion capital budget (Figure 8). Similarly, planned building expenditure is 3.80 percent of the GDP, which is 2.15 percent point higher than previous year. Country at times sketches ambitious budget, but the low capital budget apportionment and low absorption rate has stretched the investment demand-supply gap and widened the deficit in infrastructure services. The country has been struggling with the consistent inability to exhaust the planned capital budget; and delays in public investment have left most of the important strategic infrastructure projects uncompleted. Effective prioritization of the projects and efficient procurement system are imperative for healthy capital expenditure; they are the deep determinants of the pace of public investment and budget execution (IMF 2009) (McKinsey & Company 2013). The project prioritization streamlining is critical for Nepal, as the country faces huge investment demand and limited resources to financing the infrastructure gap. Government of Nepal in 2002 started adopting Medium Term Expenditure
1.65%
6.00%
3.80%
7.67%
0%1%2%3%4%5%6%7%8%
Land Budilding Furniture andFittings
Vechicles Pland andMachinery
Civil Works CapitalResearch andConsultancy
CapitalContigencies
2014/2015 2015-2016 2016-2017 (Estimate)
16
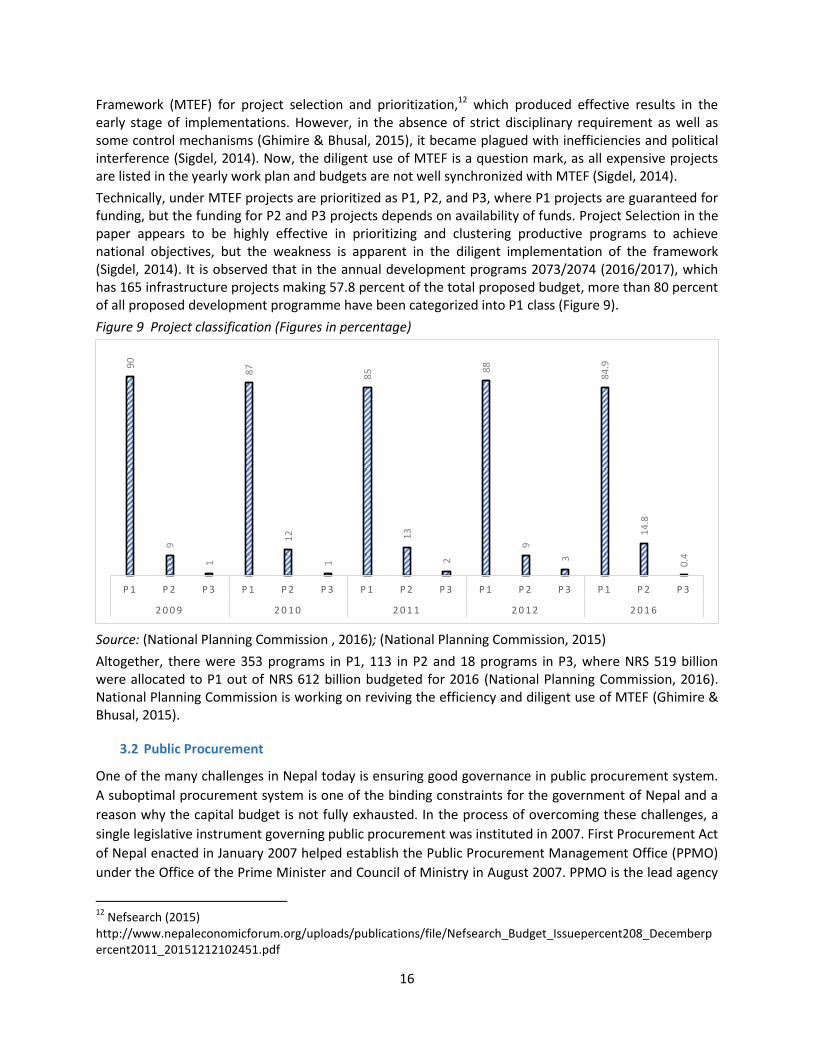
Framework (MTEF) for project selection and prioritization,12 which produced effective results in the early stage of implementations. However, in the absence of strict disciplinary requirement as well as some control mechanisms (Ghimire & Bhusal, 2015), it became plagued with inefficiencies and political interference (Sigdel, 2014). Now, the diligent use of MTEF is a question mark, as all expensive projects are listed in the yearly work plan and budgets are not well synchronized with MTEF (Sigdel, 2014). Technically, under MTEF projects are prioritized as P1, P2, and P3, where P1 projects are guaranteed for funding, but the funding for P2 and P3 projects depends on availability of funds. Project Selection in the paper appears to be highly effective in prioritizing and clustering productive programs to achieve national objectives, but the weakness is apparent in the diligent implementation of the framework (Sigdel, 2014). It is observed that in the annual development programs 2073/2074 (2016/2017), which has 165 infrastructure projects making 57.8 percent of the total proposed budget, more than 80 percent of all proposed development programme have been categorized into P1 class (Figure 9). Figure 9 Project classification (Figures in percentage)
Source: (National Planning Commission , 2016); (National Planning Commission, 2015) Altogether, there were 353 programs in P1, 113 in P2 and 18 programs in P3, where NRS 519 billion were allocated to P1 out of NRS 612 billion budgeted for 2016 (National Planning Commission, 2016). National Planning Commission is working on reviving the efficiency and diligent use of MTEF (Ghimire & Bhusal, 2015).
3.2 Public Procurement
One of the many challenges in Nepal today is ensuring good governance in public procurement system. A suboptimal procurement system is one of the binding constraints for the government of Nepal and a reason why the capital budget is not fully exhausted. In the process of overcoming these challenges, a single legislative instrument governing public procurement was instituted in 2007. First Procurement Act of Nepal enacted in January 2007 helped establish the Public Procurement Management Office (PPMO) under the Office of the Prime Minister and Council of Ministry in August 2007. PPMO is the lead agency
12 Nefsearch (2015) http://www.nepaleconomicforum.org/uploads/publications/file/Nefsearch_Budget_Issuepercent208_Decemberpercent2011_20151212102451.pdf
90
9
1
87
12
1
85
13
2
88
9
3
84.9
14.8
0.4
P 1 P 2 P 3 P 1 P 2 P 3 P 1 P 2 P 3 P 1 P 2 P 3 P 1 P 2 P 3
2 0 0 9 2 0 1 0 2 0 1 1 2 0 1 2 2 0 1 6
17
for public procurement in Nepal. Before 2007, public procurement of Nepal was carried out under the provisions of Financial Administration Rules (FAR) - 1999. As public procurement reform initiatives, the Government of Nepal (GoN) established an Independent Review Committee, issued Standard Bidding Documents (SBDs), provided Training of Trainers (TOT) and procurement trainings. Additionally, for the effective program delivery the government initiated two phases of Nepal Public Procurement Strategic Framework (NPPSF) – Phase I (2010 – 2013)13 and Phase II (2013-2016)14. As per the NPPSF, “PPMO has been envisioned as a leader, regulator and promoter to reinforce good governance in public procurement management”15. The objective of NPPSF is:
a. Assuring open and fair competition in public procurement b. Enriching functional relationship between Public Enterprise and bidders. c. Strengthening capacity of public entities and stakeholders in Public Procurement d. Realize optimum return from public expenditure by implementing Public Procurement
legislation. The government also initiated the use of information technology for better public procurement and it has issued directives to use e-procurement. Overall, it looks like the government has realized the importance of efficient expenditure for projects and infrastructure investment and initiated number of interventions over the years, but the effort to scale up the investment has been jeopardized by political meddling, bureaucratic hassles over project approval and limited capacity of implementing agencies/line ministries to prepare a pipeline of projects. It should be understood that a project without a proper roadmap, blueprint for land acquisition and efficient procurement system is destined to hobble in the whirl of legal, political and social complexities.
3.3 Fiscal Space
Fiscal performance is a crucial determinant of not only macroeconomic fundamentals but also the overall trajectory of the economy. This section discusses the fiscal space of the country (budget deficit/surplus) and the level of indebtedness (current account and level of external debt). Fiscal space is defined as “the room in the government’s budget that allows it to provide resources for a desired purpose without jeopardizing the sustainability of its financial position or the stability of the economy’ (Heller, 2005). The section also discusses the specific tax policies and incentive related to infrastructure investment, and highlights the composition and level of tax collection (tax to GDP ratio) revealing the scope for enhancing tax collection to financing the infrastructure investment.
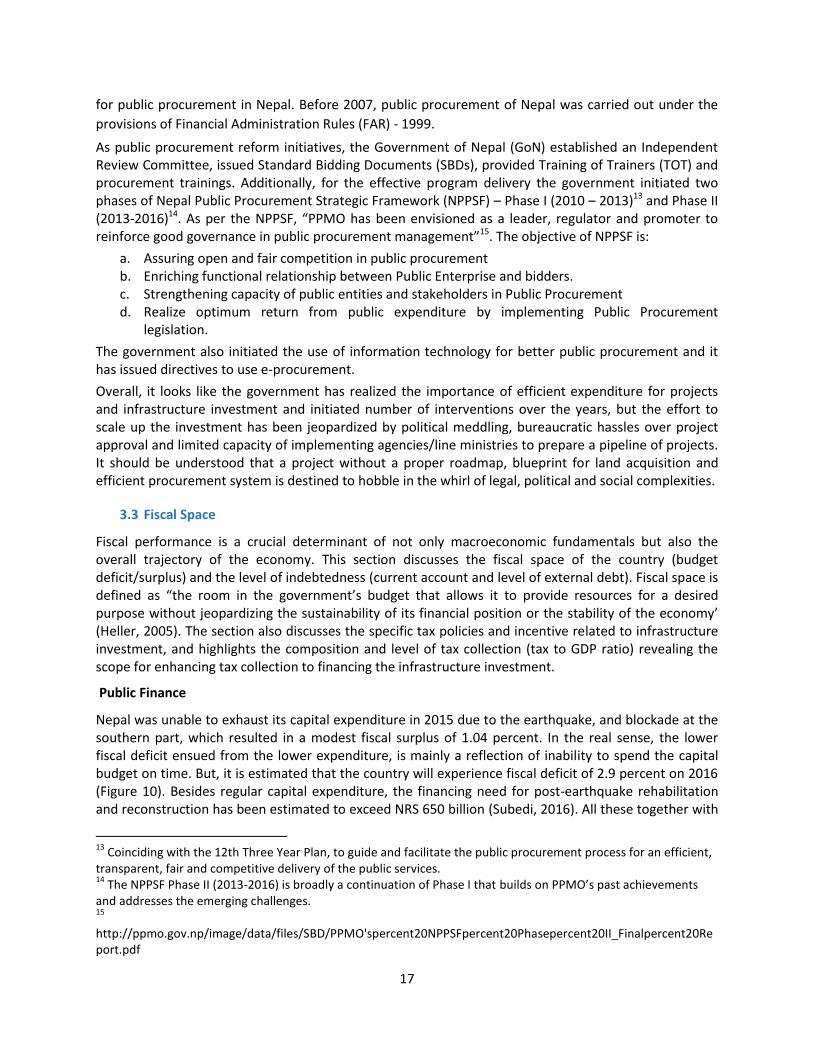
Public Finance
Nepal was unable to exhaust its capital expenditure in 2015 due to the earthquake, and blockade at the southern part, which resulted in a modest fiscal surplus of 1.04 percent. In the real sense, the lower fiscal deficit ensued from the lower expenditure, is mainly a reflection of inability to spend the capital budget on time. But, it is estimated that the country will experience fiscal deficit of 2.9 percent on 2016 (Figure 10). Besides regular capital expenditure, the financing need for post-earthquake rehabilitation and reconstruction has been estimated to exceed NRS 650 billion (Subedi, 2016). All these together with
13 Coinciding with the 12th Three Year Plan, to guide and facilitate the public procurement process for an efficient, transparent, fair and competitive delivery of the public services. 14 The NPPSF Phase II (2013-2016) is broadly a continuation of Phase I that builds on PPMO’s past achievements and addresses the emerging challenges. 15 http://ppmo.gov.np/image/data/files/SBD/PPMO'spercent20NPPSFpercent20Phasepercent20II_Finalpercent20Report.pdf
18
the implementation of federalism in the country are likely to keep the country into fiscal deficit in coming years. The International Monetary Fund (IMF)–World Bank debt sustainability analyses (DSAs) show that for the next six to seven years Nepal still have sufficient cushion to withstand slightly larger primary deficits to keep the debt-to-GDP ratios at the 33 percent (The World Bank, 2012). This implies that the government has the cushion to venture into productive infrastructure investments.16
Figure 10 Fiscal Indicators (percent of GDP)
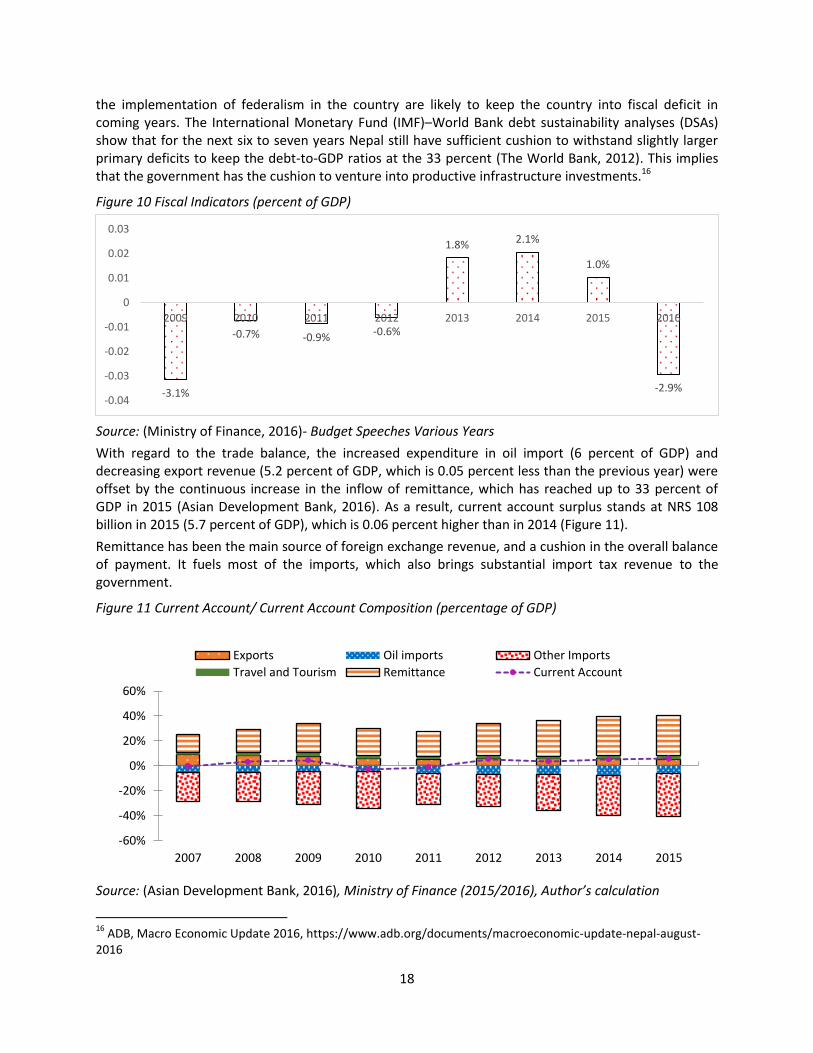
Source: (Ministry of Finance, 2016)- Budget Speeches Various Years With regard to the trade balance, the increased expenditure in oil import (6 percent of GDP) and decreasing export revenue (5.2 percent of GDP, which is 0.05 percent less than the previous year) were offset by the continuous increase in the inflow of remittance, which has reached up to 33 percent of GDP in 2015 (Asian Development Bank, 2016). As a result, current account surplus stands at NRS 108 billion in 2015 (5.7 percent of GDP), which is 0.06 percent higher than in 2014 (Figure 11). Remittance has been the main source of foreign exchange revenue, and a cushion in the overall balance of payment. It fuels most of the imports, which also brings substantial import tax revenue to the government.
Figure 11 Current Account/ Current Account Composition (percentage of GDP)
Source: (Asian Development Bank, 2016), Ministry of Finance (2015/2016), Author’s calculation
16 ADB, Macro Economic Update 2016, https://www.adb.org/documents/macroeconomic-update-nepal-august-2016
-3.1%
-0.7% -0.9% -0.6%
1.8% 2.1%
1.0%
-2.9% -0.04
-0.03
-0.02
-0.01
0
0.01
0.02
0.03
2009 2010 2011 2012 2013 2014 2015 2016
-60%
-40%
-20%
0%
20%
40%
60%
2007 2008 2009 2010 2011 2012 2013 2014 2015
Exports Oil imports Other ImportsTravel and Tourism Remittance Current Account

19
Government Revenue
Figure 12 Revenue to GDP
Source: (Ministry of Finance , 2016)
The government revenue has been in an increasing trend in Nepal in the last six years (2009-2016) (Figure 12). The significant progress in revenue collection, which stands at 20.8 percent (Figure 12), is higher than most of the SAARC countries. The progress can be attributed to strong growth of imports fueled by remittance income, as well as reforms in tax administration (Subedi, 2016), for instance through establishing a large taxpayer unit and improving tax. Import-based customs duty, VAT and excise duty accounted for about 65 percent of the tax revenues in 2015/16. However, GoN’s revenue structure highly dependent on import-based revenues is not sustainable. IMF states that “continued trade liberalization will lower the prevalence of import-related revenues” (International Monetary Fund, 2011). Moreover, the external macroeconomic shock in labor importing country can deteriorate the remittance inflows, which can decrease the consumption and the subsequent import tax revenue.
Tax Incentives in hydropower infrastructure
Budget 2016 reveals that hydropower projects, solar energy projects, waste-to-energy and wind turbines projects which commercially starts generation of electricity by Chaitra end 2080 B.S (2023 A.D) will be tax exempt for first 10 years, after that the company will have to pay 50 percent of the applicable tax for next 3 years. Furthermore, hydropower projects are exempted from VAT for the import of construction equipment, machineries and its spares parts (Budget speech 2016-2017).
The pursuit of several objectives through tax exemptions, concessions and deductions has not only rendered the tax bases narrow but also has distorted resource allocations. The IMF reports Nepal’s tax expenditure as 2.2 percent of GDP in 2011 (The World Bank, 2012). The annual revenue foregone due to tax exemptions and concessions has been estimated to be over NRS 30 billion in Nepal (Ministry of Finance , 2016). Further, such amount has been increasing every year. The IMF report states that the eligibility criteria for tax incentives apply widely and are not conditional on outcomes (International
0
5
10
15
20
25
2009 2010 2011 2012 2013 2014 2015 2016
Perc
ent
Fiscal Year
Tax/GDP Non-tax/GDP
20
Monetary Fund, 2011). It further highlights that tax incentives in Nepal compared to other countries in the region appears to be weak in these four main aspects.
a) Tax holiday time horizons seem slightly longer in Nepal. b) Indefinite tax rebates c) Accelerated depreciation rate which are seen as more effective form of incentive, seem not as
prevalent in Nepal compared to the region. d) Exemption on VAT and customs in Nepal seem more generous than in neighboring countries
The World Bank study reveals that tax incentives are not a primary enticement for foreign investment in large scale projects, the focus must shift from “tax concessions toward greater predictability for investors and increasing the ease of doing business” (The World Bank, 2012) .
Grants, Technical assistance and Loan
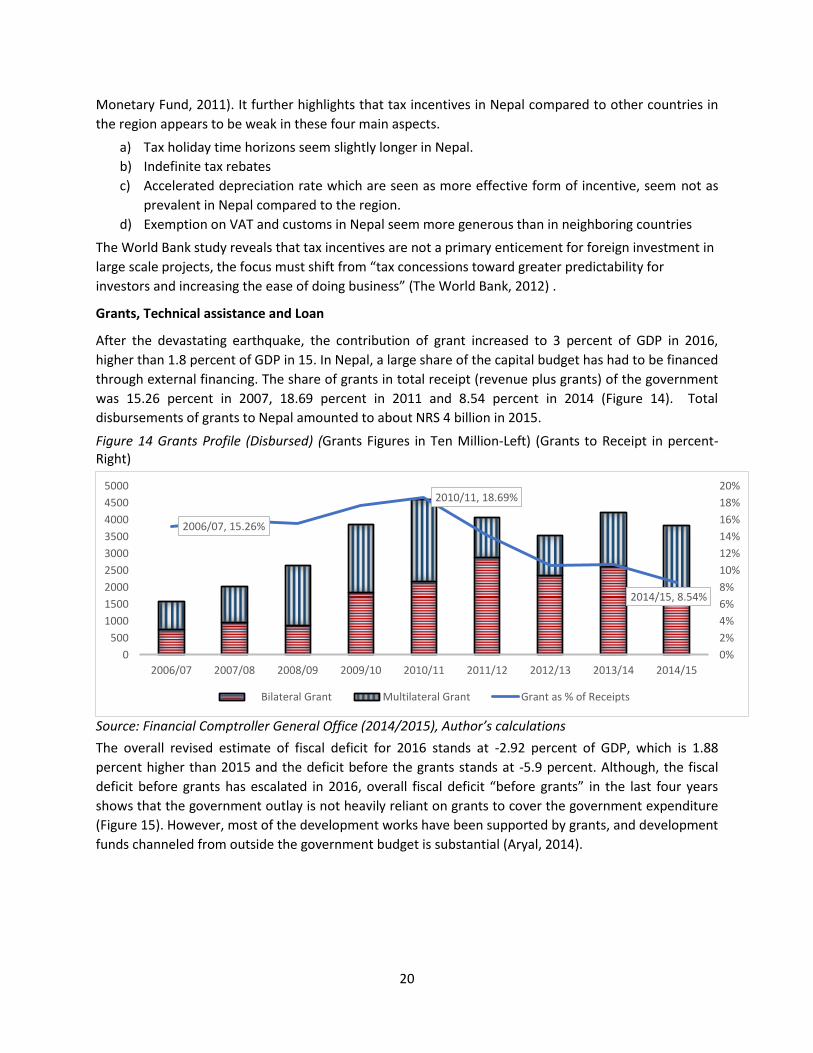
After the devastating earthquake, the contribution of grant increased to 3 percent of GDP in 2016, higher than 1.8 percent of GDP in 15. In Nepal, a large share of the capital budget has had to be financed through external financing. The share of grants in total receipt (revenue plus grants) of the government was 15.26 percent in 2007, 18.69 percent in 2011 and 8.54 percent in 2014 (Figure 14). Total disbursements of grants to Nepal amounted to about NRS 4 billion in 2015. Figure 14 Grants Profile (Disbursed) (Grants Figures in Ten Million-Left) (Grants to Receipt in percent- Right)
Source: Financial Comptroller General Office (2014/2015), Author’s calculations The overall revised estimate of fiscal deficit for 2016 stands at -2.92 percent of GDP, which is 1.88 percent higher than 2015 and the deficit before the grants stands at -5.9 percent. Although, the fiscal deficit before grants has escalated in 2016, overall fiscal deficit “before grants” in the last four years shows that the government outlay is not heavily reliant on grants to cover the government expenditure (Figure 15). However, most of the development works have been supported by grants, and development funds channeled from outside the government budget is substantial (Aryal, 2014).
2006/07, 15.26%
2010/11, 18.69%
2014/15, 8.54%
0%2%4%6%8%10%12%14%16%18%20%
0500
100015002000250030003500400045005000
2006/07 2007/08 2008/09 2009/10 2010/11 2011/12 2012/13 2013/14 2014/15
Bilateral Grant Multilateral Grant Grant as % of Receipts
21
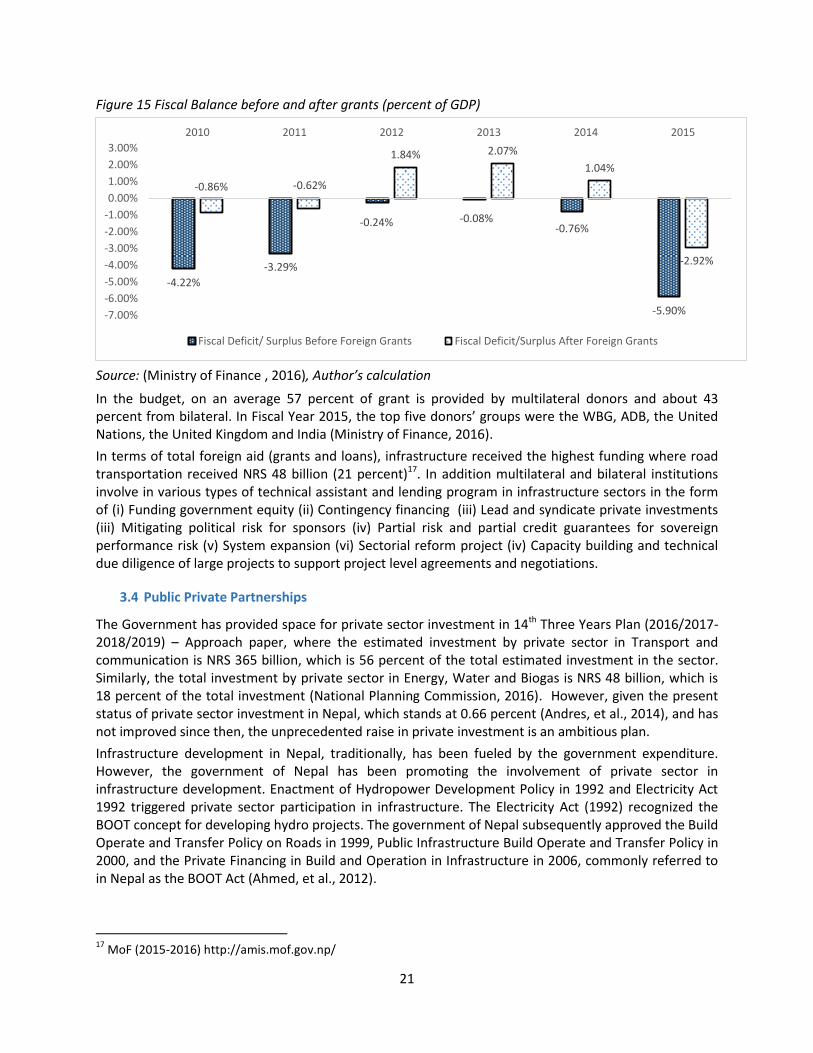
Figure 15 Fiscal Balance before and after grants (percent of GDP)
Source: (Ministry of Finance , 2016), Author’s calculation In the budget, on an average 57 percent of grant is provided by multilateral donors and about 43 percent from bilateral. In Fiscal Year 2015, the top five donors’ groups were the WBG, ADB, the United Nations, the United Kingdom and India (Ministry of Finance, 2016). In terms of total foreign aid (grants and loans), infrastructure received the highest funding where road transportation received NRS 48 billion (21 percent)17. In addition multilateral and bilateral institutions involve in various types of technical assistant and lending program in infrastructure sectors in the form of (i) Funding government equity (ii) Contingency financing (iii) Lead and syndicate private investments (iii) Mitigating political risk for sponsors (iv) Partial risk and partial credit guarantees for sovereign performance risk (v) System expansion (vi) Sectorial reform project (iv) Capacity building and technical due diligence of large projects to support project level agreements and negotiations.
3.4 Public Private Partnerships
The Government has provided space for private sector investment in 14th Three Years Plan (2016/2017-2018/2019) – Approach paper, where the estimated investment by private sector in Transport and communication is NRS 365 billion, which is 56 percent of the total estimated investment in the sector. Similarly, the total investment by private sector in Energy, Water and Biogas is NRS 48 billion, which is 18 percent of the total investment (National Planning Commission, 2016). However, given the present status of private sector investment in Nepal, which stands at 0.66 percent (Andres, et al., 2014), and has not improved since then, the unprecedented raise in private investment is an ambitious plan. Infrastructure development in Nepal, traditionally, has been fueled by the government expenditure. However, the government of Nepal has been promoting the involvement of private sector in infrastructure development. Enactment of Hydropower Development Policy in 1992 and Electricity Act 1992 triggered private sector participation in infrastructure. The Electricity Act (1992) recognized the BOOT concept for developing hydro projects. The government of Nepal subsequently approved the Build Operate and Transfer Policy on Roads in 1999, Public Infrastructure Build Operate and Transfer Policy in 2000, and the Private Financing in Build and Operation in Infrastructure in 2006, commonly referred to in Nepal as the BOOT Act (Ahmed, et al., 2012).
17 MoF (2015-2016) http://amis.mof.gov.np/
-4.22% -3.29%
-0.24% -0.08% -0.76%
-5.90%
-0.86% -0.62%
1.84% 2.07% 1.04%
-2.92%
-7.00%-6.00%-5.00%-4.00%-3.00%-2.00%-1.00%0.00%1.00%2.00%3.00%
2010 2011 2012 2013 2014 2015
Fiscal Deficit/ Surplus Before Foreign Grants Fiscal Deficit/Surplus After Foreign Grants
22
More recently, in 2015, the Government of Nepal approved a PPP policy that defines the broader contours of private sector participation in the country. The policy has identified energy, telecom, urban and rural environment as areas for PPP. Standalone Public Enterprise, Joint Ventures and Privatization are not considered PPP as per the legal definition in the policy paper. The policy provided the space for a Viability Gap Fund and project preparation facilities in order to help project developers and expedite PPP projects though the guidelines for Viability Gap Funding are yet to be established. The government should also identify the projects (long- and short-list) to be built under PPP and finalize the guiding regulations. Some of the major highlights of PPP Policy 2015 are summarized in the table below.
Table 4 Highlights of PPP Policy (2015)
Particulars Description
Land Acquisition The government is responsible for acquisition of land. There is a minimum percentage of land that needs be acquired before the project opens to bidding. In some exceptional cases, even the private party can acquire land.
Unsolicited Proposal
A process to handle unsolicited proposal has been specified: Once the proposal is received with the recommendation of the implementing agency, it has to go to the cabinet for approval. Then approval has to be given to the private party to prepare feasibility study and submit it. As per the draft legislation18 the unsolicited proposal will also go through open bidding process. If the proposal is awarded to the party other than the original solicitor, the awardee will reimburse the feasibility study cost19.
BOOT Act and BOOT Policies
The draft legislation will remove BOOT Act and BOOT Policies.
Project Development Fund
Ministry of Finance to take the lead on development of project development fund. The fund will be supported by the government budget; it will provide capital to implementing agencies to develop the projects.
Bid Parameters The procurement process in BOOT act is not precise in terms of bid parameters. The new policy is clear as it has a single parameter for evaluation of the bids.
Feasibility Study Ownership
Government is not required to conduct the feasibility study as per existing act (BOOT Act). But, the new policy specifies that implementing government agency will conduct the feasibility study.
Source: (CNI-Nepal, 2016) The National Planning Commission, the apex body that frames the country’s development plans and policies, is preparing for the appointment of the head of Public-Private Partnership (PPP) Center. The new policy states that PPP Center in NPC is responsible for the feasibility study during the preparatory state. The center is mandated to appraise the projects and help government agencies in preparing them (CNI-Nepal, 2016).
18 Government appointed Deloitte Consulting (India) to draft the legislation. The workshop organized on 17th November 2016 also revealed that the legislation would not require Power Purchase Agreement between Private Sector and NEA. The concerned implementing agencies will be responsible for the negotiation; it will be mentioned in feasibility report and the proposed structure. 19 PPP framework, interaction workshop organized by Centre for Nepalese Industry on 17th November 2016

23
A steering committee in PPP represented by Ministry of Finance, National Planning Commission and related stakeholders will approve the projects. Moreover, to facilitate the projects, in-house support units will be located in the project areas. The contingent liabilities to fund the PPP will be reflected in books of National Planning Commission20.
PPP activity in Nepal
As of 2016, PPP activity has largely been focused on energy (hydropower), also on provision of the most essential urban services, such as water supply and distribution, and to a lesser extent, on road and urban transportation management (PPP Knowledge Lab, 2015). The enactment of Hydropower Development Policy in 1992 and Electricity Act 1992 triggered private sector participation in infrastructure and most of the project initiated through PPP were energy projects, supported by government guarantees (Figure 13). Figure 13 PPP sector wise (Nepal)
Source: (PPI World Bank, 2016)
3.5 Assessment of Banking Sector and Capital Market
Banking Sector
The financial system in Nepal has been evolving quickly but remains bank dominated. Total financial sector assets (Credit and Investment) are equivalent to about 65 percent of GDP (Nepal Rastra Bank, 2016).The profile of banking and financial services sector in Nepal is highly dominated by 31 Commercial banks (class A) , 87 Development Banks (class B), 79 Finance companies (class C), 21 Micro Credit Development Banks (class D) and, 16 Savings and Co-operatives (Limited Banking). Total banks and financial institutions licensed by NRB is 229. The other institutions that are part of Nepalese financial system and have the ability to invest in development projects are:
x Insurance Companies x Employee Provident Fund (EPF) x Citizen Investment Trust (CIT) x Nepal Army Welfare Fund x Hydroelectricity Investment Development Company Limited (HIDCL)
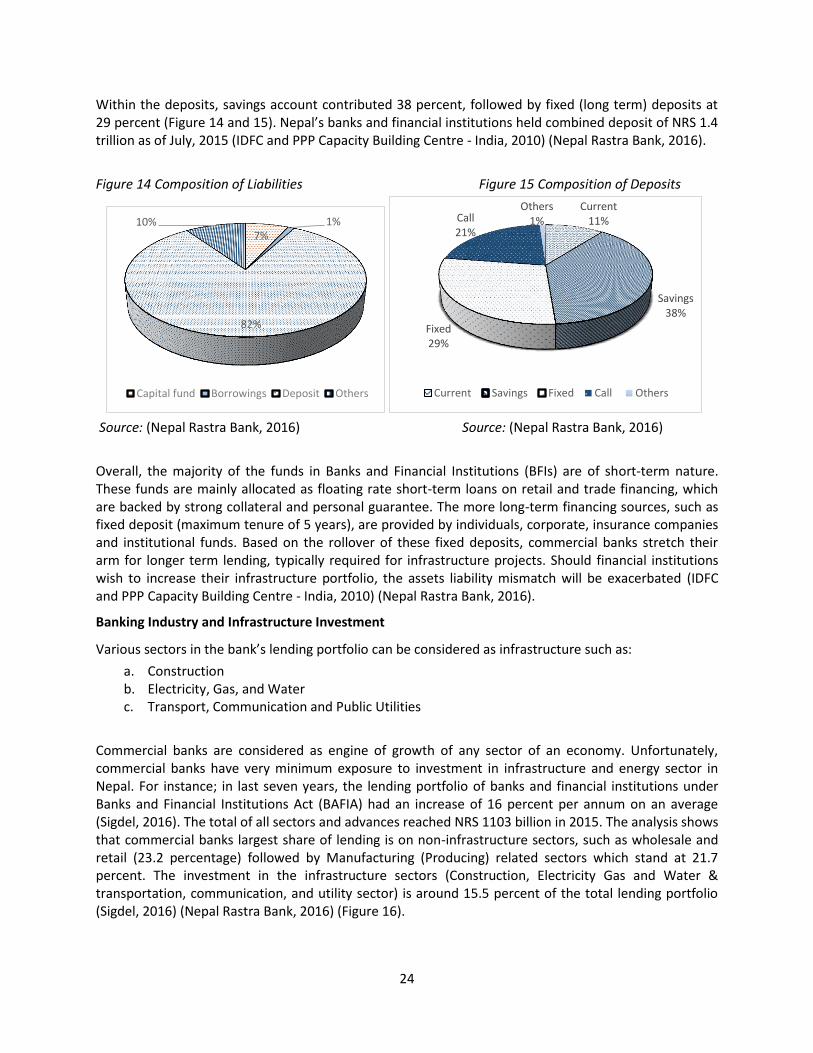
As per mid-July 2015 NRB statistics, of the total liabilities of the banking system, the contribution of capital fund was only 7 percent (also referred to Tier-I and Tier-II capital) whereas deposits contributed 82 percent (IDFC and PPP Capacity Building Centre - India, 2010) (Nepal Rastra Bank, 2016)(Figure 14).
20 KII- Dr. Sunil Babu Shrestha (Member-NPC)
Energy
Information and communicationtechnology (ICT)
Transport
24
Within the deposits, savings account contributed 38 percent, followed by fixed (long term) deposits at 29 percent (Figure 14 and 15). Nepal’s banks and financial institutions held combined deposit of NRS 1.4 trillion as of July, 2015 (IDFC and PPP Capacity Building Centre - India, 2010) (Nepal Rastra Bank, 2016). Figure 14 Composition of Liabilities Figure 15 Composition of Deposits
Source: (Nepal Rastra Bank, 2016) Source: (Nepal Rastra Bank, 2016) Overall, the majority of the funds in Banks and Financial Institutions (BFIs) are of short-term nature. These funds are mainly allocated as floating rate short-term loans on retail and trade financing, which are backed by strong collateral and personal guarantee. The more long-term financing sources, such as fixed deposit (maximum tenure of 5 years), are provided by individuals, corporate, insurance companies and institutional funds. Based on the rollover of these fixed deposits, commercial banks stretch their arm for longer term lending, typically required for infrastructure projects. Should financial institutions wish to increase their infrastructure portfolio, the assets liability mismatch will be exacerbated (IDFC and PPP Capacity Building Centre - India, 2010) (Nepal Rastra Bank, 2016).
Banking Industry and Infrastructure Investment
Various sectors in the bank’s lending portfolio can be considered as infrastructure such as: a. Construction b. Electricity, Gas, and Water c. Transport, Communication and Public Utilities
Commercial banks are considered as engine of growth of any sector of an economy. Unfortunately, commercial banks have very minimum exposure to investment in infrastructure and energy sector in Nepal. For instance; in last seven years, the lending portfolio of banks and financial institutions under Banks and Financial Institutions Act (BAFIA) had an increase of 16 percent per annum on an average (Sigdel, 2016). The total of all sectors and advances reached NRS 1103 billion in 2015. The analysis shows that commercial banks largest share of lending is on non-infrastructure sectors, such as wholesale and retail (23.2 percentage) followed by Manufacturing (Producing) related sectors which stand at 21.7 percent. The investment in the infrastructure sectors (Construction, Electricity Gas and Water & transportation, communication, and utility sector) is around 15.5 percent of the total lending portfolio (Sigdel, 2016) (Nepal Rastra Bank, 2016) (Figure 16).
7% 1%
82%
10%
Capital fund Borrowings Deposit Others
Current 11%
Savings 38%
Fixed 29%
Call 21%
Others 1%
Current Savings Fixed Call Others

25
Figure 16 Composition of loans and advances (2010-2016)
Source (Nepal Rastra Bank, 2016), Author’s Calculations
Lending Limits
There is a limitation on the exposure of loan and guarantee to a single person or group of associated person. Popularly known as single obligatory limit, the requirement restricts the maximum amount of loan concentrated in a single person including the groups not to be more than 50 percent of the core capital (in hydropower sector, cable car and transmission lines), 30 percent of core capital in case of productive sectors and 25 percent of core capital in case of other sectors. Also, there is a sectorial limit to exposure of banks and financial institutions, which restricts the investment to be not more than 40 percent of bank lending (Khatiwada, et al., n.d.). The capital base of banks and financial institution amounts to NRS 160 billion (Khatiwada, et al., n.d.). The total maximum exposure to a single burrower in a hydropower projects, assuming all commercial banks in Nepal are involved, is limited to approximately NRS 40 billion (Khatiwada, et al., n.d.). If it costs around NRS 200 million or more per MW21,200 MW is the largest project that can be financed with 100 percent domestic financing. This would be sufficient to finance two medium sized hydropower projects, but in an actual scenario, 100 percent domestic financing is not feasible, because it would be a highly complex deal and there is no guarantee that all the commercial banks in Nepal would have sufficient portfolio to diverse the risk. In fact, the banks are not even lending up to the requirement set by the regulator, the current investment to the hydropower sector is below the 15 percent (NRS 38 billion) mandated by the Monetary Policy 2016 to commercial banks (Figure 17).22 Assets liability mismatch, project risk and lack of technical skills can explain this low allocation to infrastructure sectors.
21 http://kathmandupost.ekantipur.com/news/2014-09-22/powering-nepal.html 22 Fifteen percent of the total outstanding loan of all commercial banks in Nepal is on Electricity, gas and water sector (EGW), which can be taken as a proxy for investment in hydropower. It is a conservative estimate as total lending in hydro will be lower than total EGW.
0% 10% 20% 30% 40% 50% 60% 70% 80% 90% 100%
2010
2011
2012
2013
2014
2015
2016
Construction Electricity,Gas and Water
Transport, Communication and Public Utilities Non Infrastructure
Others
26
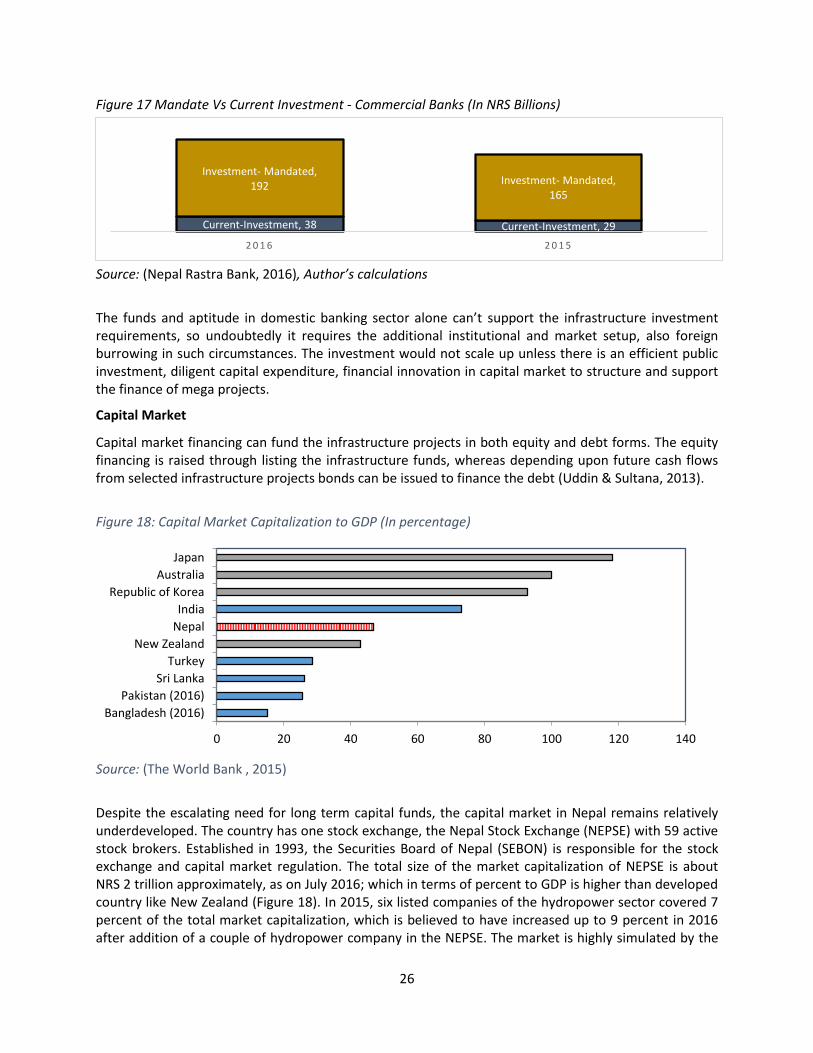
Figure 17 Mandate Vs Current Investment - Commercial Banks (In NRS Billions)
Source: (Nepal Rastra Bank, 2016), Author’s calculations The funds and aptitude in domestic banking sector alone can’t support the infrastructure investment requirements, so undoubtedly it requires the additional institutional and market setup, also foreign burrowing in such circumstances. The investment would not scale up unless there is an efficient public investment, diligent capital expenditure, financial innovation in capital market to structure and support the finance of mega projects.
Capital Market
Capital market financing can fund the infrastructure projects in both equity and debt forms. The equity financing is raised through listing the infrastructure funds, whereas depending upon future cash flows from selected infrastructure projects bonds can be issued to finance the debt (Uddin & Sultana, 2013). Figure 18: Capital Market Capitalization to GDP (In percentage)
Source: (The World Bank , 2015) Despite the escalating need for long term capital funds, the capital market in Nepal remains relatively underdeveloped. The country has one stock exchange, the Nepal Stock Exchange (NEPSE) with 59 active stock brokers. Established in 1993, the Securities Board of Nepal (SEBON) is responsible for the stock exchange and capital market regulation. The total size of the market capitalization of NEPSE is about NRS 2 trillion approximately, as on July 2016; which in terms of percent to GDP is higher than developed country like New Zealand (Figure 18). In 2015, six listed companies of the hydropower sector covered 7 percent of the total market capitalization, which is believed to have increased up to 9 percent in 2016 after addition of a couple of hydropower company in the NEPSE. The market is highly simulated by the
Current-Investment, 38 Current-Investment, 29
Investment- Mandated, 192 Investment- Mandated,
165
2 0 1 6 2 0 1 5
0 20 40 60 80 100 120 140
Bangladesh (2016)Pakistan (2016)
Sri LankaTurkey
New ZealandNepalIndia
Republic of KoreaAustralia
Japan

27
trade of banks shares, mostly due to the issue of right shares by the commercial banks (Figure 19). The banks issue right shares to increase the capital size and to abide the regulatory capital requirements set by the central bank, and investors find it as a safe haven to get the maximum gain through retail trading.
Figure 19: Primary market trend (In NRS Ten million)
Source: Securities Board of Nepal (2015), Author’s calculations
The Bond market in Nepal has not been matured enough and existing bond market is largely stirred by securities such “Development Bonds, National Savings Certificate, Private Saving Card and Special Bonds”. Government bonds makes up 24 percent of the total market capitalization. The bonds are held by a small number of institutional investors and are rarely traded in the secondary market. The largest investors in government securities are commercial banks which holds approximately 62 percent on average, they mostly invest in government securities to meet statutory liquidity requirements. The trend has been same since last decade (Figure 20).
Figure 20 Institutions holding government securities (percentage)
Source: Security Exchange Board mentioned in MoF (2015), Author’s calculation
0
200
400
600
800
1000
1200
0200400600800
100012001400160018002000
1994
1995
1996
1997
1998
1999
2000
2001
2002
2003
2004
2005
2006
2007
2008
2009
2010
2011
2012
2013
2014
2015
Ordinary Shares Rights Shares Preferential Shares
Debentures Citizens' Unitary Plan Mutuall Fund
NEPSE Index (In point) *
0%
20%
40%
60%
80%
100%
2009 2010 2011 2012 2013 2014 2015
Nepal Rastra Bank Commercial Banks Others

28
Private sector generally does not trade these securities because the returns are negative in real term, and under the prevailing market conditions fixed deposits with banks provide the highest rate of return compared to government securities and are thus more lucrative for fund’s investment managers (SEBON 2014/2015). There is no active secondary market23, neither active credit rating agency to rate them, the transactions are exceptionally low to the extent that it is not sufficient to expose detailed yield curve of the Nepalese Bond market system. So, as a result, there is no price discovery of the bonds. Additionally, the lack of corporate governance standards, poor transparency in companies’ financial statements, and lack of a credit rating system make investing debt dubious. The maturity and development of the bond market are imperative for the growth of financial market which in turn has substantial positive spillover effects in an economy. It has the potential to develop and mitigate the challenge of long-term funding mismatch faced by the bank-dominated financial sector. A vibrant bond market is also necessary to reducing financial sector fragility and providing much-needed long-term capital for infrastructure financing.
3.6 Institutional Investors
The long-term nature of infrastructure projects matches the long-term liabilities of institutional investors, such as pension funds, insurance companies and sovereign wealth funds. Therefore, infrastructure might be an interesting asset class for them, which could offer opportunities in terms of return, portfolio diversification due to their low correlations to other asset classes and inflation protection. The following sections provide an overview of institutional investors in Nepal.
Insurance companies
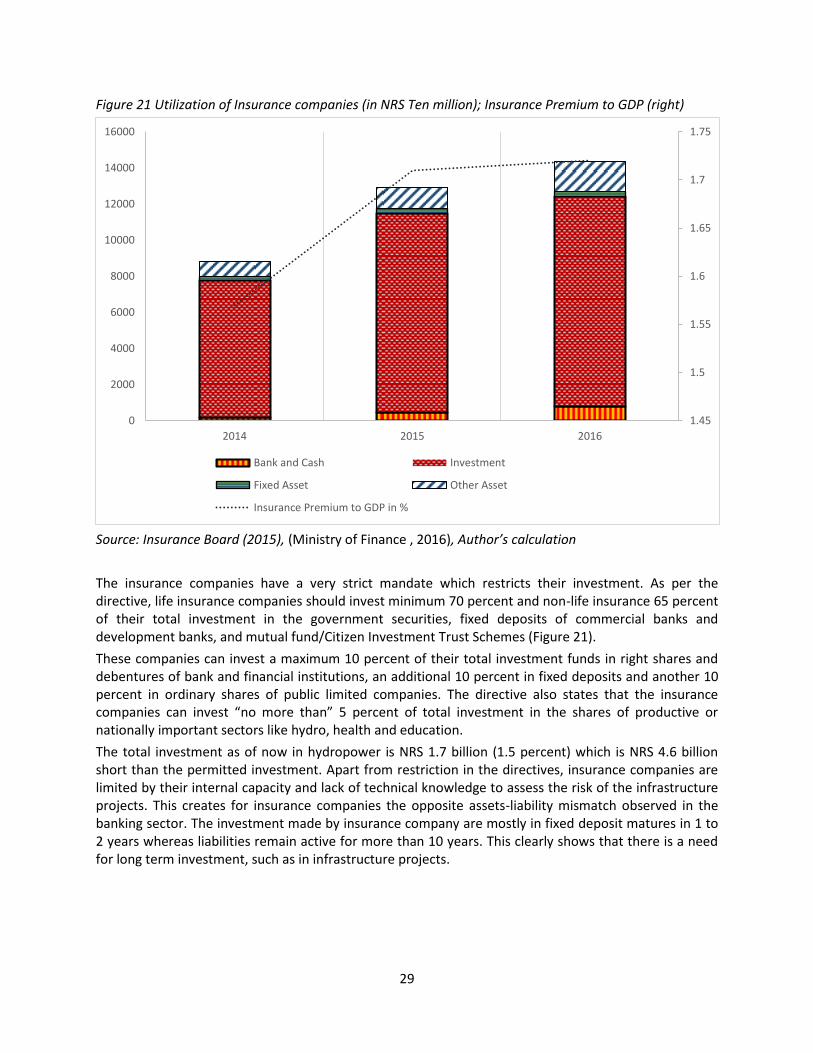
Until mid-July 2015, there were a total of 27 insurance companies operating in Nepal, 17 of them non-life insurance, 9 life insurance and one composite (life and non-life), all established under Insurance Act, 1992. The total utilization of these companies increased by 10.76 percent from the previous year and reached NRS 143 billion in mid-July 2015. Also, the contribution of insurance premium to GDP has increased over the years (Figure 21) Insurance companies use their funds (capital, reserves, premiums, and loans) to finance claim payments and other expenses. The remaining funds are invested as per the Investment Directives24 circulated by the insurance board. As of 2016, these insurance companies have investments assets up to of NRS 116 billion (USD 1.6 billion) out of which NRS100 billion (USD 1 billion) is from life insurance companies and the rest is from non-life insurance companies.
23 “The difference between the primary capital market and the secondary capital market is that in the primary market, investors buy securities directly from the company issuing them, while in the secondary market, investors trade securities among themselves, and the company with the security being traded does not participate in the transaction.” (www.investopedia.com) 24 Life Insurance (Directive 2071 B.S) http://www.bsib.org.np/images/download/Sansodhitpercent20Lifepercent20Lagani,percent202071.pdf Nonlife insurance (Directive 2071 B.S) http://www.bsib.org.np/images/download/Sansodhitpercent20Non-percent20lifepercent20Lagani,percent202071.pdf
29
Figure 21 Utilization of Insurance companies (in NRS Ten million); Insurance Premium to GDP (right)
Source: Insurance Board (2015), (Ministry of Finance , 2016), Author’s calculation The insurance companies have a very strict mandate which restricts their investment. As per the directive, life insurance companies should invest minimum 70 percent and non-life insurance 65 percent of their total investment in the government securities, fixed deposits of commercial banks and development banks, and mutual fund/Citizen Investment Trust Schemes (Figure 21). These companies can invest a maximum 10 percent of their total investment funds in right shares and debentures of bank and financial institutions, an additional 10 percent in fixed deposits and another 10 percent in ordinary shares of public limited companies. The directive also states that the insurance companies can invest “no more than” 5 percent of total investment in the shares of productive or nationally important sectors like hydro, health and education. The total investment as of now in hydropower is NRS 1.7 billion (1.5 percent) which is NRS 4.6 billion short than the permitted investment. Apart from restriction in the directives, insurance companies are limited by their internal capacity and lack of technical knowledge to assess the risk of the infrastructure projects. This creates for insurance companies the opposite assets-liability mismatch observed in the banking sector. The investment made by insurance company are mostly in fixed deposit matures in 1 to 2 years whereas liabilities remain active for more than 10 years. This clearly shows that there is a need for long term investment, such as in infrastructure projects.
1.45
1.5
1.55
1.6
1.65
1.7
1.75
0
2000
4000
6000
8000
10000
12000
14000
16000
2014 2015 2016
Bank and Cash Investment
Fixed Asset Other Asset
Insurance Premium to GDP in %
30
Employee Provident Fund
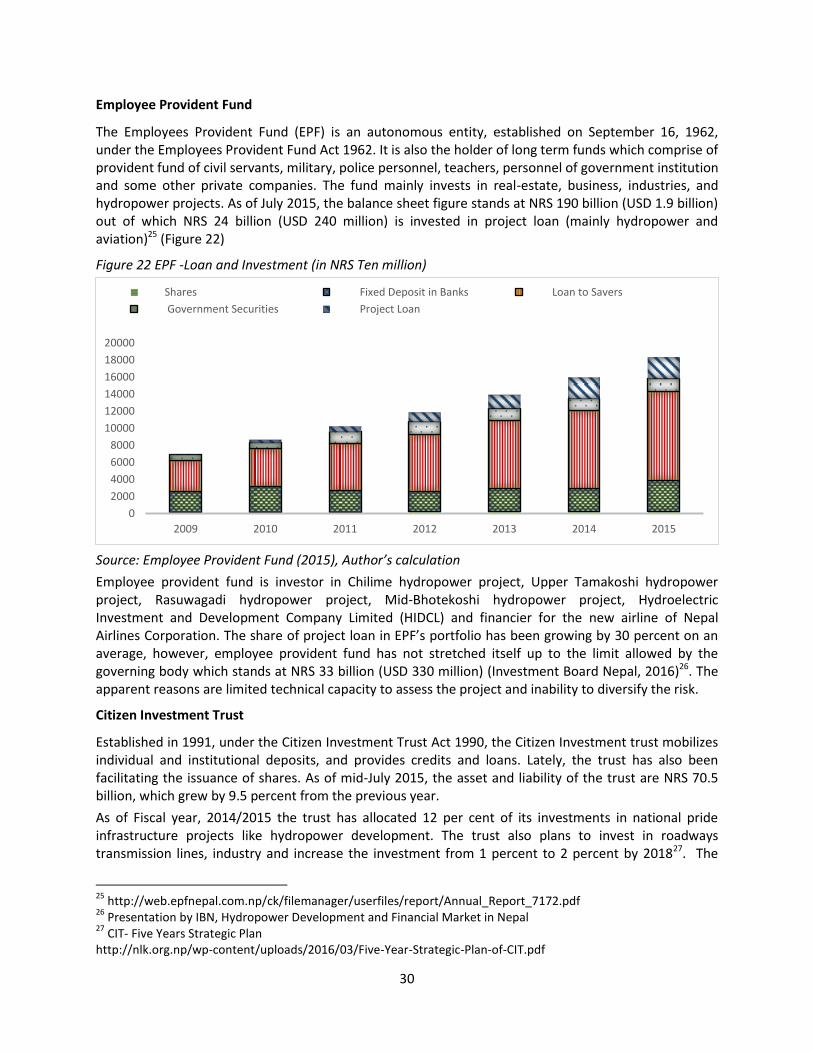
The Employees Provident Fund (EPF) is an autonomous entity, established on September 16, 1962, under the Employees Provident Fund Act 1962. It is also the holder of long term funds which comprise of provident fund of civil servants, military, police personnel, teachers, personnel of government institution and some other private companies. The fund mainly invests in real-estate, business, industries, and hydropower projects. As of July 2015, the balance sheet figure stands at NRS 190 billion (USD 1.9 billion) out of which NRS 24 billion (USD 240 million) is invested in project loan (mainly hydropower and aviation)25 (Figure 22)
Figure 22 EPF -Loan and Investment (in NRS Ten million)
Source: Employee Provident Fund (2015), Author’s calculation Employee provident fund is investor in Chilime hydropower project, Upper Tamakoshi hydropower project, Rasuwagadi hydropower project, Mid-Bhotekoshi hydropower project, Hydroelectric Investment and Development Company Limited (HIDCL) and financier for the new airline of Nepal Airlines Corporation. The share of project loan in EPF’s portfolio has been growing by 30 percent on an average, however, employee provident fund has not stretched itself up to the limit allowed by the governing body which stands at NRS 33 billion (USD 330 million) (Investment Board Nepal, 2016)26. The apparent reasons are limited technical capacity to assess the project and inability to diversify the risk.
Citizen Investment Trust
Established in 1991, under the Citizen Investment Trust Act 1990, the Citizen Investment trust mobilizes individual and institutional deposits, and provides credits and loans. Lately, the trust has also been facilitating the issuance of shares. As of mid-July 2015, the asset and liability of the trust are NRS 70.5 billion, which grew by 9.5 percent from the previous year. As of Fiscal year, 2014/2015 the trust has allocated 12 per cent of its investments in national pride infrastructure projects like hydropower development. The trust also plans to invest in roadways transmission lines, industry and increase the investment from 1 percent to 2 percent by 201827. The
25 http://web.epfnepal.com.np/ck/filemanager/userfiles/report/Annual_Report_7172.pdf 26 Presentation by IBN, Hydropower Development and Financial Market in Nepal 27 CIT- Five Years Strategic Plan http://nlk.org.np/wp-content/uploads/2016/03/Five-Year-Strategic-Plan-of-CIT.pdf
02000400060008000
100001200014000160001800020000
2009 2010 2011 2012 2013 2014 2015
Shares Fixed Deposit in Banks Loan to Savers Government Securities Project Loan
31
total investment potential of citizen investment trust to invest in infrastructure sectors is NRS 18 billion of which current investment in Hydropower stands at NRS 1.20 billion (4 percent of total investment).
3.7 State Owned Enterprises
State-owned enterprises or Public enterprises (PE) in Nepal were at the frontline during the sixties and seventies. As private sector was too weak to carry the task of catering or building the infrastructure services most of the PEs were established with the help of foreign assistance guided with an objective of economic development and to fulfill government’s responsibility towards the general public. But, gradually the public enterprises confronted with a myriad of problems. A number of government interventions and measures were executed to reform the public enterprises-like Structural Adjustment Program, but they failed to produce the desired results (Ghimire, 2015). In 1984 -1986 public enterprises suffered the cumulative loss of Rs 44 million, immediately followed by announcement of privatization in Sixth Five-Year plan (1980-85), however, privatization in the real senses started from 1994. Altogether 30 public enterprises were privatized, and as of 2nd August 2014, only 11 are active (under operation) and five of them are making profits28 (Ministry of Finance, 2016). The Government of Nepal has a controlling interest in 37 enterprises in 2016, the enterprises are divided into six categories: industrial (7), trading (5), service sector (7), social sector (5), public utility (3) and financial sector (9). In the list, eight state-owned enterprises are directly working for infrastructure development or infrastructure related services (Table 5). Table 5 Public Enterprises- Utilities and Infrastructure
Public Enterprise Name Sector
National Construction Company Nepal Ltd Industrial Sector
Nepal Airlines Corporation Service Sector
Civil Aviation Authority Nepal Service Sector
Nepal Drinking Water Corporation Public Utility Sector
Nepal Electric Authority Public Utility Sector
Nepal Doorsanchar Company Public Utility Sector
Nepal Housing Development Finance Finance Sector
Hydroelectricity Investment & Development Co Finance Sector
Source: (Ministry of Finance, 2016) The total operating profits of public enterprises decreased from 0.75 percent of GDP to 0.17 percent of GDP in Fiscal year 2015 but increased to 1.69 percent in 2016. Meanwhile, Nepal Oil corporation and Nepal Electricity Authority (NEA) suffered a huge loss on 2011, and the government wrote off NEA’s NRS 27.5 billion (USD 270 million) debt in FY2011 to help in its financial turnaround and reforms.
28 http://kathmandupost.ekantipur.com/news/2014-08-02/5-of-30-privatised-pes-making-profits.html

32
The unfunded liabilities29 and other administrative expenses have been increasing over the years. As on the end of the fiscal year 11, the unfunded liabilities of enterprises had reached to NRS.16.84 billion which increased by 25.93 percent and has reached to Rs.27.19 billion as on the end of fiscal year 15. The weak financial position of PEs has led to large unfunded liabilities, especially for pension and other related retirement benefits, which could ultimately become the government’s burden.30 Almost all public enterprises receive investment from the government. Government investment in utility related PE (Nepal Telecom, Nepal Electricity Authority, Nepal Water Supply Corporation) for the fiscal year 2016 has been NRS 74 billion (USD 740 million) in share investment, and in loan investment NRS 103 billion (USD 1 billion) (Ministry of Finance , 2016). Government has made net investment of NRS 2852 billion since 2005, where public utilities and financial sectors were the highest recipient of the investment. Despite, the high level of investment, some key public utility and infrastructure services providers, in particular, continue to make heavy losses. For example, NEA’s financial envelope has been waning steeply in recent years. High system loss, which stands at 26.4 percent, high costs of supply and insufficient increase in retail tariffs, among other factors31. Among nine financial sectors PEs, Hydroelectric Investment and Development Company Limited has been set as special purpose vehicle to implement hydropower development programs of the government32. The PE was established on 6th July 2011 where 80 percent of equity (NRS 5 billion) (USD 50 million) belongs to the government. The authorized capital of the company is NRS 50 billion, and the issued capital – NRS 10 billion (USD 100 million), which is distributed in the following shareholding pattern.
29 Salary, pension and social cost 30 Ministry of Finance (2015/2016) http://www.mof.gov.np/uploads/document/file/Yellowpercent20Bookpercent202073_20160526075459.pdf 31http://documents.worldbank.org/curated/en/572781468122661283/text/PAD10110P1463400900IDA0R20140034601.txt 32 http://www.hidcl.org.np/capital-structure.php
Shareholders Amount (NRS) Amount (USD)
Government of Nepal 5 billion 50 million
Karmachari Sanchaya Kosh 1 billion 10 million
Citizen Investment Trust (CIT) 1 billion 10 million
General Public 2 billion 20 million
Rastriya Beema Sanstha 1 billion 10 million

33
4. Overview of Regulatory Environment:
Nepal doesn’t have standalone national policy, legal or regulatory framework for infrastructure investment. So far, the focus of the private sector and the government has been in the hydro-power sector. Nevertheless, this section will assess sector-specific key legal and the regulatory provisions that are relevant or related to the infrastructure financing.
4.1 Monetary Policy:
The central bank has been exercising various policies to establish robust a monetary system, develop conducive environment for financing and fill the demand and supply gap of investment in the infrastructure. Various incentives related to infrastructure financing have been proposed in the successive Monetary Policies. Some of the core highlights of Monetary Policy are as below. For example, Bank and Financial Institutions (BFI)’s credit to micro-hydro projects counted as loans to deprived sector (Monetary Policy 2009), and the deprived sector credit requirement for BFI was increased by 0.5 percent of their total credit (IDFC and PPP Capacity Building Centre - India, 2010). While the domestic financial market doesn’t have the required aptitude and structural capacity to cater the needs of large-scale hydropower development projects, the banks are still financing development of smaller projects (IDFC and PPP Capacity Building Centre - India, 2010) (Nepal Rastra Bank, 2016). Further, the monetary policy also mandated commercial banks of financial institutions to disburse 20 percent of their total credit to specified productive sectors, including energy. This regulation has to some extent led commercial banks to expand their lending portfolio on the micro-hydro power sector (IDFC and PPP Capacity Building Centre - India, 2010). Recently, Monetary Policy 2015-16 (clause 68) and Budget speech 2015-2016 declared that provisions will be made for the establishment of a national level infrastructure bank and a special policy provision would be made for the licensing of the specialized bank. The statements also declared that infrastructure bank should require minimum paid up capital of NRS 20 billion and it can be entirely financed with domestic investment or jointly with foreign investors (Sigdel, 2016) (Nepal Rastra Bank, 2016). The policy also requires banks and financial institutions to increase the minimum paid up capital. The motive of the policy is to ensure financial stability and mobilize the resources needed for the long-term development.
Table 6 Minimum Paid-up Capital as per Monetary Policy
Category of BFIs Capital Mandate
Commercial Banks NRS 8 billion USD 80 million
National Development Banks NRS 2.5 billion USD 25 million
Development Banks Operating in 4 to 10 districts NRS 1.2 billion USD 12 million
Development Banks Operating in 1 to 3 districts NRS 0.50 billion USD 5 million
Sources: (Nepal Rastra Bank, 2016), (Sigdel, 2016)
The financial institutions are mandated to meet the requirement by mid-July 2017. Given the need of the huge capital base and the number of banks in Nepal, it is a challenge for the financial institutions to raise the capital exclusively from the market. As a result, some of the financial institutions started going for merger and acquisition following the monetary policy. It is believed that merger and acquisition would ensure the financial stability and increase the volume of lending portfolio, thereby eventually
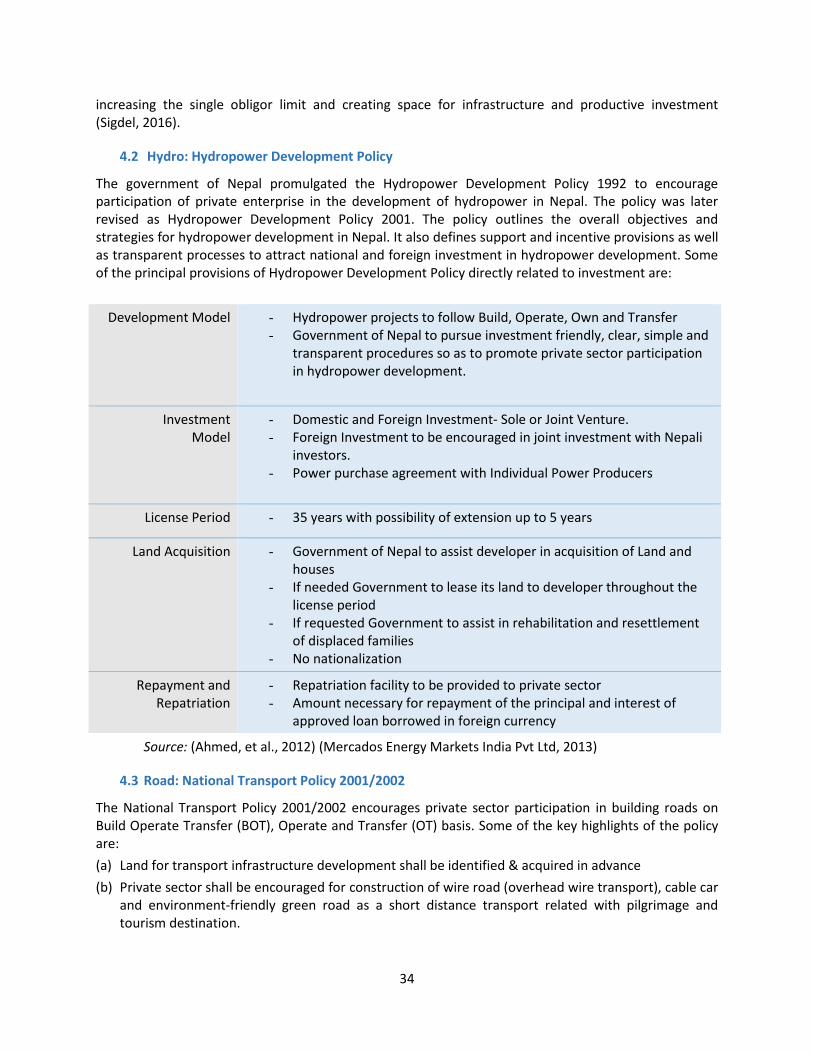
34
increasing the single obligor limit and creating space for infrastructure and productive investment (Sigdel, 2016).
4.2 Hydro: Hydropower Development Policy
The government of Nepal promulgated the Hydropower Development Policy 1992 to encourage participation of private enterprise in the development of hydropower in Nepal. The policy was later revised as Hydropower Development Policy 2001. The policy outlines the overall objectives and strategies for hydropower development in Nepal. It also defines support and incentive provisions as well as transparent processes to attract national and foreign investment in hydropower development. Some of the principal provisions of Hydropower Development Policy directly related to investment are:
Source: (Ahmed, et al., 2012) (Mercados Energy Markets India Pvt Ltd, 2013)
4.3 Road: National Transport Policy 2001/2002
The National Transport Policy 2001/2002 encourages private sector participation in building roads on Build Operate Transfer (BOT), Operate and Transfer (OT) basis. Some of the key highlights of the policy are: (a) Land for transport infrastructure development shall be identified & acquired in advance (b) Private sector shall be encouraged for construction of wire road (overhead wire transport), cable car
and environment-friendly green road as a short distance transport related with pilgrimage and tourism destination.
Development Model - Hydropower projects to follow Build, Operate, Own and Transfer - Government of Nepal to pursue investment friendly, clear, simple and
transparent procedures so as to promote private sector participation in hydropower development.
Investment Model
- Domestic and Foreign Investment- Sole or Joint Venture. - Foreign Investment to be encouraged in joint investment with Nepali
investors. - Power purchase agreement with Individual Power Producers
License Period - 35 years with possibility of extension up to 5 years
Land Acquisition - Government of Nepal to assist developer in acquisition of Land and houses
- If needed Government to lease its land to developer throughout the license period
- If requested Government to assist in rehabilitation and resettlement of displaced families
- No nationalization
Repayment and Repatriation
- Repatriation facility to be provided to private sector - Amount necessary for repayment of the principal and interest of
approved loan borrowed in foreign currency
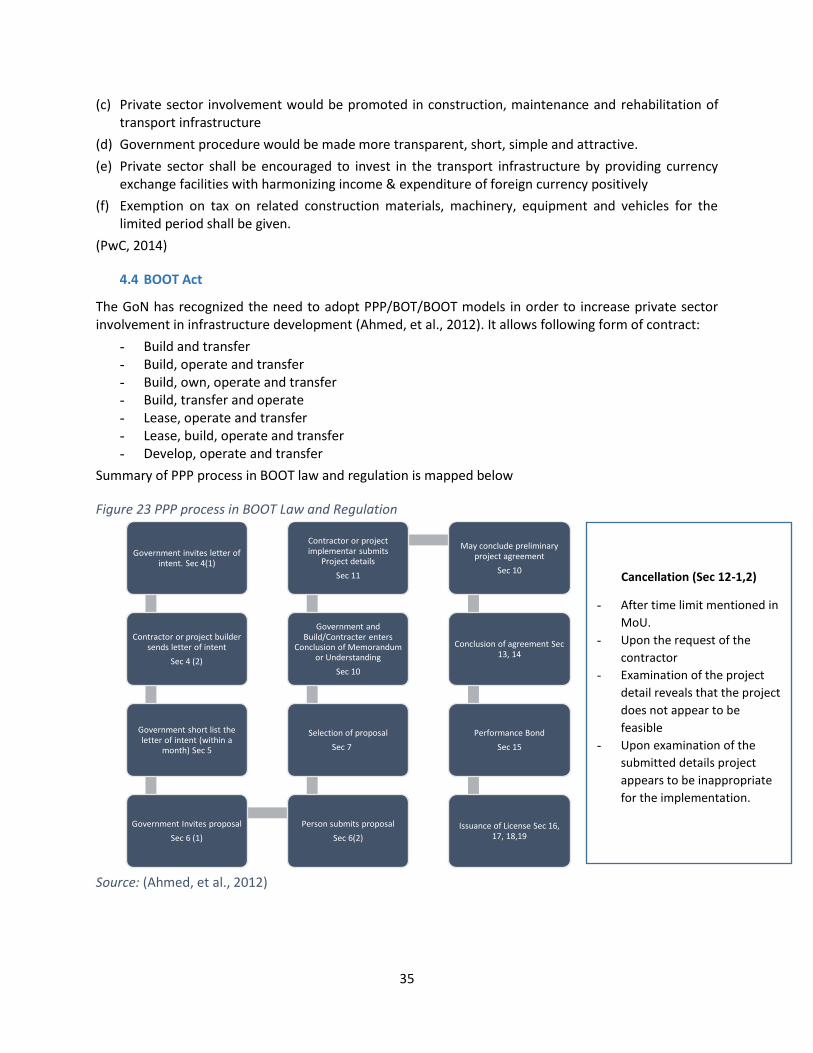
35
(c) Private sector involvement would be promoted in construction, maintenance and rehabilitation of transport infrastructure
(d) Government procedure would be made more transparent, short, simple and attractive. (e) Private sector shall be encouraged to invest in the transport infrastructure by providing currency
exchange facilities with harmonizing income & expenditure of foreign currency positively (f) Exemption on tax on related construction materials, machinery, equipment and vehicles for the
limited period shall be given. (PwC, 2014)
4.4 BOOT Act
The GoN has recognized the need to adopt PPP/BOT/BOOT models in order to increase private sector involvement in infrastructure development (Ahmed, et al., 2012). It allows following form of contract:
- Build and transfer - Build, operate and transfer - Build, own, operate and transfer - Build, transfer and operate - Lease, operate and transfer - Lease, build, operate and transfer - Develop, operate and transfer
Summary of PPP process in BOOT law and regulation is mapped below
Figure 23 PPP process in BOOT Law and Regulation
Source: (Ahmed, et al., 2012)
Government invites letter of intent. Sec 4(1)
Contractor or project builder sends letter of intent
Sec 4 (2)
Government short list the letter of intent (within a
month) Sec 5
Government Invites proposal Sec 6 (1)
Person submits proposal Sec 6(2)
Selection of proposal Sec 7
Government and Build/Contracter enters
Conclusion of Memorandum or Understanding
Sec 10
Contractor or project implementar submits
Project details Sec 11
May conclude preliminary project agreement
Sec 10
Conclusion of agreement Sec 13, 14
Performance Bond Sec 15
Issuance of License Sec 16, 17, 18,19
Cancellation (Sec 12-1,2)
- After time limit mentioned in MoU.
- Upon the request of the contractor
- Examination of the project detail reveals that the project does not appear to be feasible
- Upon examination of the submitted details project appears to be inappropriate for the implementation.
36
4.5 Investment Board Act
The Government of Nepal under The Investment Board Act (Act 7) institutionalized an Investment Board to create “an investment friendly environment for mobilizing and managing Public-Private Partnership, co-operative and domestic and foreign private investment required for the development of infrastructure and other sectors” (Ahmed, et al., 2012). The investment board is empowered to mobilize investment in transport, large hydropower (500 MW and above) and investment projects above NRS 10 billion. Competitive bidding is not explicitly mandated by the act; the board follows the process of accepting unsolicited proposals- projects are developed by the private sectors and submitted for review and negotiations with IBN. The board can directly negotiate the contract with investors, not only this, it can also grant the license which in normal case are in the purview of line ministries (Ahmed, et al., 2012). The board has the mandate to develop 14 large projects out of which 8 are infrastructure projects, an infrastructure development bank, and the Kathmandu Metro System. The Investment Board has further identified fifteen projects and signed MoU with IFC. IFC will help the board with the feasibility analysis and sectorial analysis (Ahmed, et al., 2012) (Investment Board Nepal, 2016).
4.6 Land Acquisition:
The investor must negotiate with the owner of the land to either purchase or lease the land owned by private individuals. After negotiation and settlement, the purchase deeds are registered at the Land Management Office. The whole acquisition process is governed by Land Acquisition Act (1977) and Land Resettlement and Rehabilitation Policy (2015). But, if forest land has to be obtained (e.g., in the case of mining, hydropower projects or infrastructure projects), the investor must follow a process prescribed by the Ministry of Forests and Soil Conservation. In this case, Ministry may ask for an equal amount of private land to be procured for the use as forest land. In the case of government (non-forest) land, the land can be leased by the investor according to the Land Leasing Policy 2014. The lease term is renewal and ranges from 10–50 years (Investment Board Nepal, 2016).
Land Acquisition Act
Land Acquisition Act 1977 which is still prevalent act, although the parliamentary committee has directed the government many times to amend the act and aligned it with the Land Acquisition, Resettlement, and Rehabilitation Policy 2015.33 Section 3 “Power of Government of Nepal to Acquire Land for Public Purpose” reads “Government of Nepal may, it so deems necessary, acquire any land at any place for any public purpose, subject to compensation under this Act”34. Compensation (Section 7) provision states the compensation shall be made for losses emancipating from “clearing of crops and trees, and of demolition of walls, etc., or for any damage, if any, suffered as a result of the removal of digging of earth, stone, or boring”. However, the act is silent regarding rehabilitation of people who have to be relocated from the infrastructure project area. As a consequence, the uncertainty looms dissatisfaction, protests and sometimes exorbitant compensation demand, which `delays the project implementation and causes the cost and time overruns35. 33 http://www.myrepublica.com/news/9077 34 http://www.lawcommission.gov.np/en/documents/2015/08/land-acquisition-act-2034-1977.pdf 35 http://kathmandupost.ekantipur.com/news/2014-03-26/land-acquisition-issues-peg-back-infra-projects.html
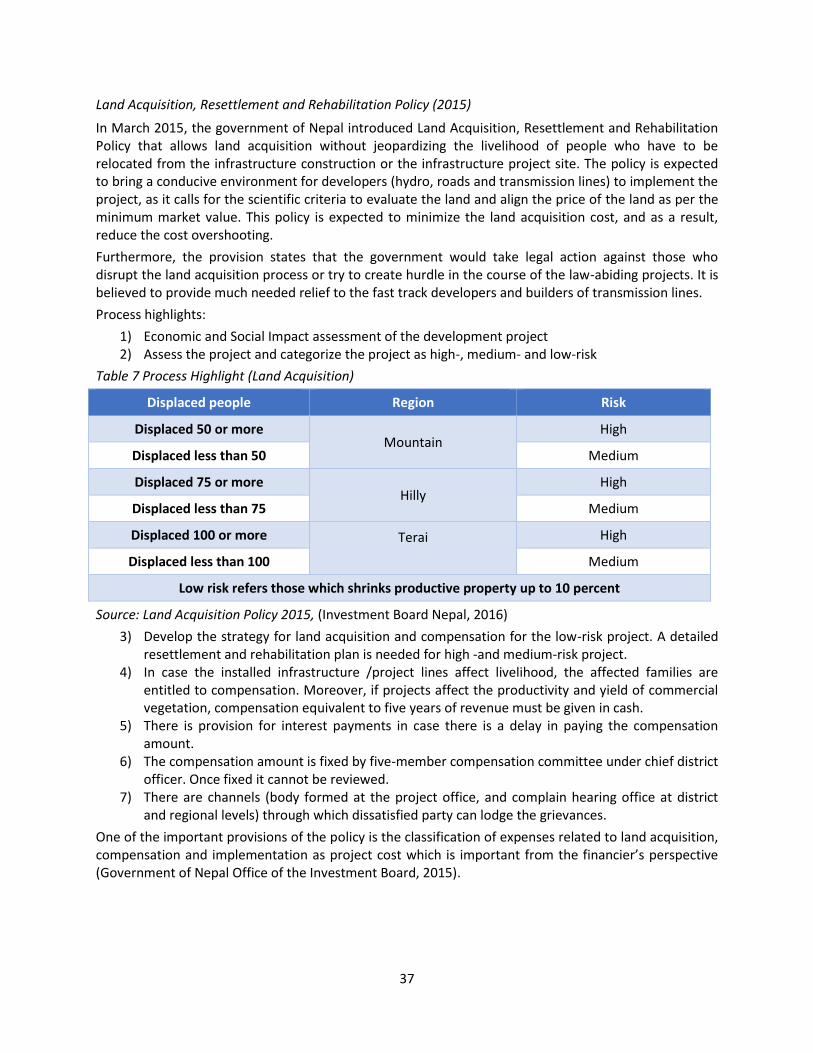
37
Land Acquisition, Resettlement and Rehabilitation Policy (2015) In March 2015, the government of Nepal introduced Land Acquisition, Resettlement and Rehabilitation Policy that allows land acquisition without jeopardizing the livelihood of people who have to be relocated from the infrastructure construction or the infrastructure project site. The policy is expected to bring a conducive environment for developers (hydro, roads and transmission lines) to implement the project, as it calls for the scientific criteria to evaluate the land and align the price of the land as per the minimum market value. This policy is expected to minimize the land acquisition cost, and as a result, reduce the cost overshooting. Furthermore, the provision states that the government would take legal action against those who disrupt the land acquisition process or try to create hurdle in the course of the law-abiding projects. It is believed to provide much needed relief to the fast track developers and builders of transmission lines. Process highlights:
1) Economic and Social Impact assessment of the development project 2) Assess the project and categorize the project as high-, medium- and low-risk
Table 7 Process Highlight (Land Acquisition)
Displaced people Region Risk
Displaced 50 or more Mountain
High
Displaced less than 50 Medium
Displaced 75 or more Hilly
High
Displaced less than 75 Medium
Displaced 100 or more Terai
High
Displaced less than 100 Medium
Low risk refers those which shrinks productive property up to 10 percent
Source: Land Acquisition Policy 2015, (Investment Board Nepal, 2016) 3) Develop the strategy for land acquisition and compensation for the low-risk project. A detailed
resettlement and rehabilitation plan is needed for high -and medium-risk project. 4) In case the installed infrastructure /project lines affect livelihood, the affected families are
entitled to compensation. Moreover, if projects affect the productivity and yield of commercial vegetation, compensation equivalent to five years of revenue must be given in cash.
5) There is provision for interest payments in case there is a delay in paying the compensation amount.
6) The compensation amount is fixed by five-member compensation committee under chief district officer. Once fixed it cannot be reviewed.
7) There are channels (body formed at the project office, and complain hearing office at district and regional levels) through which dissatisfied party can lodge the grievances.
One of the important provisions of the policy is the classification of expenses related to land acquisition, compensation and implementation as project cost which is important from the financier’s perspective (Government of Nepal Office of the Investment Board, 2015).
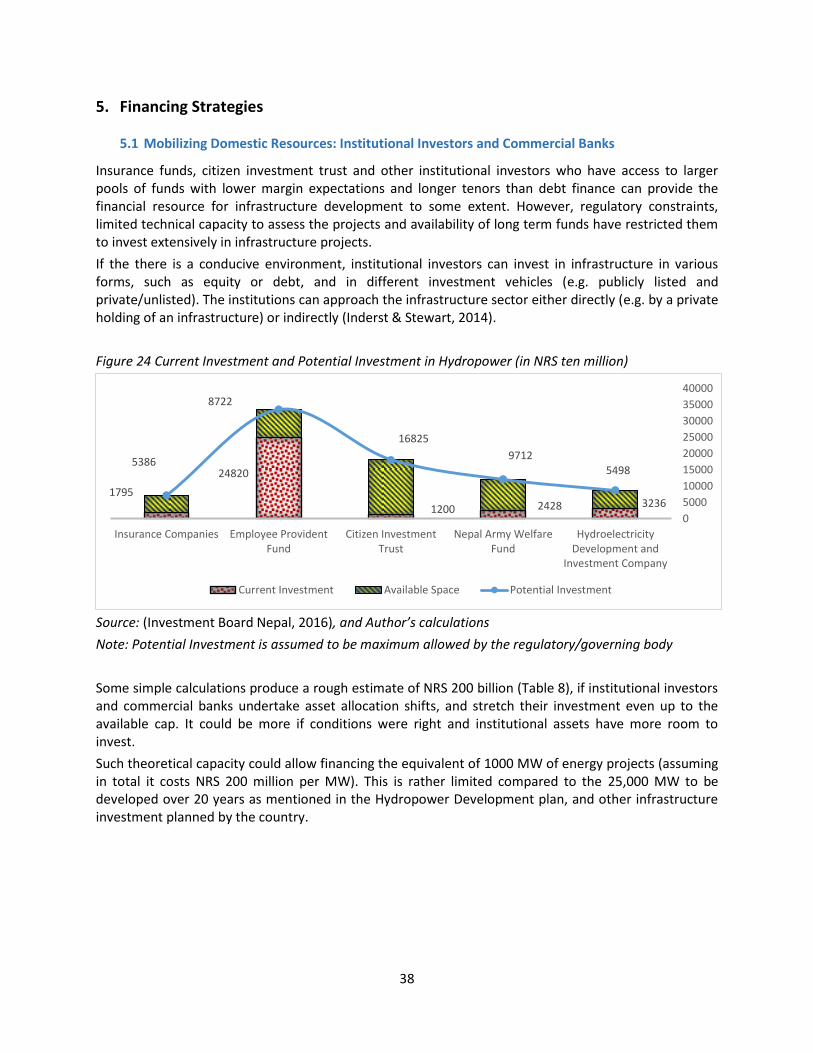
38
5. Financing Strategies
5.1 Mobilizing Domestic Resources: Institutional Investors and Commercial Banks
Insurance funds, citizen investment trust and other institutional investors who have access to larger pools of funds with lower margin expectations and longer tenors than debt finance can provide the financial resource for infrastructure development to some extent. However, regulatory constraints, limited technical capacity to assess the projects and availability of long term funds have restricted them to invest extensively in infrastructure projects. If the there is a conducive environment, institutional investors can invest in infrastructure in various forms, such as equity or debt, and in different investment vehicles (e.g. publicly listed and private/unlisted). The institutions can approach the infrastructure sector either directly (e.g. by a private holding of an infrastructure) or indirectly (Inderst & Stewart, 2014). Figure 24 Current Investment and Potential Investment in Hydropower (in NRS ten million)
Source: (Investment Board Nepal, 2016), and Author’s calculations Note: Potential Investment is assumed to be maximum allowed by the regulatory/governing body Some simple calculations produce a rough estimate of NRS 200 billion (Table 8), if institutional investors and commercial banks undertake asset allocation shifts, and stretch their investment even up to the available cap. It could be more if conditions were right and institutional assets have more room to invest. Such theoretical capacity could allow financing the equivalent of 1000 MW of energy projects (assuming in total it costs NRS 200 million per MW). This is rather limited compared to the 25,000 MW to be developed over 20 years as mentioned in the Hydropower Development plan, and other infrastructure investment planned by the country.
1795 24820
1200 2428 3236
5386
8722
16825 9712
5498
Insurance Companies Employee ProvidentFund
Citizen InvestmentTrust
Nepal Army WelfareFund
HydroelectricityDevelopment and
Investment Company
0500010000150002000025000300003500040000
Current Investment Available Space Potential Investment
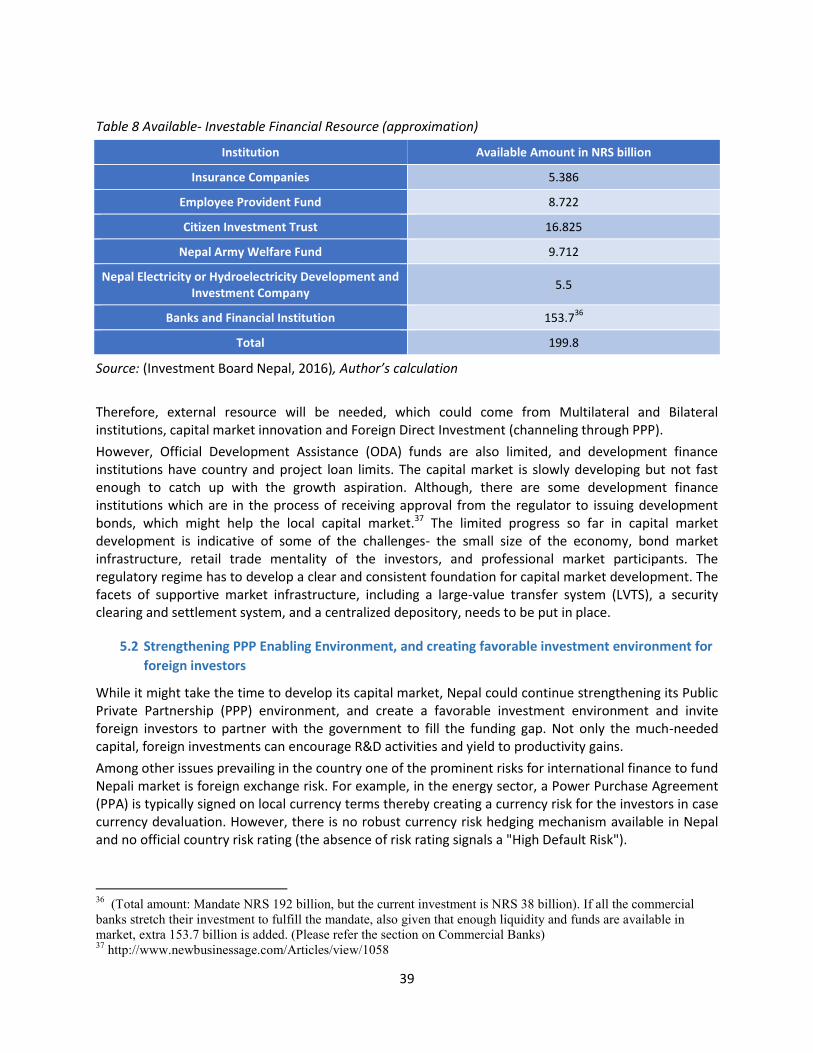
39
Table 8 Available- Investable Financial Resource (approximation)
Institution Available Amount in NRS billion
Insurance Companies 5.386
Employee Provident Fund 8.722
Citizen Investment Trust 16.825
Nepal Army Welfare Fund 9.712
Nepal Electricity or Hydroelectricity Development and Investment Company 5.5
Banks and Financial Institution 153.736
Total 199.8
Source: (Investment Board Nepal, 2016), Author’s calculation Therefore, external resource will be needed, which could come from Multilateral and Bilateral institutions, capital market innovation and Foreign Direct Investment (channeling through PPP). However, Official Development Assistance (ODA) funds are also limited, and development finance institutions have country and project loan limits. The capital market is slowly developing but not fast enough to catch up with the growth aspiration. Although, there are some development finance institutions which are in the process of receiving approval from the regulator to issuing development bonds, which might help the local capital market.37 The limited progress so far in capital market development is indicative of some of the challenges- the small size of the economy, bond market infrastructure, retail trade mentality of the investors, and professional market participants. The regulatory regime has to develop a clear and consistent foundation for capital market development. The facets of supportive market infrastructure, including a large-value transfer system (LVTS), a security clearing and settlement system, and a centralized depository, needs to be put in place.
5.2 Strengthening PPP Enabling Environment, and creating favorable investment environment for foreign investors
While it might take the time to develop its capital market, Nepal could continue strengthening its Public Private Partnership (PPP) environment, and create a favorable investment environment and invite foreign investors to partner with the government to fill the funding gap. Not only the much-needed capital, foreign investments can encourage R&D activities and yield to productivity gains. Among other issues prevailing in the country one of the prominent risks for international finance to fund Nepali market is foreign exchange risk. For example, in the energy sector, a Power Purchase Agreement (PPA) is typically signed on local currency terms thereby creating a currency risk for the investors in case currency devaluation. However, there is no robust currency risk hedging mechanism available in Nepal and no official country risk rating (the absence of risk rating signals a "High Default Risk").
36 (Total amount: Mandate NRS 192 billion, but the current investment is NRS 38 billion). If all the commercial banks stretch their investment to fulfill the mandate, also given that enough liquidity and funds are available in market, extra 153.7 billion is added. (Please refer the section on Commercial Banks) 37 http://www.newbusinessage.com/Articles/view/1058
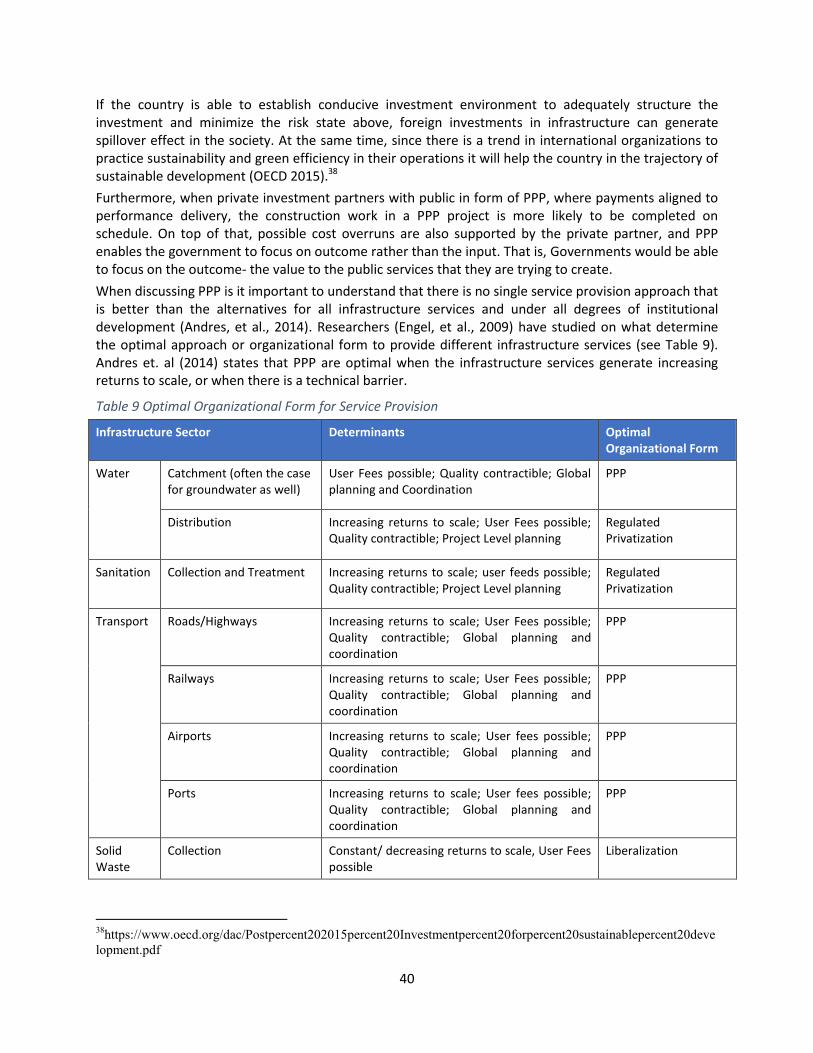
40
If the country is able to establish conducive investment environment to adequately structure the investment and minimize the risk state above, foreign investments in infrastructure can generate spillover effect in the society. At the same time, since there is a trend in international organizations to practice sustainability and green efficiency in their operations it will help the country in the trajectory of sustainable development (OECD 2015).38 Furthermore, when private investment partners with public in form of PPP, where payments aligned to performance delivery, the construction work in a PPP project is more likely to be completed on schedule. On top of that, possible cost overruns are also supported by the private partner, and PPP enables the government to focus on outcome rather than the input. That is, Governments would be able to focus on the outcome- the value to the public services that they are trying to create. When discussing PPP is it important to understand that there is no single service provision approach that is better than the alternatives for all infrastructure services and under all degrees of institutional development (Andres, et al., 2014). Researchers (Engel, et al., 2009) have studied on what determine the optimal approach or organizational form to provide different infrastructure services (see Table 9). Andres et. al (2014) states that PPP are optimal when the infrastructure services generate increasing returns to scale, or when there is a technical barrier.
Table 9 Optimal Organizational Form for Service Provision
Infrastructure Sector Determinants Optimal Organizational Form
Water Catchment (often the case for groundwater as well)
User Fees possible; Quality contractible; Global planning and Coordination
PPP
Distribution Increasing returns to scale; User Fees possible; Quality contractible; Project Level planning
Regulated Privatization
Sanitation Collection and Treatment Increasing returns to scale; user feeds possible; Quality contractible; Project Level planning
Regulated Privatization
Transport Roads/Highways Increasing returns to scale; User Fees possible; Quality contractible; Global planning and coordination
PPP
Railways Increasing returns to scale; User Fees possible; Quality contractible; Global planning and coordination
PPP
Airports Increasing returns to scale; User fees possible; Quality contractible; Global planning and coordination
PPP
Ports Increasing returns to scale; User fees possible; Quality contractible; Global planning and coordination
PPP
Solid Waste
Collection Constant/ decreasing returns to scale, User Fees possible
Liberalization
38https://www.oecd.org/dac/Postpercent202015percent20Investmentpercent20forpercent20sustainablepercent20development.pdf
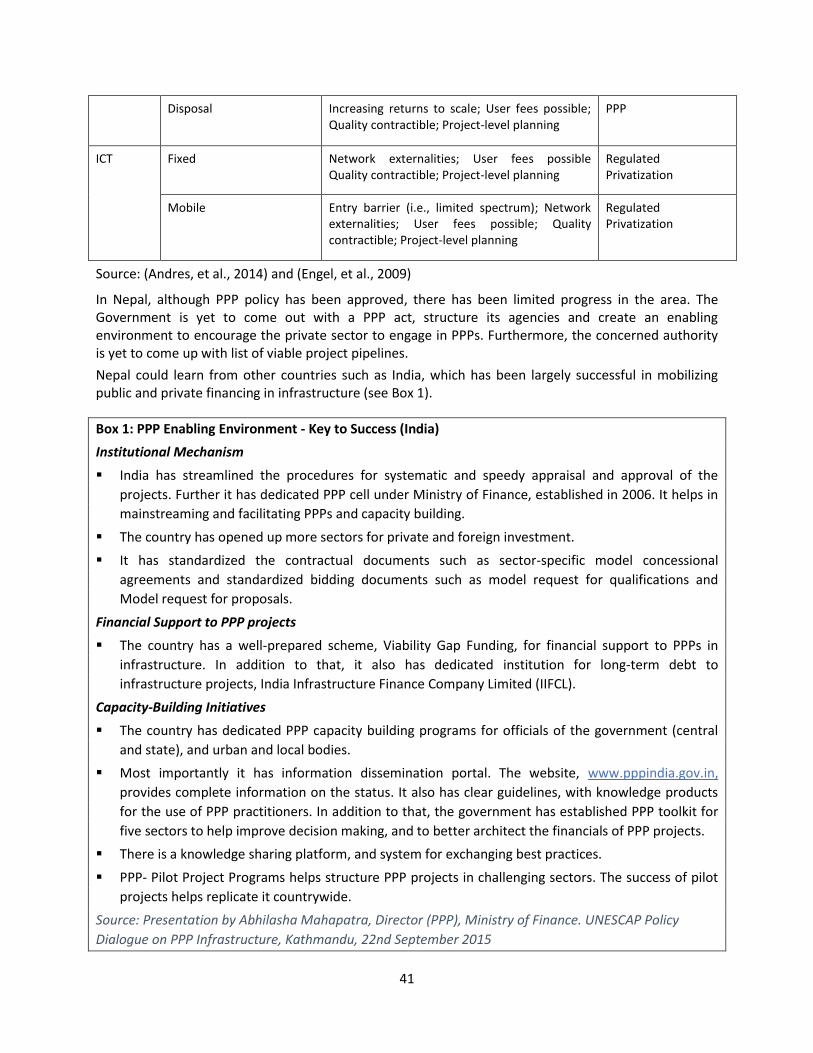
41
Disposal Increasing returns to scale; User fees possible; Quality contractible; Project-level planning
PPP
ICT Fixed Network externalities; User fees possible Quality contractible; Project-level planning
Regulated Privatization
Mobile Entry barrier (i.e., limited spectrum); Network externalities; User fees possible; Quality contractible; Project-level planning
Regulated Privatization
Source: (Andres, et al., 2014) and (Engel, et al., 2009)
In Nepal, although PPP policy has been approved, there has been limited progress in the area. The Government is yet to come out with a PPP act, structure its agencies and create an enabling environment to encourage the private sector to engage in PPPs. Furthermore, the concerned authority is yet to come up with list of viable project pipelines. Nepal could learn from other countries such as India, which has been largely successful in mobilizing public and private financing in infrastructure (see Box 1).
Box 1: PPP Enabling Environment - Key to Success (India) Institutional Mechanism
� India has streamlined the procedures for systematic and speedy appraisal and approval of the projects. Further it has dedicated PPP cell under Ministry of Finance, established in 2006. It helps in mainstreaming and facilitating PPPs and capacity building.
� The country has opened up more sectors for private and foreign investment. � It has standardized the contractual documents such as sector-specific model concessional
agreements and standardized bidding documents such as model request for qualifications and Model request for proposals.
Financial Support to PPP projects
� The country has a well-prepared scheme, Viability Gap Funding, for financial support to PPPs in infrastructure. In addition to that, it also has dedicated institution for long-term debt to infrastructure projects, India Infrastructure Finance Company Limited (IIFCL).
Capacity-Building Initiatives
� The country has dedicated PPP capacity building programs for officials of the government (central and state), and urban and local bodies.
� Most importantly it has information dissemination portal. The website, www.pppindia.gov.in, provides complete information on the status. It also has clear guidelines, with knowledge products for the use of PPP practitioners. In addition to that, the government has established PPP toolkit for five sectors to help improve decision making, and to better architect the financials of PPP projects.
� There is a knowledge sharing platform, and system for exchanging best practices. � PPP- Pilot Project Programs helps structure PPP projects in challenging sectors. The success of pilot
projects helps replicate it countrywide. Source: Presentation by Abhilasha Mahapatra, Director (PPP), Ministry of Finance. UNESCAP Policy Dialogue on PPP Infrastructure, Kathmandu, 22nd September 2015
42
5.3 Improving Public Expenditure Efficiency
McKinsey & Company (2013) study shows that improving infrastructure productivity can save $1 trillion on an infrastructure development globally. The study reveals that improving the selection, streamlining delivery and optimizing the use of existing infrastructure could obtain the same amount of infrastructure project for less than 40 percent- or, put in a way, bringing 60 percent improved productivity. The analysis is produced after reviewing more than 400 cases of best practices. The following section will discuss how implementing the three levers can result in significant savings and help bridge the infrastructure financing gap in Nepal.
5.3.1 Improving project prioritization
One of the robust ways to reduce the cost involved in infrastructure projects is to strategically optimize infrastructure portfolio. The Mckinsey and Company report (2013) suggests that optimizing the existing infrastructure projects, eliminating poor performing contracts and selection of improved alternatives could save up to 15 to 35 percent of new capital spending. In Nepal’s case, even if the country saves 10 percent of capital expenditure (NRS 8 billion)39, the amount would provide sufficient cushion to financing big scale infrastructure project. However, as per McKinsey report, achieving these efficient outcomes demands three key components: identify “projects with clear purpose, evaluate projects using improved cost-benefit analysis, and prioritize projects at portfolio level” (McKinsey & Company 2013). The state must select projects with clear purpose based on socio-economic priorities, which would enable it to progress towards Sustainable Development Goals. Also, while evaluating the projects, metrics must consider long-term economic, social and environmental effects, the three key pillars of sustainable development. “Infrastructure projects vary widely in terms of how their costs and benefits are expressed, and therefore need to be evaluated differently”. There are projects with discrete revenue streams, some with both financial returns and economic spillover effects, and some other where benefits are largely social (Table 10). It is better to select and prioritize the projects by conducting a cost-benefit analysis which includes social factors such as “time saved by commuters”, “intercity air traffic”, “loss of lives, injuries, and noise”. The results should then receive validation by cross referencing with similar past projects. A tool, reference class forecasting, officially endorsed by American Planning Association and United Kingdom Department for Transport, could help government experts review and validate the analysis. Finally, there should be a system to check project performances relative to the prediction. The report also advises there should be a strong database and robust system for decision making, for which the study recommends maintenance of infrastructure balance sheet (McKinsey & Company, 2013).
39 10 percent of capital spending on FY 2014/2015 is NRS 8 billion
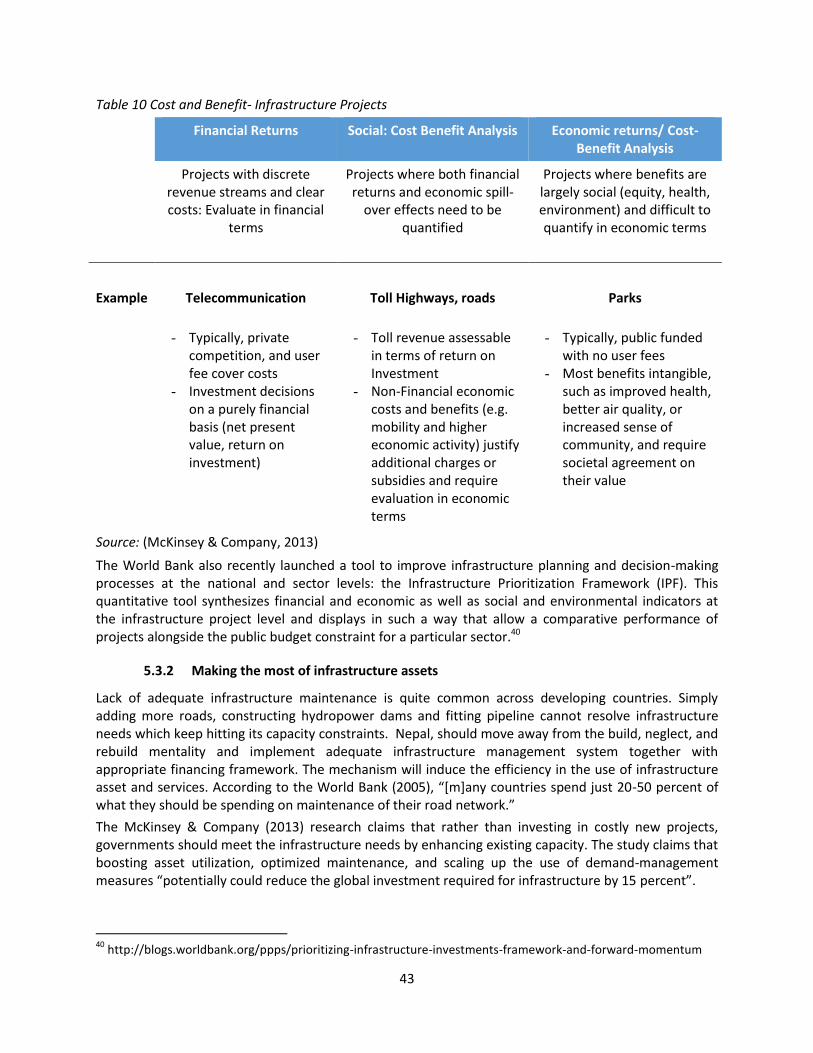
43
Table 10 Cost and Benefit- Infrastructure Projects
Financial Returns Social: Cost Benefit Analysis Economic returns/ Cost-Benefit Analysis
Projects with discrete revenue streams and clear costs: Evaluate in financial
terms
Projects where both financial returns and economic spill-
over effects need to be quantified
Projects where benefits are largely social (equity, health, environment) and difficult to quantify in economic terms
Example
Telecommunication
- Typically, private
competition, and user fee cover costs
- Investment decisions on a purely financial basis (net present value, return on investment)
Toll Highways, roads
- Toll revenue assessable
in terms of return on Investment
- Non-Financial economic costs and benefits (e.g. mobility and higher economic activity) justify additional charges or subsidies and require evaluation in economic terms
Parks
- Typically, public funded
with no user fees - Most benefits intangible,
such as improved health, better air quality, or increased sense of community, and require societal agreement on their value
Source: (McKinsey & Company, 2013) The World Bank also recently launched a tool to improve infrastructure planning and decision-making processes at the national and sector levels: the Infrastructure Prioritization Framework (IPF). This quantitative tool synthesizes financial and economic as well as social and environmental indicators at the infrastructure project level and displays in such a way that allow a comparative performance of projects alongside the public budget constraint for a particular sector.40
5.3.2 Making the most of infrastructure assets
Lack of adequate infrastructure maintenance is quite common across developing countries. Simply adding more roads, constructing hydropower dams and fitting pipeline cannot resolve infrastructure needs which keep hitting its capacity constraints. Nepal, should move away from the build, neglect, and rebuild mentality and implement adequate infrastructure management system together with appropriate financing framework. The mechanism will induce the efficiency in the use of infrastructure asset and services. According to the World Bank (2005), “[m]any countries spend just 20-50 percent of what they should be spending on maintenance of their road network.” The McKinsey & Company (2013) research claims that rather than investing in costly new projects, governments should meet the infrastructure needs by enhancing existing capacity. The study claims that boosting asset utilization, optimized maintenance, and scaling up the use of demand-management measures “potentially could reduce the global investment required for infrastructure by 15 percent”.
40 http://blogs.worldbank.org/ppps/prioritizing-infrastructure-investments-framework-and-forward-momentum
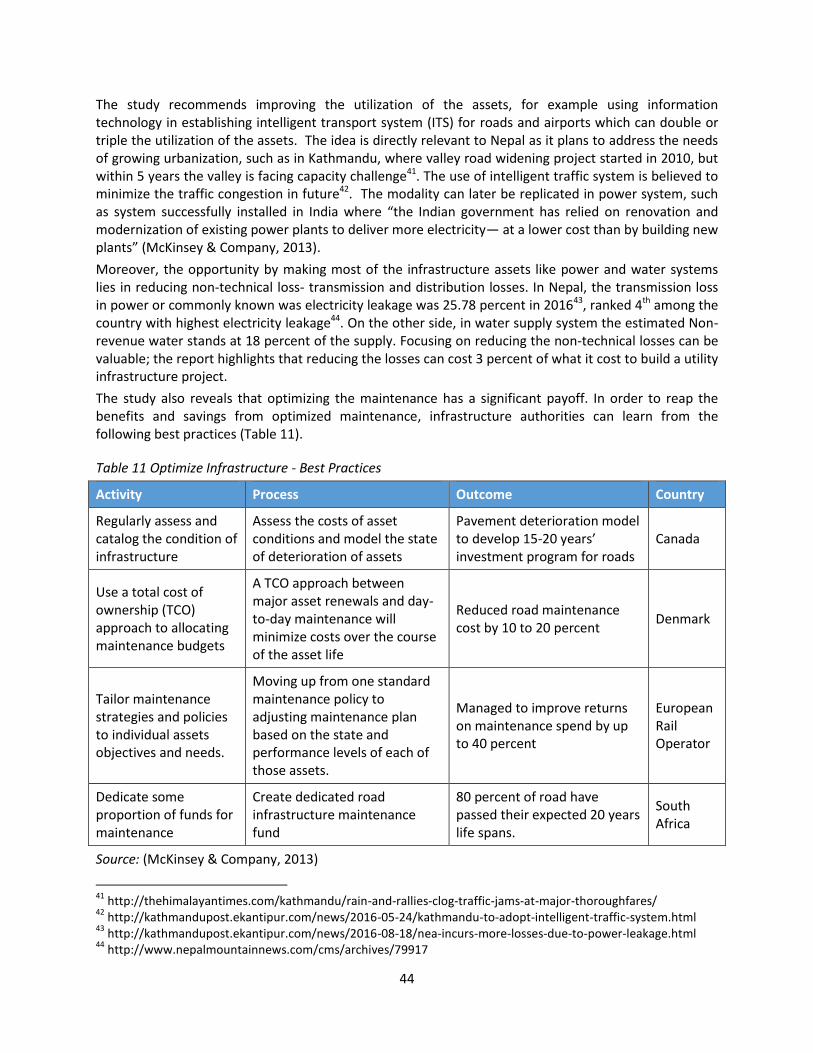
44
The study recommends improving the utilization of the assets, for example using information technology in establishing intelligent transport system (ITS) for roads and airports which can double or triple the utilization of the assets. The idea is directly relevant to Nepal as it plans to address the needs of growing urbanization, such as in Kathmandu, where valley road widening project started in 2010, but within 5 years the valley is facing capacity challenge41. The use of intelligent traffic system is believed to minimize the traffic congestion in future42. The modality can later be replicated in power system, such as system successfully installed in India where “the Indian government has relied on renovation and modernization of existing power plants to deliver more electricity— at a lower cost than by building new plants” (McKinsey & Company, 2013). Moreover, the opportunity by making most of the infrastructure assets like power and water systems lies in reducing non-technical loss- transmission and distribution losses. In Nepal, the transmission loss in power or commonly known was electricity leakage was 25.78 percent in 201643, ranked 4th among the country with highest electricity leakage44. On the other side, in water supply system the estimated Non-revenue water stands at 18 percent of the supply. Focusing on reducing the non-technical losses can be valuable; the report highlights that reducing the losses can cost 3 percent of what it cost to build a utility infrastructure project. The study also reveals that optimizing the maintenance has a significant payoff. In order to reap the benefits and savings from optimized maintenance, infrastructure authorities can learn from the following best practices (Table 11).
Table 11 Optimize Infrastructure - Best Practices
Activity Process Outcome Country
Regularly assess and catalog the condition of infrastructure
Assess the costs of asset conditions and model the state of deterioration of assets
Pavement deterioration model to develop 15-20 years’ investment program for roads
Canada
Use a total cost of ownership (TCO) approach to allocating maintenance budgets
A TCO approach between major asset renewals and day-to-day maintenance will minimize costs over the course of the asset life
Reduced road maintenance cost by 10 to 20 percent Denmark
Tailor maintenance strategies and policies to individual assets objectives and needs.
Moving up from one standard maintenance policy to adjusting maintenance plan based on the state and performance levels of each of those assets.
Managed to improve returns on maintenance spend by up to 40 percent
European Rail Operator
Dedicate some proportion of funds for maintenance
Create dedicated road infrastructure maintenance fund
80 percent of road have passed their expected 20 years life spans.
South Africa
Source: (McKinsey & Company, 2013)
41 http://thehimalayantimes.com/kathmandu/rain-and-rallies-clog-traffic-jams-at-major-thoroughfares/ 42 http://kathmandupost.ekantipur.com/news/2016-05-24/kathmandu-to-adopt-intelligent-traffic-system.html 43 http://kathmandupost.ekantipur.com/news/2016-08-18/nea-incurs-more-losses-due-to-power-leakage.html 44 http://www.nepalmountainnews.com/cms/archives/79917
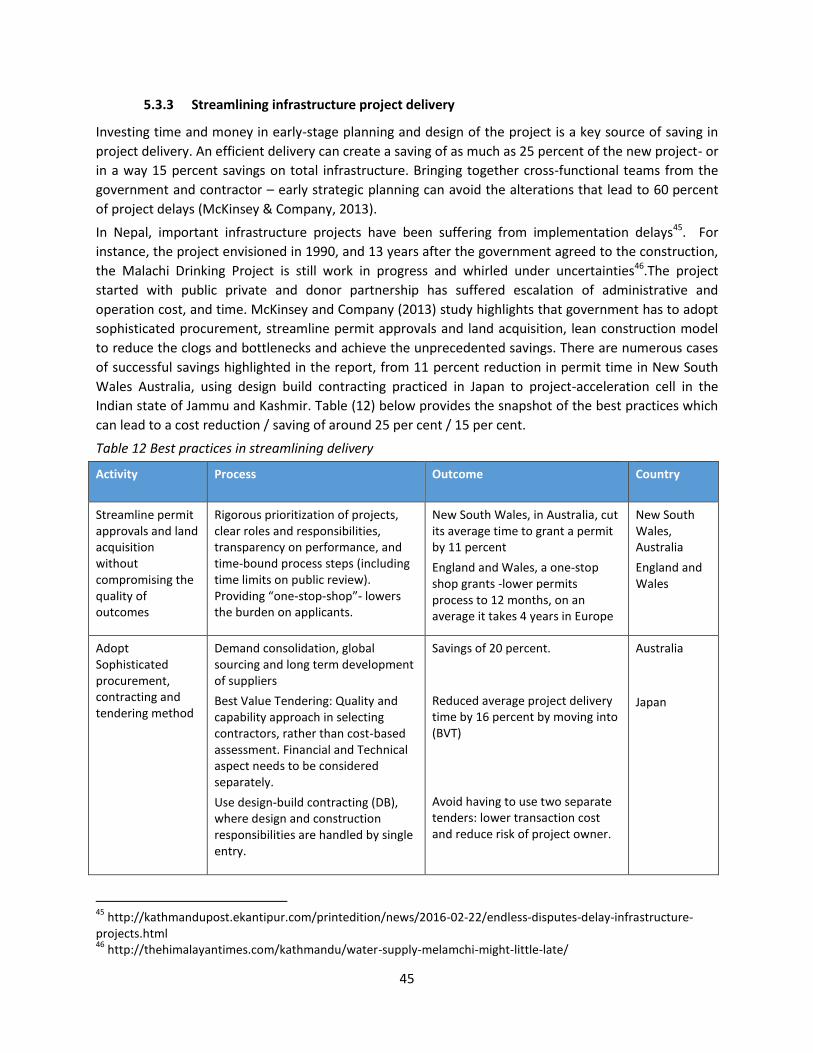
45
5.3.3 Streamlining infrastructure project delivery
Investing time and money in early-stage planning and design of the project is a key source of saving in project delivery. An efficient delivery can create a saving of as much as 25 percent of the new project- or in a way 15 percent savings on total infrastructure. Bringing together cross-functional teams from the government and contractor – early strategic planning can avoid the alterations that lead to 60 percent of project delays (McKinsey & Company, 2013). In Nepal, important infrastructure projects have been suffering from implementation delays45. For instance, the project envisioned in 1990, and 13 years after the government agreed to the construction, the Malachi Drinking Project is still work in progress and whirled under uncertainties46.The project started with public private and donor partnership has suffered escalation of administrative and operation cost, and time. McKinsey and Company (2013) study highlights that government has to adopt sophisticated procurement, streamline permit approvals and land acquisition, lean construction model to reduce the clogs and bottlenecks and achieve the unprecedented savings. There are numerous cases of successful savings highlighted in the report, from 11 percent reduction in permit time in New South Wales Australia, using design build contracting practiced in Japan to project-acceleration cell in the Indian state of Jammu and Kashmir. Table (12) below provides the snapshot of the best practices which can lead to a cost reduction / saving of around 25 per cent / 15 per cent. Table 12 Best practices in streamlining delivery
Activity Process Outcome Country
Streamline permit approvals and land acquisition without compromising the quality of outcomes
Rigorous prioritization of projects, clear roles and responsibilities, transparency on performance, and time-bound process steps (including time limits on public review). Providing “one-stop-shop”- lowers the burden on applicants.
New South Wales, in Australia, cut its average time to grant a permit by 11 percent England and Wales, a one-stop shop grants -lower permits process to 12 months, on an average it takes 4 years in Europe
New South Wales, Australia England and Wales
Adopt Sophisticated procurement, contracting and tendering method
Demand consolidation, global sourcing and long term development of suppliers Best Value Tendering: Quality and capability approach in selecting contractors, rather than cost-based assessment. Financial and Technical aspect needs to be considered separately. Use design-build contracting (DB), where design and construction responsibilities are handled by single entry.
Savings of 20 percent.
Reduced average project delivery time by 16 percent by moving into (BVT)
Avoid having to use two separate tenders: lower transaction cost and reduce risk of project owner.
Australia
Japan
45 http://kathmandupost.ekantipur.com/printedition/news/2016-02-22/endless-disputes-delay-infrastructure-projects.html 46 http://thehimalayantimes.com/kathmandu/water-supply-melamchi-might-little-late/
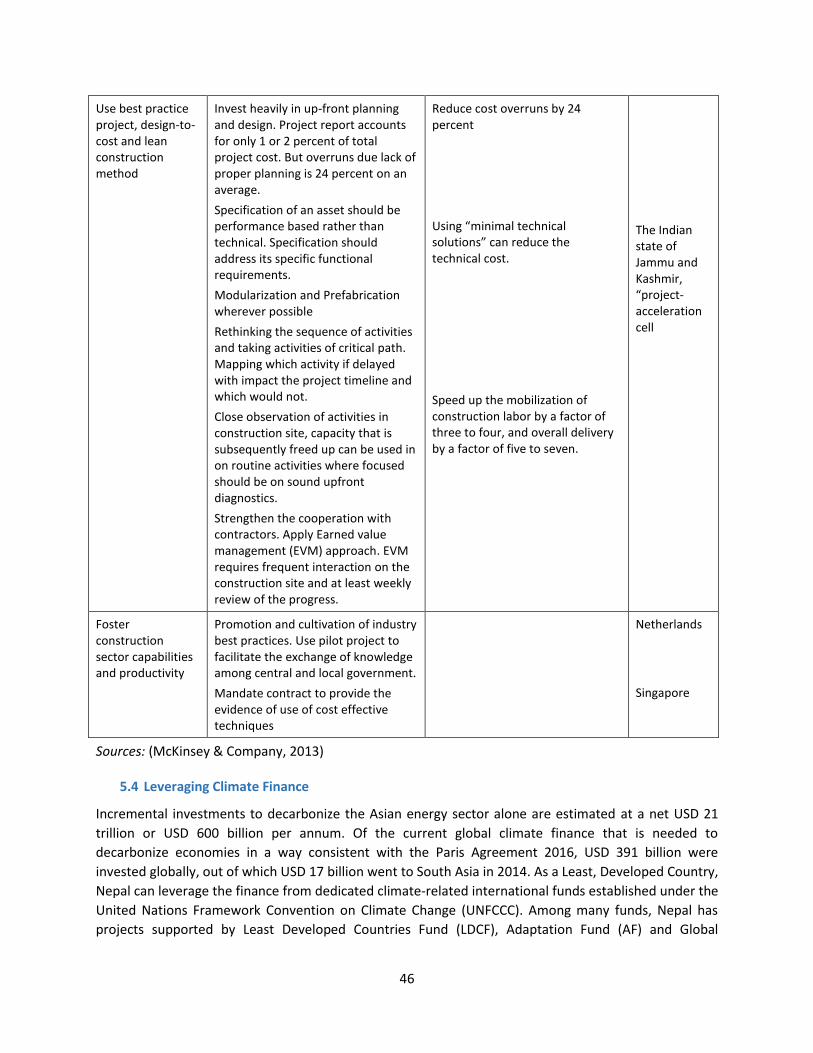
46
Use best practice project, design-to-cost and lean construction method
Invest heavily in up-front planning and design. Project report accounts for only 1 or 2 percent of total project cost. But overruns due lack of proper planning is 24 percent on an average. Specification of an asset should be performance based rather than technical. Specification should address its specific functional requirements. Modularization and Prefabrication wherever possible Rethinking the sequence of activities and taking activities of critical path. Mapping which activity if delayed with impact the project timeline and which would not. Close observation of activities in construction site, capacity that is subsequently freed up can be used in on routine activities where focused should be on sound upfront diagnostics. Strengthen the cooperation with contractors. Apply Earned value management (EVM) approach. EVM requires frequent interaction on the construction site and at least weekly review of the progress.
Reduce cost overruns by 24 percent Using “minimal technical solutions” can reduce the technical cost. Speed up the mobilization of construction labor by a factor of three to four, and overall delivery by a factor of five to seven.
The Indian state of Jammu and Kashmir, “project-acceleration cell
Foster construction sector capabilities and productivity
Promotion and cultivation of industry best practices. Use pilot project to facilitate the exchange of knowledge among central and local government. Mandate contract to provide the evidence of use of cost effective techniques
Netherlands
Singapore
Sources: (McKinsey & Company, 2013)
5.4 Leveraging Climate Finance
Incremental investments to decarbonize the Asian energy sector alone are estimated at a net USD 21 trillion or USD 600 billion per annum. Of the current global climate finance that is needed to decarbonize economies in a way consistent with the Paris Agreement 2016, USD 391 billion were invested globally, out of which USD 17 billion went to South Asia in 2014. As a Least, Developed Country, Nepal can leverage the finance from dedicated climate-related international funds established under the United Nations Framework Convention on Climate Change (UNFCCC). Among many funds, Nepal has projects supported by Least Developed Countries Fund (LDCF), Adaptation Fund (AF) and Global
47
Environment Facility (GEF). In addition to that Green Climate Fund (GCF) is also available for funding (Chhetri, 2016). Areas prioritized by Nepal’s climate change policy and National Adaptation Programmes of Action (NAPA), are to large extent aligned to the Green Climate Fund (Chhetri, 2016). It is the right time for the country to scale up the development paradigm by investing and encouraging infrastructure investment on low-carbon pathways. Nepal has to create a coherent path towards sustainable development in the form of “Low-carbon resilient development (LCRD)”, following the developing countries who have innovated range of initiative to integrate the climate change and development agendas (Rai, et al., 2015). Furthermore, in Nepal, sensitizing and encouraging the private sector in climate-friendly investment is crucial. Financial sector regulation can be devised to encourage private investors and commercial banks towards green finance. For instance, Central Bank of Bangladesh has successfully deployed a range of intermediaries, instruments, and planning system to address the specific financial needs of “Low Carbon Resilient Development” (Rai, et al., 2015). In 2005 the central bank announced refinancing scheme directing commercial banks on finance for green energy, including solar and biogas project. To enable commercial banks access capital at lower rates, in 2010 the bank introduced USD 26 million refinancing facility for investment in green energy and effluent treatment plants, and in 2011 the central bank promulgated policy guidelines outlining phased steps for green banking practices, and in 2014, the central bank announced targets for all the financial institutions to lend to green products. It is reported that more than US 37 million under refinance facility, USD 11 million higher than original allocation, has been allocated to green projects in 2014 (Rai, et al., 2015).
5.5 Financial Intermediary for local and urban infrastructure financing
Apart from maturity mismatch and unavailability of the longer-term funds the banking sector's exposure norms also limits commercial banks from investing in infrastructure projects. Moreover, long-term financing, such as project financing, weigh heavily on bank balance sheets. Within a couple of years, the commercial banks will also witness the full implementation of Basel III regime which will make it difficult for banks complying the international requirement to scale up long-term financing for the infrastructure projects. Besides, commercial banks have limited incentives (also restricted by policy) to venture into financing municipal or local level infrastructure projects. Under such circumstances, there is a need for financial intermediary in the market which could play a supplementary role in financing the infrastructure in the country, and which is outside BAFIA mandate. The financial intermediary could promote urban infrastructure and finance the commercially viable projects or which could be made viable through viability gap funding, or in consortium with other financial institutions. For instance, in Nepal, the Town Development Fund (TDF) has been established with an objective to finance the social infrastructure and revenue generating projects, and help alleviate economic and social poverty in urban sectors. However, a report published by TDF (i.e. the Municipal Finance Framework for National Urban Development Strategy) recommends restructuring the fund “as a full-fledged financial intermediary through legislation which provides this institution with clear autonomy, mandate, and responsibility to finance urban infrastructure projects”. The institution is currently government by TDF 1996 act but given more specific role that might involve in infrastructure financing, the objectives, functions, and rights of the restructured TDF as a financial intermediary require to be enshrined in the TDF Act (Khatiwada, et al., n.d.).
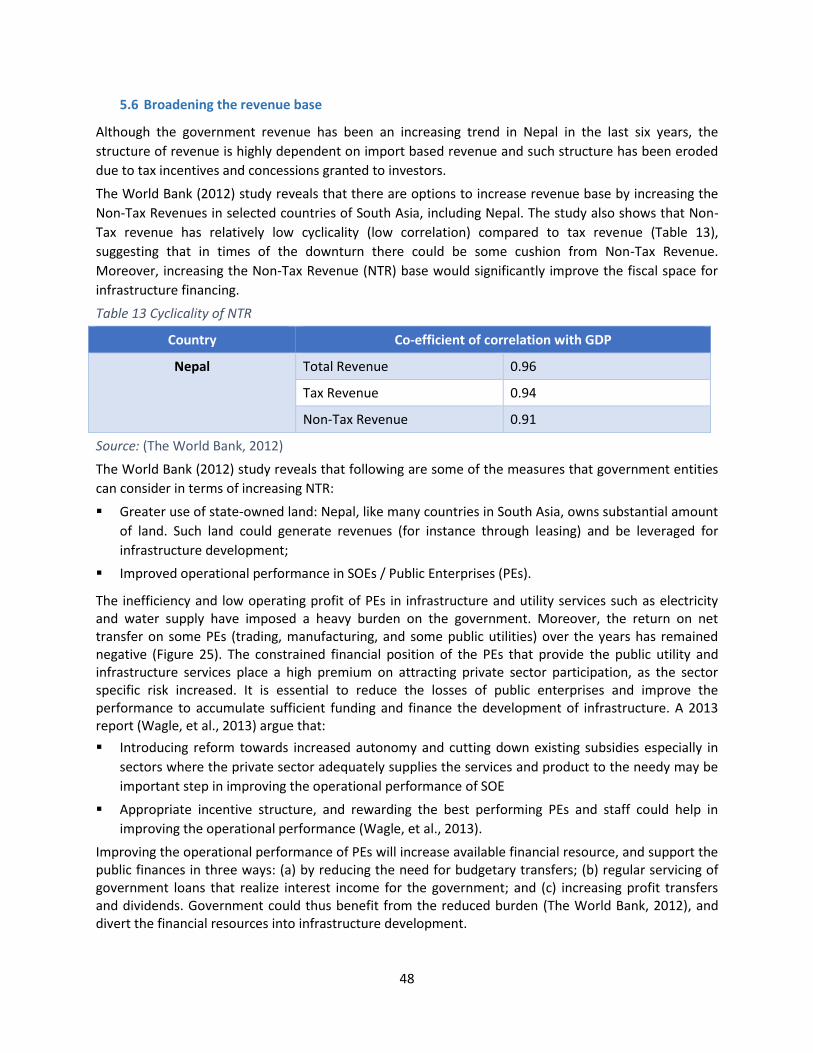
48
5.6 Broadening the revenue base
Although the government revenue has been an increasing trend in Nepal in the last six years, the structure of revenue is highly dependent on import based revenue and such structure has been eroded due to tax incentives and concessions granted to investors. The World Bank (2012) study reveals that there are options to increase revenue base by increasing the Non-Tax Revenues in selected countries of South Asia, including Nepal. The study also shows that Non-Tax revenue has relatively low cyclicality (low correlation) compared to tax revenue (Table 13), suggesting that in times of the downturn there could be some cushion from Non-Tax Revenue. Moreover, increasing the Non-Tax Revenue (NTR) base would significantly improve the fiscal space for infrastructure financing. Table 13 Cyclicality of NTR
Country Co-efficient of correlation with GDP
Nepal Total Revenue 0.96
Tax Revenue 0.94
Non-Tax Revenue 0.91
Source: (The World Bank, 2012) The World Bank (2012) study reveals that following are some of the measures that government entities can consider in terms of increasing NTR: � Greater use of state-owned land: Nepal, like many countries in South Asia, owns substantial amount
of land. Such land could generate revenues (for instance through leasing) and be leveraged for infrastructure development;
� Improved operational performance in SOEs / Public Enterprises (PEs).
The inefficiency and low operating profit of PEs in infrastructure and utility services such as electricity and water supply have imposed a heavy burden on the government. Moreover, the return on net transfer on some PEs (trading, manufacturing, and some public utilities) over the years has remained negative (Figure 25). The constrained financial position of the PEs that provide the public utility and infrastructure services place a high premium on attracting private sector participation, as the sector specific risk increased. It is essential to reduce the losses of public enterprises and improve the performance to accumulate sufficient funding and finance the development of infrastructure. A 2013 report (Wagle, et al., 2013) argue that: � Introducing reform towards increased autonomy and cutting down existing subsidies especially in
sectors where the private sector adequately supplies the services and product to the needy may be important step in improving the operational performance of SOE
� Appropriate incentive structure, and rewarding the best performing PEs and staff could help in improving the operational performance (Wagle, et al., 2013).
Improving the operational performance of PEs will increase available financial resource, and support the public finances in three ways: (a) by reducing the need for budgetary transfers; (b) regular servicing of government loans that realize interest income for the government; and (c) increasing profit transfers and dividends. Government could thus benefit from the reduced burden (The World Bank, 2012), and divert the financial resources into infrastructure development.
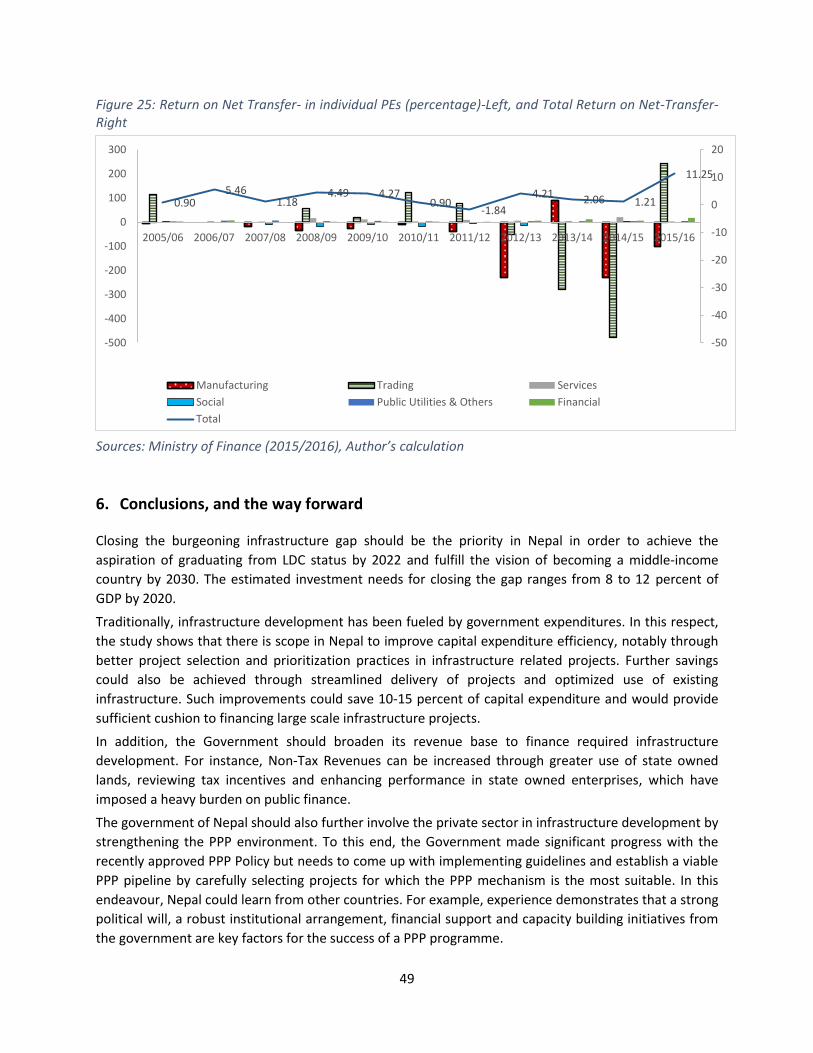
49
Figure 25: Return on Net Transfer- in individual PEs (percentage)-Left, and Total Return on Net-Transfer-Right
Sources: Ministry of Finance (2015/2016), Author’s calculation
6. Conclusions, and the way forward
Closing the burgeoning infrastructure gap should be the priority in Nepal in order to achieve the aspiration of graduating from LDC status by 2022 and fulfill the vision of becoming a middle-income country by 2030. The estimated investment needs for closing the gap ranges from 8 to 12 percent of GDP by 2020. Traditionally, infrastructure development has been fueled by government expenditures. In this respect, the study shows that there is scope in Nepal to improve capital expenditure efficiency, notably through better project selection and prioritization practices in infrastructure related projects. Further savings could also be achieved through streamlined delivery of projects and optimized use of existing infrastructure. Such improvements could save 10-15 percent of capital expenditure and would provide sufficient cushion to financing large scale infrastructure projects. In addition, the Government should broaden its revenue base to finance required infrastructure development. For instance, Non-Tax Revenues can be increased through greater use of state owned lands, reviewing tax incentives and enhancing performance in state owned enterprises, which have imposed a heavy burden on public finance. The government of Nepal should also further involve the private sector in infrastructure development by strengthening the PPP environment. To this end, the Government made significant progress with the recently approved PPP Policy but needs to come up with implementing guidelines and establish a viable PPP pipeline by carefully selecting projects for which the PPP mechanism is the most suitable. In this endeavour, Nepal could learn from other countries. For example, experience demonstrates that a strong political will, a robust institutional arrangement, financial support and capacity building initiatives from the government are key factors for the success of a PPP programme.
0.90 5.46
1.18 4.49 4.27
0.90 -1.84 4.21 2.06 1.21
11.25
-50
-40
-30
-20
-10
0
10
20
-500
-400
-300
-200
-100
0
100
200
300
2005/06 2006/07 2007/08 2008/09 2009/10 2010/11 2011/12 2012/13 2013/14 2014/15 2015/16
Manufacturing Trading ServicesSocial Public Utilities & Others FinancialTotal
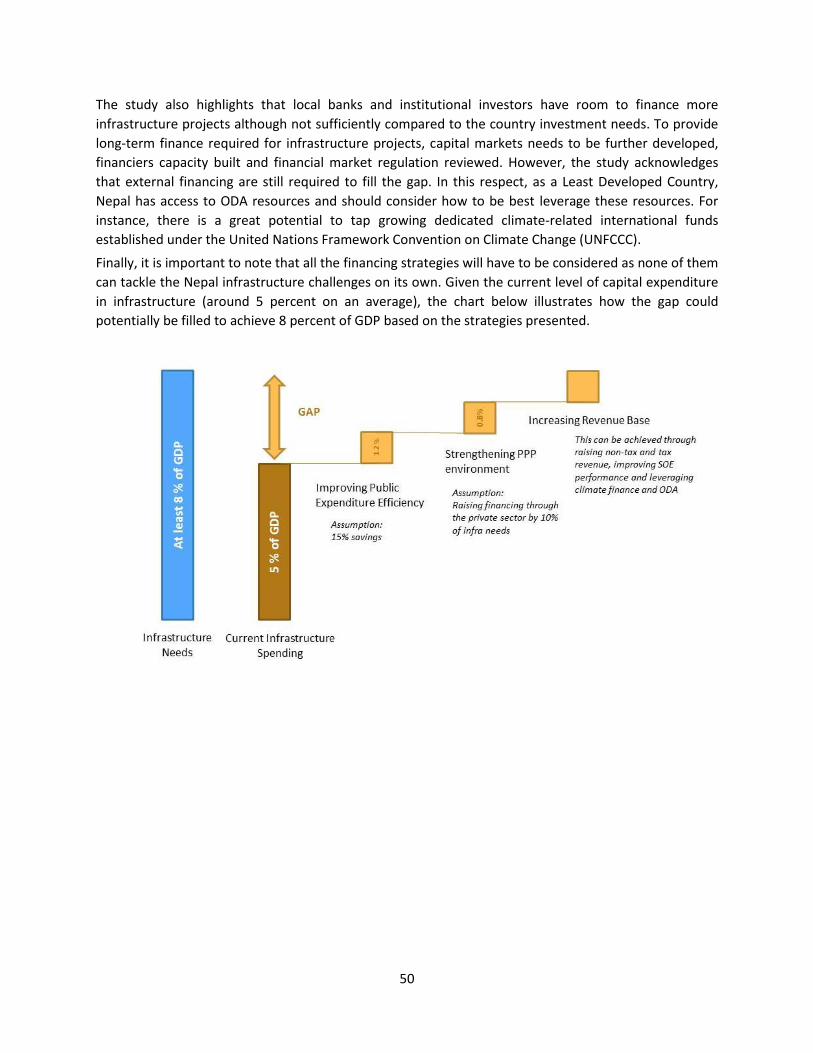
50
The study also highlights that local banks and institutional investors have room to finance more infrastructure projects although not sufficiently compared to the country investment needs. To provide long-term finance required for infrastructure projects, capital markets needs to be further developed, financiers capacity built and financial market regulation reviewed. However, the study acknowledges that external financing are still required to fill the gap. In this respect, as a Least Developed Country, Nepal has access to ODA resources and should consider how to be best leverage these resources. For instance, there is a great potential to tap growing dedicated climate-related international funds established under the United Nations Framework Convention on Climate Change (UNFCCC). Finally, it is important to note that all the financing strategies will have to be considered as none of them can tackle the Nepal infrastructure challenges on its own. Given the current level of capital expenditure in infrastructure (around 5 percent on an average), the chart below illustrates how the gap could potentially be filled to achieve 8 percent of GDP based on the strategies presented.
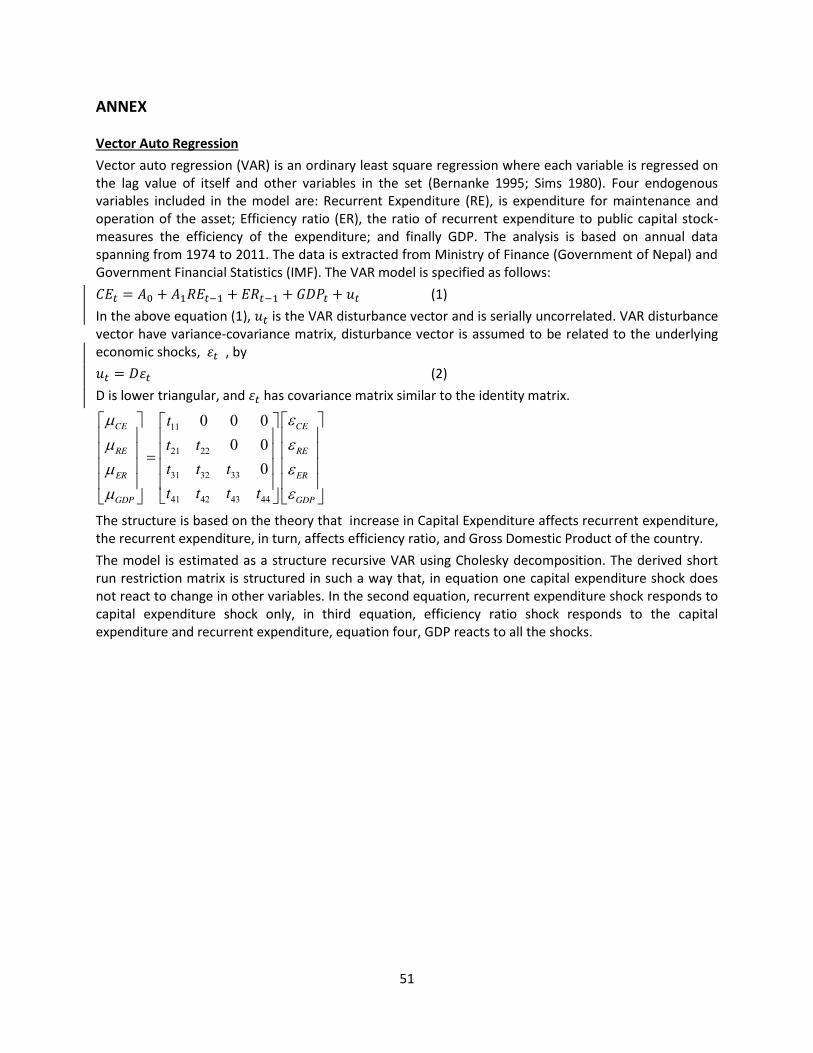
51
ANNEX
Vector Auto Regression Vector auto regression (VAR) is an ordinary least square regression where each variable is regressed on the lag value of itself and other variables in the set (Bernanke 1995; Sims 1980). Four endogenous variables included in the model are: Recurrent Expenditure (RE), is expenditure for maintenance and operation of the asset; Efficiency ratio (ER), the ratio of recurrent expenditure to public capital stock-measures the efficiency of the expenditure; and finally GDP. The analysis is based on annual data spanning from 1974 to 2011. The data is extracted from Ministry of Finance (Government of Nepal) and Government Financial Statistics (IMF). The VAR model is specified as follows: 𝐶𝐸𝑡 = 𝐴0 + 𝐴1𝑅𝐸𝑡−1 + 𝐸𝑅𝑡−1 + 𝐺𝐷𝑃𝑡 + 𝑢𝑡 (1) In the above equation (1), 𝑢𝑡 is the VAR disturbance vector and is serially uncorrelated. VAR disturbance vector have variance-covariance matrix, disturbance vector is assumed to be related to the underlying economic shocks, 𝜀𝑡 , by 𝑢𝑡 = 𝐷𝜀𝑡 (2) D is lower triangular, and 𝜀𝑡 has covariance matrix similar to the identity matrix.
11
21 22
31 32 33
41 42 43 44
0 0 00 0
0
CE CE
RE RE
ER ER
GDP GDP
tt tt t tt t t t
P HP HP HP H
ª º ª ºª º« » « »« »« » « »« » « » « »« »« » « »« »
¬ ¼¬ ¼ ¬ ¼
The structure is based on the theory that increase in Capital Expenditure affects recurrent expenditure, the recurrent expenditure, in turn, affects efficiency ratio, and Gross Domestic Product of the country. The model is estimated as a structure recursive VAR using Cholesky decomposition. The derived short run restriction matrix is structured in such a way that, in equation one capital expenditure shock does not react to change in other variables. In the second equation, recurrent expenditure shock responds to capital expenditure shock only, in third equation, efficiency ratio shock responds to the capital expenditure and recurrent expenditure, equation four, GDP reacts to all the shocks.

52
References
Ahmed, F., Dachs, M. W., Gorkhali, S., & Pande, K. R. (2012). Project Pipeline Screening and Initial Feasibility Assestment of Potential Infrastructure PPPs in Nepal. Public-Private Infrastructure Advisory Facility - The World Bank.
Andres, L., Biller, D., & Dappe, M. H. (2014). Infrastructure Gap in South Asia. World Bank Group . Aryal, B. (2014, 04 23). Ministry of Finance . Retrieved 12 01, 2016, from
http://www.mof.gov.np/uploads/document/file/NPPR%202014_20140423124306.pdf Asian Development Bank. (2016). Asian Development Bank. Retrieved 10 08, 2016, from
https://www.adb.org/sites/default/files/institutional-document/191526/macroeconomic-update-nepal-aug-2016.pdf
Bhattacharya, B. N. (2010). Estimating Demand for Infrastructure in Energy, Transport, Telecommunications, Water and Sanitation in Asia and the Pacific 2010-2020. Manila: Asian Development Bank Institute.
Chhetri, R. P. (2016). Prakriti Resources Centre. Retrieved 2016, from http://www.prc.org.np/uploads/resources/Jy0pqZeHw6j7eLUBpu9YxMM9eIK5ZIhu.pdf
CNI-Nepal, I. w. (2016). PPP Framework. Emek, U. (2015). Turkish Experience with Public private partnership in infrastructure. Utilities Policy , 37,
120-129. Engel, E., R, F., & A, G. (2009). Public-Private Partnerships: When and How. University of Chile. Santiago:
Center of Applied Economics. Ghimire, L. S., & Bhusal, Y. L. (2015). Low Capital (Budget) Expenditure: Context, Challenges and
Recommendations. Economic Management Division: Staff Discussion Paper, 2.
Ghimire, R. (2015). Academia . Retrieved 12 02, 2016, from https://www.academia.edu/3888263/Privatization_of_Public_Enterprises_in_Nepal....
Government of Nepal Office of the Investment Board. (2015). Investment Board Nepal (Official Website). Retrieved 12 09, 2016, from http://ibn.gov.np/govt-introduces-land-acquisition-policy
Heller, P. (2005). Understanding the Fiscal Space. Washington, D.C : International Monetary Fund. IDFC and PPP Capacity Building Centre - India. (2010). The draft Policy for Financing Infrastructure PPP
Projects in Nepal. Inderst, G., & Stewart, F. (2014). Institutional Investment in Infrastructure in Emerging Markets and
Developing Economies. The World Bank Group. International Monetary Fund. (2011). Nepal: Selected Issues. Washington, D.C : International Monetary
Fund. International Monetary Fund. (2016). World Economic Outlook Database. Retrieved from
https://www.imf.org/external/pubs/ft/weo/2016/01/weodata/index.aspx Investment Board Nepal. (2016). Hydropower Development & Financial Market in Nepal. Kathmandu:
Investment Board Nepal. Investment Board Nepal. (2016). Investment Board Nepal. Retrieved 11 08, 2016, from
http://ibn.gov.np/uploads/files/repository/IBN_Investment%20Guide%20Book_Final.pdf
53
Khatiwada, Y. R., Awasthi, G. D., Ghimire, K. D., Devkota, & Lal, K. (n.d.). Muncipal Finance Framework for National Urban Development Strategy (NUDS) of Nepal.
McKinsey & Company. (2013). Infrastructure productivity: How to save $1 trillion a year. Mercados Energy Markets India Pvt Ltd. (2013). Reveiw of Issues of Power Sector in South Asian
Countries. Mercados Energy Markets India Pvt Ltd. Ministry of Finance . (2016). Economic Survey 2015/2016. Kathmandu: Ministry of Finance. Ministry of Finance. (2016). Aid Management Platform. Retrieved 11 07, 2016, from
http://amis.mof.gov.np/portal/ Ministry of Finance. (2016). Budget Speech (Various Issues). Kathmandu: Ministry of Finance. Ministry of Finance. (2016). State Owned Enterprises Information 2072. Retrieved 10 09, 2016, from
http://www.mof.gov.np/en/archive-documents/soe-information--yellow-book-29.html National Planning Commission . (2016). Annual Development Programs. Kathmandu : National Planning
Commission . National Planning Commission. (2015). Annual Development Programs. Kathmandu: National Planning
Comission. Retrieved 11 10, 2016, from http://www.npc.gov.np/en/category/annual_development_programs
National Planning Commission. (2016). 14th Three Year Plan (2016/2017-2018/2019) Approach Paper. National Planning Commission.
Nepal Economic Forum. (2014, 7). Nepal Economic Forum. Retrieved 11 09, 2016, from http://www.nepaleconomicforum.org/uploads/publications/file/Hydropower%20Development%20in%20Nepal%20Final_20150413010749.pdf
Nepal Rastra Bank. (2016, 7). Nepal Rastra Bank. Retrieved 12 01, 2016, from https://www.nrb.org.np/ofg/monetary_policy/Monetary_Policy_(in_English)--2016-17_(Full__Text).pdf
Nepal Rastra Bank. (2016). Nepal Rastra Bank - Official Website. Retrieved 10 2016 Nepal Rastra Bank. (2016). Nepal Rastra Bank- Banking and Financial Statistics. Retrieved 10 7, 2016,
from https://nrb.org.np/bfr/bfrstatistics.php?tp=bank_fina_statistics&&vw=15 PPI World Bank. (2016). PPI Visualization Dashboard. Retrieved 12 07, 2016, from
http://ppi.worldbank.org/visualization/ppi.html#sector=&status=&ppi=&investment=®ion=&ida=&income=&ppp=&mdb=&year=&excel=false&map=NP&header=true
PPP Knowledge Lab. (2015). PPP Knowledge Lab. Retrieved 12 01, 2016, from https://pppknowledgelab.org/countries/Nepal
PwC. (2014). Road Sector- Nepal Investment Climate Improvement Project . Delhi: PricewaterhouseCoopers.
Qureshi, Z. (2016). Meeting the Challenge of Sustainable Infrastructure: The Role of Publi Policy. Brookings Institute .
Rai, N., Iqbal, A., Zareen, A., Mahmood, T., Muzamil, M., Huq, S., & Elahi, N. (2015). Financing inclusive low-carbon resilient development. IIED.
Sigdel, P. (2016). Infrastructure Financing: Status of Nepalese Banking. Kathmandu : Confederation of Nepalese Industries.

54
Sigdel, S. (2014). A Description and Analysis of the Budget Formulation and Implementation Process in Nepal. Kathmandu : Alliance for Social Dialogue.
Subedi, B. R. (2016). Government Reveneu and Some Related Issues. Rupantaran - Nepal Rastra Bank Employees Association.
Suwal, S. (2015). The Water Project. Retrieved 12 02, 2016, from https://thewaterproject.org/water-crisis/water-in-crisis-nepal
The National Planning Commission . (2013). Three Year Plan (2013/2014-2015/2016). Kathmandu : The National Planning Commission (Government of Nepal).
The World Bank . (2014). Turkey's Transition. Washington DC 20433: International Bank for Reconstruction and Development/ The World Bank.
The World Bank . (2015). Financial Development and Structure Dataset. Retrieved 2016, from http://www.worldbank.org/en/publication/gfdr/data/financial-structure-database
The World Bank. (2012). South Asia Economic Focus: A Review of Economic Developments in South Asian Countries- Creating Fiscal Space through Revenue Mobilization. Washington, D.C: The World Bank.
The World Bank. (2016). World Development Indicators. Retrieved 12 22, 2016, from http://data.worldbank.org/data-catalog/world-development-indicators
Uddin, J., & Sultana, N. (2013). Financing in Infrastructure and Energy Sectors and Issuance of Bonds in Bangladesh: Problems and Prospects. Bangladesh Bank, Research Department .
UNESCAP. (2016). UN Web Site. Retrieved 12 01, 2016, from http://www.unescap.org/announcement/south-asia-expected-be-world%E2%80%99s-fastest-growing-region-2016-17-says-united-nations
Wagle, B., Acharya, K., & Sapkota, S. (2013). Analysis of the performance of Public Enterprises. Kathmandu : Sambriddhi, The Prosperity Foundation.
World Economic Forum . (2016). The Global Competitiveness Report. Geneva: World Economic Forum.