national health performance reporting
TRANSCRIPT
22 Australian hospital statistics 2012–13
3 Hospital performance indicators Performance indicators are defined as statistics or other units of information that, directly or indirectly, reflect either the extent to which an anticipated outcome is achieved or the quality of the processes leading to that outcome (NHPC 2001).
National health performance reporting In Australia, national public reporting of hospital performance is undertaken by a number of organisations under nationally agreed arrangements.
The national arrangements for hospital performance reporting in Australia comprise the:
• National Health Performance Framework (NHPF)—a conceptual framework for performance assessment that is not linked to any agreement. At the request of health ministers, a set of performance indicators are reported biennially in Australia’s health (AIHW 2012a).
• National Healthcare Agreement (NHA) — agreed performance indicators and benchmarks are reported annually by the COAG Reform Council (CRC) (CRC 2013a). The NHA performance indicators based on 2007–08 to 2011–12 hospital data have been published by the CRC (CRC 2010, 2011 and 2012). The performance indicators presented here are based on data for 2012–13 and on specifications anticipated to be used for the council’s 2014 report.
• National Partnership Agreements (NPA)—specified indicators or benchmarks for each agreement are reported annually by the CRC (CRC 2013b). The NPA-IPHS includes reporting of performance related to emergency departments and elective surgery in public hospitals.
• National Health Reform Agreement (NHRA) and associated Performance and Accountability Framework— information on the performance of public and private hospitals and Local Hospital Networks are reported by the National Health Performance Authority (NHPA) on the MyHospitals website.
• The Australian Commission on Safety and Quality in Health Care (ACSQHC) also has performance reporting-related roles under the NHRA, reporting publicly on the state of safety and quality, including performance against national standards (ACSQHC 2013).
• Review of Government Service Provision—information on the equity, efficiency and effectiveness of government services (including hospitals) are reported by the Steering Committee for the Review of Government Service Provision (SCRGSP 2014).
The AIHW provides data from its national hospitals databases to support this range of reporting, and reports many of the hospitals-related performance indicators in the Australian hospital statistics series each year.
This chapter presents hospital performance indicators within the context of the National Health Performance Framework (NHPF).
Australian hospital statistics 2012–13 23
The National Health Performance Framework In 2001, the National Health Performance Committee (NHPC) developed a framework to report on the performance of the Australian health system, which was adopted by health ministers. In 2008, the Australian Health Ministers Advisory Committee’s National Health Information Standards and Statistics Committee (NHISSC) endorsed a revised framework, termed the National Health Performance Framework 2009 (NHPF). It is consistent with health performance frameworks used internationally (International Organization for Standardization 2010; Organization for Economic Cooperation and Development 2013, ISO 2010) and therefore can also support comparisons of Australia’s performance internationally.
The NHPC described the framework as a structure to guide the understanding and evaluation of the health system, facilitating consideration of how well the health system or program is performing. The framework has three domains: ‘Health Status’, ‘Determinants of Health’ and ‘Health System Performance’. Questions are posed for each domain and a number of dimensions have been identified within each domain. The dimensions guide the development and selection of performance indicators that can be used together to answer that domain’s questions. Sometimes, single indicators can provide information relevant to several dimensions of the framework.
A set of indicators was developed to populate these domains and, since 2008, at the request of health ministers, the AIHW has reported on these National Health Performance Indicators biennially in Australia’s health (AIHW 2012a). There are 40 indicators across the 14 dimensions of the 3 domains.
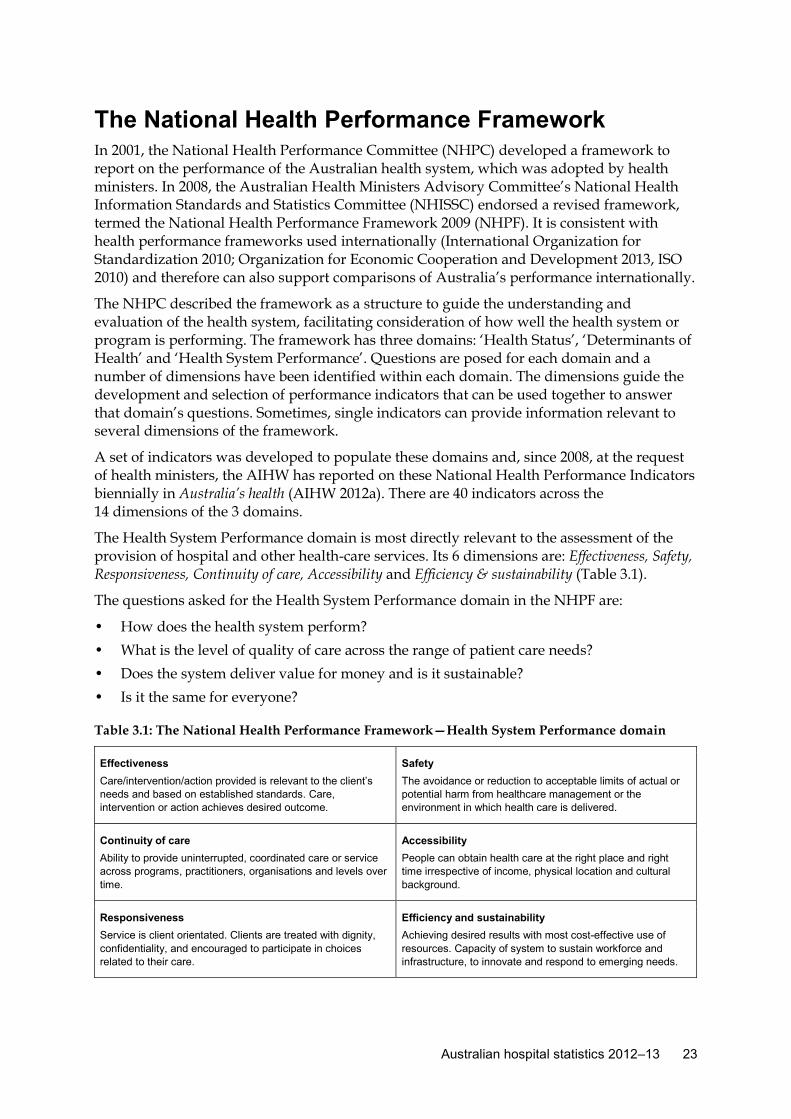
The Health System Performance domain is most directly relevant to the assessment of the provision of hospital and other health-care services. Its 6 dimensions are: Effectiveness, Safety, Responsiveness, Continuity of care, Accessibility and Efficiency & sustainability (Table 3.1).
The questions asked for the Health System Performance domain in the NHPF are:
• How does the health system perform? • What is the level of quality of care across the range of patient care needs? • Does the system deliver value for money and is it sustainable? • Is it the same for everyone?
Table 3.1: The National Health Performance Framework—Health System Performance domain
Effectiveness Care/intervention/action provided is relevant to the client’s needs and based on established standards. Care, intervention or action achieves desired outcome.
Safety The avoidance or reduction to acceptable limits of actual or potential harm from healthcare management or the environment in which health care is delivered.
Continuity of care Ability to provide uninterrupted, coordinated care or service across programs, practitioners, organisations and levels over time.
Accessibility People can obtain health care at the right place and right time irrespective of income, physical location and cultural background.
Responsiveness Service is client orientated. Clients are treated with dignity, confidentiality, and encouraged to participate in choices related to their care.
Efficiency and sustainability Achieving desired results with most cost-effective use of resources. Capacity of system to sustain workforce and infrastructure, to innovate and respond to emerging needs.
24 Australian hospital statistics 2012–13
What data are reported? Seven hospital performance indicators are presented in this chapter.
Information for another 2 indicators that do not relate to hospital performance is included in other chapters.
Indicators related to hospital performance are listed in Table 3.2 against the dimensions of the NHPF. Some indicators can be related to more than one dimension of the NHPF, even though they are presented here against only one dimension.
Table 3.2 also shows which set of nationally agreed performance indicators the indicator relates to.
Performance indicators related to hospitals
National Health Performance Framework Australian hospital statistics reports 6 indicators under the health system performance domain:
• adverse events treated in hospitals • falls resulting in patient harm in hospitals • rates of services: hospital procedures • cost per casemix-adjusted separation for acute care episodes (calculation method
currently under review) • relative stay index • average length of stay for selected AR-DRGs.
National Healthcare Agreement The NHA includes 33 performance indicators (disaggregated by Indigenous status, disability status, remoteness area and socio-economic status where possible) and 7 performance benchmarks that are to be reported regularly under the Intergovernmental Agreement on Federal Financial Relations.
Of the 9 NHA performance indicators based on hospital data, 6 relate to the outcome of Australians receive appropriate high quality and affordable hospital and hospital related care, and 1 of these is presented in this chapter:
• unplanned/unexpected readmissions following selected surgical episodes of care (same public hospital).
Four of the remaining five NHA hospital performance indicators based on the 2012–13 hospital data have already been reported in earlier AIHW publications. Those indicators are:
• waiting times for emergency department care: proportion seen on time—in Australian hospitals statistics 2012–13: emergency department care (AIHW 2013c)
• waiting times for emergency department care: proportion completed within 4 hours—in Australian hospitals statistics 2012–13: emergency department care (AIHW 2013c)
• waiting times for elective surgery: waiting time (in days)—in Australian hospitals statistics 2012–13: elective surgery waiting times (AIHW 2013d)
Australian hospital statistics 2012–13 25
• Healthcare associated infections— in Australian hospitals statistics 2012–13: Staphylococcus aureus bacteraemia in Australian public hospitals (AIHW 2013e).
The AIHW and the CRC did not report the performance indicator ‘waiting times for elective surgery: proportion seen on time’, due to apparent variations in reporting of clinical urgency categories. For more information refer to Australian hospital statistics 2012–13: elective surgery waiting times (AIHW 2013d).
Other performance indicators Of the 3 NHA performance indicators based on hospital data that relate to different outcome areas, 2 are presented elsewhere in this report and 1 has been reported in a previous AIHW publication (see Table 3.3):
• Selected potentially preventable hospitalisations relates to the outcome Australians receive appropriate high quality and affordable primary and community health services and is presented in Chapter 6.
• Hospital patient days used by those eligible and waiting for residential aged care relates to the outcome Older Australians receive appropriate high quality and affordable health and aged services and is presented in Chapter 10.
• Selected potentially avoidable GP type presentations to emergency departments—has been reported in Australian hospitals statistics 2012–13: emergency department care (AIHW 2013c).
Box 3.1: What are the limitations of the data? Any interpretation of the performance indicators presented here should take into consideration the limitations of the data from which they are derived. Information on variation in data recording practices, data quality and database coverage is presented in Appendix A. While the rates could be interpreted as reflecting hospital system performance, they may also reflect variation in underlying needs for hospitalisation, admission and data recording practices, and availability of non-hospital services.
26 Australian hospital statistics 2012–13
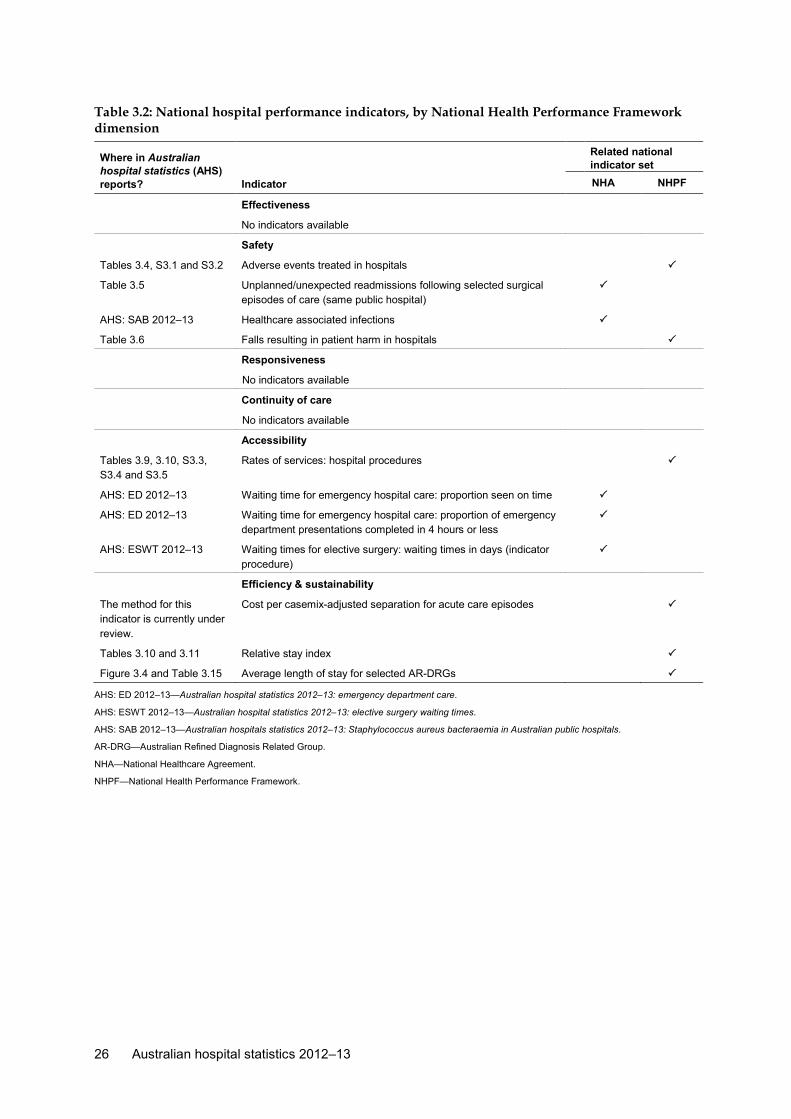
Table 3.2: National hospital performance indicators, by National Health Performance Framework dimension
Where in Australian hospital statistics (AHS) reports?
Related national indicator set
Indicator NHA NHPF
Effectiveness
No indicators available
Safety
Tables 3.4, S3.1 and S3.2 Adverse events treated in hospitals
Table 3.5 Unplanned/unexpected readmissions following selected surgical episodes of care (same public hospital)
AHS: SAB 2012–13 Healthcare associated infections
Table 3.6 Falls resulting in patient harm in hospitals
Responsiveness
No indicators available
Continuity of care
No indicators available
Accessibility
Tables 3.9, 3.10, S3.3, S3.4 and S3.5
Rates of services: hospital procedures
AHS: ED 2012–13 Waiting time for emergency hospital care: proportion seen on time
AHS: ED 2012–13 Waiting time for emergency hospital care: proportion of emergency department presentations completed in 4 hours or less
AHS: ESWT 2012–13 Waiting times for elective surgery: waiting times in days (indicator procedure)
Efficiency & sustainability
The method for this indicator is currently under review.
Cost per casemix-adjusted separation for acute care episodes
Tables 3.10 and 3.11 Relative stay index
Figure 3.4 and Table 3.15 Average length of stay for selected AR-DRGs
AHS: ED 2012–13—Australian hospital statistics 2012–13: emergency department care.
AHS: ESWT 2012–13—Australian hospital statistics 2012–13: elective surgery waiting times.
AHS: SAB 2012–13—Australian hospitals statistics 2012–13: Staphylococcus aureus bacteraemia in Australian public hospitals.
AR-DRG—Australian Refined Diagnosis Related Group.
NHA—National Healthcare Agreement.
NHPF—National Health Performance Framework.
Australian hospital statistics 2012–13 27
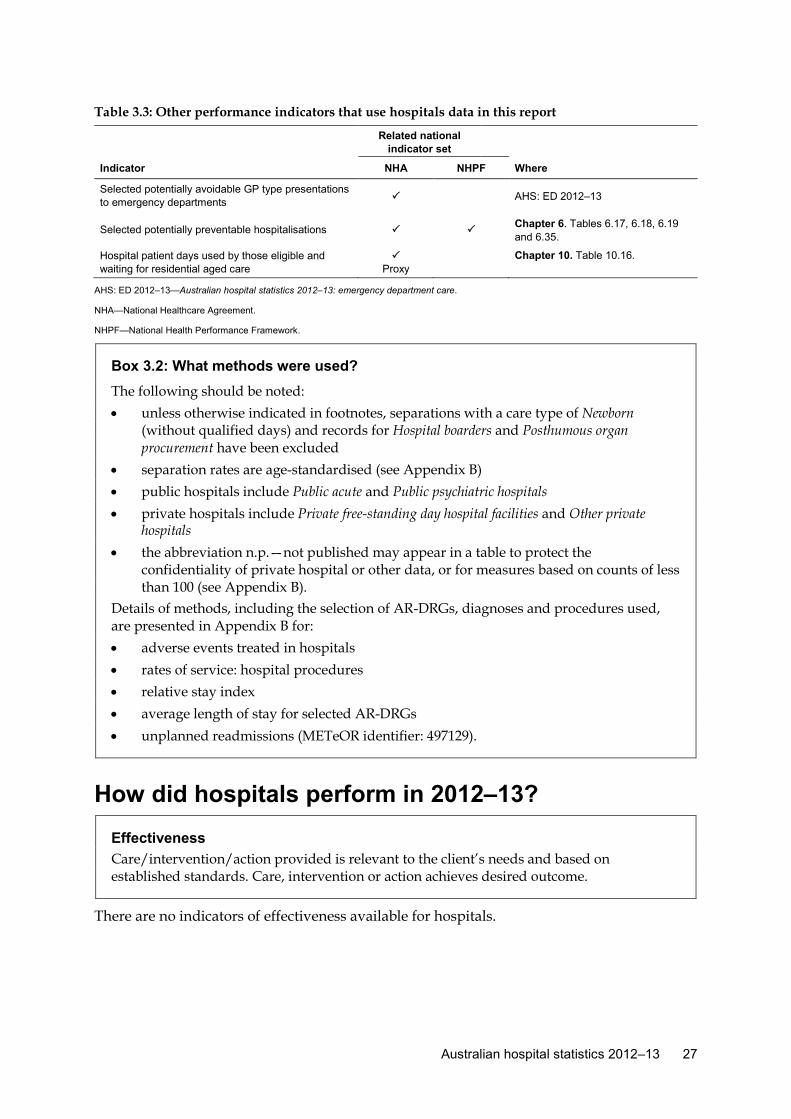
Table 3.3: Other performance indicators that use hospitals data in this report
Related national
indicator set
Indicator NHA NHPF Where
Selected potentially avoidable GP type presentations to emergency departments AHS: ED 2012–13
Selected potentially preventable hospitalisations Chapter 6. Tables 6.17, 6.18, 6.19 and 6.35.
Hospital patient days used by those eligible and waiting for residential aged care
Proxy
Chapter 10. Table 10.16.
AHS: ED 2012–13—Australian hospital statistics 2012–13: emergency department care.
NHA—National Healthcare Agreement.
NHPF—National Health Performance Framework.
Box 3.2: What methods were used? The following should be noted: • unless otherwise indicated in footnotes, separations with a care type of Newborn
(without qualified days) and records for Hospital boarders and Posthumous organ procurement have been excluded
• separation rates are age-standardised (see Appendix B) • public hospitals include Public acute and Public psychiatric hospitals • private hospitals include Private free-standing day hospital facilities and Other private
hospitals • the abbreviation n.p.—not published may appear in a table to protect the
confidentiality of private hospital or other data, or for measures based on counts of less than 100 (see Appendix B).
Details of methods, including the selection of AR-DRGs, diagnoses and procedures used, are presented in Appendix B for: • adverse events treated in hospitals • rates of service: hospital procedures • relative stay index • average length of stay for selected AR-DRGs • unplanned readmissions (METeOR identifier: 497129).
How did hospitals perform in 2012–13? Effectiveness Care/intervention/action provided is relevant to the client’s needs and based on established standards. Care, intervention or action achieves desired outcome.
There are no indicators of effectiveness available for hospitals.
28 Australian hospital statistics 2012–13
Safety The avoidance or reduction to acceptable limits of actual or potential harm from health-care management or the environment in which health care is delivered.
Performance indicator: adverse events treated in hospitals Adverse events are defined as incidents in which harm resulted to a person receiving health care. They include infections, falls resulting in injuries and problems with medication and medical devices. Some of these adverse events may be preventable.
Hospital separations data include information on diagnoses, places of occurrence and external causes of injury and poisoning that can indicate that an adverse event was treated and/or occurred during the hospitalisation. However, other diagnosis codes may also suggest that an adverse event has occurred, and some adverse events are not identifiable using these codes. A separation may be recorded against more than 1 category in Table 3.4 as some adverse events are reported as diagnoses and others as external causes or places of occurrence (of the injury or poisoning).
The data in Table 3.4 can be interpreted as representing selected adverse events in health care that have resulted in, or have affected, hospital admissions, rather than all adverse events that occurred in hospitals. Some of the adverse events included in these tables may represent events that occurred before admission. Condition onset flag (COF) information (see Chapter 6 and Appendix B) can be used to provide other information about adverse events occurring, and treated within, single episodes of care.
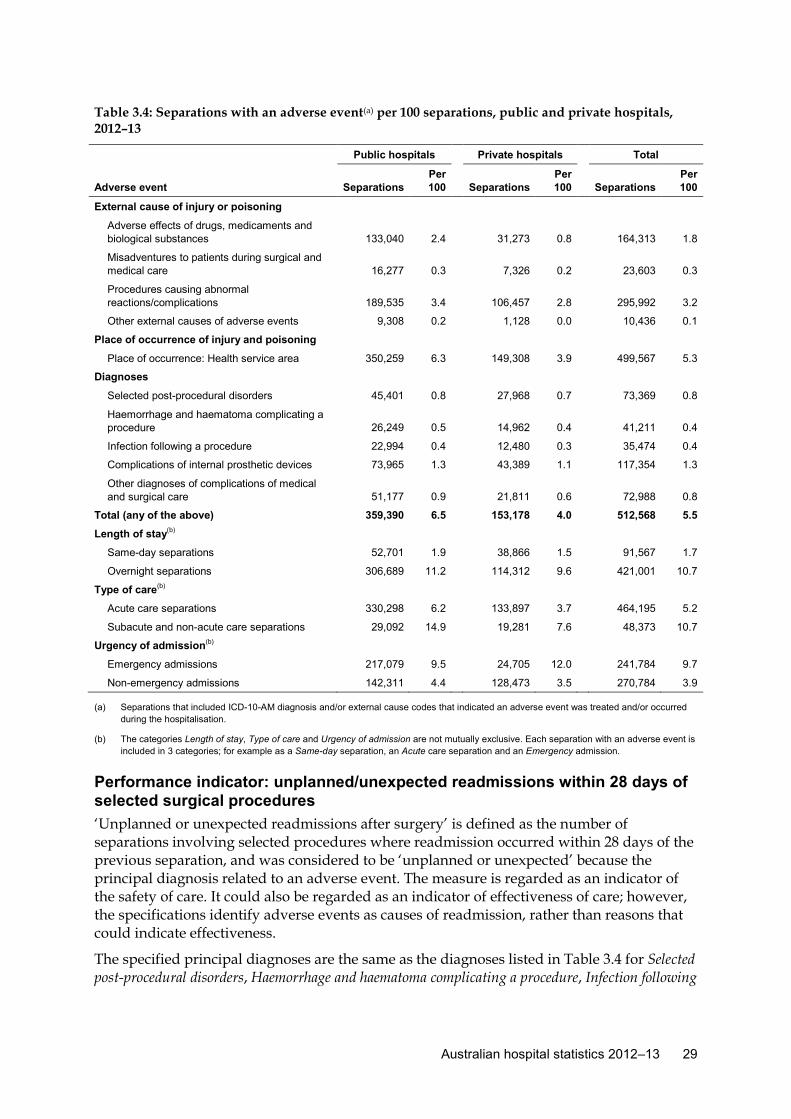
In 2012–13, 5.5% of separations reported 1 or more International Statistical Classification of Diseases and Related Health Problems, 10th Revision, Australian Modification (ICD-10-AM) codes indicating 1 or more adverse events (Table 3.4). The proportion of separations with an adverse event was 6.5% for public hospitals and 4.0% for private hospitals. The data for public hospitals are not comparable with the data for private hospitals because their casemixes differ and recording practices may be different.
The proportion of same-day separations with an adverse event was 1.7% overall, and 10.7% of overnight separations had an adverse event (Table 3.4).
Separations for sub- and non-acute care had higher rates of adverse events than acute care separations (10.7 and 5.2 separations with an adverse event per 100, respectively), and emergency admissions had higher rates of adverse events than non-emergency admissions (9.7 and 3.9 separations with an adverse event per 100, respectively).
For public hospitals, about 53% of separations with an adverse event reported Procedures causing abnormal reactions/complications and 37% reported Adverse effects of drugs, medicaments and biological substances.
For private hospitals, about 69% of separations with an adverse event reported Procedures causing abnormal reactions/complications and 20% reported Adverse effects of drugs, medicaments and biological substances.
Australian hospital statistics 2012–13 29
Table 3.4: Separations with an adverse event(a) per 100 separations, public and private hospitals, 2012–13
Public hospitals Private hospitals Total
Adverse event Separations Per 100 Separations
Per 100 Separations
Per 100
External cause of injury or poisoning
Adverse effects of drugs, medicaments and biological substances 133,040 2.4 31,273 0.8 164,313 1.8
Misadventures to patients during surgical and medical care 16,277 0.3 7,326 0.2 23,603 0.3
Procedures causing abnormal reactions/complications 189,535 3.4 106,457 2.8 295,992 3.2
Other external causes of adverse events 9,308 0.2 1,128 0.0 10,436 0.1
Place of occurrence of injury and poisoning
Place of occurrence: Health service area 350,259 6.3 149,308 3.9 499,567 5.3
Diagnoses
Selected post-procedural disorders 45,401 0.8 27,968 0.7 73,369 0.8
Haemorrhage and haematoma complicating a procedure 26,249 0.5 14,962 0.4 41,211 0.4
Infection following a procedure 22,994 0.4 12,480 0.3 35,474 0.4
Complications of internal prosthetic devices 73,965 1.3 43,389 1.1 117,354 1.3
Other diagnoses of complications of medical and surgical care 51,177 0.9 21,811 0.6 72,988 0.8
Total (any of the above) 359,390 6.5 153,178 4.0 512,568 5.5
Length of stay(b)
Same-day separations 52,701 1.9 38,866 1.5 91,567 1.7
Overnight separations 306,689 11.2 114,312 9.6 421,001 10.7
Type of care(b)
Acute care separations 330,298 6.2 133,897 3.7 464,195 5.2
Subacute and non-acute care separations 29,092 14.9 19,281 7.6 48,373 10.7
Urgency of admission(b)
Emergency admissions 217,079 9.5 24,705 12.0 241,784 9.7
Non-emergency admissions 142,311 4.4 128,473 3.5 270,784 3.9
(a) Separations that included ICD-10-AM diagnosis and/or external cause codes that indicated an adverse event was treated and/or occurred during the hospitalisation.
(b) The categories Length of stay, Type of care and Urgency of admission are not mutually exclusive. Each separation with an adverse event is included in 3 categories; for example as a Same-day separation, an Acute care separation and an Emergency admission.
Performance indicator: unplanned/unexpected readmissions within 28 days of selected surgical procedures ‘Unplanned or unexpected readmissions after surgery’ is defined as the number of separations involving selected procedures where readmission occurred within 28 days of the previous separation, and was considered to be ‘unplanned or unexpected’ because the principal diagnosis related to an adverse event. The measure is regarded as an indicator of the safety of care. It could also be regarded as an indicator of effectiveness of care; however, the specifications identify adverse events as causes of readmission, rather than reasons that could indicate effectiveness.
The specified principal diagnoses are the same as the diagnoses listed in Table 3.4 for Selected post-procedural disorders, Haemorrhage and haematoma complicating a procedure, Infection following
30 Australian hospital statistics 2012–13
a procedure, Complications of internal prosthetic devices and Other diagnoses of complications of medical and surgical care.
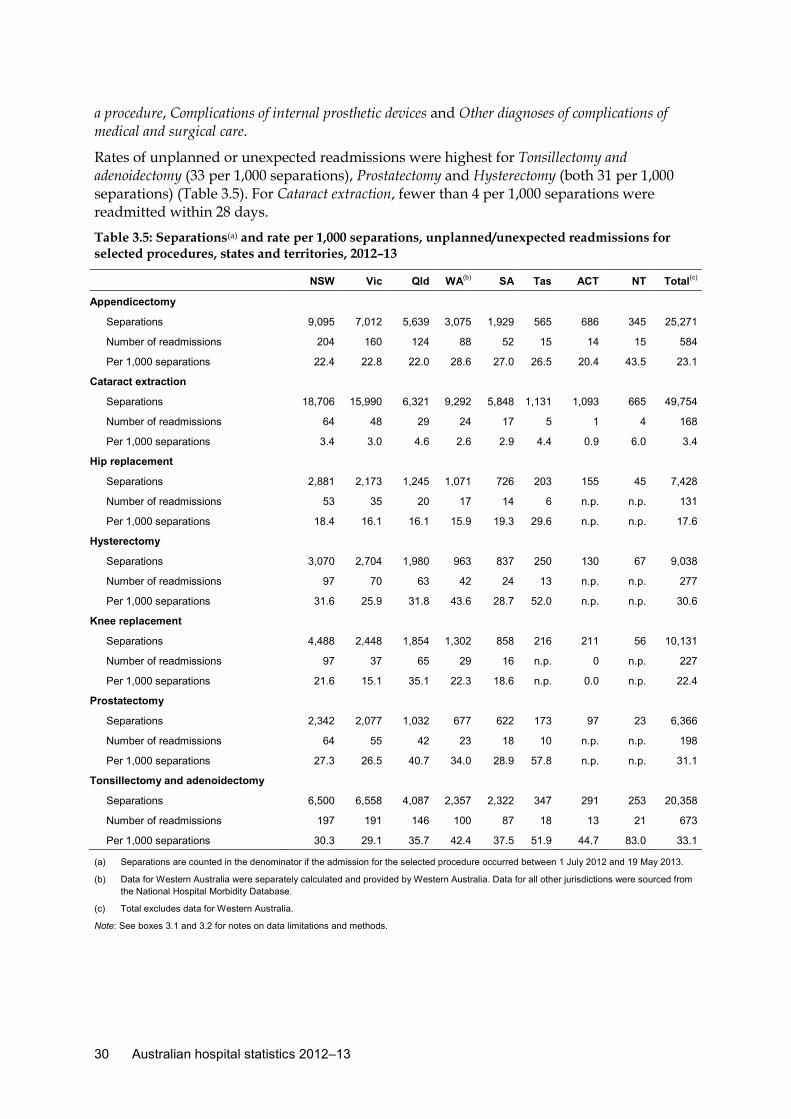
Rates of unplanned or unexpected readmissions were highest for Tonsillectomy and adenoidectomy (33 per 1,000 separations), Prostatectomy and Hysterectomy (both 31 per 1,000 separations) (Table 3.5). For Cataract extraction, fewer than 4 per 1,000 separations were readmitted within 28 days.
Table 3.5: Separations(a) and rate per 1,000 separations, unplanned/unexpected readmissions for selected procedures, states and territories, 2012–13
NSW Vic Qld WA(b) SA Tas ACT NT Total(c)
Appendicectomy
Separations 9,095 7,012 5,639 3,075 1,929 565 686 345 25,271
Number of readmissions 204 160 124 88 52 15 14 15 584
Per 1,000 separations 22.4 22.8 22.0 28.6 27.0 26.5 20.4 43.5 23.1
Cataract extraction
Separations 18,706 15,990 6,321 9,292 5,848 1,131 1,093 665 49,754
Number of readmissions 64 48 29 24 17 5 1 4 168
Per 1,000 separations 3.4 3.0 4.6 2.6 2.9 4.4 0.9 6.0 3.4
Hip replacement
Separations 2,881 2,173 1,245 1,071 726 203 155 45 7,428
Number of readmissions 53 35 20 17 14 6 n.p. n.p. 131
Per 1,000 separations 18.4 16.1 16.1 15.9 19.3 29.6 n.p. n.p. 17.6
Hysterectomy
Separations 3,070 2,704 1,980 963 837 250 130 67 9,038
Number of readmissions 97 70 63 42 24 13 n.p. n.p. 277
Per 1,000 separations 31.6 25.9 31.8 43.6 28.7 52.0 n.p. n.p. 30.6
Knee replacement
Separations 4,488 2,448 1,854 1,302 858 216 211 56 10,131
Number of readmissions 97 37 65 29 16 n.p. 0 n.p. 227
Per 1,000 separations 21.6 15.1 35.1 22.3 18.6 n.p. 0.0 n.p. 22.4
Prostatectomy
Separations 2,342 2,077 1,032 677 622 173 97 23 6,366
Number of readmissions 64 55 42 23 18 10 n.p. n.p. 198
Per 1,000 separations 27.3 26.5 40.7 34.0 28.9 57.8 n.p. n.p. 31.1
Tonsillectomy and adenoidectomy
Separations 6,500 6,558 4,087 2,357 2,322 347 291 253 20,358
Number of readmissions 197 191 146 100 87 18 13 21 673
Per 1,000 separations 30.3 29.1 35.7 42.4 37.5 51.9 44.7 83.0 33.1
(a) Separations are counted in the denominator if the admission for the selected procedure occurred between 1 July 2012 and 19 May 2013.
(b) Data for Western Australia were separately calculated and provided by Western Australia. Data for all other jurisdictions were sourced from the National Hospital Morbidity Database.
(c) Total excludes data for Western Australia.
Note: See boxes 3.1 and 3.2 for notes on data limitations and methods.
Australian hospital statistics 2012–13 31
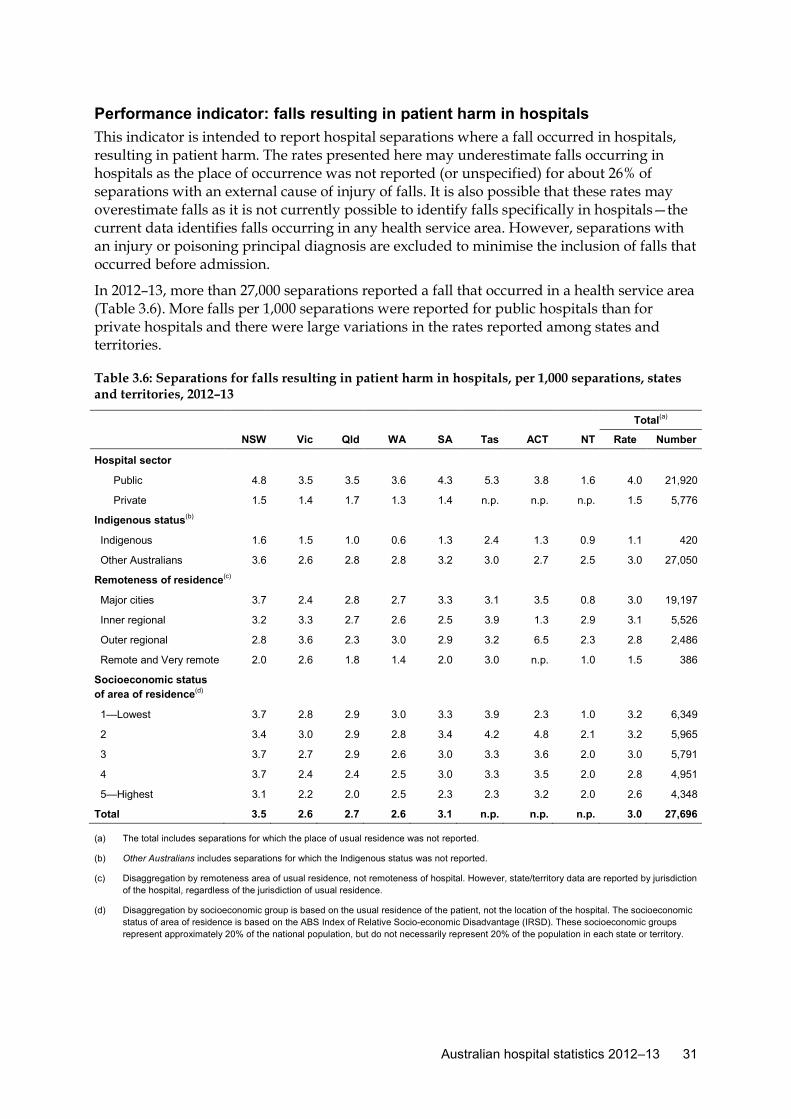
Performance indicator: falls resulting in patient harm in hospitals This indicator is intended to report hospital separations where a fall occurred in hospitals, resulting in patient harm. The rates presented here may underestimate falls occurring in hospitals as the place of occurrence was not reported (or unspecified) for about 26% of separations with an external cause of injury of falls. It is also possible that these rates may overestimate falls as it is not currently possible to identify falls specifically in hospitals—the current data identifies falls occurring in any health service area. However, separations with an injury or poisoning principal diagnosis are excluded to minimise the inclusion of falls that occurred before admission.
In 2012–13, more than 27,000 separations reported a fall that occurred in a health service area (Table 3.6). More falls per 1,000 separations were reported for public hospitals than for private hospitals and there were large variations in the rates reported among states and territories.
Table 3.6: Separations for falls resulting in patient harm in hospitals, per 1,000 separations, states and territories, 2012–13
Total(a)
NSW Vic Qld WA SA Tas ACT NT Rate Number
Hospital sector
Public 4.8 3.5 3.5 3.6 4.3 5.3 3.8 1.6 4.0 21,920
Private 1.5 1.4 1.7 1.3 1.4 n.p. n.p. n.p. 1.5 5,776
Indigenous status(b)
Indigenous 1.6 1.5 1.0 0.6 1.3 2.4 1.3 0.9 1.1 420
Other Australians 3.6 2.6 2.8 2.8 3.2 3.0 2.7 2.5 3.0 27,050
Remoteness of residence(c)
Major cities 3.7 2.4 2.8 2.7 3.3 3.1 3.5 0.8 3.0 19,197
Inner regional 3.2 3.3 2.7 2.6 2.5 3.9 1.3 2.9 3.1 5,526
Outer regional 2.8 3.6 2.3 3.0 2.9 3.2 6.5 2.3 2.8 2,486
Remote and Very remote 2.0 2.6 1.8 1.4 2.0 3.0 n.p. 1.0 1.5 386
Socioeconomic status of area of residence(d)
1—Lowest 3.7 2.8 2.9 3.0 3.3 3.9 2.3 1.0 3.2 6,349
2 3.4 3.0 2.9 2.8 3.4 4.2 4.8 2.1 3.2 5,965
3 3.7 2.7 2.9 2.6 3.0 3.3 3.6 2.0 3.0 5,791
4 3.7 2.4 2.4 2.5 3.0 3.3 3.5 2.0 2.8 4,951
5—Highest 3.1 2.2 2.0 2.5 2.3 2.3 3.2 2.0 2.6 4,348
Total 3.5 2.6 2.7 2.6 3.1 n.p. n.p. n.p. 3.0 27,696
(a) The total includes separations for which the place of usual residence was not reported.
(b) Other Australians includes separations for which the Indigenous status was not reported.
(c) Disaggregation by remoteness area of usual residence, not remoteness of hospital. However, state/territory data are reported by jurisdiction of the hospital, regardless of the jurisdiction of usual residence.
(d) Disaggregation by socioeconomic group is based on the usual residence of the patient, not the location of the hospital. The socioeconomic status of area of residence is based on the ABS Index of Relative Socio-economic Disadvantage (IRSD). These socioeconomic groups represent approximately 20% of the national population, but do not necessarily represent 20% of the population in each state or territory.
32 Australian hospital statistics 2012–13
Responsiveness Service is client orientated. Clients are treated with dignity, confidentiality, and encouraged to participate in choices related to their care.
There are no indicators of responsiveness available for hospitals.
Continuity of care Ability to provide uninterrupted, coordinated care or service across programs, practitioners, organisations and levels over time.
There are no indicators of continuity of care available for hospitals.
Accessibility People can obtain health care at the right place and right time irrespective of income, physical location and cultural background.
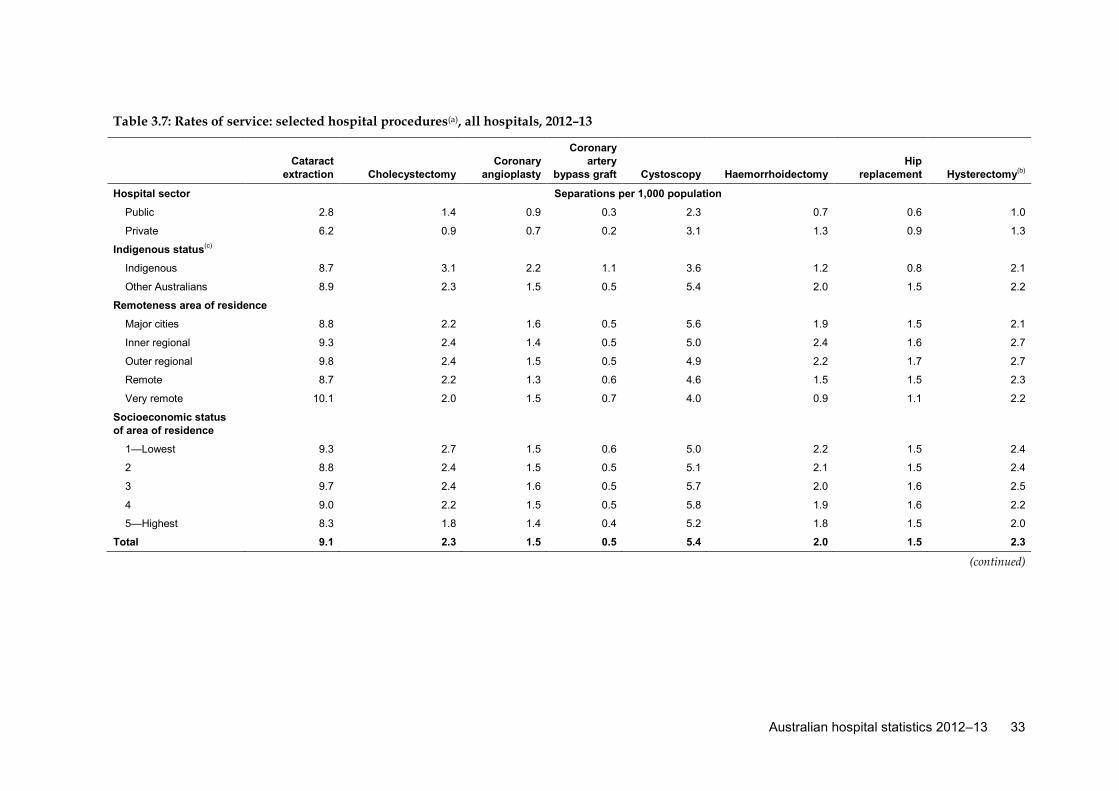
Performance indicator: rates of services—hospital procedures This indicator relates to accessibility of hospital services and may also relate to the appropriateness of hospital care. Generally, the procedures were selected because of the frequency with which they are undertaken, because they are often elective and discretionary and because alternative treatments are sometimes available.
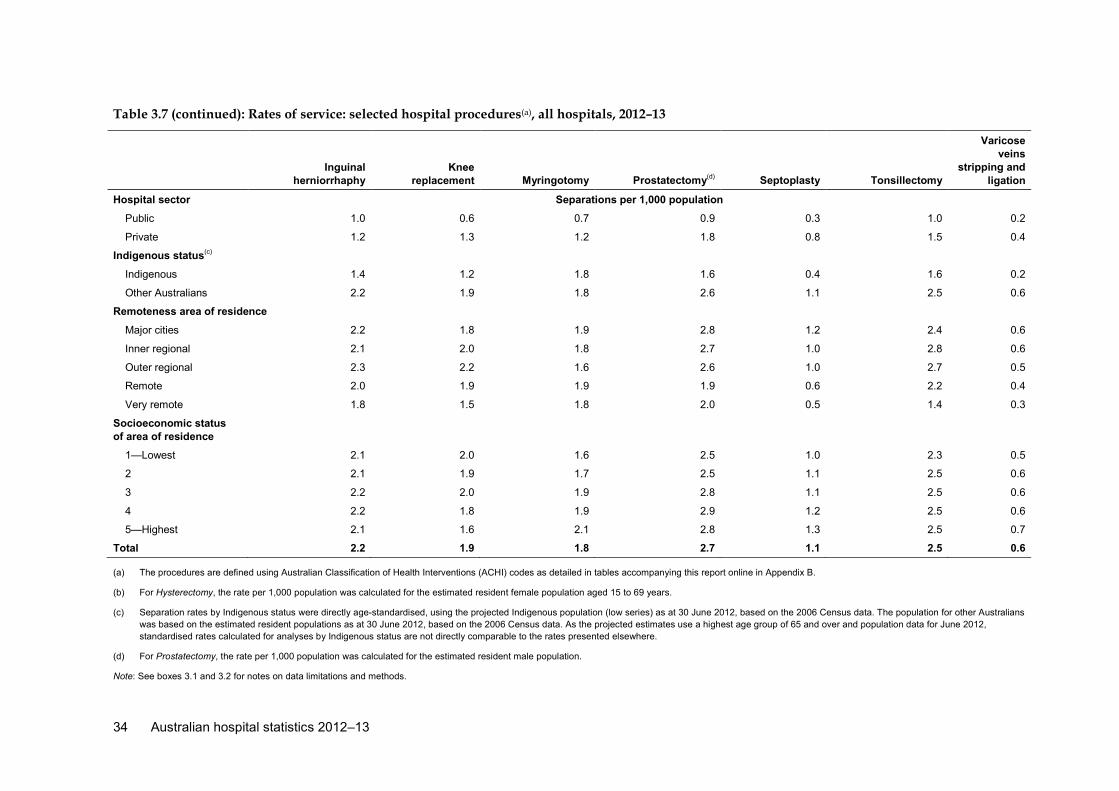
Table 3.7 presents the separations per 1,000 population for selected hospital procedures. Cataract extraction was the most common procedure (9.1 per 1,000 population). The rates varied between public and private sectors (2.8 and 6.2 per 1,000 population, respectively) but were fairly similar by Indigenous status and by socioeconomic status. Persons usually resident in Very remote areas had the highest separation rates for Cataract extraction.
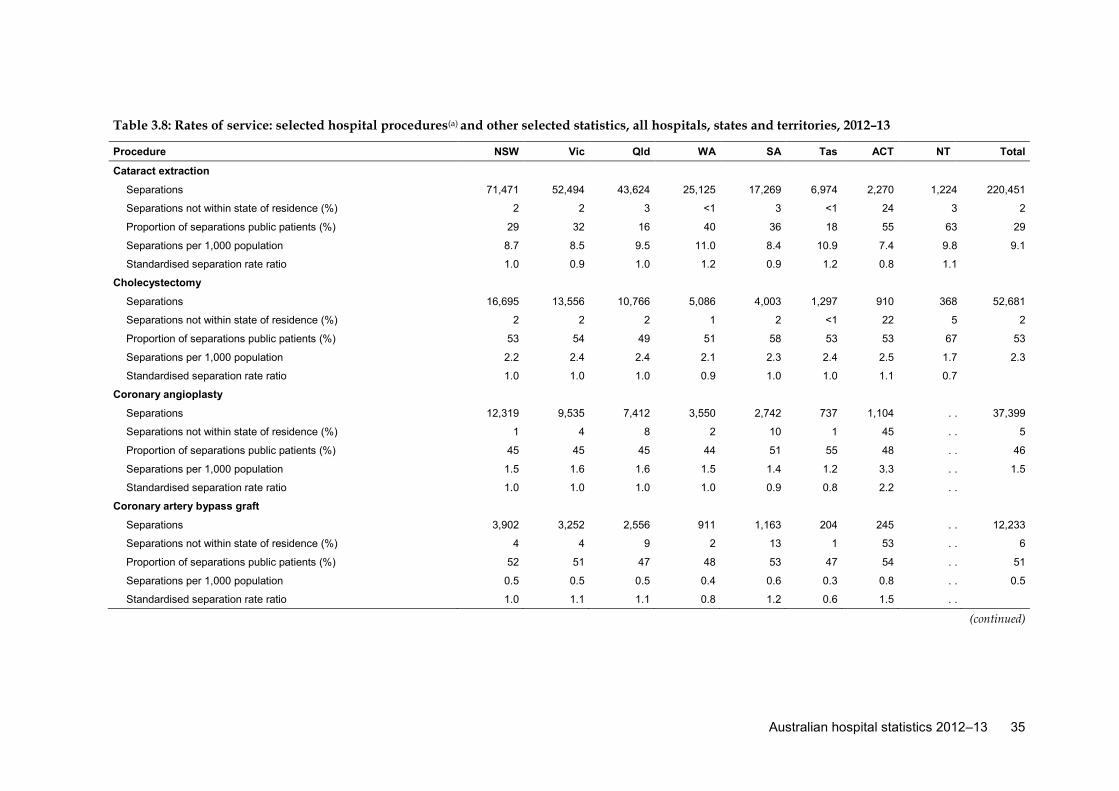
There was some variation in the numbers of separations per 1,000 population for the selected procedures among states and territories. For example, separations for Cataract extraction ranged from 7.4 per 1,000 population in the Australian Capital Territory to 11.0 per 1,000 in Western Australia (Table 3.8). However, as data are not available for private free-standing day hospitals in the Australian Capital Territory, this is likely to underestimate the separation rate for Cataract extraction in the Australian Capital Territory.
Additional information for these procedures for public and private hospitals, and by Indigenous status, remoteness area and socioeconomic status of area of residence is in tables that accompany this report online at <www.aihw.gov.au/hospitals/>.
Australian hospital statistics 2012–13 33
Table 3.7: Rates of service: selected hospital procedures(a), all hospitals, 2012–13
Cataract
extraction Cholecystectomy Coronary
angioplasty
Coronary artery
bypass graft Cystoscopy Haemorrhoidectomy Hip
replacement Hysterectomy(b)
Hospital sector Separations per 1,000 population
Public 2.8 1.4 0.9 0.3 2.3 0.7 0.6 1.0
Private 6.2 0.9 0.7 0.2 3.1 1.3 0.9 1.3
Indigenous status(c)
Indigenous 8.7 3.1 2.2 1.1 3.6 1.2 0.8 2.1
Other Australians 8.9 2.3 1.5 0.5 5.4 2.0 1.5 2.2
Remoteness area of residence
Major cities 8.8 2.2 1.6 0.5 5.6 1.9 1.5 2.1
Inner regional 9.3 2.4 1.4 0.5 5.0 2.4 1.6 2.7
Outer regional 9.8 2.4 1.5 0.5 4.9 2.2 1.7 2.7
Remote 8.7 2.2 1.3 0.6 4.6 1.5 1.5 2.3
Very remote 10.1 2.0 1.5 0.7 4.0 0.9 1.1 2.2
Socioeconomic status of area of residence
1—Lowest 9.3 2.7 1.5 0.6 5.0 2.2 1.5 2.4
2 8.8 2.4 1.5 0.5 5.1 2.1 1.5 2.4
3 9.7 2.4 1.6 0.5 5.7 2.0 1.6 2.5
4 9.0 2.2 1.5 0.5 5.8 1.9 1.6 2.2
5—Highest 8.3 1.8 1.4 0.4 5.2 1.8 1.5 2.0
Total 9.1 2.3 1.5 0.5 5.4 2.0 1.5 2.3
(continued)
34 Australian hospital statistics 2012–13
Table 3.7 (continued): Rates of service: selected hospital procedures(a), all hospitals, 2012–13
Inguinal
herniorrhaphy Knee
replacement Myringotomy Prostatectomy(d) Septoplasty Tonsillectomy
Varicose veins
stripping and ligation
Hospital sector Separations per 1,000 population
Public 1.0 0.6 0.7 0.9 0.3 1.0 0.2
Private 1.2 1.3 1.2 1.8 0.8 1.5 0.4
Indigenous status(c)
Indigenous 1.4 1.2 1.8 1.6 0.4 1.6 0.2
Other Australians 2.2 1.9 1.8 2.6 1.1 2.5 0.6
Remoteness area of residence
Major cities 2.2 1.8 1.9 2.8 1.2 2.4 0.6
Inner regional 2.1 2.0 1.8 2.7 1.0 2.8 0.6
Outer regional 2.3 2.2 1.6 2.6 1.0 2.7 0.5
Remote 2.0 1.9 1.9 1.9 0.6 2.2 0.4
Very remote 1.8 1.5 1.8 2.0 0.5 1.4 0.3
Socioeconomic status of area of residence
1—Lowest 2.1 2.0 1.6 2.5 1.0 2.3 0.5
2 2.1 1.9 1.7 2.5 1.1 2.5 0.6
3 2.2 2.0 1.9 2.8 1.1 2.5 0.6
4 2.2 1.8 1.9 2.9 1.2 2.5 0.6
5—Highest 2.1 1.6 2.1 2.8 1.3 2.5 0.7
Total 2.2 1.9 1.8 2.7 1.1 2.5 0.6
(a) The procedures are defined using Australian Classification of Health Interventions (ACHI) codes as detailed in tables accompanying this report online in Appendix B.
(b) For Hysterectomy, the rate per 1,000 population was calculated for the estimated resident female population aged 15 to 69 years.
(c) Separation rates by Indigenous status were directly age-standardised, using the projected Indigenous population (low series) as at 30 June 2012, based on the 2006 Census data. The population for other Australians was based on the estimated resident populations as at 30 June 2012, based on the 2006 Census data. As the projected estimates use a highest age group of 65 and over and population data for June 2012, standardised rates calculated for analyses by Indigenous status are not directly comparable to the rates presented elsewhere.
(d) For Prostatectomy, the rate per 1,000 population was calculated for the estimated resident male population.
Note: See boxes 3.1 and 3.2 for notes on data limitations and methods.
Australian hospital statistics 2012–13 35
Table 3.8: Rates of service: selected hospital procedures(a) and other selected statistics, all hospitals, states and territories, 2012–13
Procedure NSW Vic Qld WA SA Tas ACT NT Total
Cataract extraction
Separations 71,471 52,494 43,624 25,125 17,269 6,974 2,270 1,224 220,451
Separations not within state of residence (%) 2 2 3 <1 3 <1 24 3 2
Proportion of separations public patients (%) 29 32 16 40 36 18 55 63 29
Separations per 1,000 population 8.7 8.5 9.5 11.0 8.4 10.9 7.4 9.8 9.1
Standardised separation rate ratio 1.0 0.9 1.0 1.2 0.9 1.2 0.8 1.1
Cholecystectomy
Separations 16,695 13,556 10,766 5,086 4,003 1,297 910 368 52,681
Separations not within state of residence (%) 2 2 2 1 2 <1 22 5 2
Proportion of separations public patients (%) 53 54 49 51 58 53 53 67 53
Separations per 1,000 population 2.2 2.4 2.4 2.1 2.3 2.4 2.5 1.7 2.3
Standardised separation rate ratio 1.0 1.0 1.0 0.9 1.0 1.0 1.1 0.7
Coronary angioplasty
Separations 12,319 9,535 7,412 3,550 2,742 737 1,104 . . 37,399
Separations not within state of residence (%) 1 4 8 2 10 1 45 . . 5
Proportion of separations public patients (%) 45 45 45 44 51 55 48 . . 46
Separations per 1,000 population 1.5 1.6 1.6 1.5 1.4 1.2 3.3 . . 1.5
Standardised separation rate ratio 1.0 1.0 1.0 1.0 0.9 0.8 2.2 . .
Coronary artery bypass graft
Separations 3,902 3,252 2,556 911 1,163 204 245 . . 12,233
Separations not within state of residence (%) 4 4 9 2 13 1 53 . . 6
Proportion of separations public patients (%) 52 51 47 48 53 47 54 . . 51
Separations per 1,000 population 0.5 0.5 0.5 0.4 0.6 0.3 0.8 . . 0.5
Standardised separation rate ratio 1.0 1.1 1.1 0.8 1.2 0.6 1.5 . .
(continued)
36 Australian hospital statistics 2012–13
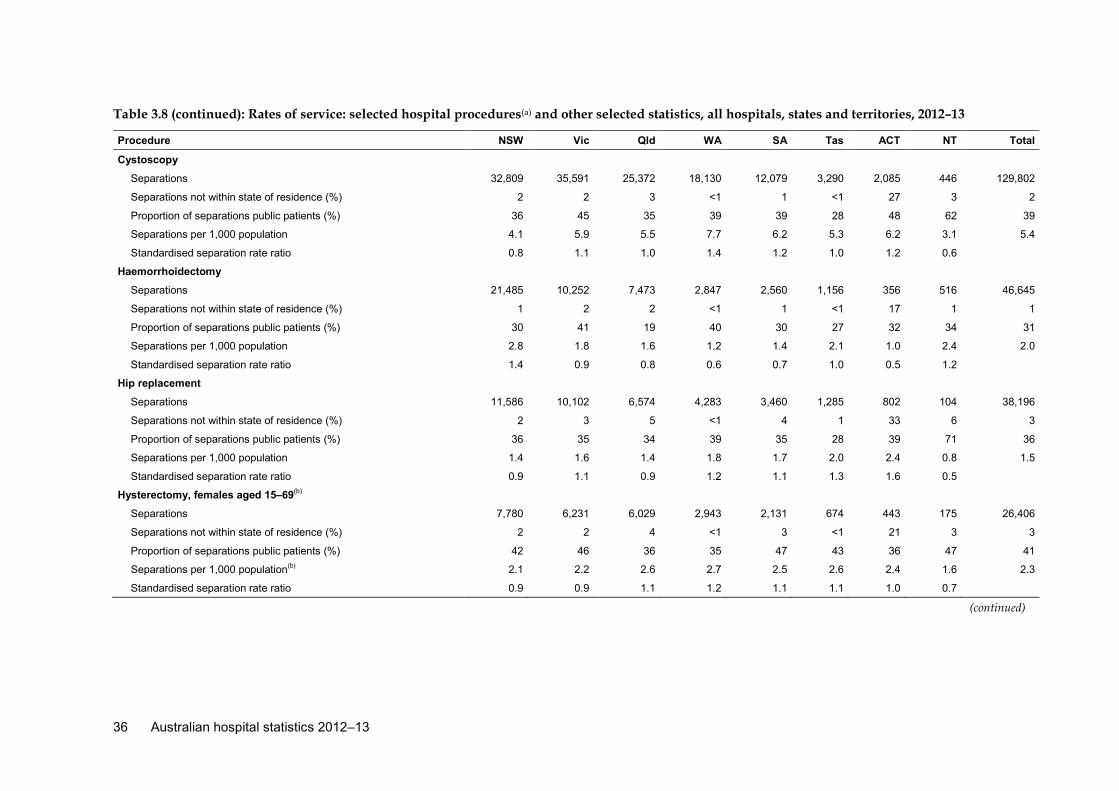
Table 3.8 (continued): Rates of service: selected hospital procedures(a) and other selected statistics, all hospitals, states and territories, 2012–13
Procedure NSW Vic Qld WA SA Tas ACT NT Total
Cystoscopy
Separations 32,809 35,591 25,372 18,130 12,079 3,290 2,085 446 129,802
Separations not within state of residence (%) 2 2 3 <1 1 <1 27 3 2
Proportion of separations public patients (%) 36 45 35 39 39 28 48 62 39
Separations per 1,000 population 4.1 5.9 5.5 7.7 6.2 5.3 6.2 3.1 5.4
Standardised separation rate ratio 0.8 1.1 1.0 1.4 1.2 1.0 1.2 0.6
Haemorrhoidectomy
Separations 21,485 10,252 7,473 2,847 2,560 1,156 356 516 46,645
Separations not within state of residence (%) 1 2 2 <1 1 <1 17 1 1
Proportion of separations public patients (%) 30 41 19 40 30 27 32 34 31
Separations per 1,000 population 2.8 1.8 1.6 1.2 1.4 2.1 1.0 2.4 2.0
Standardised separation rate ratio 1.4 0.9 0.8 0.6 0.7 1.0 0.5 1.2
Hip replacement
Separations 11,586 10,102 6,574 4,283 3,460 1,285 802 104 38,196
Separations not within state of residence (%) 2 3 5 <1 4 1 33 6 3
Proportion of separations public patients (%) 36 35 34 39 35 28 39 71 36
Separations per 1,000 population 1.4 1.6 1.4 1.8 1.7 2.0 2.4 0.8 1.5
Standardised separation rate ratio 0.9 1.1 0.9 1.2 1.1 1.3 1.6 0.5
Hysterectomy, females aged 15–69(b)
Separations 7,780 6,231 6,029 2,943 2,131 674 443 175 26,406
Separations not within state of residence (%) 2 2 4 <1 3 <1 21 3 3
Proportion of separations public patients (%) 42 46 36 35 47 43 36 47 41
Separations per 1,000 population(b) 2.1 2.2 2.6 2.7 2.5 2.6 2.4 1.6 2.3
Standardised separation rate ratio 0.9 0.9 1.1 1.2 1.1 1.1 1.0 0.7
(continued)
Australian hospital statistics 2012–13 37
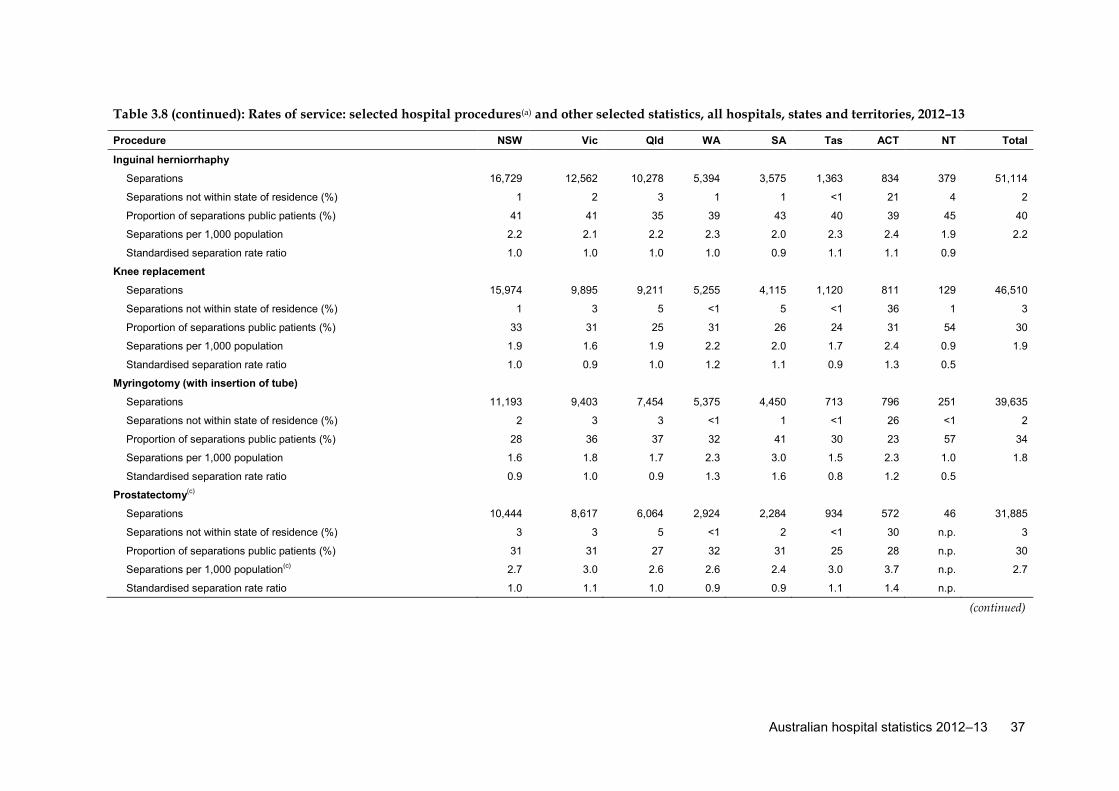
Table 3.8 (continued): Rates of service: selected hospital procedures(a) and other selected statistics, all hospitals, states and territories, 2012–13
Procedure NSW Vic Qld WA SA Tas ACT NT Total
Inguinal herniorrhaphy
Separations 16,729 12,562 10,278 5,394 3,575 1,363 834 379 51,114
Separations not within state of residence (%) 1 2 3 1 1 <1 21 4 2
Proportion of separations public patients (%) 41 41 35 39 43 40 39 45 40
Separations per 1,000 population 2.2 2.1 2.2 2.3 2.0 2.3 2.4 1.9 2.2
Standardised separation rate ratio 1.0 1.0 1.0 1.0 0.9 1.1 1.1 0.9
Knee replacement
Separations 15,974 9,895 9,211 5,255 4,115 1,120 811 129 46,510
Separations not within state of residence (%) 1 3 5 <1 5 <1 36 1 3
Proportion of separations public patients (%) 33 31 25 31 26 24 31 54 30
Separations per 1,000 population 1.9 1.6 1.9 2.2 2.0 1.7 2.4 0.9 1.9
Standardised separation rate ratio 1.0 0.9 1.0 1.2 1.1 0.9 1.3 0.5
Myringotomy (with insertion of tube)
Separations 11,193 9,403 7,454 5,375 4,450 713 796 251 39,635
Separations not within state of residence (%) 2 3 3 <1 1 <1 26 <1 2
Proportion of separations public patients (%) 28 36 37 32 41 30 23 57 34
Separations per 1,000 population 1.6 1.8 1.7 2.3 3.0 1.5 2.3 1.0 1.8
Standardised separation rate ratio 0.9 1.0 0.9 1.3 1.6 0.8 1.2 0.5
Prostatectomy(c)
Separations 10,444 8,617 6,064 2,924 2,284 934 572 46 31,885
Separations not within state of residence (%) 3 3 5 <1 2 <1 30 n.p. 3
Proportion of separations public patients (%) 31 31 27 32 31 25 28 n.p. 30
Separations per 1,000 population(c) 2.7 3.0 2.6 2.6 2.4 3.0 3.7 n.p. 2.7
Standardised separation rate ratio 1.0 1.1 1.0 0.9 0.9 1.1 1.4 n.p.
(continued)
38 Australian hospital statistics 2012–13
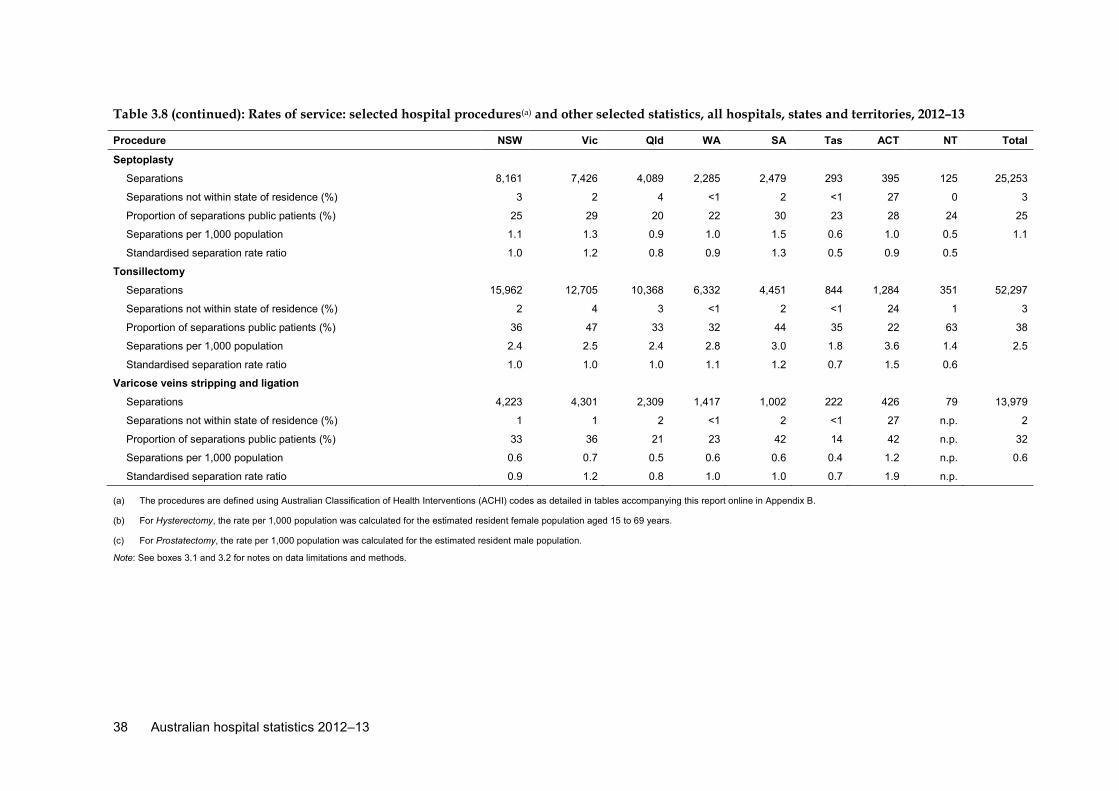
Table 3.8 (continued): Rates of service: selected hospital procedures(a) and other selected statistics, all hospitals, states and territories, 2012–13
Procedure NSW Vic Qld WA SA Tas ACT NT Total
Septoplasty
Separations 8,161 7,426 4,089 2,285 2,479 293 395 125 25,253
Separations not within state of residence (%) 3 2 4 <1 2 <1 27 0 3
Proportion of separations public patients (%) 25 29 20 22 30 23 28 24 25
Separations per 1,000 population 1.1 1.3 0.9 1.0 1.5 0.6 1.0 0.5 1.1
Standardised separation rate ratio 1.0 1.2 0.8 0.9 1.3 0.5 0.9 0.5
Tonsillectomy
Separations 15,962 12,705 10,368 6,332 4,451 844 1,284 351 52,297
Separations not within state of residence (%) 2 4 3 <1 2 <1 24 1 3
Proportion of separations public patients (%) 36 47 33 32 44 35 22 63 38
Separations per 1,000 population 2.4 2.5 2.4 2.8 3.0 1.8 3.6 1.4 2.5
Standardised separation rate ratio 1.0 1.0 1.0 1.1 1.2 0.7 1.5 0.6
Varicose veins stripping and ligation
Separations 4,223 4,301 2,309 1,417 1,002 222 426 79 13,979
Separations not within state of residence (%) 1 1 2 <1 2 <1 27 n.p. 2
Proportion of separations public patients (%) 33 36 21 23 42 14 42 n.p. 32
Separations per 1,000 population 0.6 0.7 0.5 0.6 0.6 0.4 1.2 n.p. 0.6
Standardised separation rate ratio 0.9 1.2 0.8 1.0 1.0 0.7 1.9 n.p.
(a) The procedures are defined using Australian Classification of Health Interventions (ACHI) codes as detailed in tables accompanying this report online in Appendix B.
(b) For Hysterectomy, the rate per 1,000 population was calculated for the estimated resident female population aged 15 to 69 years.
(c) For Prostatectomy, the rate per 1,000 population was calculated for the estimated resident male population.
Note: See boxes 3.1 and 3.2 for notes on data limitations and methods.
Australian hospital statistics 2012–13 39
Efficiency and sustainability Achieving desired results with most cost-effective use of resources. Capacity of system to sustain workforce and infrastructure, to innovate and respond to emerging needs.
Performance indicator: cost per casemix-adjusted separation The methodology for the cost per casemix-adjusted separation analysis is being reviewed, taking into consideration developments in costing approaches of other agencies, including the IHPA.
The AIHW aims to publish the results in an addendum to this report in the second half of 2014.
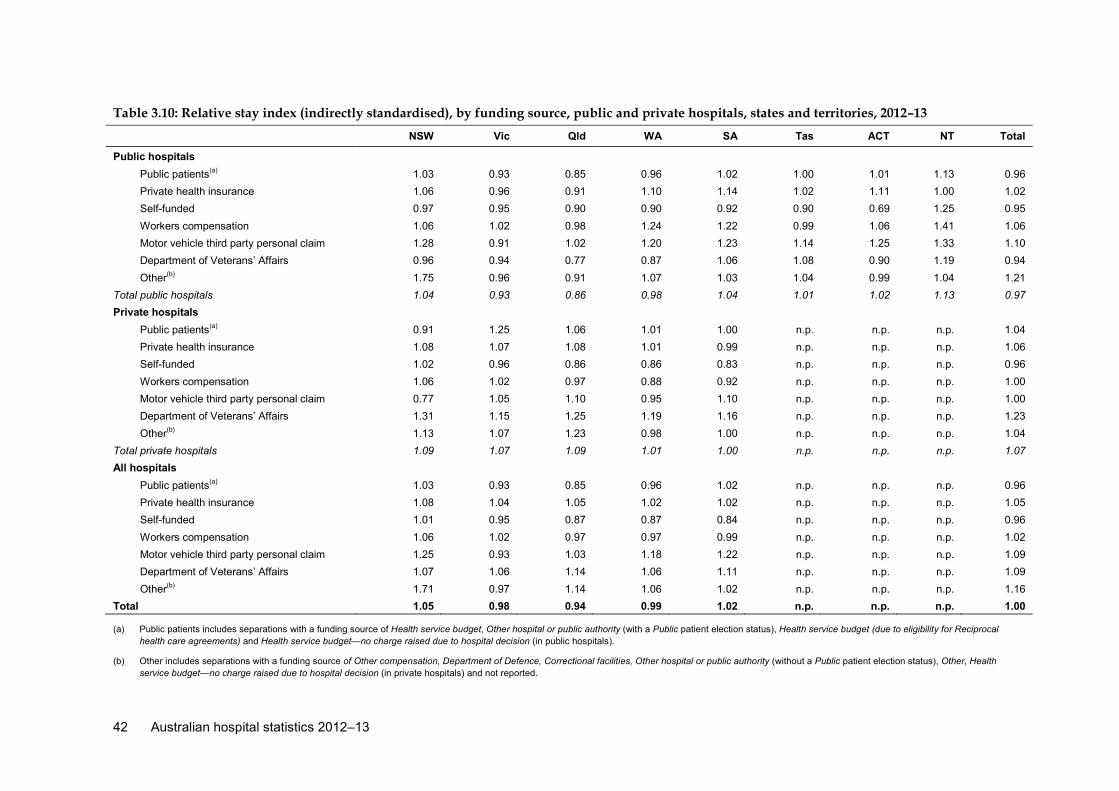
Performance indicator: relative stay index Relative stay indexes (RSIs) are calculated as the observed number of patient days for separations in selected AR-DRGs, divided by the expected number of patient days (based on national figures), standardised for casemix. The adjustment for casemix allows variation in the types of services provided to be taken into account.
An RSI greater than 1 indicates that an average patient’s length of stay is longer than would be expected given the casemix for the category of interest (for example, hospital sector or jurisdiction). An RSI of less than 1 indicates that the length of stay was shorter than would have been expected. More detail on these methods is in Appendix B.
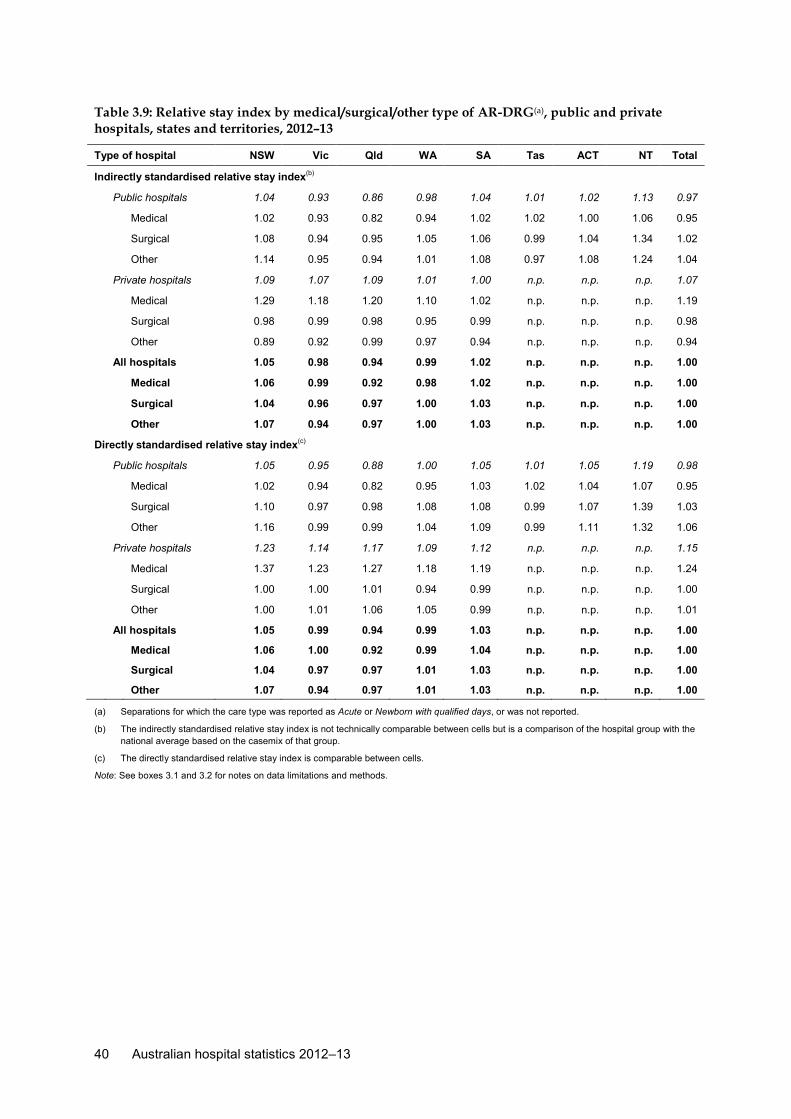
Table 3.9 presents both indirectly and directly standardised RSIs for all hospitals for 2012–13. Additional information on RSI by funding source is included in Table 3.10.
The indirectly standardised RSI is not technically comparable between cells (for example, between hospital groups) but is a comparison of the hospital group with the national average based on the casemix of that group. The directly standardised RSI is re-scaled so that each group represents the national casemix and allows comparison of RSI values across groups of hospitals.
Overall, the directly standardised RSI for private hospitals was 1.15, compared with 0.98 for public hospitals, indicating relatively shorter lengths of stay in the public sector compared with the private sector.
Table 3.9 also presents RSI information for the Medical, Surgical and Other categories of AR-DRGs (DoHA 2010). These figures indicate relatively shorter lengths of stay for Medical separations in public hospitals, and for Surgical and Other separations in private hospitals.
40 Australian hospital statistics 2012–13
Table 3.9: Relative stay index by medical/surgical/other type of AR-DRG(a), public and private hospitals, states and territories, 2012–13
Type of hospital NSW Vic Qld WA SA Tas ACT NT Total
Indirectly standardised relative stay index(b)
Public hospitals 1.04 0.93 0.86 0.98 1.04 1.01 1.02 1.13 0.97
Medical 1.02 0.93 0.82 0.94 1.02 1.02 1.00 1.06 0.95
Surgical 1.08 0.94 0.95 1.05 1.06 0.99 1.04 1.34 1.02
Other 1.14 0.95 0.94 1.01 1.08 0.97 1.08 1.24 1.04
Private hospitals 1.09 1.07 1.09 1.01 1.00 n.p. n.p. n.p. 1.07
Medical 1.29 1.18 1.20 1.10 1.02 n.p. n.p. n.p. 1.19
Surgical 0.98 0.99 0.98 0.95 0.99 n.p. n.p. n.p. 0.98
Other 0.89 0.92 0.99 0.97 0.94 n.p. n.p. n.p. 0.94
All hospitals 1.05 0.98 0.94 0.99 1.02 n.p. n.p. n.p. 1.00
Medical 1.06 0.99 0.92 0.98 1.02 n.p. n.p. n.p. 1.00
Surgical 1.04 0.96 0.97 1.00 1.03 n.p. n.p. n.p. 1.00
Other 1.07 0.94 0.97 1.00 1.03 n.p. n.p. n.p. 1.00
Directly standardised relative stay index(c) Public hospitals 1.05 0.95 0.88 1.00 1.05 1.01 1.05 1.19 0.98
Medical 1.02 0.94 0.82 0.95 1.03 1.02 1.04 1.07 0.95
Surgical 1.10 0.97 0.98 1.08 1.08 0.99 1.07 1.39 1.03
Other 1.16 0.99 0.99 1.04 1.09 0.99 1.11 1.32 1.06
Private hospitals 1.23 1.14 1.17 1.09 1.12 n.p. n.p. n.p. 1.15
Medical 1.37 1.23 1.27 1.18 1.19 n.p. n.p. n.p. 1.24
Surgical 1.00 1.00 1.01 0.94 0.99 n.p. n.p. n.p. 1.00
Other 1.00 1.01 1.06 1.05 0.99 n.p. n.p. n.p. 1.01
All hospitals 1.05 0.99 0.94 0.99 1.03 n.p. n.p. n.p. 1.00
Medical 1.06 1.00 0.92 0.99 1.04 n.p. n.p. n.p. 1.00
Surgical 1.04 0.97 0.97 1.01 1.03 n.p. n.p. n.p. 1.00
Other 1.07 0.94 0.97 1.01 1.03 n.p. n.p. n.p. 1.00
(a) Separations for which the care type was reported as Acute or Newborn with qualified days, or was not reported.
(b) The indirectly standardised relative stay index is not technically comparable between cells but is a comparison of the hospital group with the national average based on the casemix of that group.
(c) The directly standardised relative stay index is comparable between cells.
Note: See boxes 3.1 and 3.2 for notes on data limitations and methods.
Australian hospital statistics 2012–13 41
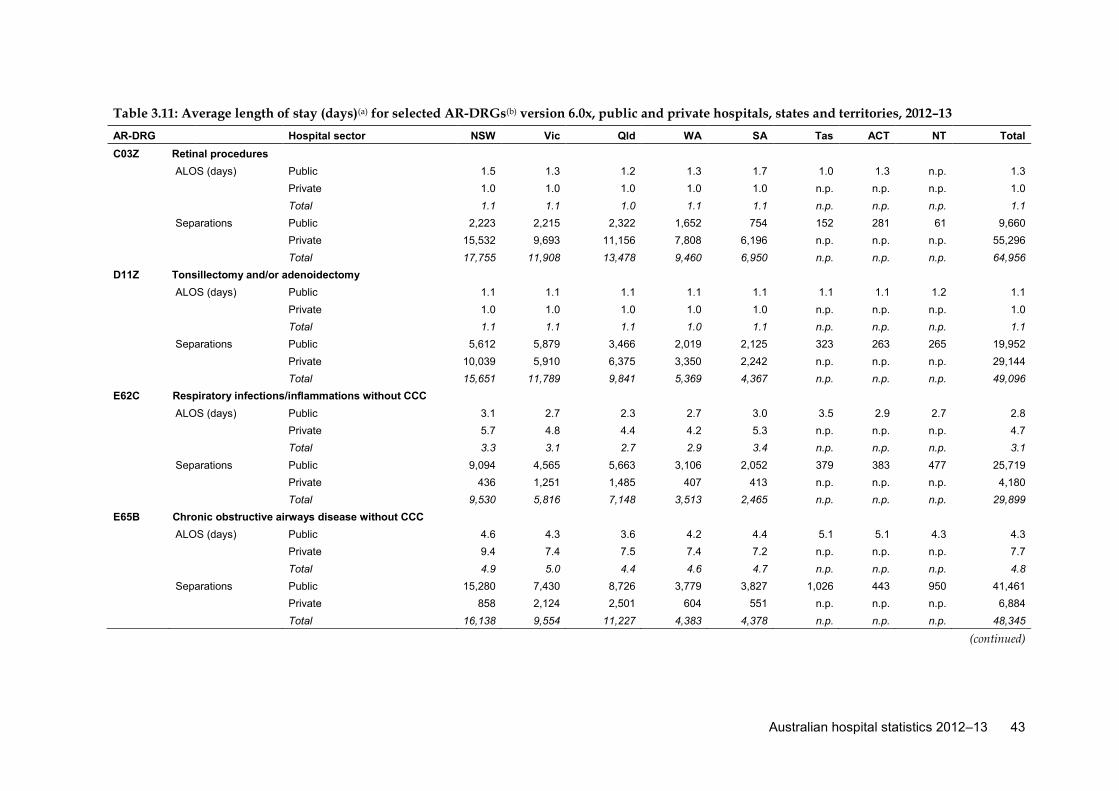
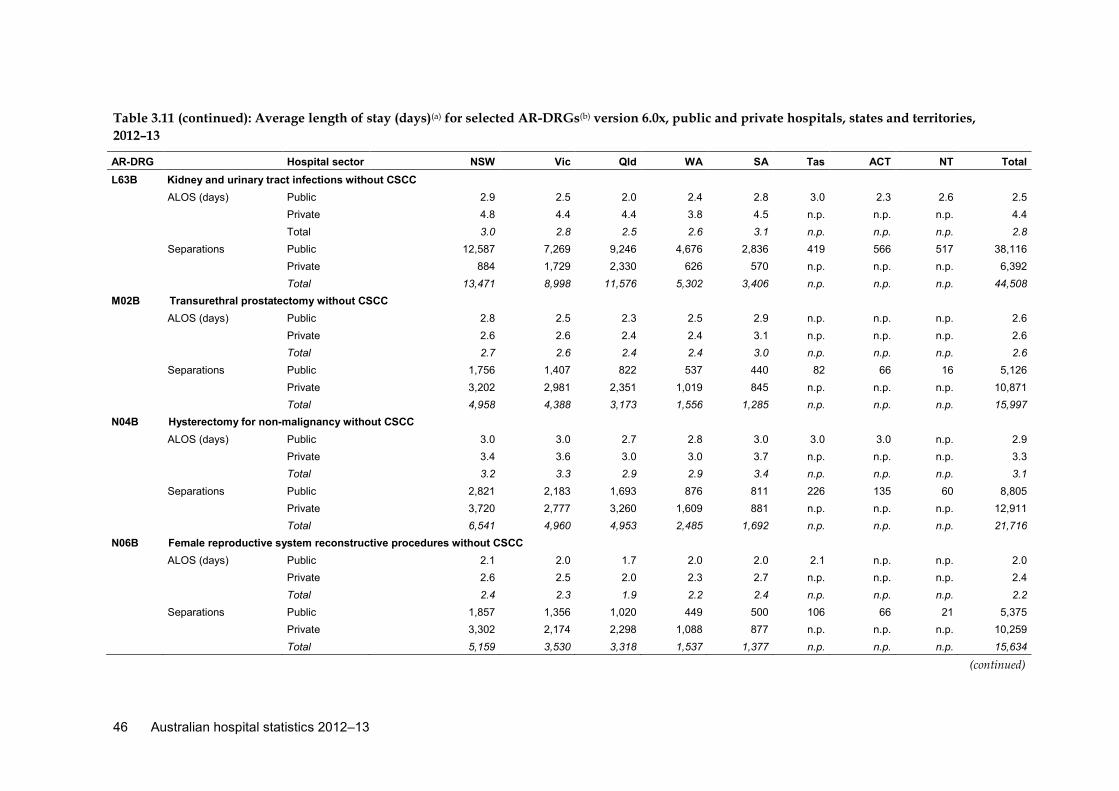
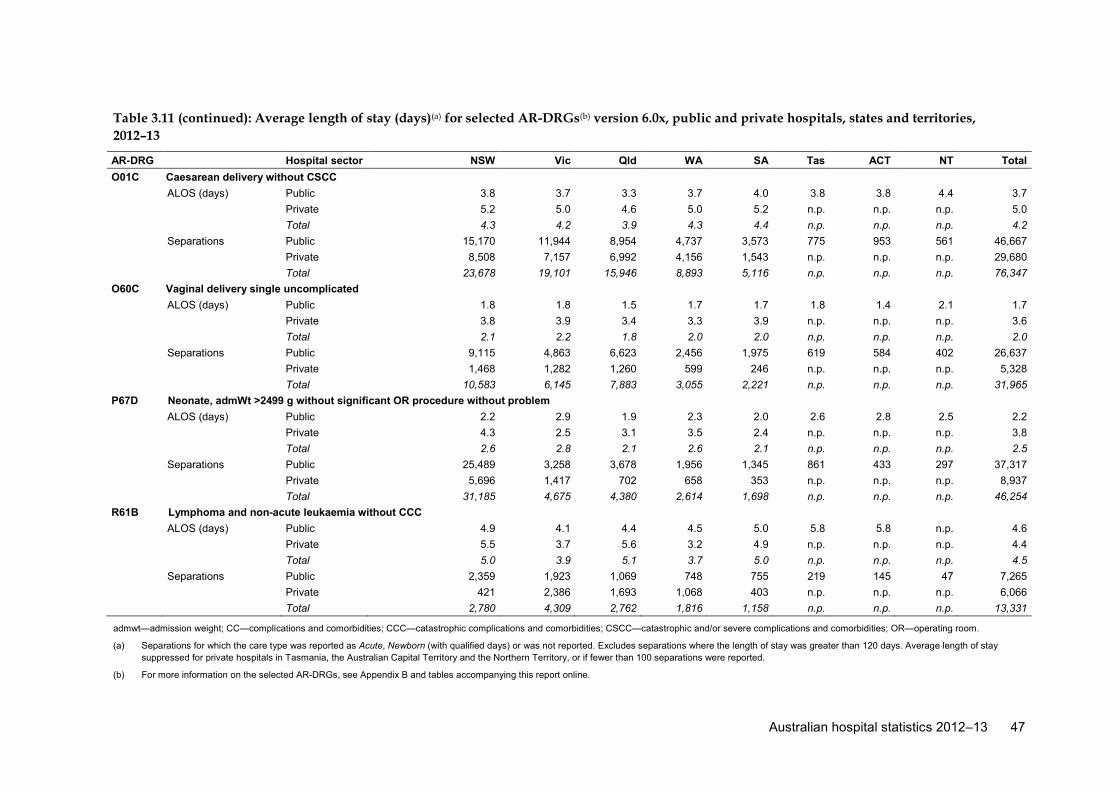
Performance indicator: average lengths of stay for selected AR-DRGs The selected AR-DRGs (Table 3.11) were chosen on the basis of:
• homogeneity, where variation is more likely to be attributable to the hospital’s performance rather than variations in the patients themselves
• representativeness across clinical groups (Major Diagnostic Categories [MDCs]) and surgical and medical AR-DRGs
• differences between jurisdictions and/or sectors • policy interest as evidenced by:
– inclusion of similar groups in other tables in Australian hospital statistics, such as indicator procedures for elective surgery waiting times
– high volume and/or cost – changes in volume over years.
Due to changes in the classification between AR-DRG version 5.2, AR-DRG version 6.0 and AR-DRG version 6.0x, the data presented here are not comparable with the data presented in previous reports.
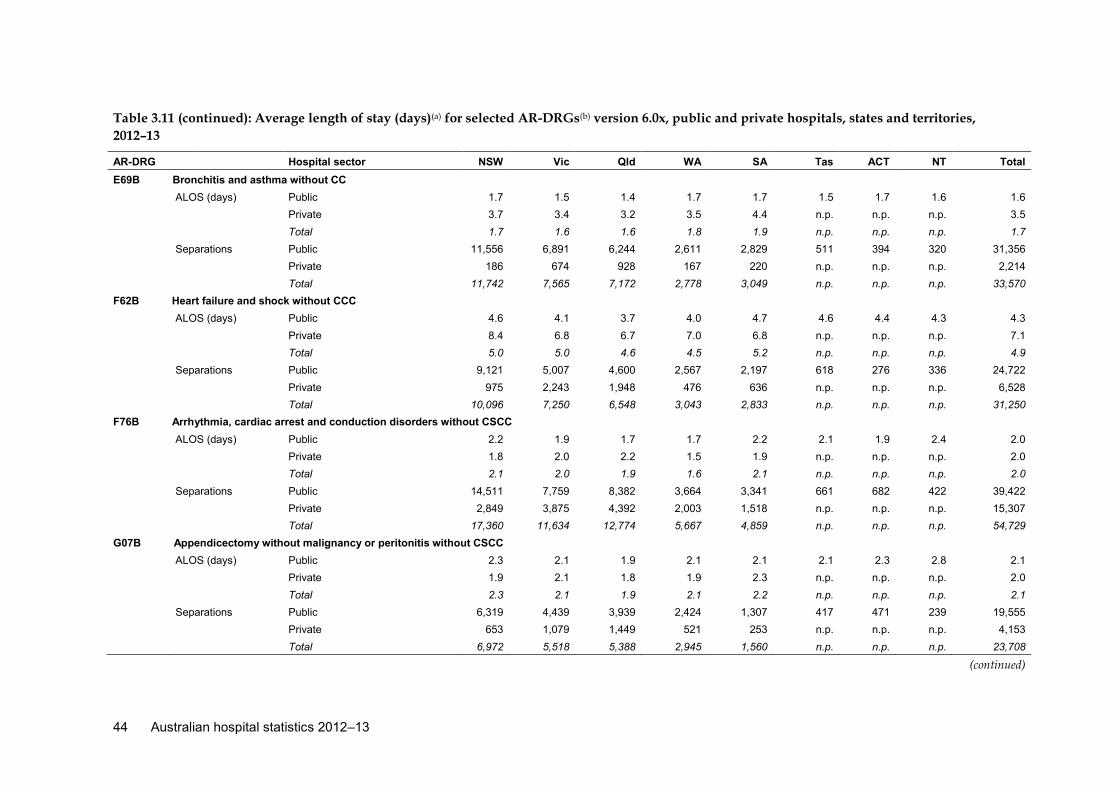
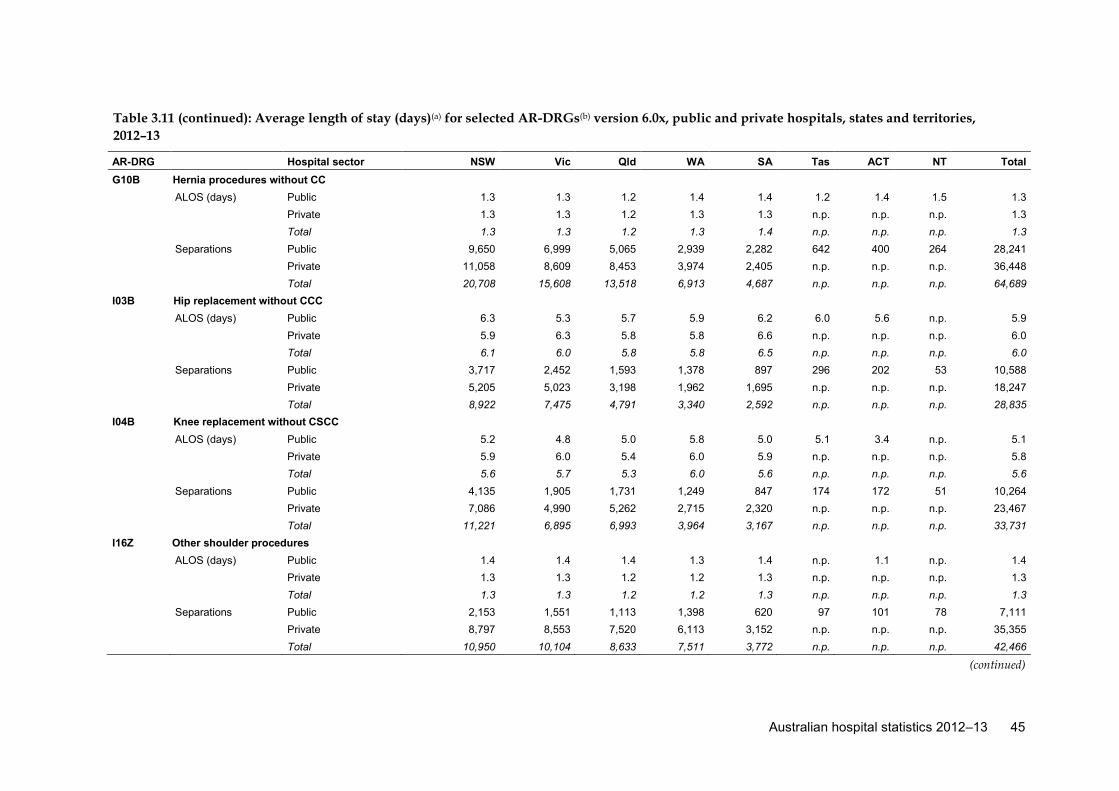
There were notable differences (more than 1 day) in the ALOS between public and private hospitals for 8 of the 20 selected AR-DRGs. For example, the ALOS for E65B Chronic obstructive airways disease without catastrophic complications or comorbidities was 4.3 days for public hospitals and 7.7 days for private hospitals.
There were some notable differences in ALOS between states and territories. For example, for F62B Heart failure and shock without catastrophic complications or comorbidities, the ALOS in public hospitals ranged from 3.7 days in Queensland to 4.7 days in South Australia (Table 3.11). For private hospitals, the ALOS for F62B ranged from 6.7 days in Queensland to 8.4 days in New South Wales.
Additional material An additional table accompanies this report online:
Table S3.1: Separations per 1,000 population for selected procedures, all hospitals, states and territories, 2012–13.
42 Australian hospital statistics 2012–13
Table 3.10: Relative stay index (indirectly standardised), by funding source, public and private hospitals, states and territories, 2012–13
NSW Vic Qld WA SA Tas ACT NT Total
Public hospitals Public patients(a) 1.03 0.93 0.85 0.96 1.02 1.00 1.01 1.13 0.96 Private health insurance 1.06 0.96 0.91 1.10 1.14 1.02 1.11 1.00 1.02 Self-funded 0.97 0.95 0.90 0.90 0.92 0.90 0.69 1.25 0.95 Workers compensation 1.06 1.02 0.98 1.24 1.22 0.99 1.06 1.41 1.06 Motor vehicle third party personal claim 1.28 0.91 1.02 1.20 1.23 1.14 1.25 1.33 1.10 Department of Veterans’ Affairs 0.96 0.94 0.77 0.87 1.06 1.08 0.90 1.19 0.94 Other(b) 1.75 0.96 0.91 1.07 1.03 1.04 0.99 1.04 1.21 Total public hospitals 1.04 0.93 0.86 0.98 1.04 1.01 1.02 1.13 0.97 Private hospitals Public patients(a) 0.91 1.25 1.06 1.01 1.00 n.p. n.p. n.p. 1.04 Private health insurance 1.08 1.07 1.08 1.01 0.99 n.p. n.p. n.p. 1.06 Self-funded 1.02 0.96 0.86 0.86 0.83 n.p. n.p. n.p. 0.96 Workers compensation 1.06 1.02 0.97 0.88 0.92 n.p. n.p. n.p. 1.00 Motor vehicle third party personal claim 0.77 1.05 1.10 0.95 1.10 n.p. n.p. n.p. 1.00 Department of Veterans’ Affairs 1.31 1.15 1.25 1.19 1.16 n.p. n.p. n.p. 1.23 Other(b) 1.13 1.07 1.23 0.98 1.00 n.p. n.p. n.p. 1.04 Total private hospitals 1.09 1.07 1.09 1.01 1.00 n.p. n.p. n.p. 1.07 All hospitals Public patients(a) 1.03 0.93 0.85 0.96 1.02 n.p. n.p. n.p. 0.96 Private health insurance 1.08 1.04 1.05 1.02 1.02 n.p. n.p. n.p. 1.05 Self-funded 1.01 0.95 0.87 0.87 0.84 n.p. n.p. n.p. 0.96 Workers compensation 1.06 1.02 0.97 0.97 0.99 n.p. n.p. n.p. 1.02 Motor vehicle third party personal claim 1.25 0.93 1.03 1.18 1.22 n.p. n.p. n.p. 1.09 Department of Veterans’ Affairs 1.07 1.06 1.14 1.06 1.11 n.p. n.p. n.p. 1.09 Other(b) 1.71 0.97 1.14 1.06 1.02 n.p. n.p. n.p. 1.16 Total 1.05 0.98 0.94 0.99 1.02 n.p. n.p. n.p. 1.00
(a) Public patients includes separations with a funding source of Health service budget, Other hospital or public authority (with a Public patient election status), Health service budget (due to eligibility for Reciprocal health care agreements) and Health service budget—no charge raised due to hospital decision (in public hospitals).
(b) Other includes separations with a funding source of Other compensation, Department of Defence, Correctional facilities, Other hospital or public authority (without a Public patient election status), Other, Health service budget—no charge raised due to hospital decision (in private hospitals) and not reported.
Australian hospital statistics 2012–13 43
Table 3.11: Average length of stay (days)(a) for selected AR-DRGs(b) version 6.0x, public and private hospitals, states and territories, 2012–13 AR-DRG Hospital sector NSW Vic Qld WA SA Tas ACT NT Total C03Z Retinal procedures ALOS (days) Public 1.5 1.3 1.2 1.3 1.7 1.0 1.3 n.p. 1.3 Private 1.0 1.0 1.0 1.0 1.0 n.p. n.p. n.p. 1.0 Total 1.1 1.1 1.0 1.1 1.1 n.p. n.p. n.p. 1.1 Separations Public 2,223 2,215 2,322 1,652 754 152 281 61 9,660 Private 15,532 9,693 11,156 7,808 6,196 n.p. n.p. n.p. 55,296 Total 17,755 11,908 13,478 9,460 6,950 n.p. n.p. n.p. 64,956 D11Z Tonsillectomy and/or adenoidectomy ALOS (days) Public 1.1 1.1 1.1 1.1 1.1 1.1 1.1 1.2 1.1 Private 1.0 1.0 1.0 1.0 1.0 n.p. n.p. n.p. 1.0 Total 1.1 1.1 1.1 1.0 1.1 n.p. n.p. n.p. 1.1 Separations Public 5,612 5,879 3,466 2,019 2,125 323 263 265 19,952 Private 10,039 5,910 6,375 3,350 2,242 n.p. n.p. n.p. 29,144 Total 15,651 11,789 9,841 5,369 4,367 n.p. n.p. n.p. 49,096 E62C Respiratory infections/inflammations without CCC ALOS (days) Public 3.1 2.7 2.3 2.7 3.0 3.5 2.9 2.7 2.8 Private 5.7 4.8 4.4 4.2 5.3 n.p. n.p. n.p. 4.7 Total 3.3 3.1 2.7 2.9 3.4 n.p. n.p. n.p. 3.1 Separations Public 9,094 4,565 5,663 3,106 2,052 379 383 477 25,719 Private 436 1,251 1,485 407 413 n.p. n.p. n.p. 4,180 Total 9,530 5,816 7,148 3,513 2,465 n.p. n.p. n.p. 29,899 E65B Chronic obstructive airways disease without CCC ALOS (days) Public 4.6 4.3 3.6 4.2 4.4 5.1 5.1 4.3 4.3 Private 9.4 7.4 7.5 7.4 7.2 n.p. n.p. n.p. 7.7 Total 4.9 5.0 4.4 4.6 4.7 n.p. n.p. n.p. 4.8 Separations Public 15,280 7,430 8,726 3,779 3,827 1,026 443 950 41,461 Private 858 2,124 2,501 604 551 n.p. n.p. n.p. 6,884 Total 16,138 9,554 11,227 4,383 4,378 n.p. n.p. n.p. 48,345
(continued)
44 Australian hospital statistics 2012–13
Table 3.11 (continued): Average length of stay (days)(a) for selected AR-DRGs(b) version 6.0x, public and private hospitals, states and territories, 2012–13
AR-DRG Hospital sector NSW Vic Qld WA SA Tas ACT NT Total E69B Bronchitis and asthma without CC ALOS (days) Public 1.7 1.5 1.4 1.7 1.7 1.5 1.7 1.6 1.6 Private 3.7 3.4 3.2 3.5 4.4 n.p. n.p. n.p. 3.5 Total 1.7 1.6 1.6 1.8 1.9 n.p. n.p. n.p. 1.7 Separations Public 11,556 6,891 6,244 2,611 2,829 511 394 320 31,356 Private 186 674 928 167 220 n.p. n.p. n.p. 2,214 Total 11,742 7,565 7,172 2,778 3,049 n.p. n.p. n.p. 33,570 F62B Heart failure and shock without CCC ALOS (days) Public 4.6 4.1 3.7 4.0 4.7 4.6 4.4 4.3 4.3 Private 8.4 6.8 6.7 7.0 6.8 n.p. n.p. n.p. 7.1 Total 5.0 5.0 4.6 4.5 5.2 n.p. n.p. n.p. 4.9 Separations Public 9,121 5,007 4,600 2,567 2,197 618 276 336 24,722 Private 975 2,243 1,948 476 636 n.p. n.p. n.p. 6,528 Total 10,096 7,250 6,548 3,043 2,833 n.p. n.p. n.p. 31,250 F76B Arrhythmia, cardiac arrest and conduction disorders without CSCC ALOS (days) Public 2.2 1.9 1.7 1.7 2.2 2.1 1.9 2.4 2.0 Private 1.8 2.0 2.2 1.5 1.9 n.p. n.p. n.p. 2.0 Total 2.1 2.0 1.9 1.6 2.1 n.p. n.p. n.p. 2.0 Separations Public 14,511 7,759 8,382 3,664 3,341 661 682 422 39,422 Private 2,849 3,875 4,392 2,003 1,518 n.p. n.p. n.p. 15,307 Total 17,360 11,634 12,774 5,667 4,859 n.p. n.p. n.p. 54,729 G07B Appendicectomy without malignancy or peritonitis without CSCC ALOS (days) Public 2.3 2.1 1.9 2.1 2.1 2.1 2.3 2.8 2.1 Private 1.9 2.1 1.8 1.9 2.3 n.p. n.p. n.p. 2.0 Total 2.3 2.1 1.9 2.1 2.2 n.p. n.p. n.p. 2.1 Separations Public 6,319 4,439 3,939 2,424 1,307 417 471 239 19,555 Private 653 1,079 1,449 521 253 n.p. n.p. n.p. 4,153 Total 6,972 5,518 5,388 2,945 1,560 n.p. n.p. n.p. 23,708
(continued)
Australian hospital statistics 2012–13 45
Table 3.11 (continued): Average length of stay (days)(a) for selected AR-DRGs(b) version 6.0x, public and private hospitals, states and territories, 2012–13
AR-DRG Hospital sector NSW Vic Qld WA SA Tas ACT NT Total G10B Hernia procedures without CC
ALOS (days) Public 1.3 1.3 1.2 1.4 1.4 1.2 1.4 1.5 1.3 Private 1.3 1.3 1.2 1.3 1.3 n.p. n.p. n.p. 1.3 Total 1.3 1.3 1.2 1.3 1.4 n.p. n.p. n.p. 1.3 Separations Public 9,650 6,999 5,065 2,939 2,282 642 400 264 28,241 Private 11,058 8,609 8,453 3,974 2,405 n.p. n.p. n.p. 36,448 Total 20,708 15,608 13,518 6,913 4,687 n.p. n.p. n.p. 64,689
I03B Hip replacement without CCC ALOS (days) Public 6.3 5.3 5.7 5.9 6.2 6.0 5.6 n.p. 5.9 Private 5.9 6.3 5.8 5.8 6.6 n.p. n.p. n.p. 6.0 Total 6.1 6.0 5.8 5.8 6.5 n.p. n.p. n.p. 6.0 Separations Public 3,717 2,452 1,593 1,378 897 296 202 53 10,588 Private 5,205 5,023 3,198 1,962 1,695 n.p. n.p. n.p. 18,247 Total 8,922 7,475 4,791 3,340 2,592 n.p. n.p. n.p. 28,835
I04B Knee replacement without CSCC ALOS (days) Public 5.2 4.8 5.0 5.8 5.0 5.1 3.4 n.p. 5.1 Private 5.9 6.0 5.4 6.0 5.9 n.p. n.p. n.p. 5.8 Total 5.6 5.7 5.3 6.0 5.6 n.p. n.p. n.p. 5.6 Separations Public 4,135 1,905 1,731 1,249 847 174 172 51 10,264 Private 7,086 4,990 5,262 2,715 2,320 n.p. n.p. n.p. 23,467 Total 11,221 6,895 6,993 3,964 3,167 n.p. n.p. n.p. 33,731
I16Z Other shoulder procedures ALOS (days) Public 1.4 1.4 1.4 1.3 1.4 n.p. 1.1 n.p. 1.4 Private 1.3 1.3 1.2 1.2 1.3 n.p. n.p. n.p. 1.3 Total 1.3 1.3 1.2 1.2 1.3 n.p. n.p. n.p. 1.3 Separations Public 2,153 1,551 1,113 1,398 620 97 101 78 7,111 Private 8,797 8,553 7,520 6,113 3,152 n.p. n.p. n.p. 35,355 Total 10,950 10,104 8,633 7,511 3,772 n.p. n.p. n.p. 42,466
(continued)
46 Australian hospital statistics 2012–13
Table 3.11 (continued): Average length of stay (days)(a) for selected AR-DRGs(b) version 6.0x, public and private hospitals, states and territories, 2012–13
AR-DRG Hospital sector NSW Vic Qld WA SA Tas ACT NT Total L63B Kidney and urinary tract infections without CSCC
ALOS (days) Public 2.9 2.5 2.0 2.4 2.8 3.0 2.3 2.6 2.5 Private 4.8 4.4 4.4 3.8 4.5 n.p. n.p. n.p. 4.4 Total 3.0 2.8 2.5 2.6 3.1 n.p. n.p. n.p. 2.8 Separations Public 12,587 7,269 9,246 4,676 2,836 419 566 517 38,116 Private 884 1,729 2,330 626 570 n.p. n.p. n.p. 6,392 Total 13,471 8,998 11,576 5,302 3,406 n.p. n.p. n.p. 44,508
M02B Transurethral prostatectomy without CSCC ALOS (days) Public 2.8 2.5 2.3 2.5 2.9 n.p. n.p. n.p. 2.6 Private 2.6 2.6 2.4 2.4 3.1 n.p. n.p. n.p. 2.6 Total 2.7 2.6 2.4 2.4 3.0 n.p. n.p. n.p. 2.6 Separations Public 1,756 1,407 822 537 440 82 66 16 5,126 Private 3,202 2,981 2,351 1,019 845 n.p. n.p. n.p. 10,871 Total 4,958 4,388 3,173 1,556 1,285 n.p. n.p. n.p. 15,997
N04B Hysterectomy for non-malignancy without CSCC ALOS (days) Public 3.0 3.0 2.7 2.8 3.0 3.0 3.0 n.p. 2.9 Private 3.4 3.6 3.0 3.0 3.7 n.p. n.p. n.p. 3.3 Total 3.2 3.3 2.9 2.9 3.4 n.p. n.p. n.p. 3.1 Separations Public 2,821 2,183 1,693 876 811 226 135 60 8,805 Private 3,720 2,777 3,260 1,609 881 n.p. n.p. n.p. 12,911 Total 6,541 4,960 4,953 2,485 1,692 n.p. n.p. n.p. 21,716
N06B Female reproductive system reconstructive procedures without CSCC ALOS (days) Public 2.1 2.0 1.7 2.0 2.0 2.1 n.p. n.p. 2.0 Private 2.6 2.5 2.0 2.3 2.7 n.p. n.p. n.p. 2.4 Total 2.4 2.3 1.9 2.2 2.4 n.p. n.p. n.p. 2.2 Separations Public 1,857 1,356 1,020 449 500 106 66 21 5,375 Private 3,302 2,174 2,298 1,088 877 n.p. n.p. n.p. 10,259 Total 5,159 3,530 3,318 1,537 1,377 n.p. n.p. n.p. 15,634
(continued)
Australian hospital statistics 2012–13 47
Table 3.11 (continued): Average length of stay (days)(a) for selected AR-DRGs(b) version 6.0x, public and private hospitals, states and territories, 2012–13
AR-DRG Hospital sector NSW Vic Qld WA SA Tas ACT NT Total O01C Caesarean delivery without CSCC
ALOS (days) Public 3.8 3.7 3.3 3.7 4.0 3.8 3.8 4.4 3.7 Private 5.2 5.0 4.6 5.0 5.2 n.p. n.p. n.p. 5.0 Total 4.3 4.2 3.9 4.3 4.4 n.p. n.p. n.p. 4.2 Separations Public 15,170 11,944 8,954 4,737 3,573 775 953 561 46,667 Private 8,508 7,157 6,992 4,156 1,543 n.p. n.p. n.p. 29,680 Total 23,678 19,101 15,946 8,893 5,116 n.p. n.p. n.p. 76,347
O60C Vaginal delivery single uncomplicated ALOS (days) Public 1.8 1.8 1.5 1.7 1.7 1.8 1.4 2.1 1.7 Private 3.8 3.9 3.4 3.3 3.9 n.p. n.p. n.p. 3.6 Total 2.1 2.2 1.8 2.0 2.0 n.p. n.p. n.p. 2.0 Separations Public 9,115 4,863 6,623 2,456 1,975 619 584 402 26,637 Private 1,468 1,282 1,260 599 246 n.p. n.p. n.p. 5,328 Total 10,583 6,145 7,883 3,055 2,221 n.p. n.p. n.p. 31,965
P67D Neonate, admWt >2499 g without significant OR procedure without problem ALOS (days) Public 2.2 2.9 1.9 2.3 2.0 2.6 2.8 2.5 2.2 Private 4.3 2.5 3.1 3.5 2.4 n.p. n.p. n.p. 3.8 Total 2.6 2.8 2.1 2.6 2.1 n.p. n.p. n.p. 2.5 Separations Public 25,489 3,258 3,678 1,956 1,345 861 433 297 37,317 Private 5,696 1,417 702 658 353 n.p. n.p. n.p. 8,937 Total 31,185 4,675 4,380 2,614 1,698 n.p. n.p. n.p. 46,254
R61B Lymphoma and non-acute leukaemia without CCC ALOS (days) Public 4.9 4.1 4.4 4.5 5.0 5.8 5.8 n.p. 4.6 Private 5.5 3.7 5.6 3.2 4.9 n.p. n.p. n.p. 4.4 Total 5.0 3.9 5.1 3.7 5.0 n.p. n.p. n.p. 4.5 Separations Public 2,359 1,923 1,069 748 755 219 145 47 7,265 Private 421 2,386 1,693 1,068 403 n.p. n.p. n.p. 6,066 Total 2,780 4,309 2,762 1,816 1,158 n.p. n.p. n.p. 13,331
admwt—admission weight; CC—complications and comorbidities; CCC—catastrophic complications and comorbidities; CSCC—catastrophic and/or severe complications and comorbidities; OR—operating room.
(a) Separations for which the care type was reported as Acute, Newborn (with qualified days) or was not reported. Excludes separations where the length of stay was greater than 120 days. Average length of stay suppressed for private hospitals in Tasmania, the Australian Capital Territory and the Northern Territory, or if fewer than 100 separations were reported.
(b) For more information on the selected AR-DRGs, see Appendix B and tables accompanying this report online.