september key performance indicators reporting system...
TRANSCRIPT

September
2012
September
Key Performance Indicators
Reporting System
Accountability / Outcomes
Key Performance Indicators
System (KPIRS) Manual
Accountability / Outcomes Reporting Branch

i
The current version of this document is available on the Alberta Enterprise and Advanced Education
website at http://eae.alberta.ca/software/ and on the Campus Alberta Planning System (CAPS) website
(https://portal.aet.gov.ab.ca/apps/caps). It will be updated as necessary and institutions’ KPIRS contacts
will be advised when a new version has been posted to the site.
If you are a new user to CAPS, a new account can be created through SIAMS by clicking the ‘Are you a
new user?’ link.
Alternatively, specific instructions on downloading the manual, including the location of the
department’s FTP site, are provided to each institution’s KPIRS contact.
Reporting Software
This manual should be used in conjunction with the KPIRS reporting software. For the 2009-10 data
collection cycle, all institutions should be using version 2009-10a or later.
Printing History
The development of Key Performance Indicators (KPIs) and the implementation of data reporting
processes involved all sectors of the post-secondary system.
KPIRS Manuals
User Guide
Reporting Manual
Prepared for
Comprehensive Academic & Research Institutions
Specialized Arts & Culture Institutions
Baccalaureate and Applied Studies Institutions
Polytechnical Institutions
Comprehensive Community Institutions,
Independent Academic Institutions
and
Alberta Enterprise and Advanced Education
Post-secondary and Community Education Division

ii
Document Change Summary:
Date Changes
September 2012 Ministry Name Change

iii
Contents
1. KPIRS: An Overview of the Reporting Structure ............................................................. 2
Reporting Structure .................................................................................................................... 2
Table 1: Credential Codes for Program Identification in PRS .............................................. 3
Subject Areas: Classification of Instructional Programs (CIP) 2000 ..................................... 4
Program Codes (2 digit) and Titles ............................................................................................ 4
CIP 2000 Codes that are Preparatory & Basic Upgrading (PBU) Program Specific ........... 6
2. Indicators for which Data Entry is required by all Post-secondary Institutions ............ 7
Operations Costs per FLE .......................................................................................................... 7
Reconciliation to FIRS and the Audited Financial Statements ............................................... 8
Specifications & Protocols .......................................................................................................... 8
Costing procedures for: Comprehensive Community Colleges, Baccalaureate & Applied
Studies Institutions, Specialized Arts & Culture Institutions and Polytechnical Institutions
....................................................................................................................................................... 9
Costing procedures for Comprehensive Academic & Research Institutions ....................... 12
Costing procedures for Independent Academic Institutions ................................................. 14
Course Completion – Athabasca University and PBU Programs ......................................... 17
Preparatory & Basic Upgrading (PBU) Programs................................................................. 19
Access Indicator – Non-Credit Course Registration .............................................................. 22
Access Indicator – Non-Credit Unduplicated Headcount ..................................................... 23
Non-Credit Course Definitions ................................................................................................. 25
Possible Subject Area/ Classification Code Combinations .................................................... 25
Templates for Access Non-credit Course Registrations and Unduplicated Headcount...... 31
Research Publications and Other Creative Works - Athabasca University, and Other
Institutions .................................................................................................................................. 32
3. Indicators for which Data Entry is not required by Post-Secondary Institutions......... 34
Graduate Outcomes Survey ..................................................................................................... 34
Graduate Satisfaction Template .................................................................................... 36
Graduate Employment Template .................................................................................. 38
University Transfer Program Leavers by Alberta Student Number.................................... 42
Transfer to Degree - Granting Institutions Outside Alberta ................................................. 44
Access Indicator - Credit Programs ........................................................................................ 46
Time to Completion ................................................................................................................... 50
Revenue - Related Indicators ................................................................................................... 52
Revenue - Related Indicators ................................................................................................... 52
Expense - Related Indicators .................................................................................................... 53

iv
4. Research Indicators for Comprehensive Academic & Research Institutions and
Independent Academic Institutions ............................................................................................. 55
Research - Intensity ................................................................................................................... 55
Research Publications and Other Creative Works - Campus Based Institutions ................. 57
Research - Council Success Rates ............................................................................................ 60
Research - Graduate Students.................................................................................................. 63
Research - Research Impact ..................................................................................................... 67
5. Appendices: .......................................................................................................................... 71
Appendix A: Graduate Outcomes Survey Documents ........................................................... 71 Winter 2010 Graduate Outcome Survey .......................................................................... 91
Appendix B: What’s New for 2010 ......................................................................................... 92
1. Update to CIP Codes ..................................................................................................... 92
2. Data Elements & Reporting systems............................................................................. 92
3. Research Publications and Other Creative Works ........................................................ 92
4. Discontinued KPI Types ................................................................................................. 92
5. PBU Program Specific CIP Codes No Longer In Use ...................................................... 92
Appendix C: Program and Credential Classification Structure prior to 2004-05 .............. 94
KPI Data from LERS and PRS ............................................................................................. 96
Appendix D: Indicators Discontinued .................................................................................... 97 1. Community Service and Economic Impact ................................................................... 97
2. Cost per Graduate (Program Completer) .................................................................... 102
3. Demand and Capacity ................................................................................................. 102
4. Freshman Student Persistence ................................................................................... 104
5. Program Completion – Other Institutions .................................................................. 105
6. Transferability of Courses ........................................................................................... 108
7. University Transfer Program Leavers .......................................................................... 109
8. University Transfer Student Performance .................................................................. 111

KPIRS Reporting Manual August 2012.docx
Page | 1 1
Introduction
This Manual
This manual has been prepared to assist institutions with assembling and submitting Key Performance
Indicator data to system-wide databases. It sets forth guidelines and describes methods and procedures
for reporting data that are submitted to Alberta Enterprise and Advanced Education through the Key
Performance Indicator Reporting System (KPIRS).
System-wide Information Reporting
KPIRS is one of a number of data collection and reporting systems that ensures consistency in reporting,
storing and using data across Alberta’s post-secondary system. Each of these systems includes both
manuals and software. Many terms, definitions and classification structures are common to one or
more of these systems. These are contained in a manual titled System-wide Information Reporting:
Common Terminology, Definitions and Classifications. This manual is available through the
department’s website http:/eae.alberta.ca/software/ and on the Campus Alberta Planning System
(CAPS) website (https://portal.aet.gov.ab.ca/apps/caps).
Although this manual may contain definitions and/or descriptions of some terms, the System-wide
Information Reporting Manual will be maintained as the authoritative source.
KPIRS Software
The Key Performance Indicator system uses data provided by institutions through Program Registry
System (PRS), Learner and Enrolment Reporting System (LERS), Application Submission Initiative (ASI),
and Financial Information Reporting System (FIRS), and additional data entered directly through KPIRS
software, to calculate agreed-upon key performance indicators.
The KPIRS software component is a user-friendly electronic tool that enables institutions to submit data
in a consistent way. It was developed using Microsoft Visual FoxPro and can be used individually, or as
part of a suite with a common launch facility, a number of shared data tables and services, and a
common procedure for creating files to export to the department. These features minimize the
duplication of data entry and eliminate data entry errors at the department. The system-wide
databases that are created enhance the comparability of information between institutions within the
same sector and, to the extent possible, across the various sectors of the post-secondary system.
Audit Implications
It is imperative that revenue and expenditure data submitted through FIRS be reconciled with the
audited financial statements. Department staff carefully checks PRS and LERS data as the enrolment
data are subject to audit by the provincial Auditor General. Key Performance Indicator (KPI) data used in
institutional performance indicator reports, are reviewed by the Auditor General to ensure compliance
with reporting methodologies and protocols through a specified procedures audit. Audit observations
and recommendations are made to the institutions subject to audit, and to the department. Institutions
should take some care in undertaking their KPI work to ensure that procedures are documented so as to
facilitate the audit process.

KPIRS Reporting Manual August 2012.docx August 2012
Page | 2
1. KPIRS: An Overview of the Reporting Structure The program classification structure in KPIRS is extracted from the PRS program classification. This
structure provides the basis for entering data at any level of aggregation. The table below describes the
available levels of reporting. Institutions are expected to enter their KPI data at the appropriate level, as
defined for each Information Set in this Manual.
Reporting Structure Institution Level
Represents the institution as a whole; may be a sum or roll-up of data entered at one of the more
detailed levels described below. Faculty / Administrative Unit
Usually the first level of organizational classification below the “institution” level. What is called
“division” at one institution may be called “department” or “faculty” at another. This is the unit
charged with administrative responsibility for the Specialization of a Program. Data could be rolled
up to an institution’s Faculty/Administration Units at a high level for instance, or to many lower
levels below the Credential, Program or Specialization. Credential (formerly called KPI Program Type) (See page 3 for details of Credentials)
A set of classifications that group programs by the level and type of credential awarded, Certificate,
Diploma, Degree, etc.
Program (Prog ID)
The PRS Program level used for enrolment reporting. Properties that describe a Program include the
Credential awarded and the program length. A program may have one or many Specializations.
Program Length
Indicates the program length in years of required study.
Specialization
The field of specialization within a PRS Program. This may describe separate majors, streams or
versions of one program. For instance, a Bachelor of Arts program may include specializations in
Anthropology, Drama or English. A Business Administration diploma may include specializations in
Accounting, Finance or Marketing.
Subject Area (See Page 4 for details of CIP 2000 Subject Areas)
A grouping of programs by the content of study using the first two digits of the CIP 2000 code. In
PRS, the CIP 2000 is a property of the Specialization.
CIP 2000
The 6-digit Classification of Instructional Programs (CIP) Canada 2000 coding structure is a field of
study classification described by Statistics Canada as a “discipline or area of learning or training”. In
PRS, this code is a property of the Specialization. It may be subdivided into a 2-digit Subject Area
code, 4-digit sub series, or the full 6-digit CIP 2000 code.

KPIRS Reporting Manual August 2012.docx August 2012
Page | 3
Table 1: Credential Codes for Program Identification in PRS
Credential Type
NA No credential/not applicable
C Certificate
JC Certificate - Journeyman
OC Certificate - Post-Basic
D Diploma
OD Diploma - Post-Basic
AD Degree - Applied
UT University Transfer
UG Degree - Bachelor
GC Certificate - Post-Degree (Graduate Studies)
GD Diploma - Post- Degree (Graduate Studies)
MS Degree - Masters
PD Degree - Doctoral

KPIRS Reporting Manual August 2012.docx August 2012
Page | 4
Subject Areas: Classification of Instructional Programs (CIP) 2000
Program Codes (2 digit) and Titles Chapter I Academic and Occupationally-Specific Programs
Chapter II Dental, Medical and Veterinary Residency Programs
Chapter III Technology Education/Industrial Arts Programs
Chapter IV Reserve Officer Training Corps Programs
Chapter V Personal Improvement and Leisure Programs
Chapter VI High School/Secondary School Diplomas and Certificate Programs
I Academic and Occupationally-Specific Programs
01. Agriculture, Agricultural Operations, and Related Sciences
03. Natural Resources and Conservation
04. Architecture and Related Services
05. Area, Ethnic, Cultural, and Gender Studies
09. Communication, Journalism, and Related Programs
10. Communications Technologies / Technicians and Support Services
11. Computer and Information Sciences and Support Services
12. Personal and Culinary Services
13. Education
14. Engineering
15. Engineering Technologies/Technicians
16. Aboriginal and Foreign Languages, Literatures, and Linguistics
19. Family and Consumer Sciences/Human Sciences
21. Programs for Series 21. (Technology Education/Industrial Arts) are located in Chapter III.
22. Legal Professions and Studies
23. English Language and Literature/Letters
24. Liberal Arts and Sciences, General Studies, and Humanities
25. Library Science
26. Biological and Biomedical Sciences
27. Mathematics and Statistics
28. Programs for Series 28. (Reserve Officer Training Corps programs) are located in Chapter IV
29. Military Technologies
30. Multi/Interdisciplinary Studies
31. Parks, Recreation, Leisure and Fitness Studies
32-37 Programs for Series 32 -37 (Personal Improvement and Leisure programs) are located in
Chapter V.
38. Philosophy and Religious Studies
39. Theology and Religious Vocations
40. Physical Sciences
41. Science Technologies/Technicians
42. Psychology
43. Security and Protective Services
44. Public Administration and Social Services Professions
45. Social Sciences

KPIRS Reporting Manual August 2012.docx August 2012
Page | 5
46. Construction Trades
47. Mechanic and Repair Technologies / Technicians
48. Precision Production
49. Transportation and Materials Moving
50. Visual and Performing Arts
51. Health Professions and Related Clinical Sciences
52. Business, Management, Marketing, and Related Support Services
53. Programs for Series 53. (High School/Secondary School Diplomas and Certificate programs)
are located in Chapter VI
54. History
55. French Language and Literature / Letters
II Dental, Medical and Veterinary Residency Programs
60. Dental, Medical and Veterinary Residency Programs
III Technology Education/Industrial Arts Programs
21. Technology Education/Industrial Arts Programs
IV Reserve Officer Training Corps Programs
28. Reserve Officer Training Corps Programs (JROTC, ROTC) (CIP Code no longer in use)
V Personal Improvement and Leisure Programs
32. Basic Skills
33. Citizenship Activities (CIP Code no longer in use)
34. Health-Related Knowledge and Skills (CIP Code no longer in use)
35. Interpersonal and Social Skills (CIP Code no longer in use)
36. Leisure and Recreational Activities
VI High School/Secondary School Diplomas and Certificate Programs
53. High School/Secondary Diplomas and Certificate Programs

KPIRS Reporting Manual August 2012.docx August 2012
Page | 6
CIP 2000 Codes that are Preparatory & Basic Upgrading (PBU) Program
Specific
The following CIP 2000 codes are for PBU programs. A specialization with any of the following PBU CIP
codes will be included in the Course Completion indicator for PBU programs (see page 19).
6 Digit CIP 2000 Code 6 Digit CIP 2000 Code 21.0101 - Technology Education/Industrial Arts
Programs
36.0105 - Home Maintenance and Improvement
32.0101 - Basic Skills, General 36.0112 - Cooking and Other Domestic Skills
32.0104 Numeracy and Computational Skills 36.0113 - Computer Games and Programming
Skills
32.0105 - Job-Seeking/Changing Skills 53.0101 - Regular/General High School/Secondary
Diploma Program
32.0107 - Career Exploration/Awareness Skills 53.0102 - College/University Preparatory and
Advanced High School/Secondary Diploma
Program
32.0108 - Literacy and Communication Skills 53.0103 - Vocational High School and Secondary
Business/Vocational-Industrial/Occupational
Diploma Programs
32.0109 - Second Language Learning (not for credit) 53.0105 - Adult High School/Secondary Diploma
Programs
32.0199 - Basic Skills, Other 53.0201 - High School Equivalence Certificate
Programs

KPIRS Reporting Manual August 2012.docx August 2012
Page | 7
2. Indicators for which Data Entry is required by all
Post-secondary Institutions
Operations Costs per FLE Measures operational costs reported at the program level, to indicate that resources are used efficiently
over time and that costs of programs are comparable to those of similar programs at other institutions
of comparable size, location and function. The indicators deal with financial resource utilization by
measuring the average costs per FLE in various programs.
Indicator(s) Apply to:
Comprehensive
Academic &
Research Institution
Baccalaureate
Academic and Applied
Studies Institution,
Polytechnical
Institutions, Specialized
Arts & Culture
Institutions
Comprehensive
Community Colleges
Independent
Academic
Institutions Average cost per FLE
enrolment
X
X
X
X
Level of Reporting: By program/specialization [See Page 2]:
• Comprehensive Community College at SpecID level
• Polytechical Institutions at SpecID level
• Comprehensive Academic & Research
Institutions
• Specialized Arts and Culture Institutions
• Independent Academic Institutions
• Baccalaureate and Applied Studies
Institutions
at SpecID level
at SpecID level
at SpecID level
at SpecID level
at SpecID level
Scope: All credentials are included [see Page 3]:
Data are to be generated and entered for each program for which FLE
enrolment is reported for the Access indicators.

KPIRS Reporting Manual August 2012.docx August 2012
Page | 8
Data Elements & Reporting
Systems:
Comprehensive
Academic &
Research
Institution
Baccalaureate
Academic and
Applied Studies
Institution,
Polytechnical
Institutions,
Specialized Arts &
Culture
Institutions
Comprehensive
Community
Colleges
Independent
Academic
Institutions
Data reported through
Program identification data PRS PRS PRS PRS
Total “direct” operations costs Data Entry Data Entry Data Entry Data Entry
Administration/service & support
costs* Data Entry Data Entry Data Entry Data Entry
Total program costs Calculated Calculated Calculated Calculated
Full-load equivalent enrolment LERS LERS LERS LERS
Cost per FLE enrolment Calculated Calculated Calculated Calculated
*Comprehensive Academic and Research Institutions report column title is: Service and Support
Reconciliation to FIRS and the Audited Financial Statements
Expenses as reported in an institution’s audited financial statement, FIRS and KPIRS submission, both
the Operations Cost per FLE and Reconciliation reports need to reconcile. This includes a reconciliation
of total expenses for the delivery of credit instruction in FIRS – Expense by Function & Object Category
template (columns Credit Subject to TFP (Tuition Fee Policy), Off-Campus Cost-Recovery Credit, Third-
Party Contract Credit, Apprenticeship and Other MFP (Ministry Funded Program) Subject to TFP) to the
total Direct Instruction Costs in KPIRS; and total indirect costs for the delivery of credit instruction in
FIRS - Indirect Costs by Function & Object Category template to the total Support & Service Costs &
Overheads in KPIRS. Where there are differences, these need to be identified on the Reconciliation with
Total Operations Expenditures report.
Specifications & Protocols
Program and Full-load Equivalent Enrolment data will be drawn from the Access indicator data.
Instructional Costs and Service & Support Costs & Overheads are to be determined in accordance with
the costing procedures set out in the following and entered through KPIRS.

KPIRS Reporting Manual August 2012.docx August 2012
Page | 9
Costing procedures for: Comprehensive Community Colleges,
Baccalaureate & Applied Studies Institutions, Specialized Arts &
Culture Institutions and Polytechnical Institutions
The following procedures and protocols were agreed upon on by the Senior Business Officers of
institutions and representatives from the department. The procedures provide a general framework for
cost accounting and cost allocation that can be applied across a relatively diverse set of institutions to
produce program costs that are sufficiently comparable for the purposes of KPI reporting.
The framework and general methods agreed upon were “full cost” or “full absorption cost” methods.
They are “activity based” to the extent that allocations are based, on activity information. This is to
provide total “direct” operations costs on a student program basis, prior to any indirect or overhead
allocations, and then to provide “full” cost information. This enables use of information regarding direct
cost differentials before it is masked by indirect cost allocations, especially in situations where a low
direct cost activity makes extensive use of one or more indirect cost resources.
The method facilitates reconciliation to the general ledger and/or financial statement totals, provided
that the common classification structure is being followed and/or that departures from the common
classification are recorded and disclosed. This reconciliation is important and should be performed at
each stage of the process particularly where the costing is not being undertaken with the same level of
detail for all functions and/or programs.
In a context where there are significant differences in institutions, their program mandates,
organizational structures, accounting methods, financial systems and a variety of other factors, a
common approach to cost allocation methods and procedures are essential. Key elements include
classification structures, definitions, allocation procedures and the ordering of key stages and steps of
the methodology. Adherence to the approach set out in the following steps should keep
“methodological variance” (i.e., differences in costs which might be attributed solely to differences in
methodology) within reasonable and practicable limits.
These are the steps for the general method:
1. Identify the departments, activity and or cost centres (hereinafter referred to as “cost centres”) and
the student programs and other cost objectives for which final costs are to be determined. These
should be in accordance with the functional classification structure and definitions used for FIRS
reporting. Note that program costs should be determined for each “ProgID/SpecID” as these are the
levels of aggregation for which enrolment and instructional load information are being generated
for the Access indicators.
2. Classify (“crossover” and/or reclassify) direct expenditures from institutional accounts to the
common classification structure. This step should include adjusting, prorating or “splitting” pooled
or shared expense items, including faculty and staff who hold “joint” appointments and teach in
more than one program area, and those academic support costs (e.g., deans, directors, program
heads or chairs, and associated costs) and any other costs (e.g., major facilities or other supporting
operations) that can be attributed directly to a program division or group of programs. Adjustments
may also include the identification and distribution of costs borne by academic units for primary
functions other than instruction (including the distribution of faculty compensation and other
expenses based either on the results of faculty activity analysis or assignment data if available); and
adjustments for charge backs, cost recoveries, etc. Prorations and/or splits should be made on
some activity-based method.
3. KPI Reporting does not call for the inclusion of revenues in costing reports at a program level.
However, where revenues are generated from the sale of “byproducts” of instruction (e.g., the sale

KPIRS Reporting Manual August 2012.docx August 2012
Page | 10
of meat in a meat-cutting program, products of construction in a house building program, etc.), an
amount not greater than the lesser of the total revenue, or the cost of materials consumed in
creating the goods or services sold, may be deducted from costs. A reconciliation of aggregate total
program costs with total institutional expenditures is required as part of the costing procedure and
will need to include disclosure of the specific costs recovered, overheads allocated, and the total
amounts of revenue involved. [See page16 “Reconciliation with Total Operations Expenditures”]
4. Ancillary Enterprise expenditures should be excluded. The department’s policy is that ancillary
services should operate on a full cost recovery basis. On the assumption that this policy is being
followed and that fair and reasonable allocations of support costs and overheads, and capital
amortization are being made, ancillary services can be excluded from the costing model. Amounts
excluded and corresponding revenues will need to be disclosed in the reconciliation of aggregate
total program costs with total institutional expenditures. [See page 16 “Reconciliation with Total
Operations Expenditures”.]
5. Costs for programming that does not generate “official” FLE for LERS reporting should be identified
on a program-by-program basis, excluded and entered in the reconciliation. [See page 16
“Reconciliation with Total Operations Expenditures”.]
6. Develop an “instructional workload matrix”. This step may not be required for all institutions. In
some institutions, a substantial volume of instruction is delivered from a number of instructional
programs, departments or cost centres, to students in programs, which are not otherwise directly
associated with those centres. The technique represented by the instructional workload matrix is a
relatively efficient way to transfer the associated costs from the delivery units to the recipient
programs. Institutions which have relatively self contained programs (i.e., where students take
nearly all of their instruction in courses offered by the same cost centre), may find it more efficient
to make “activity-based” adjustments, allocations and/or prorations of cost for the services provided
from one program to students in other programs, where necessary.
7. Calculate direct unit costs for instruction from each cost centre identified in the “instructional
workload matrix” if a matrix has been used. These are used to transfer costs from cost centres
offering the instruction to student programs on the basis of the distributions of “units” in the matrix,
resulting in accumulations of instructional costs for each student program (and for each year and/or
level of program as required).
8. Cross-allocate indirect services, support, and/or overhead costs to remaining functions and to
programs and other final cost objectives on the following bases:
8.1 Academic
Support
Allocate to program based on FLE enrolment, after allocation of costs
specifically attributable to Continuing Education (Non-credit) have been
factored out.
8.2 Student
Services
Allocate to program based on FLE enrolment, after allocation of costs
specifically attributable to Continuing Education (Non-credit) have been
factored out.
8.3 Computing &
Communication
Allocate to program based on FLE enrolment, after allocation of costs
specifically attributable to Continuing Education (Non-credit) have been
factored out.
8.4 Institutional
Support
Allocation on the basis of direct expenditures after transfers and/or
adjustments in Steps 2, 3 and 4.
8.5 Facilities
Management,
Operations and
Maintenance
Allocate to program based on FLE enrolment, after allocation of costs
attributable to specific programs or program areas. (Details of specific
allocations to be disclosed.)

KPIRS Reporting Manual August 2012.docx August 2012
Page | 11
8.6 Amortization Allocate using same method as Facilities Management, Operations and
Maintenance, unless institution has a more specific method, in which case
the details of the method should be disclosed.
Some institutions use more specific and accurate activity-based cost allocation procedures than the
general methods called for in the foregoing. The use of these more specific procedures in program
costing is encouraged, with disclosure in a brief note describing the method.
The “Direct” Operations Costs and Service, Support, Overhead Allocations for each program are to
be entered through KPIRS. The KPIRS application include Program, FLE Enrolment and Student
Contact Hours data for each “ProgID/SpecID”, and will calculate Total Program Cost, and Cost per
FLE for each. For this application of KPIRS to work effectively, it is necessary that the cost data
reported correspond with “programs” for which Access data are reported on a one-to-one basis.

KPIRS Reporting Manual August 2012.docx August 2012
Page | 12
Costing procedures for Comprehensive Academic & Research
Institutions
The following procedures and protocols have been agreed upon by the comprehensive academic and
research institutions Fiscal Management KPI working group and representatives of the department.
They provide a general framework for cost accounting and cost allocation that can be applied across
relatively diverse institutions to produce program costs that are sufficiently comparable for the purposes
of KPI reporting.
To meet the requirements for indicators of average annual costs of instructional programs per student
in undergraduate and graduate programs, a methodology has been developed which enables the
determination of average costs per course, which are used to accumulate the costs of all courses taken
by all students in each undergraduate degree, master’s and doctoral program. Graduate supervision
costs where applicable, and attributable proportions of administration/support (i.e., non-Faculty)
expenses and public (community services) costs are added.
1. The expenses of the institution as identified in its Financial Statements are divided among the
teaching Faculties, Special Sessions, and one administration/support category that include all other
operating accounts. For the purposes of these procedures, the Faculties and Special Sessions
expenses are regarded as “direct” operations costs and the administration/support category
expenses are regarded as administration/service & support costs.
2. KPI Reporting does not call for the inclusion of revenues in costing reports at a program level.
However, where revenues are generated from the sale of “byproducts” of operations, an amount
not greater than the lesser of the total revenue, or the cost of materials consumed in creating the
goods or services sold, may be deducted from costs. A reconciliation of aggregate total program
costs with total institutional expenditures is required as part of the costing procedure and will need
to include disclosure of the specific costs recovered, overheads allocated, and the total amounts of
revenue involved. [See page 16 “Reconciliation with Total Operations Expenditures” ]
3. Ancillary Enterprise expenditures should be excluded. The department’s policy is that ancillary
services should operate on a full cost recovery basis. On the assumption that this policy is being
followed and that fair and reasonable allocations of support costs and overheads, and capital
amortization are being made, ancillary services can be excluded from the costing model. Amounts
excluded and corresponding revenues will need to be disclosed in the reconciliation of aggregate
total program costs with total institutional expenditures. [See page 16“Reconciliation with Total
Operations Expenditures” ]
4. Costs for programming that does not generate “official” FLE for LERS reporting should be identified
on a program-by-program basis, excluded and entered in the reconciliation. [See page 16
“Reconciliation with Total Operations Expenditures” ]
5. Faculty costs are allocated to course sections taught by the Faculty in Winter Session. The costs of
Special Sessions (stipends or sessional replacement costs of instructors) are allocated to sections
taught in the spring and summer Intersession, May to August. The sections are assigned weights
corresponding to their relative costs.
6. The cost of each course offered by the Faculty (or Special Sessions) is calculated as the summation
of the costs of each section.
7. The cost of each Winter Session or Intersession course is divided evenly among all the students
registered in the course. Thus, the cost allocated to a student depends on the number and type of
sections of that course, and the total number of students registered in the course, rather than on
the sizes of the particular sections of the course in which the student registered. This averaging

KPIRS Reporting Manual August 2012.docx August 2012
Page | 13
removes the variations that could occur from students being registered, presumably by chance, in
relatively larger or smaller sections of the course.
8. The course costs attached to each student are projected to the actual programs of the students as a
summation across all courses taken by student. In effect, students collect course costs from all
faculties from which they take courses.
9. The graduate supervision costs of each Faculty are allocated to graduate programs based on
weighted enrolments of full-time and part-time master’s and doctoral students.
10. The “direct” operations costs of every teaching Faculty are allocated to activities and eventually to
programs by the same method. The instruction and graduate supervision costs of each student
program are increased by contributions from all faculties that serve that program.
11. Administration/support costs are allocated to student programs based on weighted student
enrolments. Intersession enrolments are assigned weights equal to one-half of the weights of
corresponding part-time Winter Session enrolments. Doctoral and Master’s students are weighted
more heavily than undergraduates for the purposes of this allocation, reflecting the judgment that
graduate students place a greater load per capita on the infrastructure of the institution than do
undergraduates.
12. The average cost per student, per year of each program is calculated by dividing total program costs
by the FLE enrolment in the program. The enrolment data used for these and earlier calculations
will be reported for the Access indicator and the cost information will need to be provided for each
program for which FLE enrolment data are provided.

KPIRS Reporting Manual August 2012.docx August 2012
Page | 14
Costing procedures for Independent Academic Institutions
The costing procedures for independent academic institutions are adapted from those for comprehensive
academic and research institutions, eliminating the steps not required for this institutional sector:
1. The expenses of the institution as identified in its Financial Statements are divided among the
teaching units and one administration/support category that include all other operating accounts.
2. The total costs associated with teaching are allocated to course sections taught. The course sections
are assigned weights corresponding to their relative costs.
3. The cost of each course offered is calculated as the summation of the costs of each course section.
4. The cost of each course is divided evenly among all the students registered in the course. Thus, the
cost allocated to a student depends on the number and type of sections of that course, and the total
number of students registered in the course, rather than on the sizes of the particular sections of
the course in which the student registered. This averaging removes the variations that could occur
from students being registered, presumably by chance, in relatively larger or smaller sections of the
course.
5. The course costs attached to each student are projected to the actual programs of the students as a
summation across all courses taken by student. In effect, students collect course costs from all
teaching units from which they take courses.
6. The administration/support costs are allocated to student programs in proportion to the direct costs
accumulated for each program.
7. The average cost per student, per year of each program is calculated by dividing total program costs
by the FLE enrolment in the program. The enrolment data used for these and earlier calculations
will be reported for the Access (FLE Enrolment) indicator and cost information will need to be
provided for each program for which FLE enrolment data are provided.
Note:
An Operations Costs per FLE template is located on the next page. The template for the
Comprehensive Academic and Research Institutions and the Independent Academic Institutions would
not have student contact hours or cost per student contact hour.

KPIRS Reporting Manual August 2012.docx August 2012
Page | 15

KPIRS Reporting Manual August 2012.docx August 2012
Page | 16
Reconciliation with Total Operations Expenditures
The following format is to be used to reconcile the institutional total of the Total Program Costs, with
Total Institutional Expenditures as per the data reported through FIRS for the corresponding fiscal year.
This reconciliation format includes information required by the department to determine that standing
policies with respect to Ancillary Services and/or overheads allocation and recovery are being met and
to ensure that costs not greater than revenue amounts are being excluded where revenues are
generated from “by products of instruction”. Information on brokered programs is also required to
determine the level of expenditure on students officially reported by another institution. These costs on
a program-by-program basis are then associated with the enrolment that are reported in LERS and
shared with the brokering partners.
Reconciliation of Total Program Costs
with Total Expenditures
Reconciliation
Overheads, etc.
included in
amounts
excluded
Revenue
amounts where
relevant Total Expenditures as per Financial Statements Less such items as:
Ancillary enterprises By-products of instruction Non-credit costs Sponsored research (universities) Special purpose, trust and endowment Brokered programs (specify): Other (specify)
Plus: Additions, if any (specify) Total Program Costs

KPIRS Reporting Manual August 2012.docx August 2012
Page | 17
Course Completion – Athabasca University and PBU Programs Course Completion indicators are intended to show whether students who enter as full-time students
complete their courses at the end of the term.
Athabasca University
For Athabasca University the completion indicator recognizes the unique role the institution has in the
post-secondary system. This indicator is constructed as a “course completion rate” to show whether
course registrants complete their courses of study within the time frame the university has established.
The course completion rate for each program specialization is the total number of courses completed in
that program specialization. The course completion rate for the university is the total number of course
completions expressed as a percentage of the total course registrations for any reporting year.
Indicator(s) Apply to:
Comprehensive
Academic &
Research
Institutions
Baccalaureate
Academic and Applied
Studies Institution,
Polytechnical
Institutions,
Specialized Arts &
Culture Institutions
Comprehensive
Community
Colleges
Independent
Academic
Institutions
# of course completions
AU only
-
-
-
Level of Reporting: By program [see page 2]:
• Athabasca University at SpecID level
Scope: Information required for the following parchment program types:
Certificate, Diploma, Degree – Bachelor and Degree - Masters
Specifications & Reporting Protocols:
Total course registrations - The total number of registrations in all credit course offerings in the program specialization area in the reporting year.
Total course completions - The number of successful course completions resulting from the total course registrations recorded for the “program specialization area”. A student has successfully completed a course when he/she has achieved the course objectives.
Data Elements & Reporting
Systems:
Comprehensive
Academic &
Research
Institution
Baccalaureate
Academic and
Applied Studies
Institution,
Polytechnical
Institutions,
Specialized Arts &
Culture Institutions
Comprehensive
Community
Colleges
Independent
Academic
Institutions
Data reported through
Athabasca University
# of course registrations Data Entry - - -
# of course completions Data Entry - - -
FLE enrolment LERS - - -
# of graduates LERS - - -

KPIRS Reporting Manual August 2012.docx August 2012
Page | 18
Course completion rate - The ratio of total completions to total course registrations in the “program specialization area”.
An Athabasca University Course Completion template is below.

KPIRS Reporting Manual August 2012.docx August 2012
Page | 19
Preparatory & Basic Upgrading (PBU) Programs For PBU programming, the completion indicator is constructed as a “course completion rate” to show
whether PBU students complete their courses of study within the term over which the courses of study
are offered. The PBU completion rate is the total number of course completions expressed as a
percentage of the total course registrations for any program area in any reporting year.
Indicator(s) Apply to:
Comprehensive
Academic &
Research Institution
Baccalaureate
Academic and
Applied Studies
Institution,
Polytechnical
Institutions,
Specialized Arts &
Culture Institutions
Comprehensive
Community Colleges
Independent
Academic
Institutions
Course completion
- PBU programming
PBU programming
PBU programming
Level of Reporting: By program/specialization [see page 2]:
• For Preparatory & Basic Upgrading
(PBU) program areas (see page 6)
at SpecID level
Scope: Information required for the following program types: No credential/not
applicable.
Data Elements & Reporting
Systems:
Comprehensive
Academic &
Research Institution
Baccalaureate
Academic and Applied
Studies Institution,
Polytechnical
Institutions, Specialized
Arts & Culture
Institutions
Comprehensive
Community
Colleges
Independent
Academic
Institutions
Data reported through
Preparatory & Basic Upgrading
Program identification data PRS PRS PRS PRS
Program FLEs LERS LERS LERS LERS
Total course registrations Data Entry Data Entry Data Entry Data Entry
Total course completions Data Entry Data Entry Data Entry Data Entry
Course completion rate Calculated Calculated Calculated Calculated
Specifications & Reporting Protocols:
Total course registrations - The total number of registrations in all credit course offerings in the reporting year for the program/specialization.
Total course completions - The number of successful course completions resulting from the total course registrations recorded for the program/specialization. A student has successfully completed a course when he/she has achieved the course objectives.
Course completion rate - The ratio of total completions to total course registrations in the program/specialization.

KPIRS Reporting Manual August 2012.docx August 2012
Page | 20
Generating course completion rates for Preparatory & Basic Upgrading programs:
The following working table can be used to assist institutions in generating the data to be reported
through KPIRS for the course completion rate by subject area. It illustrates how course registrations,
course completions and course completion rates can be aggregated by Program ID/ Specialization and
the results entered through KPIRS.
Courses grouped by
Program
ID/Specialization Term
Course
Registrations
Course
Completions Course Completion Rate
ProgID/Spec 1, e.g. Adult Literacy
Course 1
Course 2
Course ... etc.
Total ProgID/Spec
to KPIRS screen to KPIRS screen calculated by KPIRS
ProgID/Spec 2, e.g. Adult Basic Education
Course 1
Course 2
Course ... etc.
Total ProgID/Spec 2, e.g.
ABE
to KPIRS screen to KPIRS screen calculated by KPIRS
Notes re: Course Completion
� Completion rates will be generated at the Program ID/Specialization level as defined in PRS for
each institution.
� Students who have remained in the course past the institution’s own deadline for withdrawal
without academic penalty are considered active in the course and their registration is to be
counted.
� The sum of all active course registrations should be entered in Total Course Registrations.
� The sum of all active course registrations resulting in a successful completion should be entered in
Total Course Completions. A student has successfully completed a course when he/she has
achieved the course objectives.
A PBU Course Completion template is on the next page.

KPIRS Reporting Manual August 2012.docx August 2012
Page | 21
PBU Course Completion template

KPIRS Reporting Manual August 2012.docx August 2012
Page | 22
Access Indicator – Non-Credit Course Registration Access indicators are measures of student participation that may be used to indicate accessibility to
post-secondary programs, levels of service provided by institutions and volumes of instructional activity:
• annual total unduplicated student headcount - non-credit programming
• course and program registrations - non-credit programming
Indicator(s) Apply to:
Comprehensive
Academic &
Research
Institution
Baccalaureate
Academic and
Applied Studies
Institution,
Polytechnical
Institutions,
Specialized Arts &
Culture
Institutions
Comprehensive
Community
Colleges
Independent
Academic
Institutions
Access – Non-Credit Courses and Programs
Annual unduplicated student
headcount X X X X
Course and program registrations X X X X
Student contact hours X X X X
Level of Reporting: By institution:
Non-credit annual unduplicated headcount at the institutional level
Registrations in courses and programs at the program classification
level
Scope: Information required for all non-credit programming categories: Courses and Programs.
Data Elements & Reporting
Systems:
Comprehensive
Academic &
Research
Institution
Baccalaureate
Academic and
Applied Studies
Institution,
Polytechnical
Institutions,
Specialized Arts
& Culture
Institutions
Comprehensive
Community
Colleges
Independent
Academic
Institutions
Data reported through
Enrolment in Non-Credit Programs
Programming category (CAT) Data Entry Data Entry Data Entry Data Entry
Programming sub-category
(SCAT) Data Entry Data Entry Data Entry Data Entry
Subject area (SA) Data Entry Data Entry Data Entry Data Entry
Classification code (NC Class) Data Entry Data Entry Data Entry Data Entry
Course Registration Data Entry Data Entry Data Entry Data Entry
Student contact hours (SCH) Data Entry Data Entry Data Entry Data Entry
Unduplicated Headcount Data Entry Data Entry Data Entry Data Entry
Note:
Subject area (SA) still follows the former KPI subject area classifications (see appendix C ).

KPIRS Reporting Manual August 2012.docx August 2012
Page | 23
Access Indicator – Non-Credit Unduplicated Headcount
Indicator(s) Apply to:
Comprehensive
Academic &
Research
Institution
Baccalaureate
Academic and
Applied Studies
Institution,
Polytechnical
Institutions,
Specialized Arts &
Culture
Institutions
Comprehensive
Community
Colleges
Independent
Academic
Institutions
Access – Non-Credit Unduplicated Headcount
Annual unduplicated student
headcount X X X X
Level of Reporting: By institution:
Non-credit annual unduplicated headcount at the institutional level
Scope: Non-credit unduplicated headcount enrolment.
Data Elements & Reporting
Systems:
Comprehensive
Academic &
Research
Institution
Baccalaureate
Academic and
Applied Studies
Institution,
Polytechnical
Institutions,
Specialized Arts
& Culture
Institutions
Comprehensive
Community
Colleges
Independent
Academic
Institutions
Data reported through
Enrolment in Non-Credit Programs
Total Unduplicated Headcount Data Entry Data Entry Data Entry Data Entry
Total Course Registration Calculated Calculated Calculated Calculated Total Student Contact Hours Calculated Calculated Calculated Calculated
Specifications and Reporting Protocols
Non-Credit Programming
Definition of Courses - Organized subject matter with pre-determined curriculum, and set of specified
learning outcomes delivered to a learner usually over a specified period of time. Within institutions,
courses may be referred to by other labels, such as seminars, workshops, etc. The label is not
important in determining whether an educational offering is to be considered a course. For KPI
reporting purposes, any offering meeting the above criteria is a course. (Note: GED testing sessions
and admission information sessions do not meet the criteria of the course definition. In addition,
conferences that do not have specified learning outcomes should not be considered courses).
Non-credit Programming Categories:
Programs - A collection of courses related by a common purpose, all of which must be successfully
completed for students to receive certification (if any is conferred). For reporting purposes, students
register in the given program, not in the courses that comprise it. Some programs may also be
completed in a flexible manner. However, regardless of the degree of flexibility, if students are

KPIRS Reporting Manual August 2012.docx August 2012
Page | 24
registered in programs not courses, they are considered to be part of the program category, not the
flexible program category.
Flexible Programs - A collection of courses related by a common purpose, all of which must be
successfully completed for students to receive certification. For reporting purposes, students register
in courses in the program, not in the program itself.
Non-credit programming sub-categories:
Customized Training - A course or program in which the curriculum has been customized to meet the
specific training or educational needs of a business or agency. These courses are usually not open to
the general public. For administrative purposes, the primary relationship is between the institution
and the client, not between the institution and an individual learner. Note: The access indicators
(registrations, unduplicated headcount, and student contact hours) describe the students taking the
customized training not the client for whom the training was designed.
Coding for Customized Training = NR
Programming for Children - All courses or programs designed by the institution to be offered
specifically to individuals under 18 years of age. (Note: The access indicators in this category are not
intended to represent every student under the age of 18. While it is possible that individuals under
this age may be enrolled in courses or programs that are not specifically designed for children, since
not all institutions collect age information on their non-credit registrants (as they do with credit
registrants they should be reported as an adult is reported).
Coding for Programming for Children = PC
Subject area - Coding that provides for the identification of subject area using the department’s former
KPI subject area codes (see page 92).
Classification - Coding that provides for the identification of discipline using the department’s 3-digit
program classification codes (see page 92).
Non-credit registrations - The total number of registrations in courses or programs not recognized for
credit in LERS reporting, for all sessions in the reporting year. A student enrolled in a course or
program that is subsequently cancelled should not be counted. A student withdrawing before a
course or program’s withdrawal date should not be included; a student withdrawing after the
withdrawal date should be included. Since students may be registered in more than one course or
program over the course of a year at a given institution, registration counts are generally higher than
unduplicated headcounts.
Non-credit annual headcount - The total number of students (unduplicated headcount) participating in
programs or courses not recognized for credit in LERS reporting, for all sessions in the reporting year.
Institutions currently unable to calculate unduplicated headcount should leave this field blank in
KPIRS. As with credit reporting, learning activities that have been reported by another institution
through a brokering arrangement should not be included in the headcount. See the LERS for more
information on reporting for Brokered Programs.
Access non-credit templates for course registrations and unduplicated headcount are located on
page 31.

KPIRS Reporting Manual August 2012.docx August 2012
Page | 25
Non-Credit Course Definitions
Possible Category/ Sub-Category Combinations
Category
Category Description
Sub-Category
Sub-Category Description
CR Non-credit Courses NR Normal Programming
CR Non-credit Courses CT Customized Training
CR Non-credit Courses PC Programming for Children
FP Non-credit Flexible Programs NR Normal Programming
PR Non-credit Programs NR Normal Programming
PR Non-credit Programs CT Customized Training
PR Non-credit Programs PC Programming for Children
(Note: FP is only valid with NR)
Possible Subject Area/ Classification Code Combinations (All combinations are valid with any Category/ Sub-Category combination)
Subject Area
Subject Area Description
Classification
Code
Classification Name
AC Academic Upgrading 710 PREPARATORY AND BASIC
UPGRADING
AC Academic Upgrading 713 Academic Upgrading
AE Architecture & Environmental
Design
121 Architecture and Environmental
Design
AE Architecture & Environmental
Design
126 Geography and Regional Planning
AG Agricultural (& related) 234 Plants
AG Agricultural (& related) 233 Animals
AG Agricultural (& related) 237 Food Science
AG Agricultural (& related) 236 Food Processing
AG Agricultural (& related) 235 General Agriculture
AG Agricultural (& related) 230 AGRICULTURE
AG Agricultural (& related) 232 Technology
AG Agricultural (& related) 231 Business
AS Arts & Science (General) 730 GENERAL UNIVERSITY TRANSFER
(NOT ELSEWHERE CLASSIFIED)
AS Arts & Science (General) 725 Women's Studies
AS Arts & Science (General) 722 General Studies/General Arts and
Science
AS Arts & Science (General) 723 Inter-disciplinary Studies
AS Arts & Science (General) 720 INTERDISCIPLINARY STUDIES
AS Arts & Science (General) 700 GENERAL STUDIES
BL Biological & Life Sciences (&
related)
225 Genetics
BL Biological & Life Sciences (& 228 Botany

KPIRS Reporting Manual August 2012.docx August 2012
Page | 26
related)
BL Biological & Life Sciences (&
related)
226 Ecology/Environmental Biology
BL Biological & Life Sciences (&
related)
224 Biology/Microbiology
BL Biological & Life Sciences (&
related)
222 Marine Sciences
BL Biological & Life Sciences (&
related)
223 Biological Technologies
BL Biological & Life Sciences (&
related)
200 LIFE SCIENCES
BL Biological & Life Sciences (&
related)
221 Traditional Biological Disciplines
BL Biological & Life Sciences (&
related)
220 BIOLOGICAL SCIENCES AND RELATED
TECHNOLOGY
BL Biological & Life Sciences (&
related)
229 Zoology
BL Biological & Life Sciences (&
related)
227 Biochemistry
BL Biological & Life Sciences (&
related)
241 Home Economics General
BL Biological & Life Sciences (&
related)
243 Clothing and Textiles
BL Biological & Life Sciences (&
related)
240 HOME ECONOMICS AND RELATED
BL Biological & Life Sciences (&
related)
242 Food Related
BU Business (& related) 622 Secretary/Office Management
BU Business (& related) 623 Clerk Typist/Word Processor
Operator
BU Business (& related) 610 MANAGEMENT
BU Business (& related) 600 BUSINESS AND RELATED STUDIES
BU Business (& related) 611 Business Administration
BU Business (& related) 612 Marketing
BU Business (& related) 625 Warehousing
BU Business (& related) 621 Bookkeeping/Accounting
BU Business (& related) 614 Finance/Accounting
BU Business (& related) 613 Personnel
BU Business (& related) 616 Public Administration
BU Business (& related) 624 Banking
BU Business (& related) 620 CLERICAL
BU Business (& related) 617 Other Management
CE Civil (engineering & related) 122 Drafting
CE Civil (engineering & related) 120 CIVIL ENGINEERING, CONSTRUCTION,
DESIGN RELATED TECHNOLOGY
CE Civil (engineering & related) 124 Construction
CE Civil (engineering & related) 123 Surveying
CE Civil (engineering & related) 127 Environmental Engineering

KPIRS Reporting Manual August 2012.docx August 2012
Page | 27
CE Civil (engineering & related) 125 Civil Engineering
CM Communications (& related) 516 Communications, General
CM Communications (& related) 514 Public Relations
CM Communications (& related) 510 COMMUNICATIONS
CM Communications (& related) 511 Broadcasting
CM Communications (& related) 512 Writing
CM Communications (& related) 513 Printing Services
CP College/University Preparation 715 College Preparation
CR Chemical & Resources (& related) 134 Natural Resources Related
Management
CR Chemical & Resources (& related) 132 Mineral Resources
CR Chemical & Resources (& related) 130 CHEMICAL ENGINEERING AND
RESOURCE RELATED TECHNOLOGY
CR Chemical & Resources (& related) 133 Petroleum Resources
CR Chemical & Resources (& related) 131 Chemical and Industrial Process
ED Education (& related) 425 Child Care
ED Education (& related) 424 Other Education Specialties
ED Education (& related) 421 Teacher Training
ED Education (& related) 420 EDUCATION AND PERSONAL
DEVELOPMENT
ED Education (& related) 423 Clinical/Psychological Related
ED Education (& related) 426 Other Instructor Training
ED Education (& related) 312 Sports Instruction/Training
ED Education (& related) 310 PHYSICAL EDUCATION AND
RECREATION RELATED
ED Education (& related) 311 Physical Education General
ED Education (& related) 422 Administration
EE Electrical & Electronics (eng &
related)
140 ELECTRICAL ENGINEERING AND
RELATED TECHNOLOGY
EE Electrical & Electronics (eng &
related)
141 Electrical Engineering Related
EE Electrical & Electronics (eng &
related)
144 Electrical Maintenance and Repair
EE Electrical & Electronics (eng &
related)
142 Electronics and Microelectronics
Related
EE Electrical & Electronics (eng &
related)
145 Computer Engineering
EE Electrical & Electronics (eng &
related)
143 Electrician
EG Engineering (General & related) 161 General Engineering
EG Engineering (General & related) 163 Trade Related Upgrading
EG Engineering (General & related) 162 Meteorological Studies
EG Engineering (General & related) 160 OTHER ENGINEERING AND RELATED
ES English as a Second Language 712 ESL
FP Fine & Performing Arts 527 Arts Administration

KPIRS Reporting Manual August 2012.docx August 2012
Page | 28
FP Fine & Performing Arts 528 Industrial Design
FP Fine & Performing Arts 524 Dance
FP Fine & Performing Arts 521 Music
FP Fine & Performing Arts 520 FINE AND APPLIED ARTS
FP Fine & Performing Arts 522 Drama
FP Fine & Performing Arts 526 Other Arts Related
FP Fine & Performing Arts 523 Art
FP Fine & Performing Arts 525 Graphic Art/Visual Communication
HE Health Related (Not incl. MD) 340 NURSING
HE Health Related (Not incl. MD) 335 Respiratory Therapy
HE Health Related (Not incl. MD) 336 Health Technology
HE Health Related (Not incl. MD) 333 Speech Therapy
HE Health Related (Not incl. MD) 363 Public Health/Hygiene
HE Health Related (Not incl. MD) 360 COMMUNITY SERVICE RELATED
HE Health Related (Not incl. MD) 362 Pharmacy Related
HE Health Related (Not incl. MD) 344 Home/Residential Care
HE Health Related (Not incl. MD) 332 Occupational Therapy
HE Health Related (Not incl. MD) 342 Psychological Nursing
HE Health Related (Not incl. MD) 343 Speciality Nursing and Upgrading
HE Health Related (Not incl. MD) 361 Emergency Medical
HE Health Related (Not incl. MD) 341 Basic Nursing
HE Health Related (Not incl. MD) 334 Alternative Therapy
HE Health Related (Not incl. MD) 300 HEALTH AND MEDICAL SCIENCES
HE Health Related (Not incl. MD) 314 Sports Health and Safety
HE Health Related (Not incl. MD) 330 REHABILITATION
HE Health Related (Not incl. MD) 331 Physical Therapy
HS Humanities & Social Sciences 721 Native Studies
HS Humanities & Social Sciences 536 French Related
HS Humanities & Social Sciences 535 Philosophy/Religion
HS Humanities & Social Sciences 531 English
HS Humanities & Social Sciences 412 Economics
HS Humanities & Social Sciences 530 HUMANITIES DISCIPLINES
HS Humanities & Social Sciences 415 Sociology
HS Humanities & Social Sciences 416 Other Social Science Disciplines
HS Humanities & Social Sciences 534 History/Classics
HS Humanities & Social Sciences 414 Political Science
HS Humanities & Social Sciences 413 Psychology
HS Humanities & Social Sciences 411 Anthropology
HS Humanities & Social Sciences 537 Linguistics
HS Humanities & Social Sciences 533 Area Studies
HS Humanities & Social Sciences 539 Other Humanities Studies

KPIRS Reporting Manual August 2012.docx August 2012
Page | 29
HS Humanities & Social Sciences 410 SOCIAL SCIENCE DISCIPLINES
HS Humanities & Social Sciences 500 ARTS
HS Humanities & Social Sciences 532 Languages/Literature
HS Humanities & Social Sciences 400 SOCIAL SCIENCES AND RELATED
APPLICATIONS
IT Information Technology 641 Management Science
IT Information Technology 640 INFORMATION TECHNOLOGY
IT Information Technology 515 Library Related
IT Information Technology 642 PC User Training
IT Information Technology 113 Computing Science
JL Job & Life Skills 711 Job/Life Skills
MD Medicine & Dentistry 320 MEDICINE
MD Medicine & Dentistry 321 Basic Medical Practice
MD Medicine & Dentistry 328 Psychiatry
MD Medicine & Dentistry 326 Neuroscience
MD Medicine & Dentistry 327 Pharmaceutical Science
MD Medicine & Dentistry 324 Physiology
MD Medicine & Dentistry 325 Anatomy and Cell Biotechnology
MD Medicine & Dentistry 322 Medical Science Disciplines
MD Medicine & Dentistry 323 Medical Technology
MD Medicine & Dentistry 351 Dentistry
MD Medicine & Dentistry 350 DENTAL RELATED
MD Medicine & Dentistry 353 Dental Assisting
MD Medicine & Dentistry 354 Dental Technology
MD Medicine & Dentistry 352 Hygiene
ME Mechanical (eng & related) 150 MECHANICAL ENGINEERING AND
RELATED TECHNOLOGY
ME Mechanical (eng & related) 154 Mechanical Engineering
ME Mechanical (eng & related) 153 Piping and Related
ME Mechanical (eng & related) 152 Automotive Related
ME Mechanical (eng & related) 151 Aircraft Related
MP Math & Physical Sciences 116 Chemistry
MP Math & Physical Sciences 112 Physical Science Disciplines
MP Math & Physical Sciences 117 Physics
MP Math & Physical Sciences 115 Geology/Earth Sciences
MP Math & Physical Sciences 111 Math Disciplines
RR Renewable Resources 211 Environmental Science
RR Renewable Resources 214 General Resources Management
RR Renewable Resources 212 Forest Related
RR Renewable Resources 210 RENEWABLE RESOURCES
RR Renewable Resources 213 Water Related

KPIRS Reporting Manual August 2012.docx August 2012
Page | 30
SC Science (General) 110 PURE SCIENCE
SC Science (General) 100 MATH AND NATURAL SCIENCE
SH Services & Hospitality 637 Maintenance/Cleaning
SH Services & Hospitality 615 Hospitality
SH Services & Hospitality 634 Merchandising/Sales
SH Services & Hospitality 635 Travel
SH Services & Hospitality 630 SERVICES
SH Services & Hospitality 631 Food Services
SH Services & Hospitality 313 Recreation Administration
SH Services & Hospitality 636 Property Management
SH Services & Hospitality 633 Personal Care
SS Social & Community Services 430 SOCIAL AND COMMUNITY SERVICES
SS Social & Community Services 431 Individual Case Counselling, Social
Welfare
SS Social & Community Services 432 Social Service, Family/Community
Support
SS Social & Community Services 440 LAW AND RELATED
SS Social & Community Services 442 Enforcement
SS Social & Community Services 434 Other Community Services
SS Social & Community Services 444 Legal Support
SS Social & Community Services 443 Corrections
SS Social & Community Services 433 Services for the Disabled
SS Social & Community Services 441 Law
TR Transport (& related) 156 Flight Training
TR Transport (& related) 632 Public Transportation
TR Transport (& related) 155 Transport Related
UC Unclassified 724 Unclassified/No Program
VP Vocational Preparation 714 Vocational Preparation

KPIRS Reporting Manual August 2012.docx August 2012
Page | 31
Templates for Access Non-credit Course Registrations and
Unduplicated Headcount

KPIRS Reporting Manual August 2012.docx August 2012
Page | 32
Research Publications and Other Creative Works - Athabasca
University, and Other Institutions
Athabasca University, Grant MacEwan University, Mount Royal University, NAIT, SAIT, Alberta College of
Arts and Design, and the Independent Academic Institutions are all required to report publications
indicator data obtaining the necessary data from a number of sources including annual academic staff
reports, faculty surveys, and other internal records and external sources.
These indicators combine highly disparate forms of research activity and output into aggregate
measures that do not reflect the relative magnitude of activities or impacts of outputs. Comparisons
between and among institutions may not be valid.
Indicator information is maintained for a five-year period ending with the reporting year, to enable the
calculation of three three-year rolling averages. Data for the most recent year available and updates to
prior year data are reported annually.
Indicator(s) Apply to:
Comprehensive
Academic &
Research Institution
Baccalaureate Academic
and Applied Studies
Institution, Polytechnical
Institutions
Specialized
Arts and
Culture
Institutions
Independent
Academic
Institutions
Books authored or co-
authored AU Only
Grant MacEwan, Mount
Royal, NAIT & SAIT ACAD only X
Books edited or co-edited
AU Only
Grant MacEwan, Mount
Royal, NAIT & SAIT ACAD only X
Articles in refereed journals
AU Only
Grant MacEwan, Mount
Royal, NAIT & SAIT ACAD only X
Non-refereed publications
AU Only
Grant MacEwan, Mount
Royal, NAIT & SAIT ACAD only X
Conference presentations
AU Only
Grant MacEwan, Mount
Royal, NAIT & SAIT ACAD only X
Peer-reviewed publications
by undergraduate authors AU Only
Grant MacEwan, Mount
Royal, NAIT & SAIT ACAD only X
Level of Reporting: By institution
• Athabasca University
• Baccalaureate and Applied Studies
Institutions
• Polytechnical Institutions
• Alberta College of Arts & Design
• Independent Academic Institutions
at the institutional level
at the institutional level
at the institutional level
at the institutional level
at the institutional level
Scope: Athabasca University, Baccalaureate and Applied Studies Institutions,
Polytechnical Institutions, Alberta College of Arts & Design and Independent
Academic Institutions.

KPIRS Reporting Manual August 2012.docx August 2012
Page | 33
Specifications & Protocols:
Number of Full-time Academic Staff - The number of full-time teaching staff as reported to Statistics
Canada through the University Full-time Teaching Staff System. This includes teaching staff
employed as of October 1 of the reporting year and research staff who have an academic rank and a
salary scale similar to teaching staff, appointed on a full-time basis whose term of appointment is not
less than twelve months (including staff members on leave).
Books Authored / Co-authored - The total number of scholarly works reported by faculty members in the
form of books (including textbooks), chapters in books, and monographs, authored or co-authored by
the faculty members. Where more than one co-author are faculty members at the same institution,
the work is counted for each faculty member.
Books Edited / Co-edited - The total number of scholarly works reported by faculty members in the form
of books (including textbooks), chapters in books, and monographs, edited or co-edited by the faculty
members. Where more than one co-editor are faculty members at the same institution, the work is
counted for each faculty member.
Articles in Refereed Journals - The total number of articles and papers in refereed journals or conference
proceedings.
Articles in Non-refereed Publications - The total number of articles, papers, abstracts, reviews,
translations, creative writings, research reports, manuals, notes, bibliographies, concordances,
newsletters, scripts/musical scores, recordings, patents/trademarks/industrial designs, posters and
other works, in non-refereed publications. Includes works of art, professional musical performances,
artistic productions and compositions performed for external (public) audiences.
Peer-Reviewed Publications by Undergraduate Authors - Scholarly works in the form of books or articles
(as defined above) created by undergraduate authors or co-authors, published through the same
processes and media as peer-reviewed scholarly works created by faculty. Where co-authors are
students or faculty at the same institution, the work is counted for each co-author.
Data Elements & Reporting Systems:
Comprehensive
Academic &
Research
Institutions
(AU Only)
Baccalaureate
Academic and
Applied Studies
Institutions,
Polytechnical
Institutions
Specialized Arts
& Culture
Institutions
(ACAD only)
Independent
Academic
Institutions
Data reported through
Average number of full-time academic
staff Data Entry Data Entry Data Entry Data Entry
Number of publications reported Data Entry Data Entry Data Entry Data Entry
Number of citations received Data Entry Data Entry Data Entry Data Entry
Citation impact Data Entry Data Entry Data Entry Data Entry
Number of papers cited Data Entry Data Entry Data Entry Data Entry
Percentage of papers cited Data Entry Data Entry Data Entry Data Entry
Books authored or co-authored Data Entry Data Entry Data Entry Data Entry
Books edited or co-edited Data Entry Data Entry Data Entry Data Entry
Articles in refereed journals Data Entry Data Entry Data Entry Data Entry
Non-refereed publications Data Entry Data Entry Data Entry Data Entry
Conference presentations Data Entry Data Entry Data Entry Data Entry
Peer-reviewed publications by
undergraduate authors Data Entry Data Entry Data Entry Data Entry

KPIRS Reporting Manual August 2012.docx August 2012
Page | 34
3. Indicators for which Data Entry is not required by
Post-Secondary Institutions
Graduate Outcomes Survey In 2003-04, the Graduating Student Satisfaction and the Graduate Employment and Academic Outcomes
surveys were combined into one centralized Graduate Outcomes Survey for all post-secondary
institutions. In addition to the employment and satisfaction questions, the new survey collects
information on awareness and transitions, financing of post-secondary education and explores
graduates plans for lifelong learning. Institutions will no longer enter data from the surveys into KPIRS.
Instead, the data are given to Alberta Enterprise and Advanced Education from the survey contractor
and entered into KPIRS by Alberta Enterprise and Advanced Education.
Graduate Student Satisfaction
Satisfaction indicators are compiled from the results of the Graduate Outcomes Survey of students who
have graduated from each Alberta post-secondary institution to determine satisfaction with, and self-
reported benefits from, the education received. Results reported by program, include a number of
indicators common to all Alberta Enterprise and Advanced Educationsectors.
Indicator(s) Apply to:
Comprehensive
Academic &
Research
Institution
Baccalaureate
Academic and
Applied Studies
Institution,
Polytechnical
Institutions,
Specialized Arts
& Culture
Institutions
Comprehensive
Community
Colleges
Independent
Academic
Institutions
% of completers satisfied with the
overall quality of their educational
experience X X X X
% who would recommend same
program to someone else X X X X
% who would recommend same
institution to someone else X X X X
% of completers satisfied with the
quality of teaching/instruction- X X X X
% of completers reporting benefits -
• for continuing education X X X X
• academic benefit / in-depth
knowledge in a field X X X X
• skills needed for employment X X X X
• improved chances of good
income X X X X
• opportunity for personal
development X X X X
Scope:
All parchment program credentials (Certificate, Certificate Post Basic, Diploma, Diploma Post-Basic,
Applied Degree, Baccalaureate Degree, Master’s Degree, Certificate Post Degree, Diploma Post-Degree,
PhD)
Note:

KPIRS Reporting Manual August 2012.docx August 2012
Page | 35
The Graduate Outcomes Survey results for satisfaction questions are not comparable with prior years.
The time frame for surveying the graduates changed from being conducted on potential graduates in the
institution to being conducted 2 years after graduation on actual completers.
The Graduate Outcomes Survey is in Appendix A. A Graduate Satisfaction template is on page36.

KPIRS Reporting Manual August 2012.docx August 2012
Page | 36
Graduate Satisfaction Template

KPIRS Reporting Manual August 2012.docx August 2012
Page | 37
Graduate Employment and Academic Outcomes
The purpose of this information set is to determine the extent to which graduates find employment
related to their education and training within a reasonable period of time, pursue post-graduate
academic objectives or have intentions to do so. Data are reported from the results of follow-up surveys
of graduates two years after graduation from all post-secondary institutions.
Indicator(s) Apply to:
Comprehensive
Academic &
Research
Institution
Baccalaureate
Academic and
Applied Studies
Institution,
Polytechnical
Institutions,
Specialized Arts
& Culture
Institutions
Comprehensive
Community
Colleges
Independent
Academic
Institutions
# of labour force participants X X X X
Labour force participation rate X X X X
# employed:
Full-time X X X X
Part-time X X X X
In jobs related to subject area of
program X X X X
In jobs related to general skills
acquired X X X X
In jobs not related X X X X
# unemployed and looking for work X X X X
Average salary of those employed
full-time X X X X
# currently enrolled in a post-
secondary program
- full-time X X X X
- part-time X X X X
Main job related to subject area
knowledge X X X X
# qualified for main job X X X X
# satisfied with main job X X X X
Scope:
All parchment program credentials (Certificate, Certificate Post Basic, Diploma, Diploma Post-Basic,
Applied Degree, Baccalaureate Degree, Master’s Degree, Certificate Post Degree, Diploma Post-Degree,
PhD)
The Graduate Outcomes Survey Instrument is in Appendix A. A Graduate Employment template is on
page 38

KPIRS Reporting Manual August 2012.docx August 2012
Page | 38
Graduate Employment Template

KPIRS Reporting Manual August 2012.docx August 2012
Page | 39
Guidelines for Graduate Outcomes Survey
Timing of Surveys
• In 2003-2004, Alberta Enterprise and Advanced Education replaced the process of institutions
conducting Graduating Student Satisfaction and Graduate Employment surveys in alternating years
with a centralized Graduate Outcomes Survey. The Graduate Outcomes Survey will be conducted
biennially for all post-secondary institutions and will survey graduates two years following program
completion.
• Some institutions may have students who completed more than one program during the year.
Asking these individuals to complete two interviews/questionnaires would be problematic. The
survey consultant has a process in place to select which program to survey the graduate on.
Graduate Outcomes Survey Timetable
KPI Reporting Year
Graduate Outcome Survey
Cohort Result Information
2010 Survey
• Including both Graduate
Employment and Graduate
Satisfaction
• Graduates will be
surveyed between January
– March 2010
• All graduates of
parchment programs
between Fall 2007
and Spring 2008.
• Graduate of 2007-08
designated non-credit
programs will also be
included in the 2010
Survey.
• Results to be reported in
the 2010-11 Alberta
Enterprise and Advanced
EducationAnnual Report
• Institutional results should
be available from the
contractor by Summer
2010
• A system-wide report
should be available by Fall
2010
Next survey
2012 Survey
• Including both Graduate
Employment and Graduate
Satisfaction
• Graduates will be
surveyed between January
– March 2012
• All graduates of
parchment programs
between Fall 2009
and Spring 2010.
• Graduate of 2009-10
designated non-credit
programs will also be
included in the 2012
Survey.
• Results to be reported in
the 2012-13 Alberta
Enterprise and Advanced
EducationAnnual Report
• Institutional results should
be available from the
contractor by Summer
2012
• A system-wide report
should be available by Fall
2012

KPIRS Reporting Manual August 2012.docx August 2012
Page | 40
Conducting the Surveys
• The Graduate Outcomes Survey was developed in consultation with the post-secondary institutions.
Both institutions and the department have agreed on the survey question set. Currently,
institutions will not be able to add complementary questions to their surveys.
• The survey is conducted by an independent consultant hired by Alberta Enterprise and Advanced
Education.
• The Graduate Outcomes survey will be a telephone survey only. If an institution provides an email
address of the graduate, the graduate will have the option of responding by telephone or online.
• Information must be collected from the program completer/graduate. Proxy data (from parents or
roommates, for example) are not acceptable. Such individuals might know if the person is employed
or a student, but would be unreliable respondents for hours worked, income, fit between program
and job (employment survey), and satisfaction with the program and the institution (satisfaction
survey).
• The standardized introduction for the survey includes a note to the contract interviewers indicating
that: “If the individual does not live in this household, try to obtain a new telephone number. Explain
purpose of study (see below) if requested. Thank the person providing the information.” Requesting
a new phone number from someone other than the respondent might be seen as going beyond FOIP
guidelines. However, it is the department’s position that this is an acceptable practice since
telephone numbers are in the public domain and since the individual being asked (e.g., a parent or
former room-mate) can decide not to provide the new number. However, the contractor should also
willingly accept a “no, I can’t give you his/her number” response.
• Some marketing research and polling firms record telephone interviews for verification purposes. If
such a practice is employed by the contractor, the respondent will be informed that the interview is
being recorded and why, and must verbally consent to the recording of the interview. While the
recording is proceeding, a periodic beep (e.g., ten second intervals) must be clearly audible to the
respondent.
Census or Sample Survey and Response Rates
• A census will be conducted for all institutions with less than 1,000 graduates. For institutions with
more than 1,000 graduates a sample of graduates may be contacted. When a sample of graduates
is contacted the target number of responses will need to be sufficient to reach the following
confidence intervals.
• By institution at 95% confidence level, with ± 5% margin of error (or better)
• By field of study at 95% confidence level, with ± 5% margin of error (or better) for all
publicly funded post-secondary institutions in Alberta.
• By program at 95% confidence level, with ± 10% margin of error (or better)
Data Elements & Reporting Systems
• Program identification data for all institutions are reported through the Program Registry
System (PRS).
• Graduate records as reported in LERS (Learner Enrolment Reporting System) are used for the
survey. Alberta Enterprise and Advanced Education sent each institution an extract from LERS
containing their graduate records. Each institution expanded the extract to include student
contact information and forwarded the data file to the contractor. The information provided by
the Alberta Enterprise and Advanced Education extract and the information required from the
institution to complete the data file is reported in the table as shown in Appendix B (page 91).
• Alberta Enterprise and Advanced Educationrequires that the graduates reported in LERS are
the same as the list provided to the contractor.

KPIRS Reporting Manual August 2012.docx August 2012
Page | 41
• The results of the Graduate Outcomes Survey are provided directly to Alberta Enterprise and
Advanced Educationand imported into KPIRS for each post-secondary institution. The results
provided by the contractor will not contain any of the identifier data institutions were required
to add for the contractor to conduct the survey
• Post-secondary institutions are no longer required to enter survey data into KPIRS.
Note:
The department will not publicly report data at the program level if fewer than five
Completers/graduates responded in a survey.
The methodology for tabulating the survey results in KPIRS is provided in a document entitled
“KPIRS Methodology for the Graduate Outcomes Survey on 2007-08 Graduates”. This document will
be available at http://eae.alberta.ca/post-secondary/policy/facts.aspx

KPIRS Reporting Manual August 2012.docx August 2012
Page | 42
University Transfer Program Leavers by Alberta Student Number
The purpose of this indicator is to provide information with respect to the performance of approved
University Transfer programs at institutions offering such programs.
This indicator uses LERS data to identify a beginning cohort of students in a University Transfer program,
and tracks them by Alberta Student Number (ASN) in the LERS and ASI data for the following two years.
Additional data may be supplied by the institution to Alberta Enterprise and Advanced Education for
students known to have transferred to degree-granting institutions outside the Province of Alberta.
Indicator(s) Apply to:
Comprehensive
Academic &
Research Institution
Baccalaureate
Academic and Applied
Studies Institution,
Polytechnical
Institutions,
Specialized Arts &
Culture Institutions
Comprehensive
Community
Colleges
Independent
Academic
Institutions Transfer rates to other
institutions and program types
-
X
X
-
Level of Reporting: By program [see page.2 ]
• Baccalaureate & Applied Studies
• Comprehensive Community Colleges l
at ProgID level
at ProgID level
Scope: The approved University Transfer programs at institutions which offer such
programs: UT: Bachelor of Arts, UT: Bachelor of Business Administration,
UT: Bachelor of Education, UT: Bachelor of Engineering, UT: Bachelor of Fine
Arts, UT: Bachelor of Physical Education, UT: Bachelor of Science, UT:
Bachelor of Social Work, UT: General.

KPIRS Reporting Manual August 2012.docx August 2012
Page | 43
Data Elements & Reporting
Systems:
Comprehensive
Academic &
Research
Institution
Baccalaureate
Academic and
Applied Studies
Institution,
Polytechnical
Institutions,
Specialized Arts &
Culture
Institutions
Comprehensive
Community
Colleges
Independent
Academic
Institutions
Data reported through
Program identification data - PRS PRS -
“Cohort” (Enrolment in Year x) - LERS LERS -
UT Program Same Institution – Year
x+1, x+2
UT Leavers – Year x+1, x+2 - LERS, ASI LERS, ASI -
Degree Programs
University Level – Year x+1, x+2 - LERS, ASI LERS, ASI -
Applied Degree – Year x+1, x+2 - LERS, ASI LERS, ASI -
Other Credential Programs
Diploma – Year x+1, x+2 - LERS, ASI LERS, ASI -
Certificate – Year x+1, x+2 - LERS, ASI LERS, ASI -
UT Program Other Institution – Year
x+1, x+2
-
LERS, ASI LERS, ASI
-
Apprenticeship – Year x+1, x+2 - LERS, ASI LERS, ASI -
General Studies UN/PR – Year x+1,
x+2
-
LERS, ASI LERS, ASI
-
Other – Year x+1, x+2 - LERS, ASI LERS, ASI -
Out of Province UN Degree – Year
x+1, x+2
- Supplied by
Institution
Supplied by
Institution
-
Not in System - Calculated Calculated -
Specifications & Protocols:
“Cohort” (Enrolment in Year x) - The number of full-time students in a University Transfer program in a
given year as recorded in LERS.
UT Program Same Institution – Continuing in some UT program as in Year (x).
UT Leavers – No longer registered in any UT program as in Year (x).
University Level Degree Program (Same or Other institution) – Enrolled in a Baccalaureate program in
Year (x+1) or (x+2).
Applied Degree Program (Same or Other institution) – Enrolled in an Applied Degree program in Year
(x+1) or (x+2).
Diploma Program (Same or Other institution) – Enrolled in a Diploma program in Year (x+1) or (x+2).
Certificate Program (Same or Other institution) – Enrolled in a Certificate program in Year (x+1) or (x+2).
UT Program Other Institution – Enrolled in a UT Program at a different institution than in Year (x+1) or
(x+2).
Apprenticeship – Enrolled in an Apprenticeship program in Year (x+1) or (x+2).

KPIRS Reporting Manual August 2012.docx August 2012
Page | 44
Open Studies UN/PR – Enrolled in an Open Studies or non-parchment program (Credential type NA) in
Year (x+1) or (x+2).
Other – Enrolled in a non-parchment program (Credential types NA) at the institution in Year (x+1) or
(x+2).
Out of Province UN Degree – Transfers to a degree-granting institution outside the province of Alberta in
Year (x+1) or (x+2). Data must be supplied to Alberta Enterprise and Advanced Education in the
format as shown in the table below.
Not in System – Not enrolled in any of the previous categories either in Year (x+1) or (x+2).
Transfer to Degree - Granting Institutions Outside Alberta
Institutions may supply data to Alberta Enterprise and Advanced Education to identify students known
to have transferred to degree-level programs at institutions outside of Alberta. Institutions should
maintain auditable records of the source data. Data supplied should be in the following format in an MS
Excel spreadsheet, with one record for each transferring student.
Out of Province Transfer Submission Format
Element Name
Size
(length)
Element
Type
Edit
Note
1 Academic Year 4 X Cannot be blank The academic year that the student
began undergraduate studies at an
out-of-province university.
2 Provider Code 2 X Cannot be blank The submitting institution’s 2-digit
Alberta Enterprise and Advanced
Education provider code.
3 Program ID 9 X Cannot be blank PRS Program ID of the submitting
institution’s UT program.
4 Specialization
Code
10 X Cannot be blank PRS Specialization Code of the
submitting institution’s UT
program.
5 Cohort Year 4 X Cannot be blank. Must be two
years before the current
reporting year (latest LERS data
available).
The cohort year the student took a
UT program.
6 ASN 9 X Cannot be blank. The Alberta Student Number of the
student who transferred.
Element Types: D = Date N = Numeric X = Alphanumeric
Note:
A template report for University Transfer Program Leavers by ASN is on the next page.

KPIRS Reporting Manual August 2012.docx August 2012
Page | 45

KPIRS Reporting Manual August 2012.docx August 2012
Page | 46
Access Indicator - Credit Programs
Access indicators are measures of student participation that may be used to indicate accessibility to
post-secondary programs, levels of service provided by institutions and volumes of instructional activity:
• full-time student annual headcount - credit programs
• part-time student annual headcount - credit programs
• full-load equivalent enrolment - credit programs
• student contact hours - credit programs
Indicator(s) Apply to:
Comprehensive
Academic &
Research
Institution
Baccalaureate
Academic and Applied
Studies Institution,
Polytechnical
Institutions,
Specialized Arts &
Culture Institutions
Comprehensive
Community
Colleges
Independent
Academic
Institutions
Access – Credit Programs
Full-time student annual
headcount X X X X
Part-time student annual
headcount X X X X
Total student annual
headcount X X X X
Full load equivalent
enrolment X X X X
Level of Reporting: By program [see page 2 ]:
• Comprehensive Community College at SpecID level
• Polytechical Institutions at SpecID level
• Comprehensive Academic & Research
Institutions
• Specialized Arts and Culture Institutions
• Independent Academic Institutions
• Baccalaureate and Applied Studies
Institutions
at SpecID level
at SpecID level
at SpecID level
at SpecID level
Scope: Information required for all credit program types.

KPIRS Reporting Manual August 2012.docx August 2012
Page | 47
Data Elements & Reporting
Systems:
Comprehensive
Academic &
Research
Institution
Baccalaureate
Academic and
Applied Studies
Institution,
Polytechnical
Institutions,
Specialized Arts &
Culture
Institutions
Comprehensive
Community
Colleges
Independent
Academic
Institutions
Data reported through (or calculated by)
Enrolment in Credit Programs
Program identification data PRS PRS PRS PRS
Full-time student annual
headcount LERS LERS LERS LERS
Part-time student annual
headcount LERS LERS LERS LERS
Total student annual headcount LERS LERS LERS LERS
Full load equivalent enrolment Calculated Calculated Calculated Calculated
Number of program completers LERS LERS LERS LERS
Specifications and Reporting Protocols:
Credit programs are those recognized and included in the Program Registry System (PRS) program file as
acceptable for official enrolment reporting. The PRS Reporting Manual includes a detailed description of
terms and conditions to differentiate credit from non-credit programs, courses and enrolments and
should be used as a basis for credit and non-credit categorization. The PRS Reporting manual is available
on http://eae.alberta.ca/software/ and on the Campus Alberta Planning System (CAPS) website
(https://portal.aet.gov.ab.ca/apps/caps).
The credit enrolment data required for Access indicators are available for each institution through LERS.
These data will be extracted from LERS and transferred to the KPI Reporting System (KPIRS) for use
where credit enrolment data are required. They are available through LERS at an elemental
program/specialization level.
Full-time student annual headcount - For KPI purposes, the annual unduplicated headcount of full-time
students is the number of individual students who have been counted as full-time during at least one
session of the academic year. A full-time student in LERS is an active student in a Summer, Fall,
Winter or Spring session who is registered in that session for at least 30% of the full year load for the
program.
Part-time student annual headcount - For KPI purposes, the annual headcount of part-time students is
an unduplicated headcount of students enrolled in a reporting year who have not been counted as
full-time during at least one session of the year. Effectively, part-time enrolment will be equal to the
total headcount of individuals served during the year less the full-time headcount.
Total student annual headcount - An unduplicated count of the total number of students served in each
program during a reporting period.
Unduplicated headcounts - detail vs. institutional totals - Over the course of a reporting year, a
substantive number of students may enroll in more than one program. Accordingly, totals for
aggregations of programs/specializations arrived at by the simple addition of program totals will not
agree with unduplicated headcounts produced at the institutional level. LERS will be used to produce

KPIRS Reporting Manual August 2012.docx August 2012
Page | 48
unduplicated total headcounts at the institutional and other levels and these will be used in place of
totals produced by simply summing the program headcounts.
Full-load equivalent (FLE) enrolment - A unit measure of enrolment in which one FLE represents one
student for a standard year of study taking a Full Load. A full load represents the number of units
(credits, contact hours or some other units) of load required to complete the requirements for a
standard year of study (typically September through April) in a specific program. (For further detail,
see the LERS Reporting Manual.) LERS generates this data element for each student’s program and
these are aggregated to the ProgID/Specialization level for use in KPIRS.
Number of Program Graduates - The total number of students who have been determined by the
institution to have completed all graduation requirements for a program, during the reporting year for
which data are being reported and to whom the institution would therefore confer a parchment where
a parchment is offered.
Note:
An Access-Credit template is located on the next page.

KPIRS Reporting Manual August 2012.docx August 2012
Page | 49

KPIRS Reporting Manual August 2012.docx August 2012
Page | 50
Time to Completion Completion indicators are intended to show whether students complete a credential over a reasonable
period of time. The cohort includes full-time students when they enter the institutions in their initial
program choice.
The indicator includes all parchment program types and determines what percentage of the beginning
cohort of full-time students graduate within the normal program length plus 3 years. A student in a two
year diploma programs would be given five years to complete and a student in a four year baccalaureate
would be given 7 years to complete.
Indicator(s) Apply to:
Comprehensive
Academic &
Research
Institution
Baccalaureate
Academic and Applied
Studies Institution,
Polytechnical
Institutions, Specialized
Arts & Culture
Institutions
Comprehensive
Community
Colleges
Independent
Academic
Institutions
Credential Completion Except AU X X X
Level of Reporting: Information is generated from LERS and PRS
Scope: Information used for the following parchment types: Certificate, Diploma,
Post-Certificate, Post-Diploma, Applied Degree and Bachelor Degree.
Graduate programs are not included. (A similar indicator is to be developed
for Graduate programs.)
Data Elements & Reporting
Systems:
Comprehensive
Academic &
Research
Institution
Baccalaureate
Academic and
Applied Studies
Institution,
Polytechnical
Institutions,
Specialized Arts
& Culture
Institutions
Comprehensive
Community
Colleges
Independent
Academic
Institutions
Data reported through (or calculated by)
Program identification data PRS PRS PRS PRS
Entry stream {freshman} Calculated Calculated Calculated Calculated
Entry year LERS LERS LERS LERS
Earliest completion year Calculated Calculated Calculated Calculated
Program length PRS PRS PRS PRS
Entry cohort LERS LERS LERS LERS
Credential completion rate -
total Calculated Calculated Calculated Calculated
Notes:
� Students who entered a cohort as full-time students and whose status changes to part-time will
remain in the cohort.

KPIRS Reporting Manual August 2012.docx August 2012
Page | 51
� Internal transfer students (transferring within the institution to another “new” program in a
subsequent year) will remain in the “entry” cohort of the earlier year. Completion rates will be
reported if a program was completed of equal or greater value for those who completed their
entry program and for those who completed another program.
Below is a Time to Completion template.

KPIRS Reporting Manual August 2012.docx August 2012
Page | 52
Revenue - Related Indicators
The following revenue-related indicators will be reported at the institutional level:
• Alberta Enterprise and Advanced Education grants per FLE enrolment.
• Alberta Enterprise and Advanced Education grants as a percentage of total
operations revenues.
• Tuition fees per FLE enrolment.
• Other revenues per FLE enrolment.
• Enterprise revenues as a percentage of Alberta Enterprise and Advanced Education
grants.
Indicator(s) Apply to:
Comprehensive
Academic &
Research
Institution
Baccalaureate
Academic and Applied
Studies Institutions,
Polytechnical
Institutions,
Specialized Arts &
Culture Institutions
Comprehensive
Community
Colleges
Independent
Academic
Institutions
Alberta Enterprise and
Advanced Education grants
per FLE enrolment X X X X
Alberta Enterprise and
Advanced Education grants
as % of total operations
revenues X X X X
Tuition fees per FLE
enrolment X X X X
Other revenues per FLE
enrolment X X X X
Enterprise revenues as % of
Alberta Enterprise and
Advanced Education grants X X X X
Level of Reporting: By institution
• Comprehensive Community College at the institutional level
• Comprehensive Academic & Research
Institutions
at the institutional level
• Independent academic institutions
• Specialized Arts and Culture Institutions
• Baccalaureate and Applied Studies
Institutions
at the institutional level
at the institutional level
at the institutional level
Scope: All institutions.
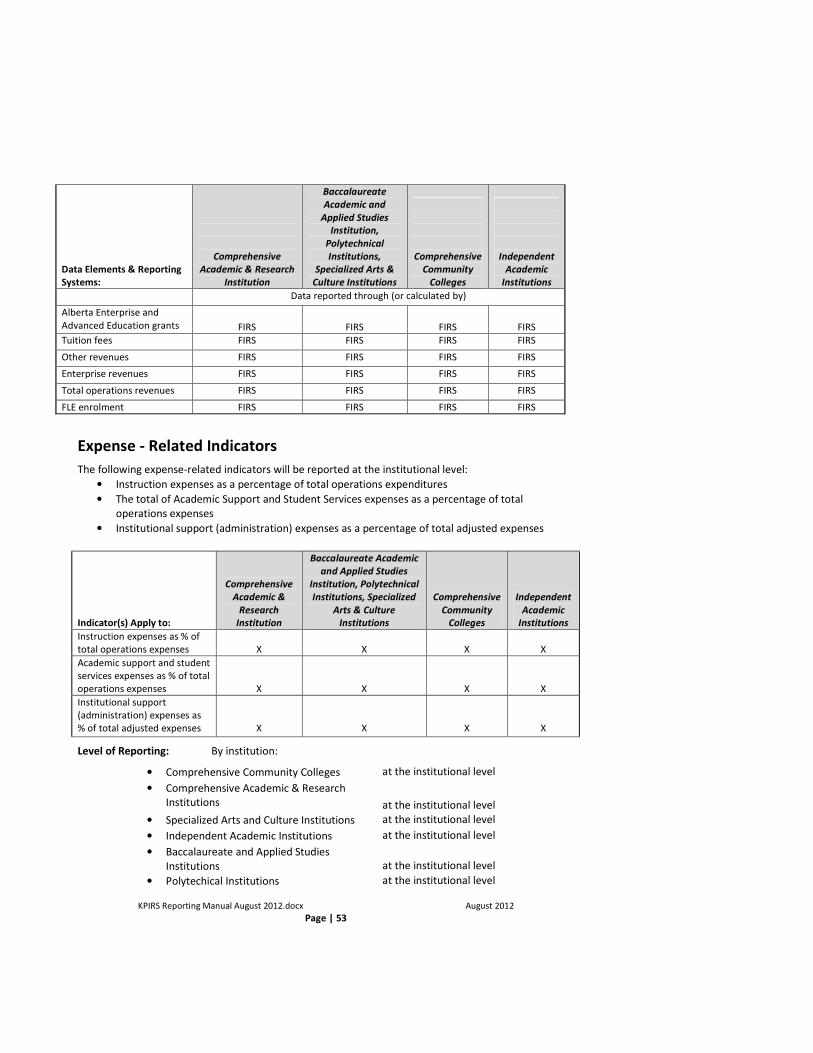
KPIRS Reporting Manual August 2012.docx August 2012
Page | 53
Data Elements & Reporting
Systems:
Comprehensive
Academic & Research
Institution
Baccalaureate
Academic and
Applied Studies
Institution,
Polytechnical
Institutions,
Specialized Arts &
Culture Institutions
Comprehensive
Community
Colleges
Independent
Academic
Institutions
Data reported through (or calculated by)
Alberta Enterprise and
Advanced Education grants FIRS FIRS FIRS FIRS
Tuition fees FIRS FIRS FIRS FIRS
Other revenues FIRS FIRS FIRS FIRS
Enterprise revenues FIRS FIRS FIRS FIRS
Total operations revenues FIRS FIRS FIRS FIRS
FLE enrolment FIRS FIRS FIRS FIRS
Expense - Related Indicators
The following expense-related indicators will be reported at the institutional level:
• Instruction expenses as a percentage of total operations expenditures
• The total of Academic Support and Student Services expenses as a percentage of total
operations expenses
• Institutional support (administration) expenses as a percentage of total adjusted expenses
Indicator(s) Apply to:
Comprehensive
Academic &
Research
Institution
Baccalaureate Academic
and Applied Studies
Institution, Polytechnical
Institutions, Specialized
Arts & Culture
Institutions
Comprehensive
Community
Colleges
Independent
Academic
Institutions
Instruction expenses as % of
total operations expenses
X
X
X
X
Academic support and student
services expenses as % of total
operations expenses
X
X
X
X
Institutional support
(administration) expenses as
% of total adjusted expenses
X
X
X
X
Level of Reporting: By institution:
• Comprehensive Community Colleges at the institutional level
• Comprehensive Academic & Research
Institutions at the institutional level
• Specialized Arts and Culture Institutions at the institutional level
• Independent Academic Institutions at the institutional level
• Baccalaureate and Applied Studies
Institutions
at the institutional level
• Polytechical Institutions at the institutional level

KPIRS Reporting Manual August 2012.docx August 2012
Page | 54
Scope: All institutions.
Data Elements & Reporting
Systems:
Comprehensive
Academic &
Research
Institution
Baccalaureate
Academic and
Applied Studies
Institution,
Polytechnical
Institutions,
Specialized Arts
& Culture
Institutions
Comprehensive
Community
Colleges
Independent
Academic
Institutions
Data reported through (or calculated by)
Instruction (& non-sponsored
research) expenses
FIRS FIRS FIRS FIRS
Academic support & student
services expenses FIRS FIRS FIRS FIRS
Institutional operations &
facilities expenses FIRS FIRS FIRS FIRS
Total operations expenses FIRS FIRS FIRS FIRS
Institutional support
(administration) expenses FIRS FIRS FIRS FIRS
Total adjusted expenses FIRS FIRS FIRS FIRS

KPIRS Reporting Manual August 2012.docx August 2012
Page | 55
4. Research Indicators for Comprehensive Academic &
Research Institutions and Independent Academic
Institutions
Research - Intensity
This indicator measures the intensity of research in relation to the total sphere of institutional activities.
The indicator is structured as a research “intensity” ratio relating revenues for sponsored research
activities to provincial operating grant support. The numerator includes all sponsored research
revenues - provincial and federal government and non-profit and for-profit sectors; the denominator is
the province’s undifferentiated contribution to all institutional functions and supports salaries for faculty
and other staff members as well as institutional infrastructure including facilities, services, library, and
computing support for research.
Data will be obtained to calculate three three-year rolling averages for each Alberta Comprehensive
Academic and Research Institutions, excluding Athabasca University, and for “peer group” comparisons
with similar Canadian institutions:
Alberta and Calgary Lethbridge
University of British Columbia Acadia University Dalhousie University Brandon University
University of Laval Brock University McGill University Mount Allison University
University of Manitoba Mount St.Vincent University McMaster University University of Prince Edward Island Memorial University Saint Mary’s University
University of Montreal Trent University University of Ottawa Wilfred Laurier University Queen’s University University of Winnipeg
University of Saskatchewan University of Sherbrooke
University of Toronto University of Western Ontario
Level of Reporting: By peer institution
Indicator(s) Apply to:
Comprehensive
Academic &
Research
Institution
Baccalaureate
Academic and
Applied Studies
Institution,
Polytechnical
Institutions,
Specialized Arts &
Culture
Institutions
Comprehensive
Community
Colleges
Independent
Academic
Institutions
Sponsored research revenues as %
of provincial operating grants
X
(except AU)
-
-
-

KPIRS Reporting Manual August 2012.docx August 2012
Page | 56
• Comprehensive Academic & Research
institutions
at the institutional level
Scope: University of Alberta, University of Calgary and The University of Lethbridge.
Specifications & Protocols:
Total sponsored research revenues and provincial grants are reported by each institution (Alberta
comprehensive academic and research institutions in Alberta and their peer group institutions) through
Statistics Canada and the Canadian Association of University Business Officers (CAUBO) using definitions
and formats developed by the latter, and from other Canadian universities, through CAUBO, for peer
group comparisons. Use of this source for both comprehensive academic and research institutions in
Alberta and their peer group institutions will ensure a reasonable level of comparability.
Data for the research intensity indicator are to be reported through KPIRS. Data are entered from
CAUBO by Alberta Enterprise and Advanced Education on behalf of the Universities of Alberta, Calgary
and Lethbridge.
Since the University of Alberta and the University of Calgary use the same peer group, one institution
should be identified to report the peer group data on behalf of both.
Indicator information is maintained for a five-year period ending with the reporting year, to enable the
calculation of three three-year rolling averages. Data for the most recent year available from Statistics
Canada and updates to prior year data are reported annually.
Sponsored Research Revenues - Total sponsored research revenues from federal, provincial and
municipal sources, individuals, profit and not-for-profit organizations, and foundations, including
grants, contracts and other types of awards. Normally these revenues are separate and segregated
from revenues that support the general operations of the institution.
Total Provincial Operations Grants - Grants provided through Alberta Enterprise and Advanced
Education including the general operations grant which fund program delivery and administration,
and general capital requirements within each institution’s mandate; grants provided through
“envelopes” established as part of the Alberta Enterprise and Advanced Education Funding
Mechanism; and conditional grants for specific programs or purposes which may be restricted and/or
may involve special terms, conditions, accounting and/or funds management requirements.
Sponsored Research / Provincial Operations Grants - Total sponsored research revenues expressed as a
percentage of total provincial operations grants.
Athabasca University
This indicator will not be reported for Athabasca University.
Data Elements & Reporting
Systems:
Comprehensive
Academic &
Research
Institution
Baccalaureate
Academic and
Applied Studies
Institution,
Polytechnical
Institutions,
Specialized Arts
& Culture
Institutions
Comprehensive
Community
Colleges
Independent
Academic
Institutions
Data reported through
Sponsored research revenues Data Entry - - -
Total provincial operating grants Data Entry - - -
Sponsored research revenues as %
of provincial operating grants Calculated - - -

KPIRS Reporting Manual August 2012.docx August 2012
Page | 57
Research Publications and Other Creative Works - Campus Based
Institutions Research performance can be reflected by the “citation impact” of research papers produced by faculty
members. The degree to which these papers contribute to and influence the field or fields to which they
apply is reflected by the citation impact of these papers. The citation impact indicator is expressed as
the ratio of:
• number of citations received
• number of publications reported
The following data provide context for this indicator:
• average number of full-time academic staff
• number of papers cited
• percentage of papers cited
Data will be obtained to report for five overlapping five-year periods for the University of Alberta, the
University of Calgary and the University of Lethbridge, and for “peer group” comparisons with similar
Canadian institutions:
Alberta and Calgary Lethbridge
University of British Columbia Acadia University Dalhousie University Brandon University
University of Laval Brock University McGill University Mount Allison University
University of Manitoba Mount St.Vincent University McMaster University University of Prince Edward Island Memorial University Saint Mary’s University
University of Montreal Trent University University of Ottawa Wilfred Laurier University Queen’s University University of Winnipeg
University of Saskatchewan University of Sherbrooke
University of Toronto University of Western Ontario
Citation impact data are not available for Athabasca University or the Independent Academic
Institutions. Measures of the extent of authorship and editorship of books; the extent of publication
through refereed and/or peer-reviewed journals, non-refereed publications or equivalent means; and
the numbers of conference presentations will be used to indicate the annual output of research and
other scholarly activity that is funded, facilitated and/or otherwise supported by these institutions.
Peer-reviewed publications by undergraduate authors are included as an indicator of the involvement of
students in research and scholarly activity at these institutions.
The University of Lethbridge provides faculty data to Alberta Enterprise and Advanced Education. The
University of Calgary provides the citation data. The data received are entered into KPIRS on behalf of
the institutions by Alberta Enterprise and Advanced Education.

KPIRS Reporting Manual August 2012.docx August 2012
Page | 58
Indicator(s) Apply to:
Comprehensive
Academic &
Research Institution
Baccalaureate
Academic and
Applied Studies
Institution,
Polytechnical
Institutions,
Specialized Arts
& Culture
Institutions
Comprehensive
Community
Colleges
Independent
Academic
Institutions
Citation impact indicator X - - -
Number of full-time academic staff X - - -
Number of papers cited X - - -
Percentage of papers cited X - - -
Level of Reporting: By peer institution
• Campus-based Comprehensive
Academic and Research Institutions
at the institutional level
Scope: University of Alberta, University of Calgary and University of Lethbridge.
Athabasca University and the Independent Academic Institutions report in a
special format.
Data Elements & Reporting
Systems:
Comprehensive
Academic &
Research Institution
Baccalaureate
Academic and
Applied Studies
Institution,
Polytechnical
Institutions,
Specialized Arts &
Culture Institutions
Comprehensive
Community
Colleges
Independent
Academic
Institutions
Data reported through
Average number of full-time
academic staff Data Entry - -
Number of publications
reported Data Entry - - -
Number of citations received Data Entry - - -
Citation impact Calculated - - -
Number of papers cited Data Entry - - -
Percentage of papers cited Calculated - -
Specifications & Protocols:
The Institute for Scientific Information (ISI) produces a database of summary publication and citation
statistics that reflect research performance in the sciences and social sciences for Canadian universities.
The database consists of counts of publications and citations appearing in journals indexed by ISI over
the period. All these journals are peer-reviewed. For purposes of the database ISI defines publications
as including articles, notes, reviews, and proceedings papers, but not other types of items such as
editorials, letters, corrections and abstracts or books. Papers are attributed to an institution if at least
one author’s address identified the institution.

KPIRS Reporting Manual August 2012.docx August 2012
Page | 59
Three Alberta comprehensive academic and research institutions and their “peer group” institutions are
among the 45 Canadian universities included in the database. The University of Calgary subscribes to
the ISI database and provides the information to Alberta Enterprise and Advanced Education who enters
the data on behalf of the institutions.
Indicator information is maintained for a ten-year period ending with the reporting year, to enable the
calculation of averages for five overlapping five-year periods. Data from the most recent ISI database
(which may include updates to prior year data) are reported annually.
Full-time academic staff - The average number of full-time teaching staff as reported to Statistics Canada
through the University Full-time Teaching Staff System for each five-year period. This includes
teaching staff employed as of October 1 of the reporting year and research staff who have an
academic rank and a salary scale similar to teaching staff, appointed on a full-time basis whose term
of appointment is not less than twelve months (including staff members on leave).
Number of citations received - Total number of citations received during the time period.
Number of publications reported - Total number of papers (articles, notes, reviews, and proceedings
papers) reported through the ISI database for an institution during a given time period.
Citation impact - Total number of citations received during a given time period per publication reported
during the period.
Number of papers cited - Total number of papers cited during the time period.
Percentage of papers cited - Total number of papers cited during a time period expressed as a
percentage of the total number of publications reported during the period.

KPIRS Reporting Manual August 2012.docx August 2012
Page | 60
Research - Council Success Rates
National granting councils use relatively similar criteria applied consistently over time to adjudicate
national peer-reviewed grant competitions. In these competitions, a variety of factors are taken into
account including the quality and innovativeness of the proposed research and the reputation(s),
professional contributions, published results, and past performance of the researcher(s). On the
assumption that faculty members undertaking quality research will fare well in these competitions, two
indicators have been defined at the institutional level:
• the number of grant awards in relation to the number of applications made
to these councils
• the average dollar value of award received
Data will be provided by the three campus-based comprehensive academic and research
institutions (U of A, U of C and U of L) and where available for “peer group” comparisons:
Alberta and Calgary Lethbridge
University of British Columbia Acadia University Dalhousie University Brandon University
University of Laval Brock University McGill University Mount Allison University
University of Manitoba Mount St.Vincent University McMaster University University of Prince Edward Island Memorial University Saint Mary’s University
University of Montreal Trent University University of Ottawa Wilfred Laurier University Queen’s University University of Winnipeg
University of Saskatchewan University of Sherbrooke
University of Toronto University of Western Ontario
Level of Reporting: By peer institution
• Comprehensive Academic and Research
Institutions)
at the institutional level
Scope: The 3 campus-based comprehensive academic and research institutions.
Peer group comparisons will not be made for Athabasca University.
Indicator(s) Apply to:
Comprehensive
Academic &
Research
Institution
Baccalaureate Academic
and Applied Studies
Institution, Polytechnical
Institutions, Specialized
Arts & Culture Institutions
Comprehensive
Community
Colleges
Independent
Academic
Institutions
Number of awards /
number of applications X - - -
Average dollar value of
award
X - - -

KPIRS Reporting Manual August 2012.docx August 2012
Page | 61
Specifications & Protocols:
Information on grants awarded (number of applications, number of awards, dollar value) is available
from the Councils, both shortly after each competition and in later consolidated versions. Information
on academic staff members is reported to Statistics Canada through the University Full-time Teaching
Staff System.
Because the payout and reporting practices of the three councils vary, between councils and within each
council over time, careful attention must be given to appropriate calculations for establishing the
average annual dollar value of awards from the three councils.
The most current indicator should be accompanied by two historical reference points, which would
provide information spanning five years. Nationally comparative data on grants should be available
within a year of the end of the fiscal year, but since Statistics Canada must be relied upon for nationally
comparable academic staff numbers, there will be a two-year delay.
This indicator is more sensitive to work in the disciplines of engineering, the humanities, medicine, the
sciences, and the social sciences than to the scholarly work carried out in the fine arts or some of the
professional faculties. Nevertheless, using appropriate comparisons, the results are a reasonable proxy
for the whole of the institution. The size of the eligible community and resources available to serve the
community varies significantly from council to council. When making comparisons, it is important,
therefore, to limit scope to institutions with appropriate patterns of faculties and schools so that similar
ranges of disciplines are represented in the calculations.
The University of Alberta provides the disaggregated data for all the comprehensive academic and
research institutions to the department and the data are entered into KPIRS on behalf of the
institutions.
Indicator information is maintained for a five-year period ending with the reporting year, to enable the
calculation of three three-year rolling averages. Data for the most recent year available from Statistics
Canada and updates to prior year data are reported annually.
Granting Council - One of the three national granting councils: Medical Research Council (MRC), the
Natural Science and Engineering Research Council (NSERC), the Social Sciences and Humanities
Research Council (SSHRC).
Full-time academic staff - The number of full-time teaching staff as reported to Statistics Canada through
the University Full-time Teaching Staff System. This includes teaching staff employed as of October 1
of the reporting year and research staff who have an academic rank and a salary scale similar to
Data Elements & Reporting
Systems:
Comprehensive
Academic &
Research
Institution
Baccalaureate
Academic and Applied
Studies Institution,
Polytechnical
Institutions,
Specialized Arts &
Culture Institutions
Comprehensive
Community
Colleges
Independent
Academic
Institutions
Data reported through
Number of applications Data Entry - - -
Number of awards Data Entry - - -
Number of awards / number of
applications Calculated - - -
Dollar value of awards Data Entry - - -
Average value of award Calculated - - -

KPIRS Reporting Manual August 2012.docx August 2012
Page | 62
teaching staff, appointed on a full-time basis whose term of appointment is not less than twelve
months (including staff members on leave).
Number of Applications - U of A and U of C, these are the aggregate number of applications to the three
national granting councils in the general category of “operating” or “research” grants, for research
programs carried out primarily by individuals or (much less frequently) by small teams of faculty
members.
For the U of L and AU, these are the number of applications to each council. Specifically, these
include Standard Research Grants for SSHRC; Individual, Team and Project Research Grants for NSERC
as well as the Research Grant portions only of Women’s Faculty Awards and University Research
Fellowships; and Operating and Program Grants for MRC. They exclude applications for Networks of
Centres of Excellence (NCE) grants, SSHRC Major Collaborative Research Initiatives, MRC Groups, or
any equipment grants, infrastructure support, stipend awards, scholarships or fellowships, targeted
or joint-funded research projects, or other special purpose awards.
Number of Awards - The aggregate number of awards in the same categories identified in the
specifications for Number of Applications.
Dollar Value of Awards - The aggregate annual dollar value of new grants awarded by the three national
councils in the same categories identified in the specifications for Number of Applications.
Number of Awards / Number of Applications - The aggregate number of awards divided by the
aggregate number of applications and expressed as a percentage, in the same categories identified in
the specifications for Number of Applications.
Average Value of Award - The total dollar value of awards divided by the aggregate number of awards,
in the same categories identified in the specifications for Number of Applications.

KPIRS Reporting Manual August 2012.docx August 2012
Page | 63
Research - Graduate Students Graduate students enrolled in thesis programs participate in and contribute to the research mandate of
the institution and quality faculty members engaged in research and scholarship attract students
desiring research degrees. Accordingly, the higher the proportion of thesis based program graduate
student enrollees to academic staff, the more research intensive and higher the quality of the academic
staff and research of the institution. Unlike undergraduate students who are relatively less mobile,
graduate students are more often in a position to move among institutions and, having completed a first
degree, are more sensitive to the quality of and will seek places at those institutions that have the better
post-graduate offerings.
At the same time, prospective graduate students are attracted to institutions with higher levels of
financial support. There tend to more scholarships and other financial support opportunities at
institutions with intensive research programs and where a high priority is attached to providing support
from internal sources. Quality academic staff attracts additional external research funds, which provide
paid research positions for graduate students and, where needed, the resources, equipment, and other
essentials needed for these students to complete their own research.
The following indicators deal with research as it is interrelated with graduate instruction and training,
and the research activities of graduate students:
•••• graduate student enrolment in thesis (i.e., research) based programs relative to
the number of full-time academic staff.
•••• total graduate enrolment per full-time academic staff.
•••• the number of competitive national graduate scholarships and fellowships relative
to the number of full-time academic staff.
For each of these indicators and each comprehensive academic and research institution, data will be
obtained for a number of similar Canadian institutions for “peer group” comparisons:
Alberta and Calgary
University of British Columbia Dalhousie University
University of Laval McGill University
University of Manitoba McMaster University Memorial University
University of Montreal University of Ottawa Queen’s University
University of Saskatchewan University of Sherbrooke
University of Toronto University of Western Ontario

KPIRS Reporting Manual August 2012.docx August 2012
Page | 64
Indicator(s) Apply to:
Comprehensive
Academic &
Research
Institution
Baccalaureate
Academic and Applied
Studies Institution,
Polytechnical
Institutions, Specialized
Arts & Culture
Institutions
Comprehensive
Community
Colleges
Independent
Academic
Institutions
Graduate students (thesis) / full-time
academic staff X - - -
Total graduate students / full-time
academic staff X - - -
Number of graduate scholarships and
fellowships / full-time academic staff X - - -
Level of Reporting: By peer institution
• Comprehensive Academic and Research
Institutions
at the institutional level
Scope: University of Alberta and University of Calgary.
Data Elements & Reporting Systems:
Comprehensive
Academic &
Research Institution
Baccalaureate
Academic and
Applied Studies
Institution,
Polytechnical
Institutions,
Specialized Arts &
Culture
Institutions
Comprehensive
Community
Colleges
Independent
Academic
Institutions
Data reported through
Full-time academic staff Data Entry - - -
Total graduate students Data Entry - - -
Total graduate students / full-time
academic staff Calculated - - -
FLE graduate students (thesis programs) Data Entry - - -
FLE graduate students (thesis programs)
/ full-time academic staff Calculated - - -
Number of granting council graduate
scholarships and fellowships Data Entry - - -
Number of graduate scholarships and
fellowships / full-time academic staff Calculated - - -
Specifications & Protocols:
The Canadian Association of Graduate Schools (CAGS) publishes an Annual Statistical Report with
enrolment data. Information about academic staff can be obtained from Statistics Canada’s Teachers in
Universities. The CAGS report appears annually, usually in the fall following the end of the traditional
academic year. The Statistics Canada report usually appears a year later. The CAGS report is based on
data supplied by the graduate schools using agreed definitions.

KPIRS Reporting Manual August 2012.docx August 2012
Page | 65
Full-time equivalent enrolment is used for indicators applying only to University of Alberta and
University of Calgary. Total headcount (full-time plus part-time, not weighted) is used for national peer
group comparisons since FLE data are not available inter-provincially on a comparative basis.
Assuming performance indicators are to be reported in the fall of each year; the most recent
institutional data should be used and converted to nationally comparable data as soon as the latter
become available. The most current indicator should be accompanied by four historical reference
points; the four immediately preceding years. As nationally comparative data may not be available for
one or two years after internal data are available, the full report may include one or two years of
unconverted data and three or four years of converted data. Comprehensive academic and research
institutions offering graduate programs subscribe to the CAGS reporting definitions. The conversion of
internal to nationally comparable data should not result in significant differences from year to year.
The indicators are not directly indicative of the quality of academic staff or research in areas where
course-based programs are offered. However, it is not unusual for some faculties, particularly in the
professional areas, to offer both thesis and non-thesis programs. In this regard, care must be taken in
interpreting Indicator 4; it should be expected to be lower in these faculties than in facilities with no
course-based graduate programs. Moreover, in the humanities and social sciences (the SSHRC
disciplines) the breadth of Ph.D. offerings in these disciplines will have an effect. SSHRC awards are for
doctoral study and institutions with limited Ph.D. offerings in these disciplines will not fare as well.
Thus, at the institutional level, it is important to limit comparisons to institutions with similar patterns of
faculties and schools. For example, it would be inappropriate to compare comprehensive institutions
with a narrow range of graduate programs with those that have a nearly full complement of programs in
virtually all disciplines. There should also be comparability in the levels at which degrees are offered, as
between master’s and doctor’s programs.
Because of their limited graduate enrolments, Athabasca University and the University of Lethbridge are
not reporting these indicators.
Since the University of Alberta and the University of Calgary use the same peer group, one institution
should be identified to report the peer group data on behalf of both.
Full-time Academic Staff - The number of full-time teaching staff as reported to Statistics Canada
through the University Full-time Teaching Staff System. This includes teaching staff employed as of
October 1 of the reporting year and research staff who have an academic rank and a salary scale
similar to teaching staff, appointed on a full-time basis whose term of appointment is not less than
twelve months (including staff members on leave). Reported for the comprehensive academic and
research institutions in Alberta and their national peer group institutions.
FLE Graduate Students (Thesis Programs) - Full-load equivalent enrolments including students in a
qualifying year or as candidates for a Masters or Ph.D. degree in a program for which the completion
of a thesis is a requirement for the degree. This is reported for only the comprehensive academic
and research institutions.
FLE Graduate Students (Thesis Programs) per Full-time Academic Staff - Full-load equivalent graduate
student enrolment in thesis programs divided by full-time academic staff. This is reported for only
the comprehensive academic and research institutions.
Total Graduate Students - Total graduate enrolment in thesis and course-based Master’s and Ph.D.
programs, calculated as full-time students plus part-time students, not weighted. Reported for
comprehensive academic and research institutions and their national peer group institutions.
Total Graduate Students per Full-time Staff - Total graduate students enrolment in thesis and course-
based Master’s and Ph.D. programs (full-time plus part-time, not weighted) divided by the number of

KPIRS Reporting Manual August 2012.docx August 2012
Page | 66
full-time academic staff. Reported for the comprehensive academic and research institutions and
their national peer group institutions.
Granting Council Graduate Scholarships & Fellowships - The number of scholarships and fellowships
awarded to graduate students through the national council (MRC, NSERC and SSHRC) annual
competitions. Reported for the comprehensive academic and research institutions and their national
peer group institutions.
# of Awards / Full-time Academic Staff - The number of scholarships and fellowships awarded divided
by the number of full-time academic staff members in the corresponding year. Reported for the
comprehensive academic and research institutions and their national peer group institutions.

KPIRS Reporting Manual August 2012.docx August 2012
Page | 67
Research - Research Impact
These indicators measure returns from investments in research facilities, activities and infrastructure at
the comprehensive academic and research institutions. Research funds from all sources have an
important economic impact on the local or regional economy, in terms of employment and job creation
as well as through other types of expenditures in the local economy. Five indicators are included:
• a “council support” ratio which relates revenues from the three national granting
councils to total sponsored research revenues.
• “community and industry support” ratios which relate revenues for research of an
applied nature supported by grants, contracts and contributions from non-
government sources, to total sponsored research revenues, and to full-time
academic staff.
• an “industry sponsored research” ratio that relates industry sponsored research
support to community and industry support.
• total annual licensing revenues to indicate both the value of useful products that
originate in university research and the effort of researchers and university-industry
liaison structures to move these products into industry and society.
• disclosures of inventions and other commercially valuable intellectual property.
For these indicators and for each comprehensive academic and research institutions, data will be
obtained for a number of similar Canadian institutions for “peer group” comparisons:
Alberta and Calgary Lethbridge
University of British Columbia Acadia University Dalhousie University Brandon University
University of Laval Brock University McGill University Mount Allison University
University of Manitoba Mount St.Vincent University McMaster University University of Prince Edward Island Memorial University Saint Mary’s University
University of Montreal Trent University University of Ottawa Wilfred Laurier University Queen’s University University of Winnipeg
University of Saskatchewan University of Sherbrooke
University of Toronto University of Western Ontario

KPIRS Reporting Manual August 2012.docx August 2012
Page | 68
Indicator(s) Apply to:
Comprehensive
Academic &
Research Institution
Baccalaureate
Academic and
Applied Studies
Institution,
Polytechnical
Institutions,
Specialized Arts &
Culture
Institutions
Comprehensive
Community
Colleges
Independent
Academic
Institutions
Council support ratio (council
sources / total sponsored
research revenues) U of A, U of C, U of L - - -
Community & industry
sources / full-time academic
staff U of A, U of C, U of L - - -
Community & industry
sources / total sponsored
research revenues U of A, U of C, U of L - - -
Industry sources /
community & industry
sources U of A, U of C, U of L - - -
Total licensing revenues U of A, U of C
Invention disclosures U of A, U of C - - -
Level of Reporting: By peer institution
• Comprehensive academic and research
institutions
at the institutional level
Scope: University of Alberta and University of Calgary for all indicators.
The University of Lethbridge for “community & industry support” ratios.
Data elements & Reporting
Systems:
Comprehensive
Academic &
Research
Institution
Baccalaureate
Academic and
Applied Studies
Institution,
Polytechnical
Institutions,
Specialized Arts &
Culture Institutions
Comprehensive
Community
Colleges
Independent
Academic
Institutions
Data reported through
Total sponsored research revenues Data Entry - - -
Support from council sources Data Entry - - -
Council support ratio (council
sources / total sponsored research
revenues) Calculated - - -
Support from community &
industry sources Data Entry - - -
Community & industry sources /
total sponsored research revenues Calculated - - -
Support from industry sources Data Entry - - -
Industry sources / community & Calculated - - -

KPIRS Reporting Manual August 2012.docx August 2012
Page | 69
industry sources
Total licensing revenues Data Entry - - -
Invention disclosures Data Entry - - -
Specifications & Definitions:
Research revenues are reported by the comprehensive academic and research institutions and their
peer group institutions through Statistics Canada and the Canadian Association of University Business
Officers (CAUBO) using definitions and formats developed by the latter, and available to Alberta and
other Canadian universities, through CAUBO, for peer group comparisons. For the most recent year(s),
CAUBO reports (and peer comparison data) may not be available, preliminary data for comprehensive
academic institutions can be obtained from the financial records of each institution.
These indicators are not being reported by Athabasca University.
Data are provided by CAUBO are entered into KPIRS by Alberta Enterprise and Advanced Education on
behalf of the institutions.
Indicator information is maintained for a five-year period ending with the reporting year, to enable the
calculation of three three-year rolling averages. Data for the most recent year available from Statistics
Canada and updates to prior year data are reported annually.
Sponsored Research Revenues - Total sponsored research revenues from federal, provincial and
municipal sources, individuals, profit and not-for-profit organizations, and foundations, including
grants, contracts and other types of awards. Normally these revenues are separate and segregated
from revenues that support the general operations of the institution.
Support from Council Sources - The aggregate of grants received from national granting councils: the
Medical Research Council (MRC), the Natural Science and Engineering Research Council (NSERC), and
the Social Sciences and Humanities Research Council (SSHRC). This corresponds to the “Federal
Government grants” for the three specified councils, in the CAUBO format.
Council Support Ratio (Councils Sources / Total Sponsored Research Revenues) - Total grants and awards
from the three national granting councils expressed as a percentage of total sponsored research
revenues.
Support from Community & Industry Sources - Bequests, donations and non-government grants for
sponsored research, from individuals, corporate commercial enterprises, foundations and non-profit
organizations. This corresponds to “Bequests, donations, non-government grants” with the sub-
classifications “Individuals, Corporate business enterprises, Foundations and Non-profit
organizations” in the CAUBO format.
Community & Industry Sources / Total Sponsored Research Revenues - Total bequests, donations and
non-government grants for research purposes expressed as a percentage of the total sponsored
research revenues.
Full-time Academic Staff - The number of full-time teaching staff as reported to Statistics Canada
through the University Full-time Teaching Staff System. This includes teaching staff employed as of
October 1 of the reporting year and research staff who have an academic rank and a salary scale
similar to teaching staff, appointed on a full-time basis whose term of appointment is not less than
twelve months (including staff members on leave). Reported for the comprehensive academic and
research institutions and their national peer group institutions.
Support from Community & Industry Sources / Full-time Academic Staff - Support from Community &
Industry Sources divided by the number of full-time academic staff.

KPIRS Reporting Manual August 2012.docx August 2012
Page | 70
Support from Industry Sources - Sponsored research revenues including grants, contracts, awards and
other funding support from corporate commercial enterprises (private business, commercial and
industrial organizations and/or agencies acting on their behalf). This isolates the “corporate business
enterprise” sub-category. Although not published in the CAUBO/Statistics Canada reports, this data
can be obtained from CAUBO for peer group comparisons.
Industry Sources / Community & Industry Sources - Total industry sponsored research revenues
expressed as a percentage of total sponsored research revenues from community and industry
sources.
Total Licensing Revenues - Revenues accruing from the commercial and/or industrial application and
development of patents, industrial designs, and other intellectual property. These data are not
currently reported at a provincial or national level but will be obtained from reports published by the
Association of University Technology Managers, Inc. (AUTM)1. Peer-group comparisons will be limited to
institutions reporting through the AUTM surveys.
Invention Disclosures - Disclosures of inventions and other commercially valuable intellectual property.
Not currently reported at a provincial or national level but will be obtained from AUTM.
1 Association of University Technology Managers, Inc., 111 Deer Lake Road, Suite 100 Deerfield, IL 60015

KPIRS Reporting Manual August 2012.docx August 2012
Page | 71
5. Appendices:
Appendix A: Graduate Outcomes Survey Documents
Alberta Graduate Outcomes Survey, Class of 2007-08
CATI Survey
Hello, may I please speak to (name of graduate)?
[If the individual is not available try to find out when they might be available. Explain purpose of
study (see below) if requested. Thank the person providing the information. Do not collect survey
information from parents, roommates or others.]
[If the individual does not live in this household, try to obtain a new telephone number or email
address. Explain purpose of study (see below) if requested. Thank the person providing the
information.]
New contact - phone Collect new phone #
New contact - email Collect email address
Hi, my name is and I’m with Harris/Decima. I’m calling on behalf of Alberta Advanced
Education & Technology and (name of institution). We are conducting a survey of
post-secondary students who completed programs of study in the fall of 2007 or the spring of 2008 at
(name of institution). The purpose of the study is to provide summary information for
Alberta Advanced Education & Technology about graduates’ satisfaction as well as their employment
and educational experiences, and to provide detailed information to (name of
institution) with ideas about how to improve their programs. Are you willing to complete this survey? It
will only take about 15 minutes and you can complete it by telephone or online.
Yes – Available now Continue
Yes – Call back Schedule call back
Yes - Online Collect email address
Refusal Thank and terminate
Before we start, I’d like to assure you that your participation is voluntary and that any information you
provide will be kept confidential. If you wish to stop this survey at any time please just tell me. Your
responses will be shared with participating post-secondary institutions but will not be attributable on an
individual basis. When results are published, only summary or aggregated information will be provided.
Your personal information is protected by the Freedom of Information and Protection of Privacy Act.
[If the student questions the validity of the study, or has any questions about the Freedom of
Information and Protection of Privacy Act, please tell them they can contact the persons listed below
for verification.]
Institution Survey Contact Telephone Number
The CATI system will generate the name and telephone number for the institutional contact.

KPIRS Reporting Manual August 2012.docx August 2012
Page | 72
[IF ASKED: The overall report of findings from this project will be publicly available on the Alberta
Enterprise and Advanced Education website in the fall of 2010. The report from the last wave of this
research is currently available on this website.]
BACKGROUND
First, I would like to start by asking some general background questions.
1. What was the highest grade level you completed in the K-12 system, not including adult
upgrading?
1. Grade 1
2. Grade 2
3. Grade 3
4. Grade 4
5. Grade 5
6. Grade 6
7. Grade 7
8. Grade 8
9. Grade 9
10. Grade 10
11. Grade 11
12. Grade 12
13. Grade 13
14. Kindergarten
88. Don’t know
99. No response
2. Which city or town were you living in when you last attended high school or another grade in
the K-12 system, not including adult upgrading? [DO NOT READ]
1. Edmonton
2. Calgary
3. Lethbridge
4. Red Deer
5. Grande Prairie
6. Medicine Hat
7. Fort McMurray
8. Elsewhere in Alberta (specify) _________________________
9. Elsewhere in Canada (specify province/territory) ________________
77. Outside Canada (specify country) _______________
88. Don’t know
99. No response
3. What year did you last attend school in the K-12 system, not including adult upgrading? [ENTER
FOUR DIGIT YEAR]
8888. Don’t know
9999. No response

KPIRS Reporting Manual August 2012.docx August 2012
Page | 73
4. Which city or town were you living in when you first applied for post-secondary studies, not
including adult upgrading? [DO NOT READ]
1. Edmonton
2. Calgary
3. Lethbridge
4. Red Deer
5. Grande Prairie
6. Medicine Hat
7. Fort McMurray
8. Elsewhere in Alberta (specify) _________________________
9. Elsewhere in Canada (specify province/territory) ________________
77. Outside Canada (specify country) _______________
88. Don’t know
99. No response
5. In what year did you begin post-secondary studies, not including adult upgrading? [ENTER
FOUR DIGIT YEAR]
8888. Don’t know
9999. No response
6. Have you permanently relocated to a different city or town since the time of your graduation
from ________________ (name of institution)?
1. Yes
2. No � GO TO Q10
88. Don’t know � GO TO Q10
99. No response � GO TO Q10
7. What was your primary reason for moving? [DO NOT READ, SELECT ONLY ONE OPTION]
1. To attain employment
2. Improve employment situation
3. Family move/obligations (including children, extended family, etc)
4. To be independent/move away from family
5. Housing opportunities/cost of living
6. Proximity to work/services/opportunities
7. Moving back to family home
8. To acquire further education
9. Improve social life
77. Other (specify) ________________
88. Don’t know
99. No response

KPIRS Reporting Manual August 2012.docx August 2012
Page | 74
8. Which city or town did you relocate to? [DO NOT READ]
1. Edmonton
2. Calgary
3. Lethbridge
4. Red Deer
5. Grande Prairie
6. Medicine Hat
7. Fort McMurray
8. Elsewhere in Alberta (specify) _________________________
9. Elsewhere in Canada (specify province/territory) ________________
77. Outside Canada (specify country) _______________
88. Don’t know
99. No response
(Note: If respondent has relocated more than once, enter where they are now)
9. Was this your hometown?
1. Yes
2. No
88. Don’t know
99. No response
10. I will now ask you a series of questions about your post-secondary educational experience.
Using a 5-point scale where 1 means “not useful” and 5 means “very useful”, how useful were
each of the following sources of information in helping you decide which program and
institution to attend? If some of these sources of information are not applicable please indicate
so. [RANDOMIZE AND READ]
not useful very useful N/A DK NR
a) Institutional calendars (online) 1 2 3 4 5 77 88 99
m) Institutional calendars (print) 1 2 3 4 5 77 88 99
b) Alberta Learning Information Service1 2 3 4 5 77 88 99
(ALIS) website (www.alis.ab.ca)
i) Institution website 1 2 3 4 5 77 88 99
c) School or guidance counselors 1 2 3 4 5 77 88 99
j) Career fair/Open house
/PSI High School presentation 1 2 3 4 5 77 88 99
d) Teachers 1 2 3 4 5 77 88 99
e) Career counselors 1 2 3 4 5 77 88 99
k) Co-workers/employer 1 2 3 4 5 77 88 99
f) Parents or other relatives 1 2 3 4 5 77 88 99
g) Friends 1 2 3 4 5 77 88 99
l) Student recruiters
/PSI program representatives 1 2 3 4 5 77 88 99
h) Other (specify) ________________ 1 2 3 4 5 77 88 99

KPIRS Reporting Manual August 2012.docx August 2012
Page | 75
11. What was your primary goal upon entering ________________ (name of institution)? [DO NOT
READ]
1. Preparation for a specific degree or diploma
2. Completion of a specific degree or diploma
3. Expanded knowledge in a particular subject area
4. Expand general education level
5. Employment
6. Improve skills required for the job you had at the time
7. To change careers
8. Obtain high school equivalency
77. Other (specify) _______________
10. Did not set a goal � GO TO Q14
88. Don’t know � GO TO Q14
99. No response � GO TO Q14
12. Did you achieve your primary goal?
1. Yes � GO TO Q14
2. No
88. Don’t know � GO TO Q14
99. No response � GO TO Q14
13. Why not? [DO NOT READ]
1. Changed program/career plans/goals
2. Personal illness or disability
3. Family responsibilities
4. Moved
5. Financial Reasons
6. Lack of employment in field
7. Still in school/pursuing further education
8. Other (specify)______________________________________
88. Don’t know
99. No response
YOUR PROGRAM
The following questions relate to the _______________ (name of program) program you graduated
from.
14. Please rate the following statements using a 5-point scale where 1 means “not at all” and 5 means
“to a great extent”.
To what extent did the program from which you graduated at ________________ (institution name)
provide you with the following benefits? If some of these benefits are not applicable please indicate
so. [RANDOMIZE AND READ]
not at all great extent N/A DK NR
a. The skills needed for a particular job 1 2 3 4 5 77 88 99
b. Knowledge of a particular field of study 1 2 3 4 5 77 88 99
c. An opportunity to improve yourself 1 2 3 4 5 77 88 99
d. Chances of improved income 1 2 3 4 5 77 88 99
e. A desire to continue learning more, about

KPIRS Reporting Manual August 2012.docx August 2012
Page | 76
this or other subjects 1 2 3 4 5 77 88 99
f. Improved employment opportunities 1 2 3 4 5 77 88 99
15. The following statements examine the degree to which your post-secondary education has added to
your skills, knowledge and abilities. Please rate these statements using a 5-point scale where 1
means “not at all” and 5 means “to a great extent”. If a statement is not applicable please indicate
so.
Reflecting on your educational experience at _____________ (name of institution), do you feel that
it has helped you to effectively: [RANDOMIZE AND READ]
not at all great extent N/A DK NR
a. Solve problems 1 2 3 4 5 77 88 99
b. Speak in public 1 2 3 4 5 77 88 99
c. Develop your writing skills 1 2 3 4 5 77 88 99
d. Resolve conflicts 1 2 3 4 5 77 88 99
e. Learn independently 1 2 3 4 5 77 88 99
f. Become self-confident 1 2 3 4 5 77 88 99
g. Develop leadership skills 1 2 3 4 5 77 88 99
h. Think creatively 1 2 3 4 5 77 88 99
i. Develop awareness of ethical issues 1 2 3 4 5 77 88 99
j. Develop awareness of political and
social issues 1 2 3 4 5 77 88 99
k. Appreciate other cultures 1 2 3 4 5 77 88 99
l. Develop work-related computer skills 1 2 3 4 5 77 88 99
m. Develop research skills 1 2 3 4 5 77 88 99
n. Develop mathematical skills 1 2 3 4 5 77 88 99
o. Develop interpersonal skills 1 2 3 4 5 77 88 99
p. Work independently 1 2 3 4 5 77 88 99
q. Work well with others 1 2 3 4 5 77 88 99
s. Develop effective time management skills 1 2 3 4 5 77 88 99
t. Analyze Information 1 2 3 4 5 77 88 99
16. The following question examines how satisfied you are with your educational experience in the
_____________ (name of program) program at ___________ (name of institution). I would like you
to answer using a 4-point scale, where 1 means “very dissatisfied,” 2 means “dissatisfied”, 3 means
“satisfied”, and 4 means “very satisfied”. [READ]
a) How satisfied are you with the quality of teaching in your program?
1. Very dissatisfied
2. Dissatisfied
3. Satisfied
4. Very satisfied
88. Don’t know
99. No response
b) How satisfied are you with your program at ___________ (name of institution)?
1. Very dissatisfied
2. Dissatisfied
3. Satisfied
4. Very satisfied
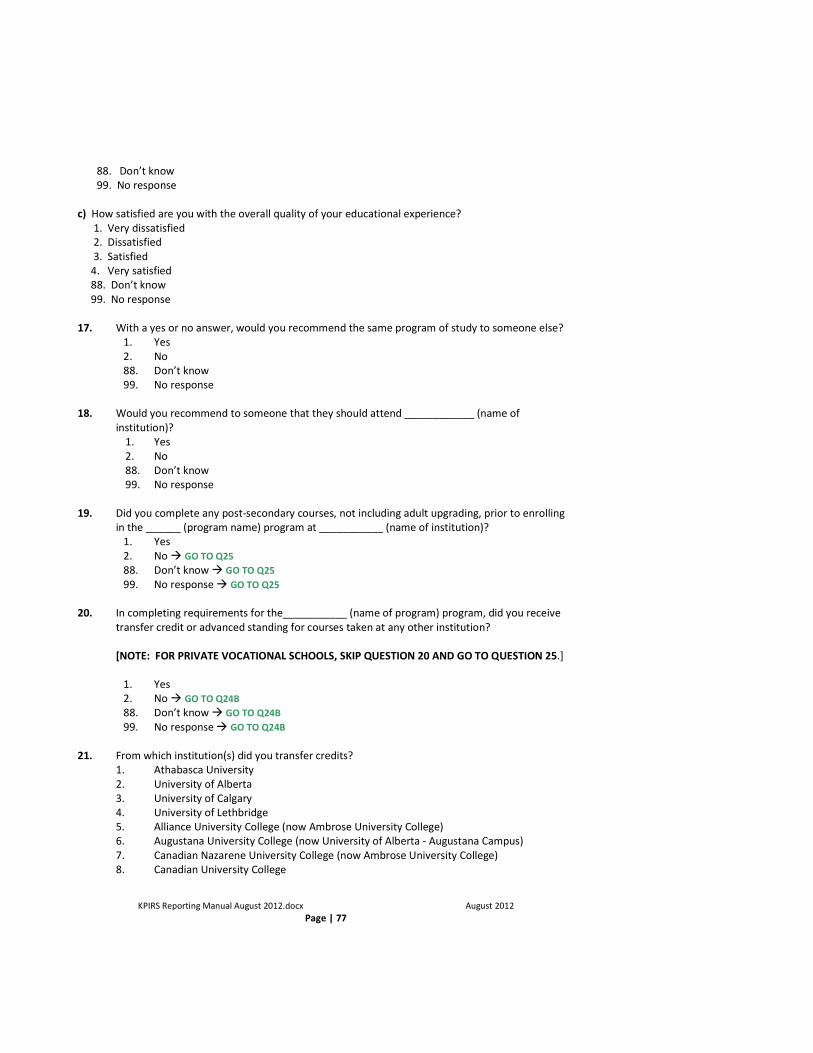
KPIRS Reporting Manual August 2012.docx August 2012
Page | 77
88. Don’t know
99. No response
c) How satisfied are you with the overall quality of your educational experience?
1. Very dissatisfied
2. Dissatisfied
3. Satisfied
4. Very satisfied
88. Don’t know
99. No response
17. With a yes or no answer, would you recommend the same program of study to someone else?
1. Yes
2. No
88. Don’t know
99. No response
18. Would you recommend to someone that they should attend ____________ (name of
institution)?
1. Yes
2. No
88. Don’t know
99. No response
19. Did you complete any post-secondary courses, not including adult upgrading, prior to enrolling
in the ______ (program name) program at ___________ (name of institution)?
1. Yes
2. No � GO TO Q25
88. Don’t know � GO TO Q25
99. No response � GO TO Q25
20. In completing requirements for the___________ (name of program) program, did you receive
transfer credit or advanced standing for courses taken at any other institution?
[NOTE: FOR PRIVATE VOCATIONAL SCHOOLS, SKIP QUESTION 20 AND GO TO QUESTION 25.]
1. Yes
2. No � GO TO Q24B
88. Don’t know � GO TO Q24B
99. No response � GO TO Q24B
21. From which institution(s) did you transfer credits?
1. Athabasca University
2. University of Alberta
3. University of Calgary
4. University of Lethbridge
5. Alliance University College (now Ambrose University College)
6. Augustana University College (now University of Alberta - Augustana Campus)
7. Canadian Nazarene University College (now Ambrose University College)
8. Canadian University College

KPIRS Reporting Manual August 2012.docx August 2012
Page | 78
9. Concordia University College
10. The King’s University College
11. St. Mary’s University College
12. Taylor University College and Seminary
13. Alberta College of Art and Design
14. Bow Valley College
15. Fairview College
16. Grande Prairie Regional College
17. Grant MacEwan College
18. Keyano College
19. Lakeland College
20. Lethbridge College (formerly Lethbridge Community College)
21. Medicine Hat College
22. Mount Royal College
23. NorQuest College
24. Northern Lakes College
25. Olds College
26. Portage College
27. Red Deer College
28. NAIT
29. SAIT
30. Other Alberta Institution (specify) _______________________
31. Other Non-Alberta Institution (specify) ___________________
88. Don’t know
99. No response
22. Did you receive full credit or partial credit from? [PIPE IN ONLY THOSE INSTITUTIONS CHECKED IN Q21]
Full Partial DK NR
a. Athabasca University 1 2 88 99
b. University of Alberta 1 2 88 99
c. University of Calgary
d. …
[PIPE IN ONLY THOSE INSTITUTIONS CHECKED IN Q21 AND Q22 <> 88 OR 99.]
23. Did you receive the transfer credit you expected from…?
Yes No DK NR
a. Athabasca University 1 2 88 99
b. University of Alberta 1 2 88 99
c. University of Calgary
d. …
[PIPE IN ONLY THOSE INSTITUTIONS CHECKED IN Q21 AND Q23=2]

KPIRS Reporting Manual August 2012.docx August 2012
Page | 79
24. What were the reasons that you did not receive the credit you expected from? [CHECK ALL
THAT APPLY; DO NOT READ]
Athabasca University
1. I did not originally plan to transfer.
2. I completed more credits than were allowed for transfer to (i.e. most programs
require that 50% of the program has to be completed at the institution offering the
credential).
3. My marks weren’t high enough to receive transfer credit.
4. I misunderstood or found the transfer requirements to be unclear.
5. I received unclear advice on what courses would transfer from the sending institution
6. I received unclear advice on what courses would transfer from the receiving
institution
7. I received unclear advice on what courses would transfer from the other sources
8. I received unassigned (general) credit when I expected to receive specific credit (i.e. I
got credit for English 1XX rather than English 110).
9. My courses were too old to transfer as I took them too long ago.
10. All my courses were transferable but some weren’t required for graduation.
77. Other (specify) _________________________
88. Don’t know
99. No response
University of Alberta
1. I did not originally plan to transfer.
2. I completed more credits than were allowed for transfer to (i.e. most programs
require that 50% of the program has to be completed at the institution offering the
credential).
3. My marks weren’t high enough to receive transfer credit.
4. I misunderstood or found the transfer requirements to be unclear.
5. I received unclear advice on what courses would transfer from the sending institution
6. I received unclear advice on what courses would transfer from the receiving
institution
7. I received unclear advice on what courses would transfer from the other sources
8. I received unassigned (general) credit when I expected to receive specific credit (i.e. I
got credit for English 1XX rather than English 110).
9. My courses were too old to transfer as I took them too long ago.
10. All my courses were transferable but some weren’t required for graduation.
77. Other (specify) _________________________
88. Don’t know
99. No response
University of Calgary…
24. A.) How satisfied were you with the transfer credit that you received?
1. Very dissatisfied
2. Dissatisfied
3. Satisfied
4. Very satisfied
88. Don’t know

KPIRS Reporting Manual August 2012.docx August 2012
Page | 80
99.No response
24. B.) In completing requirements for the_______(name of program) program, did you apply for
prior learning assessment and recognition (PLAR)? [If participant does not know what PLAR is,
record as 88 – Don’t know]
1. Yes
2. No (go to 25)
88. Don’t know (go to 25)
99. No response (go to 25)
24 C.) Which type of assessment did you complete? (Do not read.)
1. Portfolio development
2. Challenge process (written or oral exams, skills demonstration, product assessment, educational
credential assessment)
3. Other (specify) ____________________
24 D.) Were you successful in being awarded credits?
1. Yes
2. No (go to 25)
88. Don’t know (go to 25)
99. No response (go to 25)
24 E.) How many credits were you awarded?
1. 3 (one course)
2. 6-12 (two to four courses)
3. 15-30 (five to ten course)
4. more than 30 (eleven or more courses)
88. Don’t know
99. No response
25. To what extent do you agree with the following statement: Given the benefits of post-secondary
education, I consider the _____________ (name of program) program to be worth the financial
cost to me and/or my family? Do you…? [READ]
1. Strongly disagree
2. Disagree
3. Agree
4. Strongly agree
88. Don’t know
99. No response
26. How much of your course-load for the program you graduated from did you take through on-
line and / or distance delivery? Is that...? [DOES NOT INCLUDE PRIOR CREDIT TRANSFERS]
1. None
2. Less than half
3. About half
4. More than half
5. All of it

KPIRS Reporting Manual August 2012.docx August 2012
Page | 81
88. Don't know
99. No response
26 A. As part of your studies at (Alberta Institution) ________, did you participate in a study abroad
program (which might include a student exchange, field school experience, course taken abroad, co-
op/practicum or internship) outside of Canada?
1. Yes
2. No (go to 27)
88. Don’t know (go to 27)
99. No response (go to 27)
B. In which country? [Record response]
88. Don’t know
99. Prefer not to say
C. Was your Study Abroad Program offered: (read list, choose one option)
____ All in English
____ Primarily in English
____ Primarily in a language other than English
____ All in a language other than English
D. How satisfied were you with the overall quality of your study abroad educational experience?
1. Very dissatisfied
2. Dissatisfied
3. Satisfied
4. Very satisfied
88. Don’t know
99. No response
27. Did you work while taking classes at _________________(name of institution)?
1. Yes
2. No
88. Don’t know
99. No response
EMPLOYMENT OUTCOMES
The following questions relate to your employment outcomes since graduating.
28. Do you currently have one or more paying jobs, including self-employment and seasonal
positions?
1. Yes
2. No � GO TO Q31
88. Don’t know � GO TO Q31
99. No response � GO TO Q31
29. How many paying jobs do you have? [ENTER NUMBER]

KPIRS Reporting Manual August 2012.docx August 2012
Page | 82
89. Don’t know
100. No response
30. Are you self-employed (in your main job)? [THE MAIN JOB REFERS TO THE JOB THAT HAS THE MOST
HOURS.]
1. Yes
2. No
88. Don’t know
99. No response
SKIP AHEAD TO Q33
31. Are you currently looking for a job?
1. Yes � GO TO Q50
2. No
88. Don’t know � GO TO Q50
99. No response � GO TO Q50
32. What is the main reason you are not looking for a job? [DO NOT READ]
1. Own illness or disability
2. Personal or family responsibilities
3. Going to school
4. No longer interested in finding a job
5. Waiting for recall (to former or seasonal job)
6. Waiting for replies from employer
7. Could not find the kind of job wanted
8. Traveling/taking time off
9. Retired
10. International student/immigration issues
77. Other (specify) _________________________
88. Don’t know
99. No response
SKIP AHEAD TO Q50
33. How long have you been employed in your (main) job? [SELECT THE MOST APROPRIATE, DO NOT READ]
1. Six (6) months or less
2. Six (6) months and one (1) day to one (1) year
3. Longer than one (1) year
88. Don’t know
99. No response
34. What sector best describes the organization you work for? [Read list as necessary]
1. Agriculture, Forestry, Fishing and Hunting
2. Mining, Oil and Gas
3. Utilities
4. Construction
5. Manufacturing
6. Wholesale Trade
7. Retail Trade

KPIRS Reporting Manual August 2012.docx August 2012
Page | 83
8. Transportation and Warehousing
9. Telecommunications and Information
10. Finance and Insurance
11. Real Estate and Rental and Leasing
12. Professional, Scientific and Technical Services
13. Management of Companies and Enterprises
14. Administrative and Support
15. Waste Management and Remediation Services
16. Education Services
17. Health Care and Social Assistance
18. Arts, Entertainment and Recreation
19. Accommodation and Food Services
20. Public Administration
77. Other Services (Please specify) ______________________
88. Don’t know
99. No response
35. What is your job title? (If you held more than one job, choose the one with the most hours.) [ENTER JOB TITLE]
88. Don’t know
99. No response
36. What are your main work duties? [PROBE IF NECESSARY, ENTER MAIN WORK DUTIES]
88. Don’t know
99. No response
37. What is the total number of hours you usually work per week in your (main) job? (The main job
refers to the one with the most hours worked in a week.) [ENTER HOURS]
8888. Don’t know
9999. No response
39. What is the easiest way for you to tell us your gross salary or earnings, including tips and
commissions, before taxes and other deductions for your (main) job? [READ LIST AS NECESSARY]
1. Hourly
2. Daily
3. Weekly
4. Bi-weekly (every two weeks)
5. Semi-monthly (twice a month)
6. Monthly
7. Yearly
77. Other (specify) ____________________
88. Don’t know
99. No response� GO TO Q42
38. Working your usual hours at your (main) job, approximately what is your gross salary or
earnings, before taxes and deductions? (including gratuities, commission and other earnings)? [ENTER SALARY, DO NOT USE DECIMALS; IF NECESSARY, HAVE PARTICIPANT CONVERT TO CANADIAN
DOLLARS AS CLOSELY AS POSSIBLE]
888888. Don’t know
999999. No response � GO TO Q42

KPIRS Reporting Manual August 2012.docx August 2012
Page | 84
40. [Skip if Q39 = yearly] Based on what you have told me, your total expected annual income from
your (main) job before deductions is calculated to be $ __________. Does that sound about
right?
1. Yes � GO TO Q42
2. No
88. Don’t know
99. No response � GO TO Q42
41. [Skip if Q39 = yearly] In that case, what is your approximate annual income from your (main) job
before deductions including ANY tips OR commissions? [ENTER ANNUAL INCOME]
888888. Don’t know
999999. No response
42. Please rate these statements using a 3-point scale where 1 means “not related”, 2 means
“somewhat related” and 3 means “very related”. How related is your current job to:
not related very related DK NR
a) The general skills and abilities you
acquired (e.g., communication skills,
critical thinking, problem solving) 1 2 3 88 99
b) The subject-area knowledge you acquired 1 2 3 88 99
c) Overall, how related is your current
(main) job to the program from which
you graduated in 2007-08? 1 2 3 88 99
IF THE RESPONDENT HAS ONLY ONE JOB, BASED ON RESPONSE TO Q29, SKIP TO Q47
43. What is the total number of hours you usually work per week in all other jobs combined? [ENTER HOURS]
88. Don’t know
99. No response
43 VALID. To confirm, you work a total of [Q37+Q43] per week; that is, [Q37] at your main job and
another [Q43] hours at your other jobs.
1. Yes – Continue
2. No – Jump back to Q37 or Q43, as appropriate
45. With respect to your other job(s), what is the easiest way for you to tell us your gross salary or
earnings, including tips and commissions, before taxes and other deductions? [READ LIST AS
NECESSARY]
1. Hourly
2. Daily
3. Weekly
4. Bi-weekly (every two weeks)
5. Semi-monthly (twice a month)
6. Monthly
7. Yearly
77. Other (specify) ____________________

KPIRS Reporting Manual August 2012.docx August 2012
Page | 85
88. Don’t know
99. No response� GO TO Q46
44. Working your usual hours at your other job(s) what is your approximate gross salary or earnings,
before taxes and deductions? (including gratuities, commission and other earnings)? [ENTER
SALARY, DO NOT USE DECIMALS; IF NECESSARY, HAVE PARTICIPANT CONVERT TO CANADIAN DOLLARS
AS CLOSELY AS POSSIBLE]
888888. Don’t know
999999. No response � GO TO Q46
45a. [Skip if Q45 = yearly] Based on what you have told me, your total expected annual income from
your other job(s) before deductions is calculated to be $ __________. Does that sound about
right?
1. Yes � GO TO Q46
2. No
88. Don’t know
99. No response � GO TO Q46
45b. [Skip if Q45 = yearly] In that case, what is your approximate annual income from your other
job(s) before deductions including ANY tips OR commissions? [ENTER ANNUAL INCOME]
888888. Don’t know
999999. No response � GO TO Q46
46. Please rate these statements using a 3-point scale where 1 means, “not related”, 2 means
“somewhat related” and 3 means “very related”. How related are your other jobs to:
not related very related DK NR
a) The general skills and abilities you
acquired (e.g., communication skills,
critical thinking, problem solving) 1 2 3 88 99
b) The subject-area knowledge you acquired 1 2 3 88 99
c) Overall, how related is your other
job to the program from which
you graduated in 2007-08? 1 2 3 88 99
47. When you were selected for your (main) job, what was the highest level of education needed to
get the job? [DO NOT READ LIST, ACCEPT ONE ANSWER ONLY]
1. Less than high school
2. Some high school
3. High school diploma
4. Some non-University post secondary (college/technical/vocational)
5. Completed non-University post-secondary (college/technical/vocational)
6. Some university
7. Completed bachelors degree
8. Completed graduate studies
10. Professional degree (only includes: Medicine (MD), Law (LLB), and Dentistry (DDS))
9. Other (specify) _______________________
88. Don’t know
99. No response

KPIRS Reporting Manual August 2012.docx August 2012
Page | 86
48. Given your education, training and experience, how qualified do you feel you are for your (main)
job? [READ]
1. Very under-qualified
2. Somewhat under-qualified
3. Qualified
4. Somewhat overqualified
5. Very overqualified
88. Don’t know
99. No response
49. All things considered, how satisfied are you with your current (main) job? Would you say…? [READ]
1. Very Dissatisfied
2. Dissatisfied
3. Satisfied
4. Very Satisfied
88. Don’t know
99. No response
FURTHER STUDIES
I would now like to ask you about further studies you may have undertaken since graduating.
50. Are you currently enrolled as a student?
1. Yes
2. No � GO TO Q54
88. Don’t know � GO TO Q54
99. No response � GO TO Q54
51. What post-secondary institution(s) are you enrolled in?
1. Athabasca University
2. University of Alberta (including Augustana campus)
3. University of Calgary
4. University of Lethbridge
5. Ambrose University College
6. Canadian University College
7. Concordia University College
8. King’s University College
9. St. Mary’s University College
10. Alberta College of Art and Design
11. Bow Valley College
12. Grande Prairie Regional College (including Fairview Campus)
13. Grant MacEwan College
14. Keyano College
15. Lakeland College
16. Lethbridge Community College
17. Medicine Hat College
18. Mount Royal College
19. NorQuest College
20. Northern Lakes College
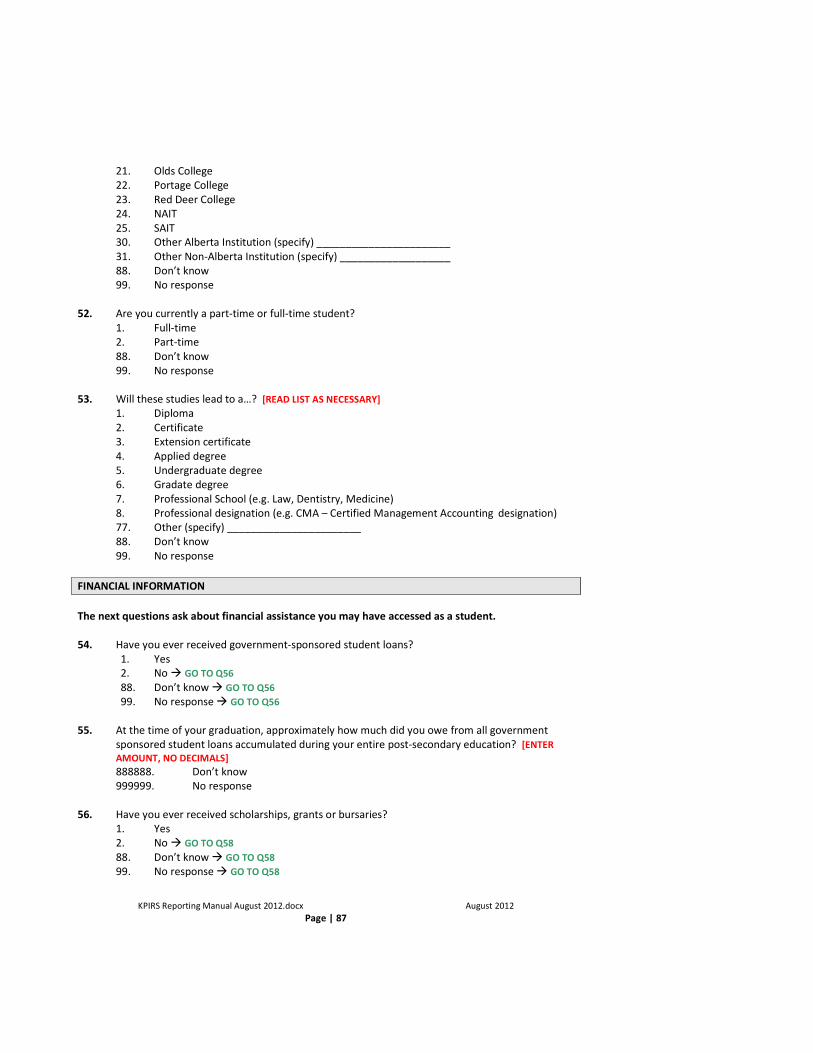
KPIRS Reporting Manual August 2012.docx August 2012
Page | 87
21. Olds College
22. Portage College
23. Red Deer College
24. NAIT
25. SAIT
30. Other Alberta Institution (specify) _______________________
31. Other Non-Alberta Institution (specify) ___________________
88. Don’t know
99. No response
52. Are you currently a part-time or full-time student?
1. Full-time
2. Part-time
88. Don’t know
99. No response
53. Will these studies lead to a…? [READ LIST AS NECESSARY]
1. Diploma
2. Certificate
3. Extension certificate
4. Applied degree
5. Undergraduate degree
6. Gradate degree
7. Professional School (e.g. Law, Dentistry, Medicine)
8. Professional designation (e.g. CMA – Certified Management Accounting designation)
77. Other (specify) _______________________
88. Don’t know
99. No response
FINANCIAL INFORMATION
The next questions ask about financial assistance you may have accessed as a student.
54. Have you ever received government-sponsored student loans?
1. Yes
2. No � GO TO Q56
88. Don’t know � GO TO Q56
99. No response � GO TO Q56
55. At the time of your graduation, approximately how much did you owe from all government
sponsored student loans accumulated during your entire post-secondary education? [ENTER
AMOUNT, NO DECIMALS]
888888. Don’t know
999999. No response
56. Have you ever received scholarships, grants or bursaries?
1. Yes
2. No � GO TO Q58
88. Don’t know � GO TO Q58
99. No response � GO TO Q58

KPIRS Reporting Manual August 2012.docx August 2012
Page | 88
57. How much did you receive in scholarships, grants and/or bursaries during your post-secondary
studies? [ENTER AMOUNT, NO DECIMALS]
888888. Don’t know
999999. No response
58. Have you ever received non-government sources of financing for education-related expenses? [READ THE FOLLOWING ONLY IF RESPONDENT REQUIRES CLARIFICATION]
(i.e. bank loans, credit cards, credit lines, loans from relatives, etc)?
1. Yes
2. No � GO TO Q60
88. Don’t know � GO TO Q60
99. No response � GO TO Q60
59. At the time of your graduation, approximately what did you owe as a result of education-related
borrowing from all non-government sources? This amount does NOT include what you owe for
government sponsored student loans. [ENTER AMOUNT, NO DECIMALS]
888888. Don’t know
999999. No response
DEMOGRAPHICS
The following demographic questions are asked only to assist in classifying your responses, and are
not used in any way to identify you. These questions are all voluntary and any information you
provide is kept strictly confidential.
60. What is your gender? [DO NOT ASK]
1. Male
2. Female
88. Don’t know
99. No response
61. What is your current age? [ENTER AGE]
88. Don’t know
99. No response
62. What was your marital status when you started the_______________ (program name)
program? Were you …?
1. Single (never married)
2. Married or living with partner
3. Divorced/Separated/Widowed
88. Don’t know
99. No response
63. When you started the ________________ (name of program) program for how many
dependents (including dependent adults) were you responsible? [ENTER NUMBER]
88. Don’t know
99. No response
64. Do you consider yourself to be an Aboriginal person?

KPIRS Reporting Manual August 2012.docx August 2012
Page | 89
1. Yes
2. No � GO TO Q66
88. Don’t know � GO TO Q66
99. No response � GO TO Q66
65. Are you…? [READ]
1. Status Indian
2. Non-status Indian
3. Inuit
4. Métis
77. Other _________________
88. Don’t know
99. No response
SKIP TO Q67
66. Do you consider yourself to be a member of a visible minority?
1. Yes
2. No
88. Don’t know
99. No Response
67. Do you consider yourself to be a person with a disability (that is, someone with a long-term
physical, mental or learning disability that limits the kind or amount of paid work that they can
do)?
1. Yes
2. No � GO TO Q69
88. Don’t know � GO TO Q69
99. No response � GO TO Q69
68. What is the nature of your disability? [ENTER DISABILITY]
88. Don’t know
99. No response
69. What is/was the highest level of education attained by either one of your parents or guardians? [DO NOT READ CATEGORIES. ENTER EDUCATION LEVEL OF PARENT/GUARDIAN WITH HIGHEST
ATTAINMENT]
1. Elementary or junior high school
2. Some high school
3. Completed high school
4. Some post-secondary
5. Completed college, technical institute or apprenticeship program
6. Completed university degree (includes any undergraduate, graduate, or professional
degree)
77. Other (specify) ________________________
88. Don’t know
99. No response
70. Is there anything about your education or work experience that you would like to add, for
example, any information about your experience that has not been covered in this interview?
88. Don’t know

KPIRS Reporting Manual August 2012.docx August 2012
Page | 90
99. No response
We’ve reached the end of our questions and I would like to thank you very much for your time and
interest.

KPIRS Reporting Manual August 2012.docx August 2012
Page | 91
Winter 2010 Graduate Outcome Survey
File Structure for 2007-08 Academic Year Data Files
File Format: DBF
Field Name Field Description Data Supplied By Comments or Examples
ACADYR Academic Year Alberta Advanced Education &
Technology
2007/2008
PROVCD Provider Code Alberta Advanced Education &
Technology
AU
PROVNM Provider Name Alberta Advanced Education &
Technology
Athabasca University
STUDID Provider Student ID Alberta Advanced Education &
Technology
ASN Alberta Student Number Alberta Advanced Education &
Technology
if blank, Post Secondary
Institution to supply
PGMCLASS Program Classification Alberta Advanced Education &
Technology
526050
PGMCD Program Code Alberta Advanced Education &
Technology
FBREBFA
PGMNM Program Name Alberta Advanced Education &
Technology
Fibre - BFA
PGMTY Program Type (Degree Type) Alberta Advanced Education &
Technology
UG
PGMTYDES Program Type Description (Degree
Type Description)
Alberta Advanced Education &
Technology
Bachelor Degree
GENDER Student Gender Alberta Advanced Education &
Technology
M (Male), F (Female), U
(Unspecified);
if blank, Post Secondary
Institution to supply
DOB Student Date of Birth Alberta Advanced Education &
Technology
YYYYMMDD, e.g. 19780131
if blank, Post Secondary
Institution to supply
FIRSTNM Student First Name Post-Secondary Institution
MIDNMINIT Student Middle Name/Initial Post-Secondary Institution
LASTNM Student Last Name Post-Secondary Institution
ADDRESS1 Student Address 1 Post-Secondary Institution
ADDRESS2 Student Address 2 Post-Secondary Institution
CITY Student City/Town Post-Secondary Institution
PROVSTATE Student Province/State Post-Secondary Institution code or full name
COUNTRY Student Country Post-Secondary Institution
POSTALCD Student Postal Code Post-Secondary Institution For students who lived in Canada
– Postal Code, e.g. T6T2Z9;
For students who lived outside
Canada before enrolling at the
institution – 888888;
Not reported/Unknown - 999999
STUDPH1 Student Phone Number 1 - with
Area Code
Post-Secondary Institution no brackets, no formatting, e.g.
7805555555
STUDPH2 Student Phone Number 2 - with
Area Code
Post-Secondary Institution no brackets, no formatting, e.g.
7805555555
CONTACTNM Contact Name Post-Secondary Institution Name of the PSI program head of
the program that the student
completed
CONTACTPH Contact Phone Number - with Area
Code
Post-Secondary Institution Phone number of the PSI
program head
no brackets, no formatting, e.g.
7805555555

KPIRS Reporting Manual August 2012.docx August 2012
Page | 92
Appendix B: What’s New for 2010
1. Update to CIP Codes CIP codes names have been updated to reflect the current names in LERS.
2. Data Elements & Reporting systems Data elements have been grouped into the new six sector model. It should be noted that here are
no changes to the elements to be reported.
3. Research Publications and Other Creative Works As a result of the recent changes to the mandates of post-secondary institutions, a new section has
been added to provide guidelines on how institutions are to report research publications and other
creative works. Athabasca University, Alberta College of Arts & Design, Grant MacEwan University,
Mount Royal University and The Independent Academic and Research Institutions are now required
to submit report on research publications undertaken by staff, faculty and the institution
The following have been taken out of the main section of the 2010 KPIRS Manual.
4. Discontinued KPI Types
DISCONTINUED KPI TYPES
Preparatory and Basic
Upgrading (PU)
These programs now fall under NA as noted above and would
normally carry Chapter V (Personal Improvement and Leisure
Programs) and Chapter VI (High School/Secondary School
Diplomas and Certificate Programs) CIP codes. For example,
High School/Secondary School Programs would be within the
53. Series and ESL would be within the 32. Series.
NA
Skill Training (SK) These programs were identified as a result of a specific funding
source. This funding source can already be accommodated in
PRS.
Trade Certificate (TC) Now C
Apprenticeship (AP) Now JC
General Studies (GS) Now NA
5. PBU Program Specific CIP Codes No Longer In Use The following are no longer used as CIP Codes for Preparatory and Basic Upgrading programs.
6 Digit CIP 2000 Code
6 Digit CIP 2000 Code
33.0101 Citizenship Activities. 36.0105 Board, Card and Role-Playing Games.
33.0102 Citizenship Activities, General. 36.0107 Nature Appreciation.
33.0103 American Citizenship Education. 36.0108 Pet Ownership and Care.
33.0104 Community Awareness. 36.0109 Sports and Exercise.
33.0105 Community Involvement. 36.0111 Art.
33.0199 Canadian Citizenship Education. (New) 36.0112 Collecting.
34.0102 Health-Related Knowledge and Skills. 36.0115 Dancing.
34.0103 Birthing and Parenting Knowledge and Skills. 36.0116 Music.
34.0104 Personal Health Improvement and 36.0117 Reading.

KPIRS Reporting Manual August 2012.docx August 2012
Page | 93
Maintenance.
34.0199 Addiction Prevention and Treatment. 36.0118 Theatre/Theater.
35.0101 Interpersonal and Social Skills. 36.0119 Writing.
35.0102 Interpersonal and Social Skills, General. 36.0199 Aircraft Pilot (Private).
35.0103 Interpersonal Relationships Skills. 37.0101 Personal Awareness and Self-Improvement.
35.0199 Business and Social Skills. 37.0102 Self-Awareness and Personal Assessment.
36.0101 Leisure and Recreational Activities. 37.0103 Stress Management and Coping Skills.
36.0102 Leisure and Recreational Activities, General. 37.0104 Personal Decision-Making Skills.
36.0103 Handicrafts and Model-Making. 37.0199 Self-Esteem and Values Clarification.

KPIRS Reporting Manual August 2012.docx August 2012
Page | 94
Appendix C: Program and Credential Classification Structure prior to 2004-05
The program classification structure in KPIRS is extracted from the Program Registry System (PRS)
program classification. This structure provides the basis for entering data at any level of aggregation.
The illustration below describes the available levels of reporting from the highest – the Institution level –
to the more detailed Program level. Institutions are expected to enter their KPI data at the appropriate
level, as defined for each Information Set in this Manual.
REPORTING LEVEL
Institution Level Represents the institution as a whole; may be a sum or roll-up of data entered at one of the
more detailed levels described below. Faculty / Administrative Unit
Usually the first level of organizational classification below the “institution” level. What is called
“division” at one institution may be called “department” or “faculty” at another. This is the unit
charged with administrative responsibility for the Program. KPI Program Type (See Table 1 for details of Program Types)
A set of classifications that group programs by the level and type of credential awarded,
Certificate, Diploma, Degree, etc., based on PRS Program Classification and Resulting
Qualification data Subject Area (See Table 2 for details of Subject Areas)
A grouping of programs by the content of study using the PRS 3-digit Program Classification. Standard Name
The name of a “program,” standardized across the province to refer to similar programs that
have differing names from institution to institution, e.g., Office Administration covers Secretarial
Science, Clerk Typist, Administrative Assistant, Executive Office Assistant and others. Standard
Name is used with Program Length to group similar programs, and is the basic “program” level
used for KPI reporting for the universities, private colleges, and the former vocational colleges
prior to the 2001-02 Academic Year. Cross-Reference Identifier (XrefID)
Used to identify programs in cases where the “program” has more than one ProgID. Separate
ProgIDs may refer to separate streams, majors, versions, years or types of delivery of one
program. Program (ProgID)
“Program” corresponds to the ProgID level used for enrolment reporting. The ProgID is the
basic “program” level for KPI reporting by the Colleges and Technical Institutes.
Program Length Indicates the program length in years of required study.

KPIRS Reporting Manual August 2012.docx August 2012
Page | 95
Table 1: PRS Coding to Produce KPI Program Type Classifications
KPI Program Type Parchment Type or Level of Qualification
PU Preparatory & Basic Upgrading NA [Qualif = (10 OR 11 OR 12 OR 19 OR 21 or 31 or 32) AND (Class.
Code >= 700000 AND <720000)]
SK Skill Training* (Short) Certificate / NA [Qualif = (10 OR 11 OR 12 OR 24 OR 29) AND (Class Code <700000)]
TC Trade Certificate Certificate [Qualif = 13 & Department Type = 'TC']
AP Apprenticeship NA [Qualif = 18]
C Certificate Certificate [Qualif = (13 OR 23 OR 29) & Department Type NOT 'TC']
D Diploma Diploma [Qualif = 14 OR 15]
OC Other Career [Post-Certificate] Diploma [Qualif = 16 OR 22]
UT University Transfer NA [Qualif = 20]
AD Applied Degree Degree [Qualif = 43]
UG Bachelor Degree Degree [Qualif = 41, 42, 44, 45]
MS Masters Degree Degree [Qualif = 51 OR 52 OR 53 OR 54]
PD PhD Degree [Qualif = 55]
GS General Studies NA
[((Qualif = 10 AND Class Code >=720000) OR (Standard Name =
Unclassified OR Graduate - Qualifying OR Graduate – Unclassified
OR Graduate - Probationary)]
* Includes short trade, pre-emp, JU, other skill training; only Qualif=24 are “parchment”. Note: “Parchment 1997-98” are the programs that make up the parchment set for 97-98 KPI reporting.
Table 2: PRS Coding to Produce Subject Area Classifications
Subject Area 3-Digit Program Class Codes
AC Academic Upgrading 710, 713
AE Architecture and Environmental Design 121, 126
AG Agricultural (and related) 230-237
AS Arts and Science (General) 700, 720, 722, 723, 725, 730
BL Biological and Other Life Sciences Related 200, 220-229, 240-243,
BU Business (and related) 600-625 (NOT 615)
CE Civil (engineering and related) 120,122-125, 127 (NOT 121,126)
CM Communications (and related) 510-514, 516
CP College/University Preparation 715
CR Chemical and Resources Related 130-134
ED Education (and related) 310-312, 420-426
EE Electrical and Electronics (engineering and related) 140-145
EG Engineering General (and related) 160-163
ES English as a Second Language 712
FP Fine and Performing Arts 520-528
HE Health Related (Not Incl. MD) 300, 314, 330-334, 340-344, 360-363
HS Humanities and Social Sciences 400-416, 500, 530-539, 721
IT Information Technology 113, 515, 640-642
JL Job and Life Skills Training 711
MD Medicine and Dentistry 320-328, 350-354
ME Mechanical (engineering and related) 150-154
MP Math and Physical Sciences 111-112, 115-117
RR Renewable Resources 210-214
SC Science (General) 100-110
SH Services and Hospitality 313, 615, 630, 631, 633-637
SS Social and Community Services 430-434, 440-444
TR Transport (and Related) 155, 156, 632
UC Unclassified 724
VP Vocational Preparation 714

KPIRS Reporting Manual August 2012.docx August 2012
Page | 96
KPI Data from LERS and PRS
The Role of LERS and PRS in KPI Reporting
The Learner & Enrolment Reporting System (LERS) is the source for all or part of the data elements in
the following KPI Information Sets: Operations Costs per FLE, Graduate Student Satisfaction, Graduate
Employment and Academic Outcomes, Access – Credit, Access – Non-Credit, and Program Completion.
The Program Classification structure (see Page 92) used in the KPI reporting system is derived from
Program Registry System (PRS) data elements.
Program Level Reporting for KPIs
Several KPI Information Sets involve reporting data at a “program” level. Besides LERS and PRS, the
sources for program level data are the Alberta Council on Admissions and Transfer (ACAT) and the
institutions. In PRS, the basic level for reporting information is the Program Identifier (ProgID) level. At
an institution a ProgID may refer to an entire program or to a single component, stream or version of a
program. Examples of the latter are co-op streams, alternative Year 2 majors, alternate delivery
offerings, and common first year.
When the department needs to publish reports using data presented at a higher level in the program
structure, such as Subject Area or Program Type, the data are generated by aggregating the ProgID level
data. For this reason, institutions must report program level KPIs at the ProgID level. Where necessary,
institutions should pro-rate higher-level data to make allocations at the ProgID level.
Common Information in KPIRS
A number of the KPIs use “common” data extracted or calculated from LERS and PRS. The resulting KPI
information includes unduplicated headcounts, FLEs and completer counts for every program (ProgID).
Completion Data for Student Tracking
The “Completion” information set involves identifying an entry cohort for each program and tracking
students until they complete the program or through as many years of available LERS data as are
appropriate. In any reporting year, completion rate data will be generated for several years’ entry
cohorts. For example, in 2003-04 when reporting for the 2002-03 reporting year, there will be some 4-
year programs with a 1996-97 entry cohort that are being reported for the final time after seven years
of tracking. By this time KPIRS will contain a full set of final completion rates for all programs that had
1996-97 entry cohorts.

KPIRS Reporting Manual August 2012.docx August 2012
Page | 97
Appendix D: Indicators Discontinued
1. Community Service and Economic Impact
The impact of an educational institution on its local economy can be estimates using a model, which
estimates the total local income (“gross domestic product”) produced by the institution’s spending in
the local community, and the total local employment generated.
Indicator(s) Apply to:
Comprehensive
Academic &
Research
Institution
Baccalaureate
Academic and Applied
Studies Institution,
Polytechnical
Institutions,
Specialized Arts &
Culture Institutions
Comprehensive
Community
Colleges
Independent
Academic
Institutions
Total local income generated X - - -
Total local employment generated X - - -
Level of Reporting: By institution:
• Comprehensive Academic and Research
institutions
at the institutional level
Scope: University of Alberta, University of Calgary and University of Lethbridge.
Since Athabasca University provides programs and services to students and
communities across the Province, it will not report on these indicators.
Data Elements & Reporting
Systems:
Comprehensive
Academic &
Research
Institution
Baccalaureate Academic
and Applied Studies
Institution, Polytechnical
Institutions, Specialized
Arts & Culture Institutions
Comprehensive
Community
Colleges
Independent
Academic
Institutions
Data reported through
Total local income generated Data Entry - - -
Total local employment
generated Data Entry - - -
Specifications & Protocols:
Each institution will report two data elements:
1. Total Local Income Generated - An estimate of the total annual cash flow into an institution’s
local economy arising from four sources: faculty and staff spending, university non-salary local
spending, student spending and visitor spending, incremented by a local “multiplier effect”
which takes into account the additional indirect income impact as each dollar spent moves from
one supplier/consumer to the next in the economy.
2. Total Local Employment Generated - An estimate of the total annual local employment
generated, expressed in FTE numbers. The figure includes both the direct employment created
within the institution as well as the indirect employment in the local economy generated by the
“multiplier effect”.

KPIRS Reporting Manual August 2012.docx August 2012
Page | 98
The methodology needed to derive local economic impact figures requires many assumptions and
estimates. To avoid giving the results a false level of precision the figures reported should be rounded
somewhat. The total local income figure is rounded to the nearest $100,000 (e.g. $ 147.6 million), and
the total local employment figure is rounded to the nearest 100 Full Time Employment (FTE) (e.g. 4,700
FTE).
Data Date of Record and Timing of the Study
It is anticipated that KPI data will be reported in January of each year.
Economic impact data are derived for the annual period coinciding with the institutions preceding fiscal
year, ending March 31 for all institutions. In order to derive student and visitor spending estimates, the
corresponding “academic year” is, for purposes of this study, assumed to start with the semester
beginning in May and finish with the semester ending in April, in order to coincide as closely as possible
with the fiscal year. For example, data for the 2007-08 fiscal year were reported in December 2008; the
data included student and visitor spending estimates derived from the Spring 2007, Summer 2007, Fall
2007 and Winter 2008 semesters.
Audited financial data for the preceding fiscal year are generally available (in the form of pre-publication
financial statements) in late Summer at all institutions, allowing the study to be completed in time for
the January reporting deadline.
Conceptual Model of Economic Impact on the Local Economy
The economic impact model used is generally described as a short term, cash flow model. It
encompasses an analysis of an institution’s annual direct expenditures on local goods and services, and
the local spending of its faculty and staff, its students and its visitors. The employment impact of the
institution is also part of the study.
The total annual direct spending is incremented by a local multiplier which takes into account the
additional indirect business volume generated as a result of the direct spending of the school, its
employees, students and visitors. Direct employment is incremented by an employment multiplier.
The local community is defined as the institution’s immediate metropolitan area and the surrounding
communities in which the institution’s employees live.
Institutional Spending Defined
The study results include the expenditure and employment data derived from operating and capital
budget accounts as well as sponsored research and other trust money accounts.
A number of affiliated, non-institutional agencies, organizations and businesses exist on every campus.
While some of these are research institutes funded under the auspices of departments and faculties or
funded from sponsored research grants, others are separate non-profit agencies funded from various
non-institutional sources. Student unions are examples of the latter group. In principle the economic
and employment impacts of these groups should be included in the study as they owe their existence to
the presence of the institution and have a local economic impact. However, it was decided that issues
of data availability, confidentiality and inter-institutional comparability likely preclude the inclusion of
these groups’ impacts in the study. Accordingly, the study is confined to the institutional expenditures
(and related employment) documented in the institution’s financial databases and reported in its annual
financial statements.
As an exception to the last statement, however, the expenditures of certain ancillary units are excluded
from the study. In general, the units in question are those selling goods and services to students, staff
and faculty, such as the Bookstore, Microcomputer Store, Student Housing, Food Services, Campus
Recreation, Parking, etc. The main rationale for excluding these units is that including their economic
activity would yield a certain amount of double counting of cash flow into the local economy since

KPIRS Reporting Manual August 2012.docx August 2012
Page | 99
student, faculty, and staff expenditures are captured elsewhere in the analysis. Excluding the units’
expenditures from the study resolves the double counting problem. In addition, because institutions
expect these units to fully recover their costs from sales, and so, in a sense, treat the units as separate
business entities, there is a philosophical consistency in excluding their activities from the study (i.e.,
they are treated like other campus business enterprises).
Faculty and Staff Spending in the Local Community
It is assumed that faculty and staff local spending is identical to net disposable income. Net disposable
income is assumed to equal net “take home” salaries and wages. The following general approach may
be used to calculate this amount.
1. The amount of total gross salaries paid to faculty and staff is determined. This amount is
generally available in institutional financial statements, and should comprise the salaries paid
from operating as well as sponsored research and other trust accounts.
2. Payroll records are used to determine total annual amounts deducted for non-discretionary
items such as pension contributions (including Canada Pension Plan), unemployment insurance,
income taxes, etc. However, amounts for discretionary items, such as United Way contributions
or fees for parking, recreation, and faculty clubs, etc., are not included in this total. The analysis
should include payroll records for salaries and wages paid from operating funds as well as
records for salaries paid from sponsored research and other funds held in trust.
3. From the original gross salaries figure, an amount is subtracted equivalent to the total salaries
paid to staff in the ancillary units as well as the total salaries paid to students. Institutional
expenditure summaries that are more detailed than the financial statements may be needed to
derive these amounts.
4. The non-discretionary deductions data from step 2 and the gross salaries figure resulting from
step 3 are used to calculate the faculty and staff local spending figure. The basic method for this
calculation is to subtract the deductions figure from the gross salaries figure; however, some
adjustments may be necessary to account for the student and ancillary staff salaries and their
attendant deductions.
The main rationale for excluding non-discretionary deductions is that they are primarily leakages from
the local economy. There is no way of determining when or if the money is spent in the local economy.
However, it should be noted that non-discretionary payroll deductions were viewed by the committee
not to be leakages, and hence should not be subtracted from the total gross salaries figure.
Salaries of faculty on leave are not deducted or discounted in any way because it is not possible to
determine what proportion of the salaries, on average, is spent outside of the local region.
In determining faculty and staff local expenditures the economic impact, study literature often suggests
that an amount for estimated savings should be deducted from net disposable income figures. It was
decided to ignore this issue because determination of reasonable savings rates is problematical.
Furthermore, it is possible that, even in the short term, savings are put to work in the local economy.
University Direct Expenditures on Local Goods and Services
The method of deriving the amount of institution’s direct expenditures on local goods and services can
only be outlined here, as each institution’s financial systems and volume of transactions are unique.
First, the non-salary goods and services expenditures of the institution must be derived from operating,
capital, sponsored research and other trust fund accounts. Second, the amount or proportion spent
locally must be determined.
Fringe benefit expenditures made by the institution are excluded from the study. Most of these
expenditures are viewed as short-term leakages from the local economy. Although benefits may flow

KPIRS Reporting Manual August 2012.docx August 2012
Page | 100
back to the local economy at some point in time, the dollar value of those returns cannot be determined
in the short term. However, there are exceptions to the rule that fringe benefits are excluded: extended
health care and dental plans are included. The reason for this exception, as noted in the previous
section dealing with faculty and staff spending, is that these premiums are not viewed as short-term
leakages.
Methods used by the institutions to estimate local expenditures may range from qualitative approaches,
involving the expert opinion of purchasing, financial services or materials management staff, to
quantitative approaches (both manual and computer assisted) which query accounts payable databases
and attempt to derive local expenditures using supplier postal codes or telephone numbers as local
criteria. It is recognized that supplier postal codes may be unreliable indicators of local suppliers since
some firms distribute goods or services from a non-local site yet have a local office for invoicing
purposes; conversely, other firms may provide goods or services from a local site yet invoice from a non-
local head office. Some institutions may use quantitative approaches as initial screening devices and
then temper the results using the knowledge and judgment of the expert staff mentioned above.
Student Expenditures
For purposes of estimating student expenditures, official student counts are compiled for each
semester, including spring and summer semesters. By agreement, part time students are included in
the derivation of FLE student numbers at a rate of 50%; i.e., FLE student counts for a given semester are
calculated as 100% of the full time student headcount plus 50% of the part time headcount. Discounting
part time students in this manner results in a more conservative estimate of student spending.
Student expenditures are based on Alberta Students Finance Board (ASFB) estimates of individual
monthly student budgets for the year in question. Each year, the ASFB provides separate budgets that
vary according to whether students are:
1. single and living with parents, or
2. single and living away from home, or
3. married.
Institutions differ from one another in the age and marital status mix of their students and in the
relative mix of commuters and residential students. Thus, each institution must determine estimates of
the proportions of students in each of the three ASFB categories. These estimates may be derived from
several sources: student information systems, recent student surveys, or estimates by personnel of the
institution. The ASFB also provides a monthly budget estimate for single parent families. Because
institutions do not have reliable estimates of numbers of single parent students, this student category is
ignored.
The following method of calculating estimated student expenditures may be used:
1. Determine the number of student-months in each semester by multiplying each semester’s FLE
student count by the number of months in the semester.
2. Sum the numbers of semester student-months to arrive at an annual number of student-
months.
3. Determine the pro rata numbers of student-months in each of the three ASFB categories by
multiplying the annual number of student-months by the estimated institutional proportions.
4. Multiply the pro rata numbers for each category by the corresponding ASFB monthly student
budgets to yield total annual student expenditures in each of the three categories.
5. Sum the resulting student expenditures to yield total annual student expenditures.
Visitor Expenditures

KPIRS Reporting Manual August 2012.docx August 2012
Page | 101
It is difficult to collect data concerning the number of local area visitors who visit for academic or
research purposes and data concerning the duration of their stay. The collection of data that are
complete, accurate, consistent from year to year and comparable among institutions is problematic.
The results of most institution’s economic impact studies indicate that visitor spending is a relatively
small proportion of total spending in the local economy. Extraordinary efforts to collect such data likely
yield diminishing returns.
Each institution should collect data considered by the institution to be reliable and accurate. These data
may include, for example, numbers of out-of-town conference delegates who attended university
sponsored conferences and the duration of those conferences. These data perhaps can be provided by a
campus conference office. As a further example, the athletics department may be able to provide
annual numbers of visitors who are members of the athletic teams.
Visitor expenditures are calculated by multiplying numbers of visitor-days by estimated per diem
expenditures. Each institution will develop its own set of per diem expenditures, taking into account
local factors and prices. As a starting point, estimated per diem expenditures for conference attendees
are usually available from the local convention and visitors’ bureau. However, convention bureau
estimates may need to be tempered and adjusted to reflect the spending patterns of various types of
visitors to the institution. If the institution has per diem food and lodging allowances for its own faculty,
staff and the athletic team members these might be used to temper the convention bureau estimates.
Direct Employment
Employment data will include faculty and staff funded from operating funds as well as sponsored
research, endowment and other trust funds. Official institutional full-time equivalent counts should be
used. These counts are generally taken at a point in time (e.g. December 31), and may, as a result,
exclude certain seasonal staff. Numbers of faculty on leave are included. Numbers of students
employed by the institution are included. Numbers of staff employed in the ancillary units are included.
Income and Employment Multipliers
The Comprehensive academic and research institutions have agreed to use the following multipliers for
economic impact studies:
Income Multipliers:
Athabasca University 1.2
University of Alberta 1.7
University of Calgary 1.7
The University of Lethbridge 1.5
Employment Multipliers:
All comprehensive academic and research institutions 1.5
These multiplier values are based on a survey of the literature concerning institutions and other industry
economic impact studies. The survey indicated the above values are conservative multipliers for
municipalities of a similar size. Alberta economic data are not available to support a numerical
computation of the multipliers.
The total direct annual cash flow into the local economy is derived by summing the cash flow arising
from the four sources: faculty and staff spending, institution’s non-salary local spending, student
spending and visitor spending. Total local income is then calculated by multiplying the total direct cash
flow by the value of the multiplier. Similarly, total local employment is calculated by multiplying direct
employment by the value of the employment multiplier.

KPIRS Reporting Manual August 2012.docx August 2012
Page | 102
2. Cost per Graduate (Program Completer)
The average cost per graduate (program completer) is a measure of unit costs used to indicate that
resources are used efficiently and that costs are comparable to those for similar programs at other
institutions of comparable size, location and function.
Indicator(s) Apply to: Public Colleges &
Technical Institutes Universities
Private
University
Colleges
Average cost per graduate (program completer) X X X
Level of Reporting: By program [see page 95]:
Public Colleges & Technical Institutes at ProgID level
Universities at ProgID level
Private University Colleges at ProgID level
Scope: Information required for all parchment program types: Skill Training, Trade
Certificate, Certificate, Diploma, Other Career (Post-Certificate), Applied
Degree, Bachelor Degree, Masters Degree and Ph.D.
Data Elements & Reporting Systems:
Public Colleges &
Technical Institutes Universities
Private University
Colleges
Data reported through (or calculated by)
Program identification data PRS PRS PRS
Aggregate costs for graduates (program
completers)
LERS LERS LERS
Number of graduates (program completers) LERS LERS LERS
Average cost per graduate (program completer) Calculated Calculated Calculated
3. Demand and Capacity
The purpose of this information set is to show the level of demand for credit programs and the degree
to which demand is being met by program opportunities (capacity). These and various other measures
may be used to indicate whether there is sufficient level of demand for programs and whether
appropriate structures (institutions, faculties, departments, programs) are in place to meet the
demand.
Indicator(s) Apply to:
Public Colleges &
Technical
Institutes Universities
Private
University
Colleges
Qualified applications as % of entry places
available
X - -
Number of applications and applicants to this
institution only, to this and other institutions
– to this program only, to this and other
programs
X - -
% of qualified applications not
accommodated
PBU only - -
% of available course seats filled PBU only - -

KPIRS Reporting Manual August 2012.docx August 2012
Page | 103
Level of Reporting: By program for all program types except Preparatory & Basic Upgrading and
General Studies [see page 95]:
Public Colleges & Technical Institutes at ProgID level
Former Vocational Colleges at ProgID level
By “program area” for Preparatory & Basic Upgrading – data generated at
the course level are to be aggregated to Program ID Level.
Scope: Information required for all program types except General Studies:
Preparatory & Basic Upgrading, Skill Training, Trade Certificate, Certificate,
Diploma, Other Career (Post-Certificate), University Transfer, Applied
Degree, and Bachelor Degree [see page 92].
Data Elements & Reporting Systems:
Public Colleges &
Technical
Institutes Universities
Private
University
Colleges
Data reported through (or calculated by)
Program identification data PRS - -
Application cutoff by quantity (quantity) PRS - -
Application cutoff by date (date) PRS - -
Qualified applications PRS - -
Program capacity (entrants) PRS - -
Qualified applications as % of capacity Calculated - -
# of applicants this institution only this
program only
DAD - -
# of applications this institution only this
program only
DAD - -
# of applicants this institution only this and
other programs
DAD - -
# of applications this institution only this and
other programs
DAD - -
# of applicants this and other institutions DAD - -
# of applications this and other institutions DAD - -
For PBU programming
Program identification data PRS - -
Application cutoff by quantity (quantity) PRS - -
Application cutoff by date (date) PRS - -
Qualified applications PRS - -
Registered in program Data Entry - -
# of qualified applicants not accommodated Data Entry - -
% of qualified applicants not accommodated Calculated - -
# of course seats available Data Entry - -
# of course seats filled Data Entry - -

KPIRS Reporting Manual August 2012.docx August 2012
Page | 104
% of available seats filled Calculated - -
4. Freshman Student Persistence
These indicators are measures of persistence for students new to the first year of undergraduate
programs at a university or a private college. Attrition between September 30 and December 1 is
determined and a first session retention rate calculated. The number of students returning in the
following year is determined and first-to-second year retention rate is calculated. First year leavers are
categorized as those required to withdraw, those who transferred to other Alberta post-secondary
institutions, and others not returning.
Indicator(s) Apply to: Colleges &
Technical Institutes Universities
Private University
Colleges
Retention Rate – Sept. to December - except AU X
Retention Rate – Year to Year - except AU X
Freshmen not returning:
% required to withdraw - except AU X
% transferring to other Alberta PSIs - except AU X
% other - except AU X
Level of Reporting: By program [see page95 ]:
Universities at ProgID level
Private University Colleges at ProgID level
Scope: Information required for credit programs in which cohorts of freshmen
commence study toward an undergraduate degree, diploma or certificate.
Data Elements & Reporting Systems:
Colleges &
Technical
Institutes Universities
Private
University
Colleges
Data reported through (or calculated by)
Program identification data - PRS PRS
# of freshman students:
Enrolled full-time at Sept. 30 (Year x) - Data Entry Data Entry
Enrolled full-time or part-time Dec. 1 (Yr x) - Data Entry Data Entry
Attrition September to December - Calculated Calculated
Retention rate - September to December - Calculated Calculated
# enrolled full-time December 1 (Year x) - Data Entry Data Entry
# enrolled full-time or part-time December 1
(Year x+1)
Retention rate - Year to Year - Data Entry Data Entry
# of full-time freshman students December 1
(Year x) who did not return for the following
Fall session:
- Calculated Calculated
# required to withdraw - Data Entry Data Entry
% of total not returning - Calculated Calculated
# of transfers to AB PSIs - Data Entry Data Entry
% of total not returning - Calculated Calculated

KPIRS Reporting Manual August 2012.docx August 2012
Page | 105
# of others not returning - Data Entry Data Entry
% of total not returning - Calculated Calculated
Total not returning - Calculated Calculated
5. Program Completion – Other Institutions
Program Completion indicators are intended to show whether students who enter as full-time students
complete their programs of study over a reasonable periods of time.
For Colleges and Technical Institutes, the “program completion rate” is the proportion of an entry
cohort, expressed as a percentage, who complete a one year or shorter program within two years, or a
two year or longer program within three years, following the earliest year in which a student with a full
year program load would normally be expected to complete the program. Completion rates are
calculated to include those who complete the program entered and those who transfer to and complete
other programs.
For Universities and Private University Colleges, the “program completion rate” is the proportion of
students, adjusted for freshmen not returning in the year following entry, who proceed to complete an
undergraduate degree or diploma program successfully within a period ending three years after the
earliest year in which a student with a full annual program load would normally be expected to
complete the program. Completion rates are calculated to include those who complete the program
entered and those who transfer to and complete other programs.
Indicator(s) Apply to:
Public Colleges &
Technical Institutes Universities
Private
University
Colleges
Program completion X Except AU X
Transfers to other institutions - Optional Optional
Non-completers still active Discontinued Discontinued Discontinued
Level of Reporting: By program [see page 95]:
Public Colleges & Technical Institutes at XrefID level
Universities at XrefID level
Private University Colleges at XrefID level
Scope: Information required for the following parchment program types: Skill
Training, Trade Certificate, Certificate, Diploma, Other Career (Post-
Certificate), Applied Degree, and Bachelor Degree [see page95]. Graduate
programs are not included.
Data Elements & Reporting Systems:
Public Colleges & Technical
Institutes Universities
Private
University
Colleges
Data reported through (or calculated by)
Program identification data PRS PRS PRS
Entry stream {freshman/other} - Calculated Calculated
Entry year PRS PRS PRS
Earliest completion year Calculated Calculated Calculated
Program length PRS PRS PRS

KPIRS Reporting Manual August 2012.docx August 2012
Page | 106
Entry cohort LERS - -
# of completers entry program LERS - -
# of completers other programs LERS - -
Program completion rate -entry
program
Calculated - -
Program completion rate - total Calculated - -
Completion cohort - Data Entry Data Entry
# of completers entry program - Data Entry Data Entry
# of completers same faculty - Data Entry -
# of completers other faculties - Data Entry -
# of completers other programs - - Data Entry
Program completion rate - entry
program
- Calculated Calculated
Program completion rate - total - Calculated Calculated
Transfers to other institutions - Data Entry Data Entry
Non-completers still active - Discontinued Discontinued
Generating College & Technical Institutes’ Program Completion Elements from PRS and LERS Data
The following steps will be used by the department to generate program completion information
elements from PRS and LERS data:
1. Identify programs for which program completion rates are to be reported and classify by KPI
Program Type.
2. Classify programs by program length.
3. For a given entry year, establish the earliest completion year for each program.
4. For each program count the number of full-time students new to the program in the entry year.
Where students have switched or transferred between programs during the entry year, count the
student in the last program of entry. This is the “Entry Cohort”.
5. For each program, count the number of students who complete graduation requirements for the
program by June 30th
of the earliest completion year (column 1 in the following table) and, count the
number who completed requirements for any other diploma or certificate during the same period
(column 6).
Number of Completers – Entry Program Number of Completers - Other Programs
by June 30 by June 30 by June 30 by June 30 Total by June 30 by June 30 by June 30 by June 30 Total
(1) (2) (3) (4) (5) (6) (7) (8) (9) (10)
Repeat for two more years for one-year programs and three more years for two year and longer
programs, and accumulate the results.
6. Add numbers of completers in entry programs to numbers of completers in other programs and
divide the total by the number of students in the Entry Cohort to produce the completion rate for
the program.
7. Repeat for each program.
Notes re: Colleges & Technical Institutes
� Students who entered a cohort as full-time students and whose status changes to part-time will
remain in the cohort.

KPIRS Reporting Manual August 2012.docx August 2012
Page | 107
� Internal transfer students (transferring within the institution to another “new” program in a
subsequent year) will remain in the “entry” cohort of the earlier year. Completion rates will be
reported for those who completed their entry program and for those who completed another
program. Students who transfer before June 30 of their year of entry will be included in the
program of record as at June 30 of that year.
� Institutions with significant numbers of students transferring internally or externally from
programs other than those specified for University Transfer Program Leaver reporting may wish to
provide supplementary information and/or reference notes.
Generating Universities and Private University Colleges Program Completion Elements from PRS and
LERS Data
The following steps will generate program completion information elements from PRS and LERS data
when available, and should be applicable to local databases in the interim:
1. Identify programs at the Standard Name level for which program completion rates are to be
reported and classify by faculty.
2. Classify programs by program length. Where a Standard Name classification includes separate
programs (at the ProgID level) of different lengths, group the programs based on length and create a
separate cohort for each group.
3. For a given entry year “x”, establish the earliest completion year “x+y-1” for each program. For
December 1996 reporting the entry year 1988-89 was agreed upon. This is to be advanced by one
year in each subsequent reporting year.
4. Establish an entry cohort for each program or sub-program. Identify the number of full-time
undergraduate students new to the program in the entry year or appearing for the first time as full-
time students. Exclude unclassified, visiting, audit-only, probationary and special students.
5. Where students have switched or transferred between programs during the entry year or between
the entry year and their second year, remove them from their original entry cohort and add them to
the entry cohort (same stream) for their “new” program (as if they had entered that program at the
outset). Exclude any internal transfers who were in the entry year of a cohort in a prior year since
they will have been “reclassified” in this way.
6. Remove any freshman students who are not continuing in the institution in the Fall after the entry
year.
7. Subdivide the entry cohort into a freshmen entry stream and an “other (than freshmen)” entry
stream. These are the “Completion Cohorts”.
8. Check to ensure that no student is in two entry cohorts of the same year.
9. For each cohort, identify the students who completed graduation requirements for any
undergraduate degree, diploma or certificate during the period ending three years after the earliest
completion year. Group and count the completers in three categories – completing the same
program, completing a different program in the same faculty, or finishing any other program.
10. Aggregate the results from step 9.
11. Divide the total number of completers by the number of students in the Completion Cohort to
produce the completion rate for each program or program sub-group.
Note re: Cooperative Programs -

KPIRS Reporting Manual August 2012.docx August 2012
Page | 108
The cooperative program model and similar delivery arrangements can introduce periods of up to a year
(or more) during which normal academic study is interrupted, with the effect that earliest completion
year for students in the “co-op” offering of a program will be later than for students in the regular
program. In such cases, the offering should be defined as a separate program with the program length
and earliest completion year based on the particular structure and characteristics of the program.
6. Transferability of Courses The purpose of this indicator is to provide some indication of the transferability of courses among post-
secondary institutions in Alberta. Information provided through the Transfer Guide published annually
by the Alberta Council on Admissions and Transfer (ACAT) will be analyzed to provide quantitative
indicators of the extent of transferability of courses and multi-course transfer agreements.
Indicator(s) Apply to:
Comprehensive
Academic &
Research Institution
Baccalaureate Academic
and Applied Studies
Institution, Polytechnical
Institutions, Specialized
Arts & Culture Institutions
Comprehensive
Community
Colleges
Independent
Academic
Institutions
Number of courses
accepted by 1, 2, 3, or
more Alberta post-
secondary institutions - X X -
Number of transfer
agreements - X X -
Level of Reporting: By institution
• Comprehensive Community College
• Polytechical Institutions
• Specialized Arts and Culture Institutions
• Baccalaureate and Applied Studies
Institutions
at the institutional level
at the institutional level
at the institutional level
at the institutional level
at the institutional level
Scope: Transferability indicator information will be generated for the Baccalaureate
and Applied Studies Institutions, Comprehensive Community Colleges
Specialized Arts & Culture Institutions and the Polytechnical Institutes
included as “sending” institutions in the Alberta Council on Admissions and
Transfer’s Transfer Guide database.
Note:
The KPI Policy Committee has accepted a recommendation that the scope of this indicator be expanded
to include transferability of courses between Alberta post-secondary institutions generally – not just from
baccalaureate and applied studies institutions, comprehensive community colleges and polytechnical
institutes to the comprehensive academic & research institutions and the independent academic
institutions. The Department is working with ACAT in this regard.
Data Elements &
Reporting Systems:
Comprehensive
Academic &
Research
Institution
Baccalaureate Academic
and Applied Studies
Institution, Polytechnical
Institutions, Specialized Arts
& Culture Institutions
Comprehensive
Community
Colleges
Independent
Academic
Institutions

KPIRS Reporting Manual August 2012.docx August 2012
Page | 109
7. University Transfer Program Leavers
The purpose of this indicator is to provide information with respect to the performance of approved
University Transfer programs at the nine colleges with such programs. Two important rates traditionally
used by the department and Alberta Council on Admissions and Transfer (ACAT) will be calculated and
reported so as to reflect the various possible outcomes of a University Transfer program - the
percentage of the total number of full-time students in a University Transfer program that transfer in a
subsequent year, and the percentage of leavers that transfer after leaving the program.
Transfers to Alberta universities or private colleges with accredited degree programs will be included in
the calculation. Supplementary data are being collected and separate calculations are done for transfers
to degree-level programs and to other programs at “Other Alberta Post-Secondary Institutions”
(Colleges and Technical Institutes).
Because Lakeland College is funded specifically as an inter-provincial college, and because auditable
data are available, its transfers to universities in Saskatchewan will be included.
Level of Reporting: By program [see page 95]:
Public Colleges & Technical Institutes at ProgID level
Scope: The nine approved University Transfer programs at the nine Public Colleges
which offer such programs: UT: Bachelor of Arts, UT: Bachelor of Business
Administration, UT: Bachelor of Education, UT: Bachelor of Engineering, UT:
Bachelor of Fine Arts, UT: Bachelor of Physical Education, UT: Bachelor of
Science, UT: Bachelor of Social Work, UT: General.
Note:
The KPI Policy Committee has accepted a recommendation that the concept of this indicator be
extended to include student mobility and transfer of credit between programs and institutions
beyond the sets defined by approved university transfer programs. The feasibility of this expansion
Data reported through (or calculated by)
Number of transfer
courses - ACAT Data Entry - -
Number accepted by:
Only one receiving
institution - ACAT Data Entry - -
Only two receiving
institutions - ACAT Data Entry - -
Only three receiving
institutions - ACAT Data Entry - -
More than three
institutions - ACAT Data Entry - -
Number of transfer
agreements - ACAT Data Entry - -
Indicator(s) Apply to:
Public Colleges &
Technical Institutes Universities
Private University
Colleges
Transfer rates to Alberta universities
and private university colleges X - -
Transfer rates to other Alberta post-
secondary institutions X - -

KPIRS Reporting Manual August 2012.docx August 2012
Page | 110
and the most efficient ways and means of generating and reporting the required data are currently
under examination.
Specifications & Protocols:
“Cohort” (Enrolment in Year x) - The number of full-time students in a University Transfer program in a
given year as recorded in LERS. Students new to the institution later than the Fall session are
excluded unless in a compressed program designed for transfer in the following Fall (Year x+1).
Cohort reference year - The academic year of attendance of the cohort, usually the year prior to the
reporting year.
Status at college - Fall of Year (x+1) - The enrolment status of students in the cohort at the college, in
the Fall of Year (x+1), the year following the cohort reference year. Headcount measures of the
number of students attending the following types of programs:
Same UT program - Continuing in the same UT program as in Year (x).
Other UT program - Enrolled in a different UT program.
Data Elements & Reporting Systems: Public Colleges &
Technical
Institutes
Universities Private
University
Colleges
Data reported through
Program identification data PRS - -
“Cohort” (Enrolment in Year x) LERS - -
Status at college – Fall of Year x+1
Same UT program Data Entry - -
Other UT program Data Entry - -
Other degree program Data Entry - -
Other program Data Entry - -
Left the college (“Leavers”) Calculated - -
Attending Alberta university or private
university college – Year x+1
(UNI/PUC) Data Entry - -
Attending Alberta university or private
university college – Year x+2
(UNI/PUC) Data Entry - -
Attending other Alberta post-
secondary institution – Year x+1 –
degree-level (CTI) Data Entry - -
Attending other Alberta post-
secondary institution – Year x+2 –
degree-level (CTI) Data Entry - -
Attending other Alberta post-
secondary institution – Year x+1 –
other programs Data Entry - -
Attending other Alberta post-
secondary institution – Year x+2 –
other programs Data Entry - -

KPIRS Reporting Manual August 2012.docx August 2012
Page | 111
Other degree program - Enrolled in a degree-level program (applied degree programs, collaborative
nursing, and certain brokered degree programs) at the college.
Other program - Enrolled in a program other than an UT or degree-level program.
Left the college (“Leavers”) - Not enrolled at the college in Year (x+1).
Attending an Alberta university or private university college with accredited degree programs - Year
(x+1), Year (x+2) - “Headcount” measures of the number of “leavers” from a university transfer
program in one year who are enrolled in a degree program at an Alberta university or private
university college with accredited degree programs in each of the next two years, as identified in the
ACAT Duplicate Application Detection database for the Fall session.
Attending other Alberta post-secondary institutions - Year (x+1), Year (x+2) - “Headcount” measures of
the number of “leavers” from a program in one year who are enrolled in a program at an Alberta
institution other than a university or a private university college with accredited degree programs, in
each of the next two years, as identified in the ACAT Duplicate Application Detection data for the Fall
session. Data will be segregated for degree-level programs (applied degree programs, collaborative
nursing, certain brokered degree programs and the Fine Arts degree offered by ACAD) and for other
programs.
Transfer rates - Various rates of transfer and continuation will be calculated to show the flow out of the
UT program to the various destinations, the primary destination being transfer to university. Two
denominators are available for calculating the rates, the UT cohort itself, and the portion of the
cohort that did not return to the institution [Leavers]. Insofar as the intent is to track the entire
“cohort” as defined above, the “cohort” will be the primary denominator. Rates calculated for the
number of students transferring in Year (x+1) can be updated by using the total number of transfers
for Year (x+1) and Year (x+2) when the latter become available.
Note re: Transfer to Institutions outside Alberta.
There are no system-level sources for the information regarding student transfer to institutions outside
Alberta. Graduate and/or leaver follow-up studies undertaken by each institution may provide data to
support a note, commentary and/or estimates, particularly where there are established relationships,
paths or patterns of transfer. As noted above, the official transfer rate for Lakeland College will include
transfers to universities in Saskatchewan, to the extent that, the data are supported by auditable
records. In preparing its report, Lakeland College should include transfers to universities in
Saskatchewan and maintain auditable records of the source data and calculations.
8. University Transfer Student Performance
This indicator deals with the question of how students who first attend a university transfer program at
an Alberta public college subsequently perform at university by measuring the number who are
successful in their first year following transfer to a university program.
Level of Reporting: By sending institution by program [see page 95]:
Universities at ProgID level
Private University Colleges at ProgID level
Indicator(s) Apply to:
Public Colleges &
Technical Institutes Universities
Private University
Colleges
Percentage of transferees successful
in Year 1 - X X

KPIRS Reporting Manual August 2012.docx August 2012
Page | 112
Scope: Information required for programs to which students are admitted on the
basis of academic work completed in a university transfer program at one of
the seven Alberta public colleges with approved university transfer
programs.
Data Elements & Reporting
Systems:
Public Colleges &
Technical Institutes Universities
Private University
Colleges
Data reported through (or calculated by)
Sending institution - KPIRS/LERS KPIRS/LERS
Program identification data - PRS PRS
Number of transferees - Data Entry Data Entry
Number successful in Year 1 - Data Entry Data Entry
Number successful in Year 1
/ Number of transferees
- Calculated Calculated