mwd-75-95 implementation of the older americans
TRANSCRIPT
COMPTROLLER GENERAL OF THE UNITED STATES
WASHINGTON. D.C. 20548
B-165430
d 18 1915
The Honorable Frank Church
Cr Chairman, Special Committee on Aging SS- /United States Senate
t1 Dear Mr. Chairman:
In accordance with the September 30, 1974, request madeg% by you and the Chairmen, Subcommittee on Aging, Senate Com- Srl~
mittee on Labor and Public Welfare; and the Select Subcom-Kl mittee on Education, House Committee on Education and Labor, i ;/
and agreements with your office, we have studied the Limple-mentation of the O der Americans Comprehensive ServicesAmendments of 1973 (Public Law 93-29).
We interviewed officials of the 28 area agencies onaging, 17 State agencies on aging, and 9 Department of Health,Education, and Welfare regional offices listed in enclosure I.During these interviews we filled out questionnaires developedin cooperation with your office. We interviewed also represen-tatives of selected area agency.grantees, local governments,councils of government, and review agencies established in ac-cordance with Office of Management and Budget Circular A-95.Our study emphasized (1) identification of problems experi-enced by the Department of Health, Education, and Welfare'sOffice of Human De'velopment Regional Program Directors on Agingand State and local.officials in implementing the Comprehen-sive Service Amendments and (2) obtaining their assessments ofthe programs established under the amendments.
Although we have not fully evaluated all the data, thisis a brief interim report responding to your office's informa-tion needs during consideration of amendments to the OlderAmericans Act. We will continue to evaluate and summarize theresponses to our questionnaires and will provide you with afinal report. In addition, only 15 of the 17 States we vis-ited are discussed in this report because the information con-cerning 2 States' programs has just been obtained and not yetevaluated. However, we will discuss their programs in ourfinal report.
BACKGROUND
The Older Americans Act of 1965 (Public Law 89-73) pro-vided services and programs for older persons through three
rtaLI o 1 [ MWD-75-95
B-165430
grant programs for (1) community planning and services, (2)research and demonstration, and (3) personnel training inthe field of aging. This act also established the Adminis-tration on Aging within the Department of Health, Education,and Welfare. The Older Americans Act Amendments of 1967(Public Law 90-42) extended each of these provisions. TheOlder Americans Act Amendments of 1969 (Public Law 91-69)also extended these provisions and added a program of grantsfor model projects and a new volunteer program under whichthe Foster Grandparent and Retired Senior Volunteer programswere authorized. The 1972 amendments to the act (PublicLaw 92-258) authorized a National Nutrition Program for theElderly.
The Comprehensive Service Amendments of 1973 estab-lished the "area agency concept" under title III of the actto develop at the substate level a system of comprehensiveand coordinated services for older persons. Before the 1973amendments, title III moneys were allotted to the States forallocation to local agencies which provided specific socialprograms.
Title III, as amended, authorized formula grants to theStates for developing comprehensive and coordinated systemsfor delivery of social services to the elderly and for modelprojects. To participate in the title III formula grant pro-gram, a State must designate a sole State agency to
--develop a State plan to be submitted to the Commis-sioner on Aging for approval,
-- be primarily responsible for coordinating all Stateactivities related to the purposes of the Older Ameri-cans Act, and
-- divide the entire State into planning and serviceareas.
In dividing a State into planning and service areas, theState agency must consider the geographical distribution ofindividuals aged 60 and older, the need for social services(including the numbers of older persons with low incomes resid-ing in the area), the distribution of resources available toprovide these services, the location of units of local govern-ment and any other relevant factors. Any local governmentwhich has a population within its jurisdiction aged 60 orover of 50,000 or more, or which contains 15 percent or moreof the State's population aged 60 or over, is to be designatedas a planning and service area. However, the State may desig-nate as a planning and service area any region within the
2

B-165430
State which includes one or more local government units whenthe State determines that the designation is necessary foreffective administration.
After making these designations, the State agency deter-mines the planning and service areas for which an area planwill be developed and names (after considering the views oflocal government units in the area) a single public or non-profit private agency or organization as the area agency.Department of Health, Education, and Welfare regulations re-quire each area agency to annually submit to the State agencyfor approval, its area plan for developing comprehensive andcoordinated systems for delivery of social services to theelderly throughout the area.
In order for the award of funds to be approved by theState agency, the area plan must provide for a continuousarea agency process of planning, including defining and re-defining objectives and establishing priorities; and creat-ing or strengthening action programs within the area forcoordinating delivery of existing services for older persons,and pooling of untapped resources. Title III funds awardedto a State for area planning and social service programs maybe used to fund up to 75 percent of the cost of administeringan area plan and up to 90 percent of social services providedunder the plan. Individual social services may be funded forno longer than 3 years unless the Commissioner, after obtain-ing State agency's views, approves further funding.
Since 1965 virtually all the States and territories havecreated State agencies on aging. According to officials ofthe Administration on Aging, 412 local area agencies on aginghad been funded under title III of the Older Americans Actby January 1, 1975. Most of these had been designated betweenJanuary and June 1974. Eventually, the States plan to es-tablish 586 area agencies.
Department of Health, Education, and Welfare regulationsrequire also that, whenever possible, Indian reservations bedesignated as planning and service areas, and that the tribalorganization of reservations be designated as the area agency.Eight States in our sample had Indian reservations which werenot designated as planning and service areas. Officials infive States said the small number of elderly Indians livingon the reservations was a primary reason for not making thedesignation. Officials of the other three States said thatthe planning and service area boundaries followed existingsubstate boundaries which did not make allowances for Indianreservations.
3

B-165430
ALLOCATION OF RESOURCES
After the State agency approves an area plan, it mayallocate funds to an area agency to support
-- planning, pooling, and coordination;
-- outreach, information, and referral services designedto assist older persons to become aware of social serv-ices available in the area;
--transportation and escort services; and
-- other social services needed by older persons butwhich no public or private agencies of the area canor will provide (commonly referred to as gap-fillingservices).
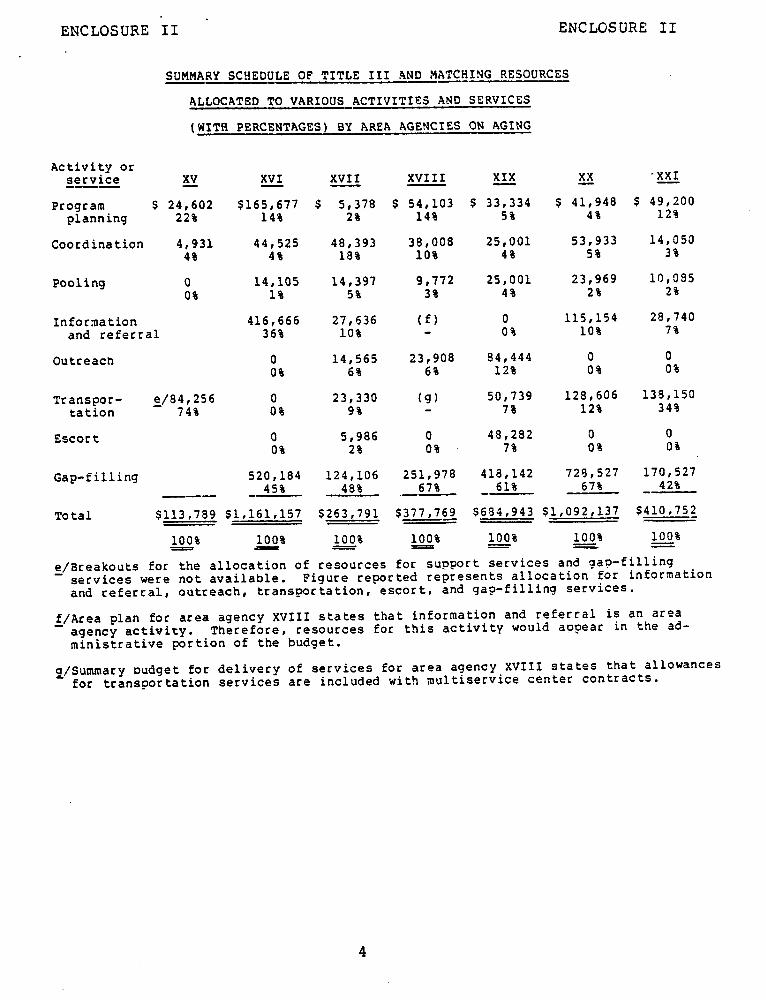
We obtained budgetary data to determine how the areaagencies allocated their resources to (1) program planning,(2) coordination of the delivery of existing services, (3)pooling of existing but untapped resources, (4) informationand referral, (5) outreach, (6) transportation, (7) escort,and (8) gap-filling services. Enclosure II presents a sum-mary of the allocation of resources by the area agencies.
Generally, the area agencies did not feel they werereceiving sufficient funds for obtaining necessary staff toadminister the program. Officials at most area agencies saidthat, because of insufficient resources at the local level,they probably would not be able to continue providing socialservices after the 3-year limit for Federal support expires.
Pooling of untapped resources focuses upon "potential"rather than actual resources. Potential refers to resourceswhich are not being used for the benefit of older persons,regardless of whether they are being used for some popula-tion other than the elderly.
Of the 28 area agencies sampled, 24 had pooled fundsfrom local government revenues, 20 from other public revenues,18 from revenue sharing funds, and 11 from State general rev-enues.
Department of Health, Education, and Welfare regulationsstate that, for fiscal year 1975 and each fiscal year there-after, not less than 25 percent of the non-Federal share ofthe total expenditures under the State plan shall be met with
4

B-165430
funds from State or local public sources. In most instancesthe area agencies received the bulk of their non-Federalmatching funds from local governments or private sources.Twenty area agencies received no non-Federal matching fundsfrom State governments. Enclosure III presents a summary ofsources for non-Federal matching funds.
Use of title III funds as a catalyst
During consideration of the 1973 amendments to the OlderAmericans Act, the Senate Committee on Labor and Public Wel-fare indicated that title III funds were to be used as acatalyst to attract increasing commitments of public and pri-vate resources. Similarly, Department of Health, Education,and Welfare regulations provide that area agencies must eachyear acquire and spend non-Federal resources in an amountnot less than that of the previous year. This has been com-monly referred to as the local maintenance of effort rule.According to the Commissioner of the Administration on Aging,this provision is to insure that non-Federal resources alreadycommitted to aging programs are not withdrawn as a result ofincreases in title III funds. There was no consensus amongarea agency officials as to whether this maintenance of effortrequirement increased the catalytic effect of title III funds.Those officials in favor of the requirement believe that itinsures the continued funding of programs and forces granteesto work toward total independence. Others said that as a re-sult of this requirement potential funding sources hesitateto support the programs.
On April 9, 1975, the Commissioner announced that afterclosely reviewing the local maintenance of effort rule govern-ing title III grantees, the Administration on Aging had decidedto repeal this provision by deleting it from the Department ofHealth, Education, and Welfare's regulations. According tothe Commissioner, this action is being taken because the rulehas been troublesome in many respects--from a conceptual, aswell as a practical standpoint.
ABILITY TO FULFILL BASIC RESPONSIBILITIESAND COORDINATE EXISTING SERVICES
The area agencies are the principal focus of activityunder the Older Americans Act and, accordingly, functionlargely to (1) close the gaps between the needs of older per-sons and the services available to meet their needs, (2) im-prove the linkage of services into a comprehensive, coordi-nated system, and (3) advocate the needs of the elderly withinlocal areas. The area agencies are also responsible for
5
B-165430
-- providing leadership and advocacy on behalf of olderpersons,
-- determining the need for social services,
--inventorying local resources,
--establishing program objectives and priorities,
--planning with planning agencies and local providers ofservices,
-- coordinating the delivery of services,
-- pooling available untapped resources,
-- periodically evaluating and monitoring the performanceof contractors and grantees,
-- conducting public hearings concerning the needs of theelderly,
--collecting and disseminating information concerning theneeds of the elderly,
--providing technical assistance to service providers,
--arranging for legal services for older persons,
--arranging for older persons to aid in day care centers,
-- establishing an advisory council, and
-- considering the views of recipients of services underthe area plan.
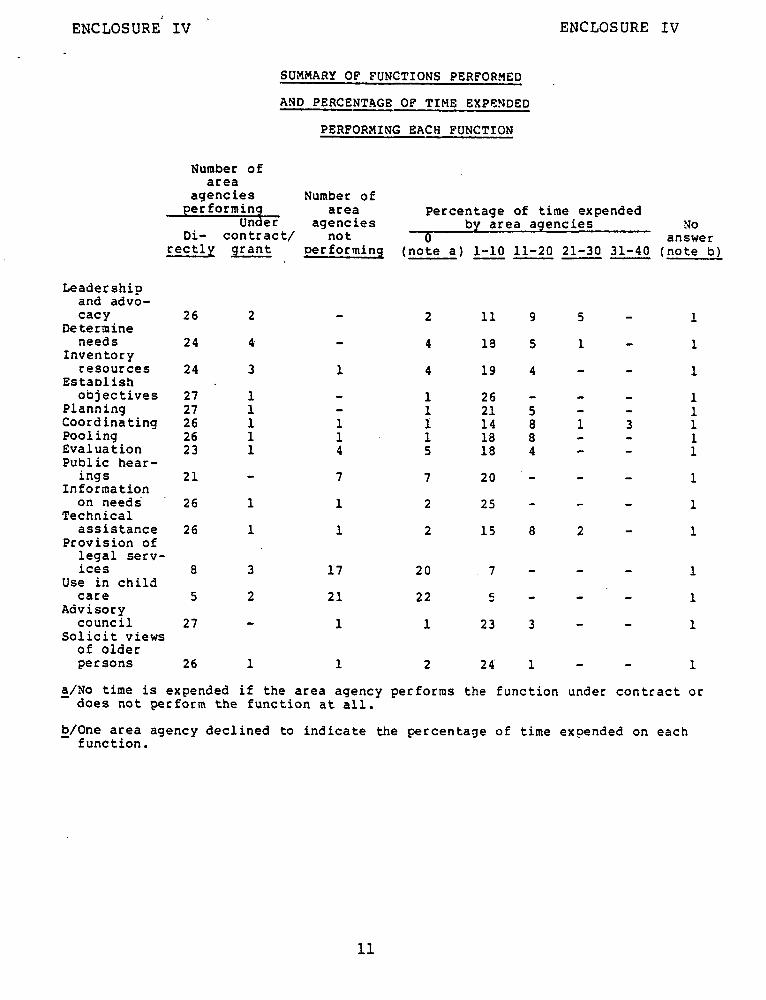
Except for arranging legal services for older persons andarranging for older persons to aid in day care centers, themajority of area agencies were performing the above functionseither directly or under contract or grant. Enclosure IV showsthe number of area agencies performing these functions and theapproximate amount of time devoted to each.
As shown in enclosure IV, more than half of the areaagencies are arranging for neither legal services nor forolder persons to aid in day care centers. Many of the offi-cials at area agencies, as well as State agencies and Depart-ment of Health, Education, and Welfare regional offices,stated that the area agencies should not be responsible for
6
B-165430
performing these functions because they (1) did not haveavailable staff to assign to them, (2) had assigned higherpriorities to other functions, and (3) believed that otherorganizations were capable of providing them. Some officialstold us they viewed these as services rather than functionsand believed they should be treated as such.
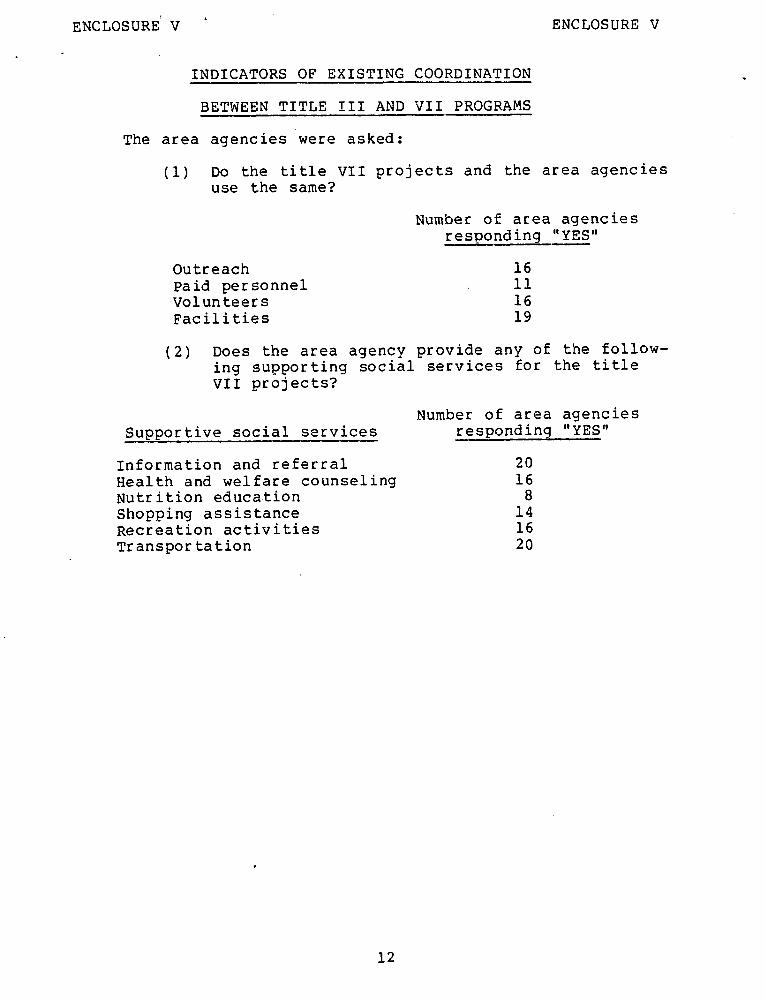
In contrast, many officials at the area agencies saidthey should be given additional responsibility for coordi-nating their existing functions with the Older Americans Acttitle VII nutrition programs. As shown in enclosure V, mostof the area agencies shared facilities, outreach services,and volunteers with the local title VII projects; 11 used thesame paid staff as the title VII project in their areas; andmost provided information and referral services, health andwelfare counseling, recreation activities, and transportationservices to the local title VII projects.
Regional officials stated that area agencies varied intheir ability to perform both the coordination and poolingfunction. The principal reasons given for these varianceswere
--capability of the area agency director,--length of time the area agency had been in existence,--attitudes and capability of area agency staff, and-- attitudes of and support from local organizations.
Although the extent of activities varied, area agencieshad pooled from revenue sharing funds, State general funds,local government funds; and other public funds. Local govern-ment and other public funds were the most frequent sourcesfrom which the area agencies pooled funds. Revenue sharingand State general funds were sought to a lesser degree.
Most of the area agencies believed that their ability topool funds would be enhanced if the States provided additionalguidance and support. Officials at some of the area agenciescommented that the State did not tell them how to obtain fundsfrom other sources. They also believed the State shouldnegotiate more agreements at the State and Federal levelswhich could benefit the area agencies at the local levels.
Some area agencies have occasionaly experienced diffi-culty in obtaining revenue sharing funds because these moneyswere earmarked for capital expenditures. Other area agenciesfound that these funds were scarce and the competition wasstrong for those that were available.
7

B-165430
Advisory councils
The Older Americans Act and Department of Health, Educa-tion, and Welfare regulations require each area agency toestablish an advisory council, composed of representativesof program participants and the general public, to advise thearea agency on all matters relating to the development andadministration of the area plan and operations conductedthereunder. The act also contains a similar requirement fora State advisory committee.
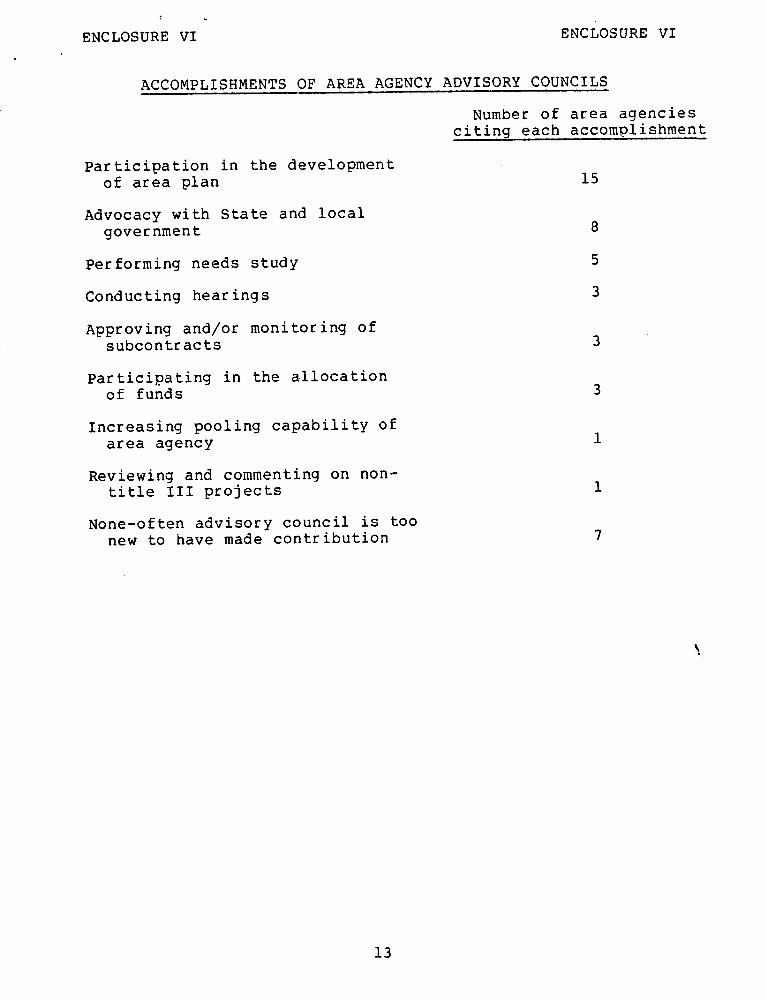
Most of the States felt that the area agency advisorycouncils and State advisory committees had made significantcontributions to the program. However, two States believedthat the contributions of State advisory committees were notas important as those of the area agency advisory councils.One State official said that the advisory groups were toolarge to be effective. Twenty-six of the area agencies wevisited had advisory councils, and their membership rangedfrom 11 to 92 people. Officials of three Department ofHealth, Education, and Welfare regional offices believed ad-visory councils and committees had not made significant con-tributions to the aging programs. Enclosure VI is a summaryof State and area agency responses concerning the effective-ness of advisory committees and councils.
Serving the Doorand minorities
Department of Health, Education, and Welfare regulationsrequire that, to the extent feasible, considering availableresources, low income and minority individuals should beserved at least in proportion to their relative numbers inthe planning and service area.
Only a small number of the area agencies we visitedhave been unable to comply with this regulation. In severalinstances, the area agencies were serving the low income andminority far in excess of their relative numbers in the plan-ning and service area.
Even with these successes, the area agency officialsinterviewed cited several problems associated with servingpoor and minority individuals. The most frequently statedproblems were (1) language barriers, (2) cultural differences,(3) identification of individuals belonging to these groups,and (4) the reluctance of some elderly to participate in whatthey consider a "welfare" or "hand-out" program.
8

B-165430
To overcome these problems, area agencies were includingrepresentatives from minority groups on advisory councils, em-ploying bilingual individuals, using outreach workers, andusing news media to inform poor and minority elderly aboutthe availability of the program and to overcome the image ofbeing a "hand-out" program.
Department of Health, Education, and Welfare regulationsalso require that the area plan provide for contracts orgrants to be awarded to minority individuals at least in pro-portion to their relative numbers in the planning and servicearea. Officials of 10 State agencies and 4 Department regionaloffices told us that the area agencies in their States andregions had not complied with this regulation. The primaryreasons given by them for non-compliance were that (1) thisrequirement was not stressed until after the area plans hadbeen developed, (2) there is a scarcity of experienced, com-petent minority contractors and difficulties in determiningwhat constituted a minority contractor, and (3) the existingminority contractors are often not financially competitive.
STAFF SIZE AND ABILITY TOMEET WORKLOAD
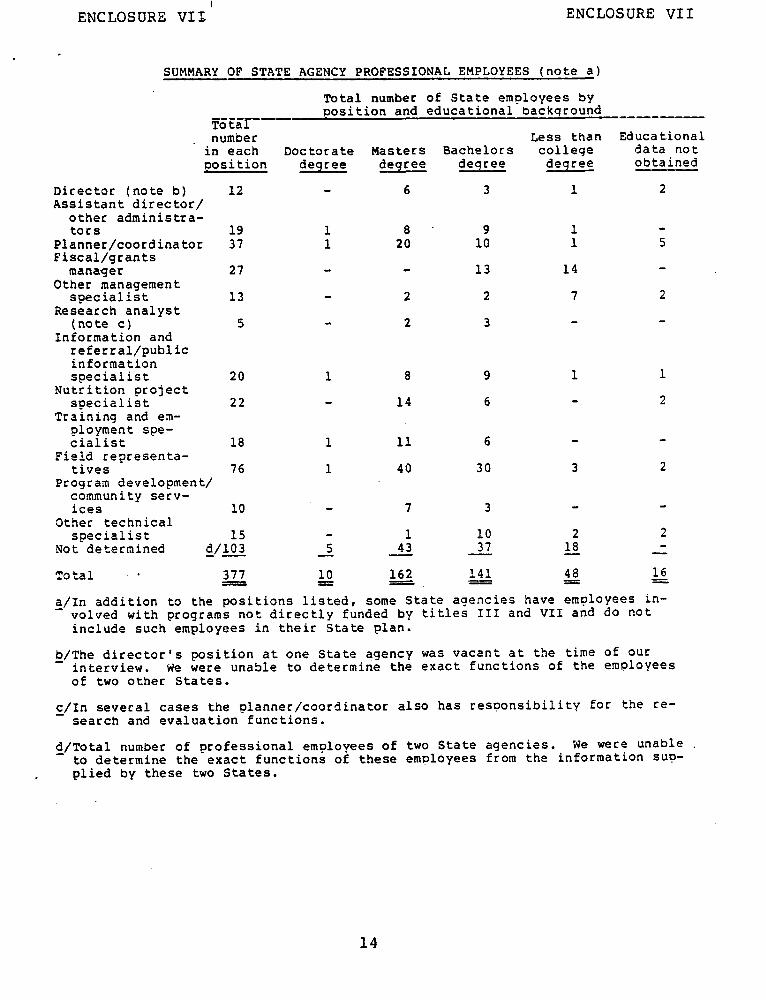
Department of Health, Education, and Welfare regulationsrequire that the single organizational unit on aging in eachState be headed by an individual possessing education and ex-perience necessary to assume leadership, and that this in-dividual's time be devoted solely to that activity. In addi-tion, this individual is to be assisted by adequate qualifiedstaff to assure the effective conduct of the State agency'sresponsibilities. Enclosure VII presents the positions oc-cupied in State agencies and the educational backgrounds ofindividuals responsible for the different activities at thelocations we visited.
Only five of the State aging agencies indicated thatthey had sufficient qualified staff to properly perform theirassigned responsibilities. Eight States specifically indi-cated that their understaffing was due to funding limitations.
Officials at two State agencies said that a substantialnumber of their staff members were not qualified for the posi-tions they held. One State is seeking to reduce the impactof this situation by reassigning some employees to less de-manding positions while another is stressing training undera tuition reimbursement program.
9
B-165430
The Older Americans Act of 1965, as amended, and Depart-ment of Health, Education, and Welfare regulations requirethat preference be given to employing persons aged 60 and overfor any position in State and area agency organizations forwhich they qualify under the governing merit employment sys-tems. In addition, the States and area agencies are requiredto develop an affirmative action plan for equal employment op-portunity. All of the State agencies we visited had employeesfrom minority groups and only one did not have any employeeswho were 60 or older.
All of the 28 area agencies had separately identifiableemployees except for one, which was operated by the local Com-munity Service Agency as part of its overall functions. Ofthe 27 area agencies which had identifiable employees, 15 didnot have anyone 60 or older on their staffs. Twelve of these27 area agencies did not have minority representation. En-closure VIII summarizes the staffing patterns of the areaagencies visited.
Most of the States said they and the area agencies werehaving difficulty implementing the affirmative action plans.The major problems were:
--Inability to attract qualified applicants.
-- Delays in getting merit systems approved and otherproblems associated with not having complete controlof hiring.
-- Small staff size prohibiting development of meaning-ful affirmative action plans.
GUIDANCE RECEIVED ANDRELATIONSHIPS WITH STATEAND FEDERAL AGENCIES
Operation of aging programs involves a substantial amountof communication among officials of the Federal and State gov-ernments and area agencies. The Administration on Aging isresponsible for developing and issuing regulations, guidelines,and related material to State and area agencies on aging tohelp insure compliance with legislative requirements. Apartfrom these requirements, the State agencies are responsiblefor establishing guidelines for area agencies to implementtheir plans. If questions arise on interpretation of regula-tions, guidelines or policy, or their applicability to parti-cular situations, the Department of Health, Education, and
10
B-165430
Welfare's Office of Human Development Regional Program Direc-tors on Aging are responsible for providing necessary clarifi-cation. We discussed channels of communication with officialsof area agencies, State agencies, and Department regional of-fices to (1) determine their reactions concerning the effec-tiveness of policy guidance and the reasonableness of direc-tives, (2) determine what they thought about reporting require-ments, and (3) solicit their opinions concerning relationshipswith each other.
Effectiveness of policy guidance
Responses from officials of 9 of the 28 area agencies in-dicated that State policy was good; 7 believed that it wasaverage; 11 officials said that it was poor; and 1 did notgive a response. The problems most frequently mentioned werethat the States' guidance was ambiguous and changed too often.
Also, we asked State officials for their opinions onthe effectiveness of regional policy guidance. Of the 15 of-ficials responding, 5 indicated that the guidance was good;2 believed that it was poor; 7 said that it was average; and 1rated policy guidance for fiscal management as poor and guid-ance for program implementation as good. The State officialsmade the following comments in connection with their responses:
--Washington gave the regional office little power andyet the States looked to the region for answers.
-- The frequency of policy changes reflected a tendencyto set overly detailed policy.
--Many new policy documents are issued which eitherchange old policies or affect related communicationswithout referring to them.
Reasonableness of directives
To ascertain responses about the reasonableness of Stateand Administration on Aging directives, we asked area agencyofficials whether they agreed that these directives were rea-sonable--offering sufficient guidance without being overlyrestrictive.
11
B-165430
Administration onState directives Aging directives
Agree 15 16Uncertain 3 5Disagree 7 7No reply 3 0
The problem with the State directives most frequentlymentioned was that they did not always provide sufficient de-tails for guidance. Area agency officials mentioned a vari-ety of problem areas with Administration on Aging directivesincluding, (1) untimeliness of issuance, (2) requirements fordestruction of information and referral records within 30days, and (3) requirements for granting service contracts tominorities.
We also asked officials of the 15 State agencies to givetheir opinions of the reasonableness of Administration onAging directives. Officials of 12 States said that the direc-tives were not reasonable, 1 was uncertain, and 2 believedthat the directives were reasonable. The problems most fre-quently mentioned concerning Administration on Aging direc-tives were that they were ambiguous, voluminous, and did notoffer sufficient guidance.
Adequacy of reporting requirements
In addition to submitting annual State plans, Stateagencies are required to submit quarterly fiscal and programreports to the regional offices. Once area agencies aredesignated in the planning and service areas, they must sub-mit their annual area plans to the States. The number offiscal and program reports which the area agencies are re-quired to prepare vary from State to State. For example,some States require-area agencies to report monthly whileother States require quarterly reports.
During our interviews, officials at 16 of the 28 areaagencies said that State reporting requirements were satis-factory. Officials at 7 of the 15 States believed that theAdministration on Aging's reporting requirements were satis-factory. Almost all of the area agency officials said thatthey received no formal feedback on or about reports submittedto the State agency. Similarly, most State officials saidthat they received no formal feedback on reports submitted tothe regional offices.
12

B-165430
State agency relationships with areaagencies and regional offices
Most of the State officials interviewed said that theirrelationships with area agencies were good. However, oneState official believed that his agency's relationship withits area agency was average to poor because the State agencybegan to administer the program at the same time the areaagencies were established. Most State officials told us thatthey had a good working relationship with the Department ofHealth, Education, and Welfare regional offices.
Suggestions for changingthe Older Americans Act
During our interviews, we asked officials of the areaagencies, States, and Department of Health, Education, andWelfare regional offices to recommend changes in legislationwhich they believed would improve the title III program. Therecommendations most frequently mentioned were to require morecoordination between title III and VII programs and to in-crease the total funding level of title III programs. A sum-mary of the major recommendations made appears in enclosure IX.
CONCLUSIONS
Because we have not fully evaluated the responses toour questionnaires and some additional verification is stillneeded on certain matters, we do not have specific conclu-sions and recommendations at this time. However, we believethat progress has been made by the States and area agenciesin implementing the Older Americans Comprehensive ServicesAmendments of 1973. Although the officials we interviewedidentified a number of problems in implementing the 1973amendments, most appear to be attributable to the relativenewness of the area agency concept and its recent beginningsin many of the States.
13
B-165430
We are sending identical reports to the Chairmen, Sub-committee on Aging, Senate Committee on Labor and Public Wel-fare, and the Select Subcommittee on Education, House Commit-tee on Education and Labor. Because of your urgent need forthis interim report, we have not obtained HEW comments onthe information presented here.
Sixty y YO
Comptroller Generalof the United States
Enclosures - 9
14
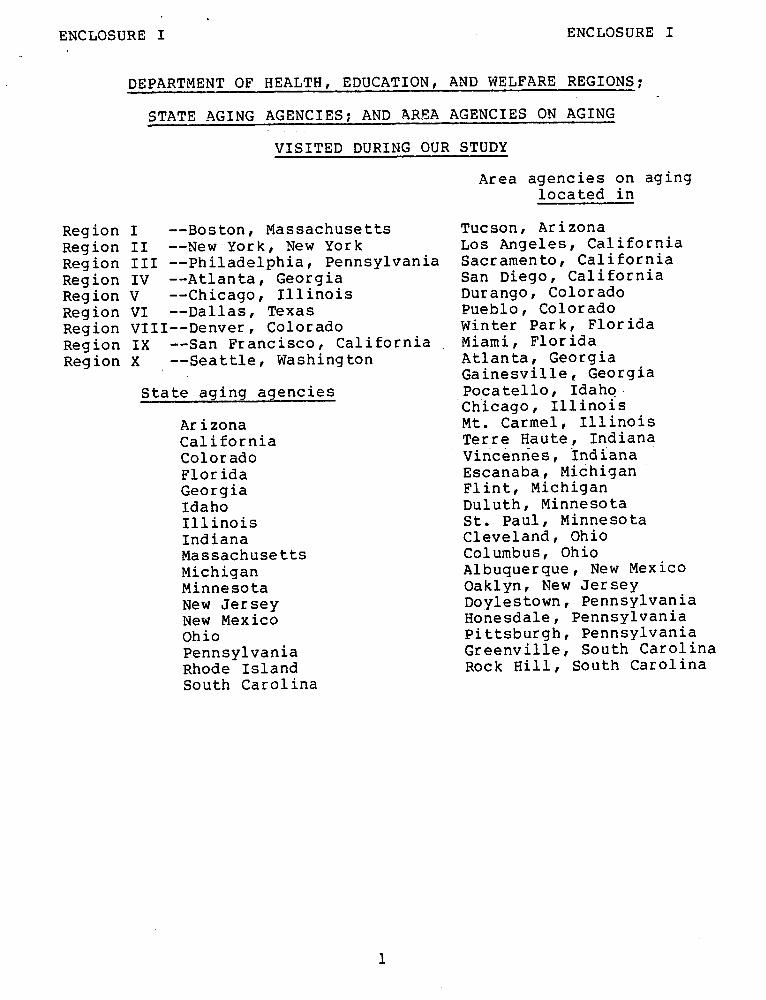
ENCLOSURE I ENCLOSURE I
DEPARTMENT OF HEALTH, EDUCATION, AND WELFARE REGIONS;
STATE AGING AGENCIES; AND AREA AGENCIES ON AGING
VISITED DURING OUR STUDY
Area agencies on aginglocated in
Region I -- Boston, Massachusetts Tucson, ArizonaRegion II -- New York, New York Los Angeles, CaliforniaRegion III -- Philadelphia, Pennsylvania Sacramento, CaliforniaRegion IV -- Atlanta, Georgia San Diego, CaliforniaRegion V --Chicago, Illinois Durango, ColoradoRegion VI -- Dallas, Texas Pueblo, ColoradoRegion VIII--Denver, Colorado Winter Park, FloridaRegion IX -- San Francisco, California Miami, FloridaRegion X -- Seattle, Washington Atlanta, Georgia
Gainesville, GeorgiaState aging agencies Pocatello, Idaho
Chicago, IllinoisArizona Mt. Carmel, IllinoisCalifornia Terre Haute, IndianaColorado Vincennes, IndianaFlorida Escanaba, MichiganGeorgia Flint, MichiganIdaho Duluth, MinnesotaIllinois St. Paul, MinnesotaIndiana Cleveland, OhioMassachusetts Columbus, OhioMichigan Albuquerque, New MexicoMinnesota Oaklyn, New JerseyNew Jersey Doylestown, PennsylvaniaNew Mexico Honesdale, PennsylvaniaOhio Pittsburgh, PennsylvaniaPennsylvania Greenville, South CarolinaRhode Island Rock Hill, South CarolinaSouth Carolina

ENCLOSURE II ENCLOSURE II
SUMMARY SCHEDULE OF TITLE III AND MATCH RESOURCES
ALLOCATED TO VARIOUS ACTIVITIES AND SERVICES
(WITH PERCENTAGES) BY AREA AGENCIES ON AGING (note a)
Activity orservice I II III IV V VI VII
Program $ 80,594 $ 28,524 $ 8,671 $189,463 $ 23,517 $ 0 $planning 12% 15% 5% 12% 20% 0%
Coordination 263,824 13,777 1,62416% 12% 7% c/99,505
b/80,907 b/50,369 b/62,275 48%12% 27% 36%
Pooling 102,925 5,320 06% 4% 0%
Information 123,839 24,455 13,430 413,426 11,200 less 60 73,518and re- 19% 13% 8% 25% 9% than .01% 35%ferral
Outreach 119,817 6,386 21,083 97,811 0 less 60 018% 3% 12% 6% 0% than .01% 0%
Transporta- 79,858 20,787 28,431 389,776 55,607 0 0tion 12% 11% 16% 24% 47% 0% 0%
Escort 74,972 3,085 8,756 107,345 0 0 011% 2% 5% 7% 0% 0% 0%
Gap-filling 100,136 54,233 32,215 73,700 10,000 20,129 34,34015% 29% 18% 4% 8% 92% 17%
Total $660,123 $187,839 $174,861 $1,638,270 $119,421 $21,873 $207,363
d/100% 100% 100% 100% 100% 100% 100%
a/One area agency was not included in this schedule because it was unable tosupply complete budgetary data.
b/Figures for coordination and pooling combined. No breakouts available for areaagencies I, II, and III.
c/No breakout available for funds allocated to program planning, coordination,and pooling. One block figure reported.
d/Due to rounding error, actual total is less than 100 percent.
2

ENCLOSURE II ENCLOSURE II
SUMMARY SCHEDULE OF TITLE III AND MATCHING RESOURCES
ALLOCATED TO VARIOUS ACTIVITIES AND SERVICES
(WITH PERCENTAGES) BY AREA AGENCIES ON AGING
Activity orservice VIII IX X XI XII XIII XIV
Program $ 26,432 $ 25,259 $ 60,143 $ 78,330 $ 37,622 $ 34,680 $ 23,576planning 11% 9% 20% 12% 16% 8% 17%
Coordination 31,322 25,259 37,752 140,119 0 14,986 7,90613% 9% 12% 21% 0% 3% 6%
Pooling 6,416 12,630 37,750 117,920 0 0 7,9063% 4% 12% 18% 0% 0% 6%
Information 19,448 60,197 100,000 253,766 53,554 142,389 0and referral 8% 21% 33% 39% 23% 31% 0%
Outreach 35,246 38,517 0 31,471 19,131 59,780 2,25014% 14% 0% 5% 8% 13% 2%
Transpor- 49,981 60,746 70,222 0 15,416 90,074 77,128tation 21% 21% 23% 0% 7% 20% 56%
Escort 0 0 0 0 14,665 37,792 00% 0% 0% 0% 6% 8% 0%
Gap-filling .71,282 61,366 0 34,569 91,253 8'2,132 18,00030% 22% 0% 5% 40% 17% 13%
Total $240,127 $283,974 $305,867 $656,175 $231,641 $461,833 $136,766
100% 100% 100% 100% 100% 100% 100%
ENCLOSURE II ENCLOSURE II
SUMMARY SCHEDULE OF TITLE III AND MATCHING RESOURCES
ALLOCATED TO VARIOUS ACTIVITIES AND SERVICES
(WITH PERCENTAGES) BY AREA AGENCIES ON AGING
Activity orservice XV XVI XVII XVIII XIX XX XXI
Program $ 24,602 $165,677 $ 5,378 $ 54,103 $ 33,334 $ 41,948 $ 49,200planning 22% 14% 2% 14% 5% 4% 12%
Coordination 4,931 44,525 48,393 38,008 25,001 53,933 14,0504% 4% 18% 10% 4% 5% 3%
Pooling 0 14,105 14,397 9,772 25,001 23,969 10,0850% 1% 5% 3% 4% 2% 2%
Information 416,666 27,636 (f) 0 115,154 28,740
and referral 36% 10% - 0% 10% 7%
Outreach 0 14,565 23,908 84,444 0 00% 6% 6% 12% 0% 0%
Transpor- e/84,256 0 23,330 (g) 50,739 128,606 138,150
tation 74% 0% 9% - 7% 12% 34%
Escort 0 5,986 0 48,282 0 00% 2% 0% 7% 0% 0%
Gap-filling 520,184 124,106 251,978 418,142 728,527 170,52745% 48% 67% 61% 67% 42%
Total $113,789 $1,161,157 $263,791 $377,769 $684,943 $1,092,137 $410,752
100% 100% 100% 100% 100% 100% 100%
e/Breakouts for the allocation of resources for support services and gap-fillingservices were not available. Figure reported represents allocation for informationand referral, outreach, transportation, escort, and gap-filling services.
f/Area plan for area agency XVIII states that information and referral is an area
agency activity. Therefore, resources for this activity would appear in the ad-ministrative portion of the budget.
I/Summary Dudget for delivery of services for area agency XVIII states that allowancesfor transportation services are included with multiservice center contracts.

ENCLOSURE II ENCLOSURE II
SUMMARY SCHEDULE OF TITLE III AND MATCHING RESOURCES
ALLOCATED TO VARIOUS ACTIVITIES AND SERVICES
(WITH PERCENTAGES) BY AREA AGENCIES ON AGING
Activity orservice XXII XXIII XXIV XXV XXVI XXVII
Program $ 36,734 $ 99,084 $ 28,252 $ 28,161 $ 32,000 $planning 11% 17% 8% 24% 5%
Coordination 13,486 0 21,007 12,179 24,000 k/84,7954% 0% 6% 10% 4% 15%
Pooling 0 0 22,715 12,327 24,0000% 0% 6% 10% 4%
Information 42,093 75,547 41,369 47,845 44,892and referral 7% 21% 35% 7% 8%
h/42,10413%
Outreach i/213,769 105,765 8,365 170,667 23,35336% 30% 7% 26% 4%
Transpor- - 115,578 71,081 16,578 43,480 81,200tation - 20% 20% 14% 7% 14%
i/47,59614%
Escort 0 less 90 0 17,070 4,9880% than 1% 0% 3% 1%
Gap-filling 193,977 120,358 29,778 0 289,218 326,37058% 20% 8% 0% 44% 58%
Total $333,897 $590,882 $354,235 $118,979 $648,280 $565,598
100% 100% 100% 100% 100% 100%
h/Information and referral and outreach services combined for area agency XXII.No breakouts available.
i/Transportation and escort services combined for area acency XXII. No break-outs available.
i/Allocation for outreach services includes an allocation for home services forarea agency XXIII.
k/The allocation of resources for program planning, coordination, and pooling are
presented as a combined total for area agency XXVII. No further breakoutsavailable.
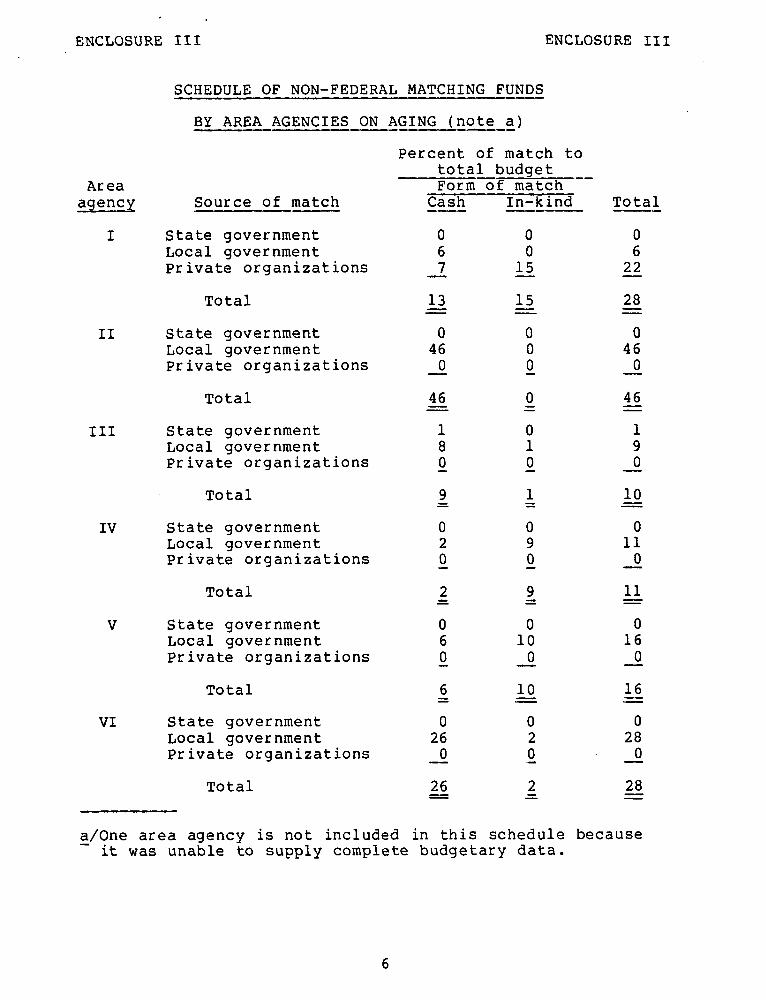
ENCLOSURE III ENCLOSURE III
SCHEDULE OF NON-FEDERAL MATCHING FUNDS
BY AREA AGENCIES ON AGING (note a)
Percent of match tototal budget
Area Form of matchagency Source of match Cash In-kind Total
I State government 0 0 0Local government 6 0 6Private organizations 7 15 22
Total 13 15 28
II State government 0 0 0Local government 46 0 46Private organizations 0 0 0
Total 46 0 46
III State government 1 0 1Local government 8 1 9Private organizations 0 0 0
Total 9 1 10
IV State government 0 0 0Local government 2 9 11Private organizations 0 0 0
Total 2 9 11
V State government 0 0 0Local government 6 10 16Private organizations 0 0 0
Total 6 10 16
VI State government 0 0 0Local government 26 2 28Private organizations 0 0 0
Total 26 2 28
a/One area agency is not included in this schedule becauseit was unable to supply complete budgetary data.
6

ENCLOSURE III ENCLOSURE III
Percent of match tototal budget
Area Form of matchagency Source of match Cash In-kind Total
VII State government 0 0 0Local government 12 4 16Private organizations 5 0 5
Total 17 4 21
VIII State government 0 3 3Local government 17 7 24Private organizations 3 1 4
Total 20 11 31
IX State government 0 0 0Local government 9 0 9Private organizations 0 16 16
Total 9 16 25
X State government 0 0 0Local government 0 7 7Private organizations 0 2 2
Total 0 9 9
XI State government 0 0 0Local government 0 15 15Private organizations 0 1 1
Total 0 16 16
XII State government 0 0 0Local government 39 15 54Private organizations 0 0 0
Total 39 15 54
XIII State government 0 0 0Local government 14 8 22Private organizations 7 11 18
Total 21 19 40
7
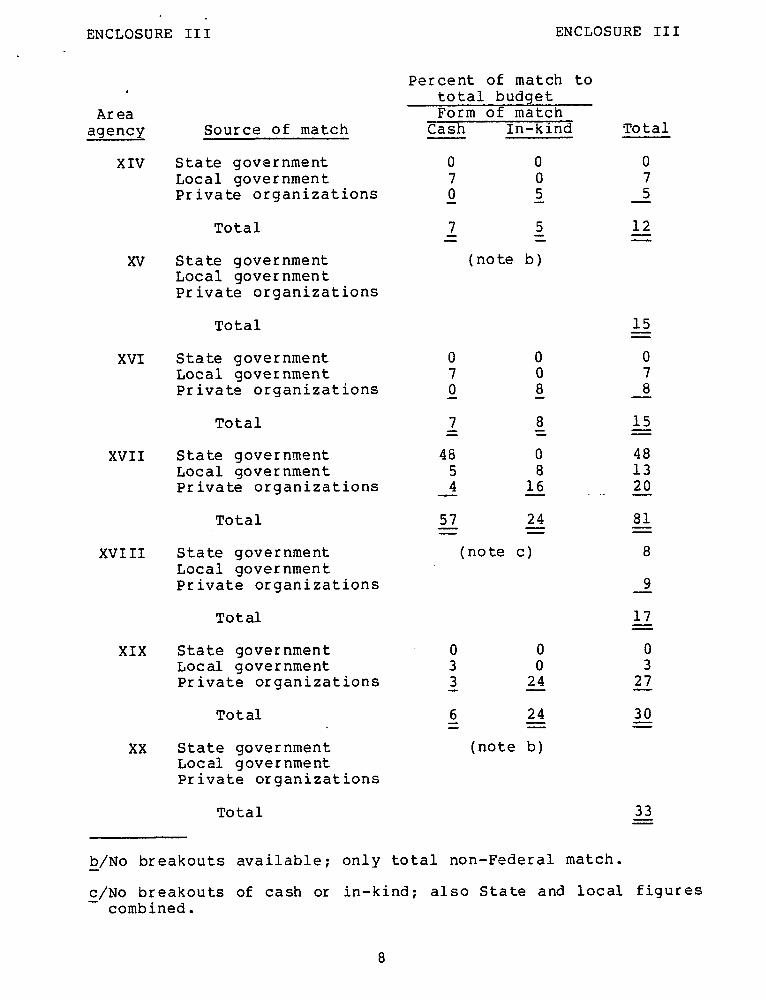
ENCLOSURE III ENCLOSURE III
Percent of match tototal budget
Area Form of matchagency Source of match Cash In-kind Total
XIV State government 0 0 0Local government 7 0 7Private organizations 0 5 5
Total 7 5 12
XV State government (note b)Local governmentPrivate organizations
Total 15
XVI State government 0 0 0Local government 7 0 7Private organizations 0 8 8
Total 7 8 15
XVII State government 48 0 48Local government 5 8 13Private organizations 4 16 20
Total 57 24 81
XVIII State government (note c) 8Local governmentPrivate organizations 9
Total 17
XIX State government 0 0 0Local government 3 0 3Private organizations 3 24 27
Total 6 24 30
XX State government (note b)Local governmentPrivate organizations
Total 33
b/No breakouts available; only total non-Federal match.
c/No breakouts of cash or in-kind; also State and local figurescombined.
8

ENCLOSURE III ENCLOSURE III
Percent of match tototal budget
Area Form of matchagency Source of match Cash In-kind Total
XXI State government 0 0 0Local government 29 10 39Private organizations less than less than
1 0 1
Total 29+ 10 39+
XXII State government 0 0 0Local government 0 13 13Private organizations 0 15 15
Total 0 28 28
XXIII State government 0 0 0Local government 1 3 4Private organizations 0 10 10
Total 1 13 14
XXIV State government 0 0 0Local government 3 0 3Private organizations (note d) 17
Total 20
XXV State government less than less than1 0 1
Local government 13 1 14Private organizations (note d) 2
Total 16+
XXVI State government 3 0 3Local government less than
17 1 17+Private organizations 19 6 25
Total 39 6+ 45+
d/Only total available.
9
ENCLOSURE III ENCLOSURE III
Percent of match tototal budget
Area Form of matchagency Source of match Cash In-kind Total
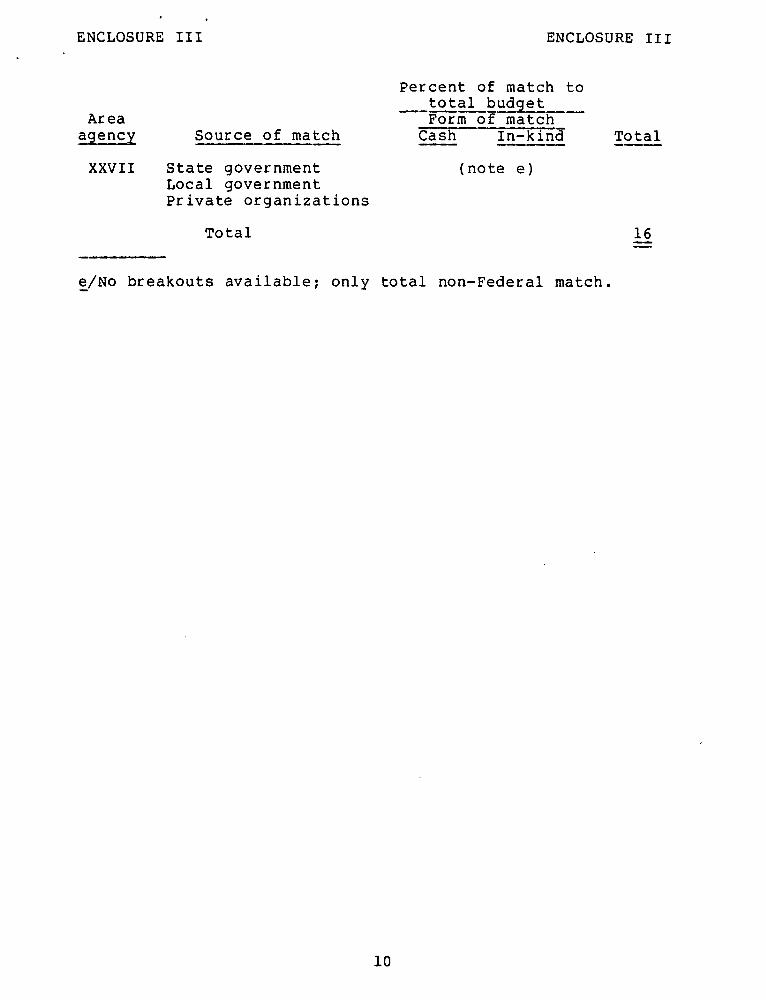
XXVII State government (note e)Local governmentPrivate organizations
Total 16
e/No breakouts available; only total non-Federal match.
10
ENCLOSURE IV ENCLOSURE IV
SUMMARY OF FUNCTIONS PERFORMED
AND PERCENTAGE OF TIME EXPENDED
PERFORMING EACH FUNCTION
Number ofarea
agencies Number ofperforming area Percentage of time expended
Under agencies by area agencies NoDi- contract/ not 0 answer
rectly grant performing (note a) 1-10 11-20 21-30 31-40 (note b)
Leadershipand advo-cacy 26 2 - 2 11 9 5 -1
Determineneeds 24 4 - 4 18 5 1 - 1
Inventoryresources 24 3 1 4 19 4 - - 1
Establishobjectives 27 1 - 1 26 - - -1
Planning 27 1 - 1 21 5 - - 1Coordinating 26 1 1 1 14 8 1 3 1Pooling 26 1 1 1 18 8 - - 1Evaluation 23 1 4 5 18 4 - - 1Public hear-
ings 21 - 7 7 20 - - - 1Informationon needs 26 1 1 2 25 - - - 1
Technicalassistance 26 1 1 2 15 8 2 - 1
Provision oflegal serv-ices 8 3 17 20 7 - - - 1
Use in childcare 5 2 21 22 5 - - - 1
Advisorycouncil 27 - 1 1 23 3 - - 1
Solicit viewsof olderpersons 26 1 1 2 24 1 - - 1
a/No time is expended if the area agency performs the function under contract ordoes not perform the function at all.
b/One area agency declined to indicate the percentage of time expended on eachfunction.
11
ENCLOSURE V ENCLOSURE V
INDICATORS OF EXISTING COORDINATION
BETWEEN TITLE III AND VII PROGRAMS
The area agencies were asked:
(1) Do the title VII projects and the area agenciesuse the same?
Number of area agenciesresponding "YES"
Outreach 16Paid personnel 11Volunteers 16Facilities 19
(2) Does the area agency provide any of the follow-ing supporting social services for the titleVII projects?
Number of area agenciesSupportive social services responding "YES"
Information and referral 20Health and welfare counseling 16Nutrition education 8Shopping assistance 14Recreation activities 16Transportation 20
12
ENCLOSURE VI ENCLOSURE VI
ACCOMPLISHMENTS OF AREA AGENCY ADVISORY COUNCILS
Number of area agenciesciting each accomplishment
Participation in the developmentof area plan 15
Advocacy with State and localgovernment 8
Performing needs study 5
Conducting hearings 3
Approving and/or monitoring ofsubcontracts 3
Participating in the allocationof funds 3
Increasing pooling capability ofarea agency 1
Reviewing and commenting on non-title III projects 1
None-often advisory council is toonew to have made contribution 7
13
ENCLOSURE VII ENCLOSURE VII
SUMMARY OF STATE AGENCY PROFESSIONAL EMPLOYEES (note a)
Total number of State employees byposition and educational background
To6tanumber Less than Educational
in each Doctorate Masters Bachelors college data notposition degree degree degree degree obtained
Director (note b) 12 - 6 3 1 2Assistant director/
other administra-tors 19 1 8 9 1 -
Planner/coordinator 37 1 20 10 1 5Fiscal/grantsmanager 27 - - 13 14 -
Other managementspecialist 13 - 2 2 7 2
Research analyst(note c) 5 - 2 3 - -
Information andreferral/publicinformationspecialist 20 1 8 9 1 1
Nutrition projectspecialist 22 - 14 6 - 2
Training and em-ployment spe-cialist 18 1 11 6 - -
Field representa-tives 76 1 40 30 3 2
Program development/community serv-ices 10 7 3 - -
Other technicalspecialist 15 - 1 10 2 2
Not determined d/103 5 43 37 18 _
Total 377 10 162 141 48 16
a/In addition to the positions listed, some State agencies have employees in-volved with programs not directly funded by titles III and VII and do notinclude such employees in their State plan.
b/The director's position at one State agency was vacant at the time of ourinterview. We were unable to determine the exact functions of the employeesof two other States.
c/In several cases the planner/coordinator also has responsibility for the re-search and evaluation functions.
d/Total number of professional employees of two State agencies. We were unableto determine the exact functions of these employees from the information sup-plied by these two States.
14

ENCLOSURE VIII ENCLOSURE VIII
SUMMARY OF AREA AGENCY PROFESSIONAL EMPLOYEES
PAID WITH TITLE III FUNDS
Total number of persons by posi-tion and educational background
Total number Lessof people in thaneach position Doctorate Masters Bachelors college
(note a) degree degree degree degree
Directors b/26 1 14 8 3Assistant
directors 2.5 1 .5 1Planner/co-ordinator 47.35 25.35 17 5
Fiscal/generalmanager 16 5 4.5 6.5
Researchanalyst 6 3 3
Informationand referral 3 1 2
Nutrition proj-ect director 1 1
Caseworker andcaseworker aide 2.5 2.5
Program developer 2 1 1Personal carescreening co-ordinator 1 1
Specialist inaging 5 3 1 1
Total 112.35 1 53.35 41.5 16.5
a/Decimal numbers are used here because some of the individualsare not full-time employees of the area agencies, and, there-fore devote part of their workweek to other activities.
b/One area agency indicated it had no staff. The director ofanother was not included in this list because she was not paidwith title III funds.
15

ENCLOSURE IX ENCLOSURE IX
SUMMARY OF THE MAJOR RECOMMENDATIONS BY
REGIONAL, STATE, AND AREA AGENCY OFFICIALS
FOR CHANGING THE OLDER AMERICANS ACT
1. There should be a requirement for coordination between titlesIII and VII by the area agencies.
2. The authorized funding for administration of title III pro-grams should be increased.
3. The authorized funding for all of title III should be in-creased.
4. More emphasis should be placed on serving rural elderly.
5. Program priorities should be established at the local leveland not by the Administration on Aging and the States.
6. The area agencies should be responsible for administeringprograms such as the nutrition, Foster Grandparents, andRetired Senior Volunteer programs.
7. Program planning should be required for periods of 3 years.
8. A separate authorization should be made for administrationof title VII.
9. Specific funding allocation should be made for the Adminis-tration on Aging programs serving elderly Indians livingon reservations.
10. In rural areas the State Agency on Aging should be authorizedto perform the functions of an area agency.
11. The Administration on Aging should be authorized to directlyfund large urban area agencies.
12. The 25-percent matching requirement for area agency adminis-trative funding should be decreased.
16