the market for reverse mortgages among older americans
TRANSCRIPT

University of Pennsylvania University of Pennsylvania
ScholarlyCommons ScholarlyCommons
Wharton Pension Research Council Working Papers Wharton Pension Research Council
9-15-2020
The Market for Reverse Mortgages among Older Americans The Market for Reverse Mortgages among Older Americans
Christopher Mayer
Stephanie Moulton
Follow this and additional works at: https://repository.upenn.edu/prc_papers
Part of the Economics Commons
Mayer, Christopher and Moulton, Stephanie, "The Market for Reverse Mortgages among Older Americans" (2020). Wharton Pension Research Council Working Papers. 693. https://repository.upenn.edu/prc_papers/693
The published version of this working paper may be found in the 2022 publication: New Models for Managing Longevity Risk: Public-Private Partnerships.
This paper is posted at ScholarlyCommons. https://repository.upenn.edu/prc_papers/693 For more information, please contact [email protected].
The Market for Reverse Mortgages among Older Americans The Market for Reverse Mortgages among Older Americans
Abstract Abstract This paper examines the usage of reverse mortgages among mortgage borrowers, as well as rejected applicants for new mortgage credit who are age 62+. We find that 17-27 percent of actual and rejected borrowers would have qualified for a HECM reverse mortgage, or nine to 14 times the size of the actual HECM market. The existence of a large number of seniors with an existing mortgage or taking out a new mortgage with quite high LTVs (57-65%, depending on the product) suggests that many seniors do, in fact utilize home equity in order to fund their retirement. Yet they choose products that require monthly payments lasting decades into retirement and rising as a share of (declining) income as they age. We consider a number of possible explanations for why seniors in the US do not spend home equity and rely on loans with high payments, including precautionary savings for health shocks, bequest motives, high costs of reverse mortgages, and the lack of brand name institutions in the reverse mortgage business.
Keywords Keywords Reverse mortgage, home equity, borrowers, older adults, retirement
Disciplines Disciplines Economics
Comments Comments The published version of this working paper may be found in the 2022 publication: New Models for Managing Longevity Risk: Public-Private Partnerships.
This working paper is available at ScholarlyCommons: https://repository.upenn.edu/prc_papers/693

New Modelsfor ManagingLongevity RiskPublic-Private Partnerships
Edited by
Olivia S. Mitchell
3

3Great Clarendon Street, Oxford, OX2 6DP,United Kingdom
Oxford University Press is a department of the University of Oxford.It furthers the University’s objective of excellence in research, scholarship,and education by publishing worldwide. Oxford is a registered trade mark ofOxford University Press in the UK and in certain other countries
© Pension Research Council, The Wharton School, The University of Pennsylvania 2022
The moral rights of the authors have been asserted
Impression: 1
Some rights reserved. No part of this publication may be reproduced, stored ina retrieval system, or transmitted, in any form or by any means, for commercial purposes,without the prior permission in writing of Oxford University Press, or as expresslypermitted by law, by licence or under terms agreed with the appropriatereprographics rights organization.
This is an open access publication, available online and distributed under the terms of aCreative Commons Attribution – Non Commercial – No Derivatives 4.0International licence (CC BY-NC-ND 4.0), a copy of which is available athttp://creativecommons.org/licenses/by-nc-nd/4.0/.
Enquiries concerning reproduction outside the scope of this licenceshould be sent to the Rights Department, Oxford University Press, at the address above
Published in the United States of America by Oxford University Press198 Madison Avenue, New York, NY 10016, United States of America
British Library Cataloguing in Publication DataData available
Library of Congress Control Number: 2021944221
ISBN 978–0–19–285980–8
DOI: 10.1093/oso/9780192859808.001.0001
Printed and bound in Great Britain by Clays Ltd, Elcograf S.p.A.
Links to third party websites are provided by Oxford in good faith andfor information only. Oxford disclaims any responsibility for the materialscontained in any third party website referenced in this work.
Contents
List of Figures ixList of Tables xiiNotes on Contributors xiv
1. Introduction: New Models for Managing Longevity Risk:Public-Private Partnerships 1Olivia S. Mitchell
Part I. Understanding Longevity Risk
2. Perceptions of Mortality: Individual Assessment ofLongevity Risk 11Kathleen McGarry
3. Disability-free Life Trends at Older Ages: Implicationsfor Longevity Risk Management 34Douglas A. Wolf
4. Does Working Longer Enhance Old Age? 57Maria D. Fitzpatrick
5. Working Longer Solves (Almost) Everything: TheCorrelation Between Employment, Social Engagement,and Longevity 70Tim Driver and Amanda Henshon
Part II. Public-Private Partnerships to HelpFill the Gaps
6. Aging in Place: The Role of Public-Private Partnerships 91Nancy A. Hodgson
7. Public-Private Partnerships Extend Community-basedOrganization’s Longevity 105Dozene Guishard and William J. Dionne
viii Contents
8. Innovative Strategies to Finance and Deliver Long-termCare 122Nora Super, Arielle Burstein, Jason Davis, and Caroline Servat
9. Building on Hope or Tackling Fear? Policy Responsesto the Growing Costs of Alzheimer’s Disease and OtherDementias 150Adelina Comas-Herrera
Part III. Implications for the FinancialSector and Policymakers
10. State-sponsored Pensions for Private-Sector Workers:The Case for Pooled Annuities and Tontines 171Richard K. Fullmer and Jonathan Barry Forman
11. New Financial Instruments for Managing Longevity Risk 207John Kiff
12. Property Tax Deferral: Can a Public-Private PartnershipHelp Provide Lifetime Income? 231Alicia H. Munnell, Wenliang Hou, and Abigail N. Walters
13. The Market for Reverse Mortgages among OlderAmericans 258Christopher Mayer and Stephanie Moulton
The Pension Research Council 301Index 305
Chapter 13
The Market for Reverse Mortgages amongOlder Americans
Christopher Mayer and Stephanie Moulton
Reverse mortgages have long been viewed with skepticism by some retirees,financial planners, and financial institutions. Potential concerns are many,including high costs, dicey sales practices, and the potential for retireesto lose their home if things go badly. Interestingly, the same concernsabout reverse mortgages or similar products (‘equity release’ options) seemto persist in many countries with very different institutions and financialsystems.
Yet the need to access additional retirement assets like home equityhas never been stronger. Academics and researchers lament the lack ofadequate retirement savings and growing debt among older Americans.Media headlines such as ‘Over 60 with Decades Left on the Mortgage: TheNew Retirement Math’ in the Wall Street Journal (Rexrode 2020) are com-mon. Recent studies by the Urban Institute, the Federal Reserve Bank ofNew York, and a number of academics point to the increase in the numberof American householders entering retirement age with a mortgage andgrowing average mortgage balances, both in real dollars and as a share ofhome equity.1 For example, the proportion of older adults entering retire-ment with mortgage debt has more than doubled from 20 percent in 1992,tomore than 40 percent in 2016.2 This is occurring even as ever fewer house-holds have a traditional pension and retirees have shrinking 401(k) andother retirement savings. The economic and financial shrinkage associatedwith COVID-19 will only make this problem worse.
Yet the growth in housing debt in the US can also be seen in a differ-ent light—as evidence that older householders are effectively consuminghome equity in retirement. Many older householders use traditional mort-gage instruments like a Home Equity Line of Credit (HELOC), second lien,or cash-out refinancing to draw downhome equity during retirement years.3
Similarly, by leaving existing debt in place for longer, retirees are missingout on the increase in home equity that used to take place in previousgenerations, effectively further reducing savings.
Christopher Mayer and Stephanie Moulton, The Market for Reverse Mortgages among Older Americans.In: New Models for Managing Longevity Risk. Edited by Olivia S. Mitchell, Oxford University Press.© Pension Research Council (2022). DOI: 10.1093/oso/9780192859808.003.0013
The Market for Reverse Mortgages among Older Americans 259
Of course, the problem with using traditional mortgage debt to fundretirement is that such debt must be paid back just as many householdersare retiring and facing sharp drops in their income. Research by Engle-hardt and Eriksen (2019) shows that elderly homeowners with a mortgageface housing expense burdens that mirror those of renters, with a grow-ing share of retirees spending 30 to 50 percent or more of their incomeon housing expenses. One in four older adults engages in expensive creditcard behaviors, including paying only the minimum balance, paying overthe limit fees, and using credit cards for cash advance (Lusardi et al. 2020).Rates of personal bankruptcy are increasing more quickly for older adultsthan any other age group in the US (Fisher 2019; Li and White 2020).It is perhaps not surprising that a higher level of debt—particularly non-housing consumer debt—is associated with increased stress among olderadults (Haurin et al. 2019). While many workers report an offsetting desireto retire later, data shows that few elderly people retire as late as they hadplanned to at younger ages.4
For most retirees, home equity is the largest single asset they bring intoretirement, even after subtracting mortgage debt. Nearly 80 percent ofadults age 65+ own their homes, and most do still own those free and clear.Using data from the 2016 Survey of Consumer Finances, Moulton and Hau-rin (2019) estimated that the median homeowner age 62 and older heldmore wealth in the form of home equity than in financial assets: $139,000in home equity, compared to $101,800 in financial assets.
Finding a way to responsibly use home equity would seem to be a priority.Yet it has also been an elusive goal. One exception is in theUnited Kingdom,where equity release options have been growing rapidly in recent years. Byone estimate, about one-in-three mortgages taken out by borrowers overage 55 is an equity release product. Relative to the population of retirees,the effective market in the UK is nearly five times the size of that in the US.Similarly, Canada has seen a sharp rise in the use of reverse mortgages. Onereason for the growth in equity release products in the UK is that mortgageoriginators are asked to ensure older borrowers are able to afford mortgagepayments using retirement income, not just current income at the time ofthe mortgage. This has pushed mortgage originators to raise the option ofequity release products with older borrowers, and it is likely an importantfactor behind their increasing use. Furthermore, UK financial planners donot face some of the regulatory restrictions in place in the US and oftendiscuss equity release and other options to use home equity. Also, unlike inthe US, they can also earn a commission from the sale of such products.
In this chapter we explore the US reverse mortgage market and the rea-sons behind its apparent failure to help fund retirement.We do so while alsoexploring how older borrowers use home equity and various types of mort-gages to finance their retirement. To do this, we access data from the 2018
260 New Models for Managing Longevity Risk
Home Mortgage Disclosure Act (HMDA), which, for the first time, includessignificantly expanded data such as the type of mortgage available, age ofborrowers, interest rate and costs for each loan, and the lender. Lendersmust also provide information on rejected applicants. We can separatelyidentify reverse mortgages and compare them to other types of cash-outborrowing. We also explore other types of mortgages taken out by seniors,including traditional refinancing and purchase mortgages.
The results show that Americans age 62+ access a wide variety of sourcesto borrow against their principal residence. In 2018, only 33,000 originatedreverse mortgages were reported in HMDA, versus 609,000 originated equi-ty extraction loans such as HELOCs, cash-out refinancing, first liens notfor refinance or purchase, and second liens, all of which require traditionalmortgage payments, typically for 15 to 30 years. An additional 688,000 olderAmericans originated amortgage for home purchase or a refinancing,manyof which will require payments beyond age 90. Our analysis focuses on theHome Equity Conversion Mortgage (HECM) program, a US government-insured reverse mortgage that represents 94 percent of all reported reversemortgage originations.
After documenting the extent to which home equity borrowing is impor-tant for many retirees, we examine the barriers to accessing home equityfor older adults and find that denial due to excessive debt payments is abigger problem for the elderly than for younger potential borrowers. Ourdata show that more than 50 percent of older adults denied HELOC or sec-ond liens in 2018 were denied because they could not afford the monthlymortgage payment, compared to 41 percent who were denied for cred-it reasons. An estimated 70 percent of older adults denied HELOC andsecond liens had debt to income (DTI) ratios in excess of 41 percent. Bycontrast, for homeowners under the age of 46, only 35 percent were denieda HELOC or second lien due to affordability (nearly half being denied dueto a poor credit history). At an age where retirement (and thus a loss ofincome) is increasingly likely, the large amount of existing debt appears tobe a problem for a large number of older homeowners.
Given that high debt payments are a barrier to affordability for theelderly, we consider reasons that no-payment loans like a reverse mortgagerepresent such as small share of total borrowing. For example, simula-tions show that between 26 and 36 percent of rejected HELOC and secondlien applicants likely could have accessed a reverse mortgage (n = 54,000to 74,000). Similarly, between 28 and 40 percent of approved HELOCand second lien borrowers could have used a reverse mortgage (n = 77,000to 108,000). Maybe not surprising, given the large amount of borrowingamong many older applicants, the principal reason that reverse mortgagescouldn’t help more HELOC and second lien applicants is that they wouldnot qualify for a reverse mortgage because they need to borrow too much

The Market for Reverse Mortgages among Older Americans 261
money. Initial loan to value ratios (LTVs) for reverse mortgages are muchlower than for traditional mortgages because of the negative amortizationof the balance when a borrower is not making mortgage payments.
Next, we explore various reasons why reverse mortgages may not be usedmore frequently. Our analysis considers four potential reasons that old-er borrowers already considering home equity borrowing do not choosea reverse mortgage, including product reputation, higher costs, bequestmotives, and regulatory barriers. We also discuss other motives for not usinghome equity among those who don’t explore a new mortgage, includingprecautionary savings and the more general puzzle of why many retireesfail to spend down other assets in retirement (Poterba et al. 2011, for exam-ple). We conclude that while high product costs may be a barrier for somepotential borrowers, the poor product reputation and regulatory barriersalso play an important role, particularly in discouraging the participationof mainstream financial institutions which might be able to bring distribu-tion efficiencies, lower costs, and retirement advice that incorporates homeequity into financial plans.
The Market for Reverse Mortgages andEquity Release ProductsEquity release options in the US and abroadA reverse mortgage is a loan that allows an older borrower to borrow againstthe value of the home without required payments. In most countries includ-ing the US, a borrower can take some up-front cash and the balance of theloan either as a line of credit (LOC or ‘drawdown’) or with fixed month-ly payments (tenure payments). A recent survey of selected global equityrelease originators by Ernst & Young Global Limited (EY 2020) summarizesproducts available across the world. According to the survey, most borrow-ers take a combination of a fixed up-front payment plus a LOC when theLOC is available. The LOC allows borrowers to access additional funds asthey desire, similar to a HELOC. In the US, borrowers can make optionalpayments and can deduct the portion of the payment that is applied to theinterest in the same way as a traditional (forward) mortgage. Since the loanbalance is expected to grow over time as interest accrues, the originationLTV ratio of a reversemortgage is typically much lower than for a traditionalmortgage, and the product is restricted to older borrowers who have a short-er expected time in the property. Common minimum age ranges between55 (UK and Canada) and 62 (most often in the US) or 65 (Germany). Theamount of proceeds available typically rises for older borrowers.
A reverse mortgage is not the only product that allows borrowers to usehome equity in retirement. It fits inside a larger category of ‘equity release’

262 New Models for Managing Longevity Risk
products. In some countries, particularly Italy, Germany, and France, thereis an activemarket in home reversions (or viagers), in which the owner ‘sells’some or all of the future sale proceeds of the home in return for an up-frontlump sum or annuity payment and the right to live in the home as long ashe or she lives.
Equity release products have a number of insurance features that shouldbe appealing for retirees and allow them to hedge risks that might otherwisematerially impact their financial position in retirement. This is because thelender/purchaser is giving up-front cash in return for an uncertain futurepayoff from the sale of the home. In the vast majority of countries (excep-tions include Spain and Germany), the borrower or his or her estate is neverliable for more than the home is worth. Thus, if the borrower lives longerthan expected or home prices fall, the lender/purchaser bears the risk thatthe present value of eventual proceeds will be below the amount of mon-ey advanced to the borrower at the underwritten cost of capital. Few otherproducts exist that allow a homeowner to otherwise hedge home price andlongevity risk.
Who can benefit from home equity release?The most obvious candidates for using home equity in retirement are thosefor whom few other options exist. For example, Cocco and Lopes (2019)have simulations that suggest that reverse mortgage demand should be thehighest among those with low levels of nonhousing wealth relative to homeequity, who have a weak bequest motive, and who have high levels of otherpre-existing debt. The importance of pre-existing debt is consistent withprior empirical research finding that a large proportion of reversemortgageborrowers use reverse mortgages to pay off debt.
Some studies look to calculate the share of borrowers with a relativelylarge amount of home equity relative to total assets or income, finding anappreciable minority of seniors have little income or financial assets anda comparably large amount of home equity. For example, Goodman et al.(2017) estimated that as many as 2.5 million to 4.5 million senior house-holds (10% to 17% of the 26 million senior homeowners) could benefitfrom a vehicle to tap into home equity, including a reverse mortgage. Mayer(2017) showed that almost one-quarter of senior households have at least$50,000 in home equity and less than $50,000 in financial assets in 2012.Moulton andHaurin (2019) estimated that nearly one in five of older home-owners held less than $10,000 in financial assets, but had at least $40,000 inhome equity. As we show below, originations of reverse mortgages representa relatively small share of such potential demand.
An alternative approach to access home equity is through home sale,however most older adults express strong attachment to their homes.
The Market for Reverse Mortgages among Older Americans 263
In a 2018 survey, 76 percent of respondents age 50+ indicated a desireto remain in their current home as long as possible (Binette and Vasold2018). These preferences are consistent with data: for example, from 2012to 2014, only 1.8 percent of homeowners age 65+ extracted equity by sellingtheir homes (Goodman et al. 2017). Of older adults who sold their homesbetween 1998 and 2014, only about one in four purchased a home of less-er value, allowing for liquidation of home equity (Begley and Chan 2019).Those who did sell their homes tended to have higher incomes and morenonhousing financial wealth (Englehardt and Eriksen 2019).
An important reason that homeowners do not sell their homes is thattheir retirement consumption is tied to the home’s value, and owning ahome provides a hedge against outliving their assets. That is, the home is notsimply a financial asset that can be tapped at will, it is also an asset that paysa ‘dividend’ in the form of imputed rent. Thus, selling the home creates achallenge: how to invest the proceeds from a sale to ensure sufficient returnsto pay rent over the remaining lifetime. Seniors who rent bear the risk ofrunning out of money if they live a long time or financial returns are notwhat they expect. This might explain why homeownership rates across mostdeveloped countries peak at age 65–74 (around 75% to 90%), regardless ofthe mortgage finance or pension systems (Goodman and Mayer 2018).
Accordingly, there appears to be an appreciable number of older bor-rowers who fit into categories that might benefit from taking an equityrelease product like a reverse mortgage. Some are the traditional ‘houserich, cash poor’ households or those who want to eliminate mortgage pay-ments. Others might want to access liquidity from home equity rather thanselling financial assets, effectively ending up with a portfolio that becomesincreasingly concentrated in home equity with age.
Market size and growth of equity release in the US,the UK, and CanadaIn the aggregate, the total value of home equity for seniors is quite large.In the US, home equity seniors age 62 had a total of $7.54 trillion in Q12020 (NRMLA 2020). Home equity for seniors in large European countriesexceeded €8 trillion in 2013 according to Haurin and Moulton (2017). Bycomparison, the aggregate value of equity release products is much smaller.
While aggregate data on equity release products in many countries is dif-ficult to obtain, we can summarize the reverse mortgage market in the USand compare it to two growing markets including those of Canada and theUK.5 The number of reverse mortgages in the US is small and sensitive tomarket and policy dynamics affecting who can borrow and the proceedsavailable. In the UK and Canada, equity release markets are much larger asa share of the elderly population.
264 New Models for Managing Longevity Risk
140,000
120,000
100,000
80,000
60,000
40,000
20,000
0
Endo
rsem
ent V
olum
e
1998
1999
2000
2001
2002
2003
2004
2005
2006
2007
2008
2009
2010
2011
2012
2013
2014
2015
2016
2017
2018
2019
Endorsements Principal Limit Factor
0.750.700.650.600.550.500.450.400.350.30
Prin
cipa
l Lim
it Fa
ctor
0.80
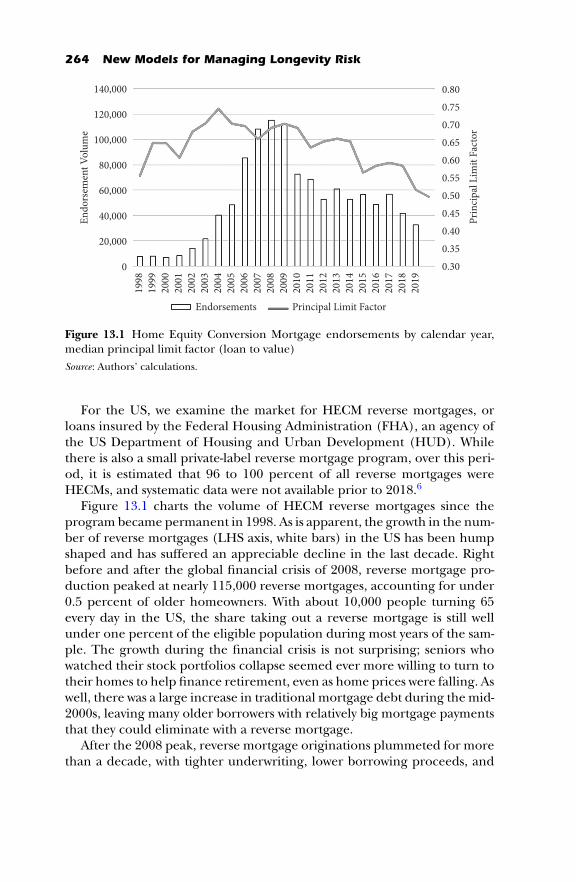
Figure 13.1 Home Equity Conversion Mortgage endorsements by calendar year,median principal limit factor (loan to value)Source: Authors’ calculations.
For the US, we examine the market for HECM reverse mortgages, orloans insured by the Federal Housing Administration (FHA), an agency ofthe US Department of Housing and Urban Development (HUD). Whilethere is also a small private-label reverse mortgage program, over this peri-od, it is estimated that 96 to 100 percent of all reverse mortgages wereHECMs, and systematic data were not available prior to 2018.6
Figure 13.1 charts the volume of HECM reverse mortgages since theprogram became permanent in 1998. As is apparent, the growth in the num-ber of reverse mortgages (LHS axis, white bars) in the US has been humpshaped and has suffered an appreciable decline in the last decade. Rightbefore and after the global financial crisis of 2008, reverse mortgage pro-duction peaked at nearly 115,000 reverse mortgages, accounting for under0.5 percent of older homeowners. With about 10,000 people turning 65every day in the US, the share taking out a reverse mortgage is still wellunder one percent of the eligible population during most years of the sam-ple. The growth during the financial crisis is not surprising; seniors whowatched their stock portfolios collapse seemed ever more willing to turn totheir homes to help finance retirement, even as home prices were falling. Aswell, there was a large increase in traditional mortgage debt during the mid-2000s, leaving many older borrowers with relatively big mortgage paymentsthat they could eliminate with a reverse mortgage.
After the 2008 peak, reverse mortgage originations plummeted for morethan a decade, with tighter underwriting, lower borrowing proceeds, and
The Market for Reverse Mortgages among Older Americans 265
the exit of many brand name originators. Until 2014, the FHA did notrequire financial underwriting for borrowers. While there are no requiredmortgage payments for a reverse mortgage, borrowers must still pay prop-erty taxes and insurance (T&I) to be in compliance, and an appreciablenumber of borrowers from 2009 to 2012 took out full draws and were leftwith no money to cover these costs. This led to a sharp increase in defaultsand FHA-required foreclosures on borrowers unable to make homeown-er’s property T&I payments, with attendant poor publicity. With these andother challenges, larger financial institutions such as Wells Fargo, Bank ofAmerica, and MetLife exited the reverse mortgage business.
The increase in defaults and foreclosures and sharp decline in homevalues led the FHA to reassess its underwriting and curtail available pro-ceeds for borrowers as a share of home value. The maximum amount ofproceeds for an HECM is called the ‘principal limit’ (PL) or the share ofhome value that can be used as a borrowing base. To protect itself, the FHAlowered the principal limit factor (PLF)—the proportion of home equitythat can be borrowed; similar to an LTV—substantially between 2012 and2017.While the average home value forHECMborrowers (calledmaximumclaim amount, or MCA) grew 30 percent between 2009 and 2019, the PLdid not grow at all.7 In addition, in 2015, the FHA limited the amount ofmoney that a borrower could get to 60 percent of the PLF, unless the bor-rower had a mortgage or other required property or federal tax liens withan amount above the 60 percent limit, in which case the borrower couldcover these ‘mandatory obligations’ plus an additional 10 percent (cappedat 100% of the PL). The effective reduction in proceeds available to bor-rowers, combined with the exit of brand name financial institutions, led toa sharp decline in the number of HECM mortgages originated.
By comparison, originations of equity release products in Canada and theUK followed a very different pattern, more than doubling since 2013. In theUK, equity release offerings increased from £1 billion in 2013 to £3billionin 2017, with a further 32 percent growth to more than £4 billion by 2019.8
Furthermore, equity releasemortgages represent an estimated 36 percent ofall mortgages for borrowers over age 55 in 2018, doubling their share fromthe previous decade. A total of 46,000 equity release plans were originatedin 2018 versus fewer than 42,000 in the US, despite the US having almostfive times the number of retirees. While total volume in 2019 was flat with2,018, the membership in the Equity Release Council almost doubled and,prior to COVID-19, the industry expected continued growth in 2020.
In Canada, HomeEquity Bank, the sole seller of reverse mortgages untilrecently, reported a record CA$820 million up from CA$309 million fiveyears earlier. As in the UK, mortgages are available for borrowers age 55and above, although the bulk of originations are for those over age 65. Inboth the UK and Canada, lenders advertise widely in the media. In the UK,

266 New Models for Managing Longevity Risk
equity release products are offered by some of the largest life insurancecompanies.
Home Equity and the Market for ReverseMortgagesReverse mortgage originations in the USThe current number of outstanding reverse mortgages in the US is small,estimated to be below two percent of older homeowners.9 In general, it isdifficult tomeasure the home equitymarket for older adults. Surveys such asthe Health and Retirement Study (HRS) lack details about mortgage typesand terms, and they rely on self-reported data on loan balances. These dataare good for tracking trends in the stock of mortgage debt held by olderhomeowners, but they are less useful for examining new originations and,in particular, the share of reverse mortgages versus other mortgage prod-ucts. Researchers also use consumer credit panel datasets to track trends inhome equity borrowing among older adults over time (Moulton et al. 2019;Brown et. al. 2020). However, credit data do not include borrower-specificinformation on home values and do not include important informationabout loan terms and costs. Further, reverse mortgages are not reportedin credit data because they do not require borrowers to make payments.
Below, we examine data on the vast majority of new mortgages origi-nated in the US using the 2018 HMDA Loan Application Register (LAR).Under HMDA, lenders are required to collect and report specific informa-tion about mortgage applications acted upon and loans purchased duringthe prior calendar year. Beginning in 2018, new reporting requirementscame into effect that required most lenders to report on mortgages struc-tured as open-ended lines of credit, such as HELOCs and reverse mortgagesthat were previously only voluntarily reported (CFPB 2019).10 Importantly,the 2018 HMDA data include new information on both federally insuredHECMs and proprietary reverse mortgages, as well as the age of borrowers,so we can compare various types of borrowing used by seniors.
The 2018 HMDA data allows us to compare the characteristics of appli-cants and borrowers of reverse mortgages to the characteristics of mortgageapplicants and borrowers for other types of loans. The goal is twofold: first,to understand the characteristics of reverse mortgage borrowers; and sec-ond, to compare reverse mortgage borrowers to applicants for all othermortgage debt taken out by potential borrowers age 62 and older whomightotherwise have been eligible for a reverse mortgage.11
Data descriptionWe begin by restricting the HMDA database to those observations wherethe applicant or co-applicant is age 62+, as we wish to focus on older
The Market for Reverse Mortgages among Older Americans 267
adults who would otherwise be eligible for a reverse mortgage. To avoiddouble counting, we exclude loans that were simply purchased by anoth-er institution during the reporting period. We further restrict the sampleto loans for single family, owner-occupied properties, excluding invest-ment properties and second homes. These restrictions result in a sample of2,510,080 loan applications, of which 1,329,505 resulted in loan originationsduring the 2018 period.
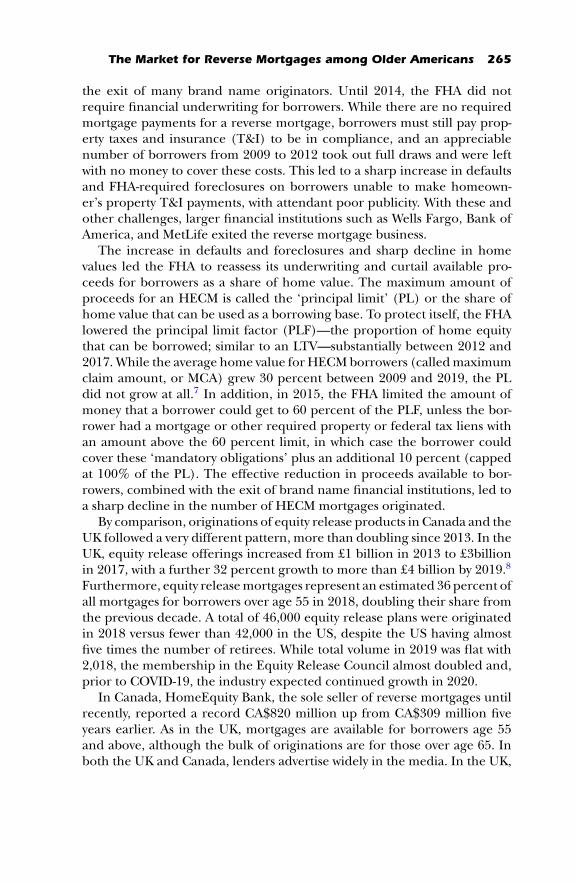
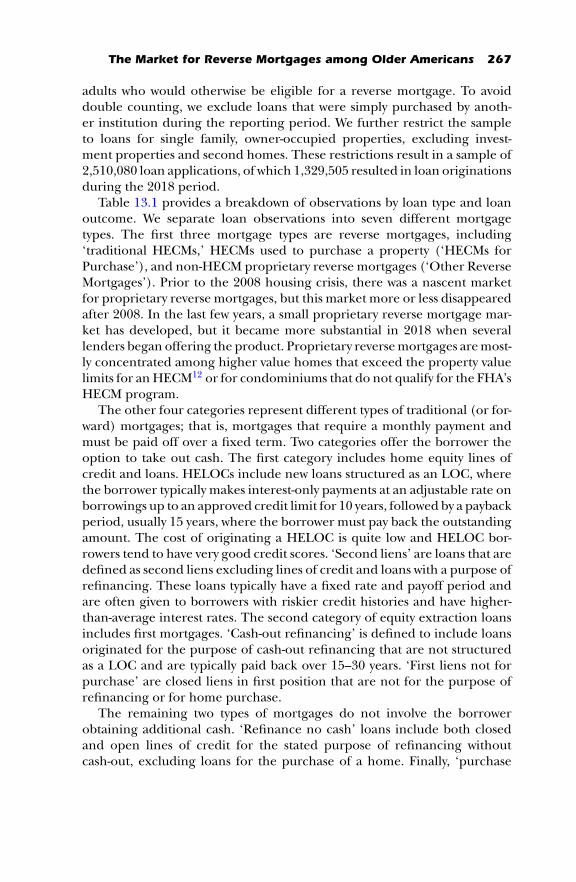
Table 13.1 provides a breakdown of observations by loan type and loanoutcome. We separate loan observations into seven different mortgagetypes. The first three mortgage types are reverse mortgages, including‘traditional HECMs,’ HECMs used to purchase a property (‘HECMs forPurchase’), and non-HECM proprietary reverse mortgages (‘Other ReverseMortgages’). Prior to the 2008 housing crisis, there was a nascent marketfor proprietary reverse mortgages, but this market more or less disappearedafter 2008. In the last few years, a small proprietary reverse mortgage mar-ket has developed, but it became more substantial in 2018 when severallenders began offering the product. Proprietary reversemortgages aremost-ly concentrated among higher value homes that exceed the property valuelimits for anHECM12 or for condominiums that do not qualify for the FHA’sHECM program.
The other four categories represent different types of traditional (or for-ward) mortgages; that is, mortgages that require a monthly payment andmust be paid off over a fixed term. Two categories offer the borrower theoption to take out cash. The first category includes home equity lines ofcredit and loans. HELOCs include new loans structured as an LOC, wherethe borrower typically makes interest-only payments at an adjustable rate onborrowings up to an approved credit limit for 10 years, followed by a paybackperiod, usually 15 years, where the borrower must pay back the outstandingamount. The cost of originating a HELOC is quite low and HELOC bor-rowers tend to have very good credit scores. ‘Second liens’ are loans that aredefined as second liens excluding lines of credit and loans with a purpose ofrefinancing. These loans typically have a fixed rate and payoff period andare often given to borrowers with riskier credit histories and have higher-than-average interest rates. The second category of equity extraction loansincludes first mortgages. ‘Cash-out refinancing’ is defined to include loansoriginated for the purpose of cash-out refinancing that are not structuredas a LOC and are typically paid back over 15–30 years. ‘First liens not forpurchase’ are closed liens in first position that are not for the purpose ofrefinancing or for home purchase.
The remaining two types of mortgages do not involve the borrowerobtaining additional cash. ‘Refinance no cash’ loans include both closedand open lines of credit for the stated purpose of refinancing withoutcash-out, excluding loans for the purchase of a home. Finally, ‘purchase

Tabl
e13
.1M
ortg
ageap
plicatio
nsre
ported
in20
18H
omeM
ortg
ageDisclos
ureAct
forap
plican
tsor
co-app
lican
tsag
e62
+
HECM
trad
itio
nal
HECM
for
purc
has
e
Oth
erre
verse
mor
tgag
e
HELO
Cor
seco
nd
Cas
h-out
firstl
ien
Refi
nan
ceno
cash
Purc
has
em
ortg
age
Total
App
licat
ion
Stat
usO
riginated
0.56
20.77
60.64
60.48
70.46
50.50
20.66
10.53
0Num
berof
origin
ated
loan
s
28,946
1,95
21,95
227
4,38
833
4,79
126
8,21
041
9,26
61,33
0,34
2
Den
ied
0.16
70.07
50.12
80.36
50.24
50.23
70.11
80.23
6W
ithdr
awn
orin
com
plet
e0.27
10.15
0.18
0.14
80.29
0.26
10.22
10.23
4
N51
,493
2,51
73,02
156
3,65
372
0,25
153
4,57
263
4,57
32,51
0,08
0
Rea
son
for
Den
ial
Cre
dith
isto
ry0.08
80.07
40.06
20.40
70.29
60.27
30.32
20.33
Deb
tto
inco
mera
tio
0.05
0.04
80.02
60.50
60.30
30.38
80.37
60.39
7
Col
late
ral
0.39
40.20
70.47
40.18
60.18
60.17
20.12
40.17
8In
suffi
cien
tca
sh0.26
20.11
20.17
10.01
20.02
20.02
60.07
70.03
Cre
dit
appl
icatio
nin
com
plet
e
0.21
80.36
20.07
30.03
70.17
30.13
0.10
90.10
9
Oth
erre
ason
s0.15
70.22
30.33
40.16
40.17
30.19
10.22
70.18
N8,57
481
8883
8620
5,92
217
6,39
112
6,73
775
,189
593,38
7
Not
e:Sa
mpl
eis
restricted
tolo
ansfo
rsingle
fam
ily,ow
ner
-occ
upied
prop
erties
wher
eth
eap
plican
tor
co-app
lican
tis
age
62or
olde
r,ex
clud
ing
inve
stm
entp
rope
rtiesan
dse
cond
hom
es.
Sour
ce:A
uthor
s’ca
lcul
atio
nsfrom
2018
HM
DA
data,e
xclu
dingpu
rchas
edlo
ans.
270 New Models for Managing Longevity Risk
mortgages’ are closed-end loans with the stated purpose of home purchase.In both cases, the bulk of such mortgages involved fixed rates (althoughsome are also hybrid adjustable-rate mortgages, or ARMs) and a paybackperiod that is usually 30 years, although some traditional mortgages mayhave a shorter 15-year payback period.
Of the modes of extracting home equity, HELOC and second liens areslightly more common in 2008 than cash-out refinancing or first liens notfor purchase. Both options are quite a bit more prevalent than HECMs.
Reasons for loan denial: Older versus younger borrowersTable 13.1 also compares the proportion of applications denied or approvedby the lender, as well as those considered incomplete or withdrawn bythe applicant. Rates of denial were highest for HELOCs and second liens,with more than one-third of older applicants in 2018 being denied. Aboutone-fourth of cash-out refinancing and first lien mortgages were denied.Notably, having a weak credit history or high DTI ratio were the top reasonsfor denial among these applicants, with more than half of HELOC denialsbeing due to an inability to afford the monthly payments (e.g. high DTI).By contrast, reverse mortgage applications were less likely to be denied,with primary reasons for denial being related to the collateral value of theproperty or insufficient cash to cover required costs.
These differences in reasons for loan denial make sense, given thatreverse mortgages carry different criteria for underwriting than forwardmortgages. There is no required monthly repayment of a reverse mortgage,and thus there is no additional DTI burden from a reverse mortgage. Begin-ning in 2015, HECMborrowers must demonstrate the ability to pay ongoingproperty T&I payments or have sufficient home equity to set aside funds topay these expenses in an escrow-type account at the time of loan closing(Moulton and Haurin 2019). The primary barrier to obtaining a reversemortgage is not poor credit history or lack of income, but lack of sufficienthome equity (Moulton et al. 2017). Any existing mortgage debt on a homeat the time of application for a reverse mortgage must be paid off with theproceeds of the reverse mortgage or in cash at closing.
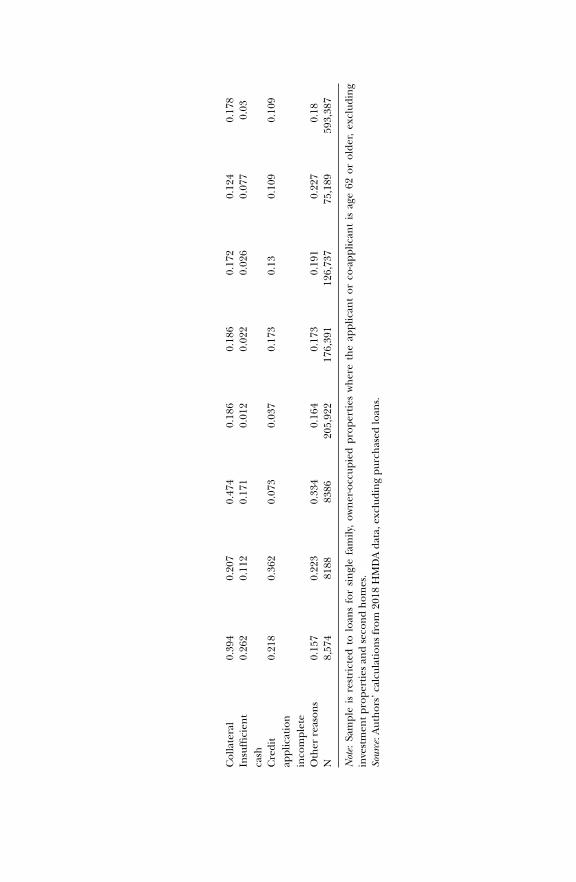
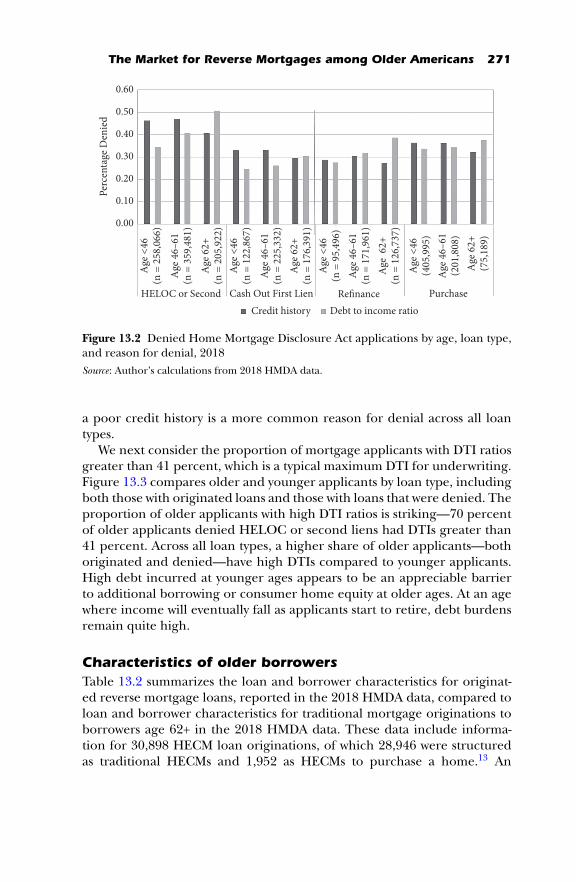
To give additional perspectives on the reasons that seniors are turneddown for mortgage credit, Figure 13.2 compares reasons for denial ofmortgage applications by applicant age, including applicants age 45 andyounger, age 46 to 61, and age 62 and older. Here, it is clear that inabilityto afford the monthly payment is a more substantial barrier to originatinga mortgage for older adults than it is for younger cohorts. For example,more than 50 percent of older adults denied HELOC and second loanswere denied them due to inability to afford monthly payments, comparedwith only 35 percent of those age 45 and younger. For younger applicants,
The Market for Reverse Mortgages among Older Americans 271
0.60
0.50
0.40
0.30
0.20
0.10
0.00
Perc
enta
ge D
enie
d
Age
<46
(n =
258
,066
)A
ge 4
6–61
(n =
359
,481
)A
ge 6
2+(n
= 2
05,9
22)
Age
<46
(n =
122
,867
)
Age
46–
61(n
= 2
25,3
32)
Age
62+
(n =
176
,391
)A
ge <
46(n
= 9
5,49
6)A
ge 4
6–61
(n =
171
,961
)A
ge 6
2+(n
= 1
26,7
37)
Age
<46
(405
,995
)A
ge 4
6–61
(201
,808
)A
ge 6
2+(7
5,18
9)
HELOC or Second Cash Out First Lien Refinance PurchaseCredit history Debt to income ratio
Figure 13.2 Denied Home Mortgage Disclosure Act applications by age, loan type,and reason for denial, 2018Source: Author’s calculations from 2018 HMDA data.
a poor credit history is a more common reason for denial across all loantypes.
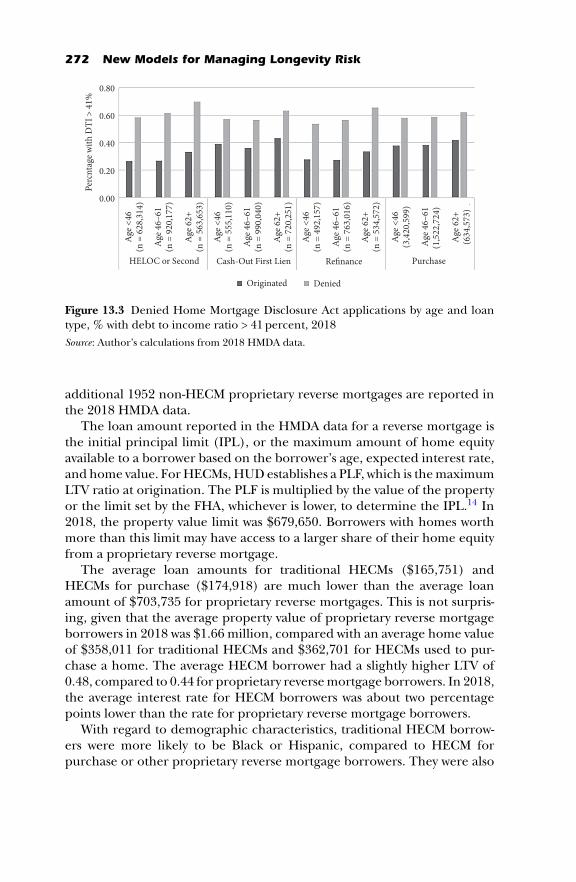
We next consider the proportion of mortgage applicants with DTI ratiosgreater than 41 percent, which is a typical maximum DTI for underwriting.Figure 13.3 compares older and younger applicants by loan type, includingboth those with originated loans and those with loans that were denied. Theproportion of older applicants with high DTI ratios is striking—70 percentof older applicants denied HELOC or second liens had DTIs greater than41 percent. Across all loan types, a higher share of older applicants—bothoriginated and denied—have high DTIs compared to younger applicants.High debt incurred at younger ages appears to be an appreciable barrierto additional borrowing or consumer home equity at older ages. At an agewhere income will eventually fall as applicants start to retire, debt burdensremain quite high.
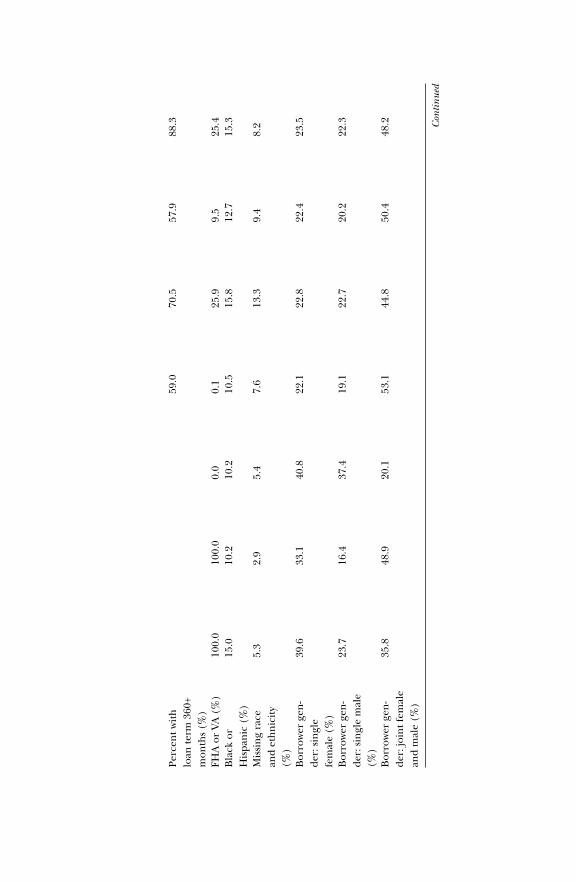
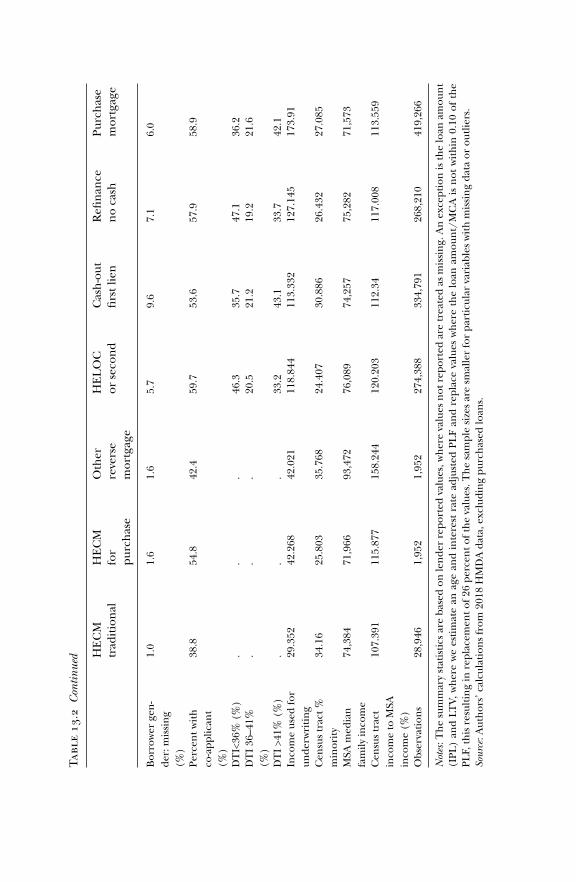
Characteristics of older borrowersTable 13.2 summarizes the loan and borrower characteristics for originat-ed reverse mortgage loans, reported in the 2018 HMDA data, compared toloan and borrower characteristics for traditional mortgage originations toborrowers age 62+ in the 2018 HMDA data. These data include informa-tion for 30,898 HECM loan originations, of which 28,946 were structuredas traditional HECMs and 1,952 as HECMs to purchase a home.13 An
272 New Models for Managing Longevity Risk
0.80
0.60
0.40
0.20
0.00
Perc
ntag
e with
DTI
> 4
1%
Age
<46
(n =
628
,314
)
Age
46–
61(n
= 9
20,1
77)
Age
62+
(n =
563
,653
)
Age
<46
(n =
555
,110
)
Age
46–
61(n
= 9
90,0
40)
Age
62+
(n =
720
,251
)
Age
<46
(n =
492
,157
)
Age
46–
61(n
= 7
63,0
16)
Age
62+
(n =
534
,572
)
Age
<46
(3,4
20,5
99)
Age
46–
61(1
,522
,724
)
Age
62+
(634
,573
)
HELOC or Second Cash-Out First Lien Refinance Purchase
Originated Denied
Figure 13.3 Denied Home Mortgage Disclosure Act applications by age and loantype, % with debt to income ratio > 41 percent, 2018Source: Author’s calculations from 2018 HMDA data.
additional 1952 non-HECM proprietary reverse mortgages are reported inthe 2018 HMDA data.
The loan amount reported in the HMDA data for a reverse mortgage isthe initial principal limit (IPL), or the maximum amount of home equityavailable to a borrower based on the borrower’s age, expected interest rate,and home value. ForHECMs,HUDestablishes a PLF, which is themaximumLTV ratio at origination. The PLF is multiplied by the value of the propertyor the limit set by the FHA, whichever is lower, to determine the IPL.14 In2018, the property value limit was $679,650. Borrowers with homes worthmore than this limit may have access to a larger share of their home equityfrom a proprietary reverse mortgage.
The average loan amounts for traditional HECMs ($165,751) andHECMs for purchase ($174,918) are much lower than the average loanamount of $703,735 for proprietary reverse mortgages. This is not surpris-ing, given that the average property value of proprietary reverse mortgageborrowers in 2018 was $1.66 million, compared with an average home valueof $358,011 for traditional HECMs and $362,701 for HECMs used to pur-chase a home. The average HECM borrower had a slightly higher LTV of0.48, compared to 0.44 for proprietary reversemortgage borrowers. In 2018,the average interest rate for HECM borrowers was about two percentagepoints lower than the rate for proprietary reverse mortgage borrowers.
With regard to demographic characteristics, traditional HECM borrow-ers were more likely to be Black or Hispanic, compared to HECM forpurchase or other proprietary reverse mortgage borrowers. They were also

Tabl
e13
.2Su
mm
arych
arac
teristicsre
ported
in20
18H
omeM
ortg
ageDisclos
ureAct
(mea
ns)
HECM
trad
itio
nal
HECM
for
purc
has
e
Oth
erre
verse
mor
tgag
e
HELO
Cor
seco
nd
Cas
h-out
firstl
ien
Refi
nan
ceno
cash
Purc
has
em
ortg
age
Loa
nam
ount
(IPL
forre
verse
mor
tgag
e)
165,75
117
4,91
870
3,73
510
8,91
520
6,54
517
9,06
522
8,39
9
Prop
erty
valu
e35
8,01
136
2,70
11,65
5,04
643
3,56
139
3,73
442
6,76
034
2,16
1Com
bined
loan
tova
luera
tio
0.47
80.48
60.43
70.55
0.63
0.56
50.78
Loa
nto
valu
era
tio
forth
islo
an
0.47
90.48
60.43
70.30
40.62
50.50
90.77
4
Inte
rest
rate
4.78
94.60
36.51
35.93
5.07
5.33
55.34
6In
tere
stra
tesp
read
..
.0.39
80.63
40.23
60.62
4
Totall
oan
costs
..
.32
24,76
23,33
54,51
3
Con
tinue
d

Tabl
e13
.2C
ontin
ued H
ECM
trad
itio
nal
HECM
for
purc
has
e
Oth
erre
verse
mor
tgag
e
HELO
Cor
seco
nd
Cas
h-out
firstl
ien
Refi
nan
ceno
cash
Purc
has
em
ortg
age
Perc
entr
epor
t-in
gto
tall
oan
costs(%
)
..
.7.1
93.2
57.4
91.8
Originatio
nch
arge
s.
..
772,27
61,70
81,52
9
Disco
untp
oints
ifnon
-zer
o.
..
246
2,36
12,18
91,50
9
Perc
entr
epor
t-in
gnon
-zer
odi
scou
ntp
oints
(%)
..
.0.4
52.8
38.2
31.7
Len
dercr
editsif
non
-zer
o.
..
386
738
835
821
Perc
entr
epor
t-in
glende
rcr
edits(%
)
..
.27
.734
.738
.438
.3
Loa
nte
rm(m
onth
s).
..
304
305
298
340
Perc
entw
ith
loan
term
360+
mon
ths(%
)
59.0
70.5
57.9
88.3
FHA
orVA
(%)
100.0
100.0
0.0
0.1
25.9
9.5
25.4
Black
orH
ispa
nic
(%)
15.0
10.2
10.2
10.5
15.8
12.7
15.3
Missingra
cean
det
hnicity
(%)
5.3
2.9
5.4
7.6
13.3
9.4
8.2
Bor
rower
gen-
der:
single
fem
ale(%
)
39.6
33.1
40.8
22.1
22.8
22.4
23.5
Bor
rower
gen-
der:
singlem
ale
(%)
23.7
16.4
37.4
19.1
22.7
20.2
22.3
Bor
rower
gen-
der:
join
tfem
ale
and
male(%
)
35.8
48.9
20.1
53.1
44.8
50.4
48.2 Con
tinue
d
Tabl
e13
.2C
ontin
ued H
ECM
trad
itio
nal
HECM
for
purc
has
e
Oth
erre
verse
mor
tgag
e
HELO
Cor
seco
nd
Cas
h-out
firstl
ien
Refi
nan
ceno
cash
Purc
has
em
ortg
age
Bor
rower
gen-
der:
missing
(%)
1.0
1.6
1.6
5.7
9.6
7.1
6.0
Perc
entw
ith
co-app
lican
t(%
)
38.8
54.8
42.4
59.7
53.6
57.9
58.9
DTI<
36%
(%)
..
.46
.335
.747
.136
.2DTI36
–41%
(%)
..
.20
.521
.219
.221
.6
DTI>4
1%(%
).
..
33.2
43.1
33.7
42.1
Inco
meus
edfo
run
derw
riting
29.352
42.268
42.021
118.84
411
3.33
212
7.14
517
3.91
Cen
sustrac
t%m
inor
ity
34.16
25.803
35.768
24.407
30.886
26.432
27.085
MSA
med
ian
fam
ilyin
com
e74
,384
71,966
93,472
76,089
74,257
75,282
71,573
Cen
sustrac
tin
com
eto
MSA
inco
me(%
)
107.39
111
5.87
715
8.24
412
0.20
311
2.34
117.00
811
3.55
9
Obs
erva
tion
s28
,946
1,95
21,95
227
4,38
833
4,79
126
8,21
041
9,26
6
Not
es:T
hesu
mm
arystatistics
areba
sed
onlende
rre
ported
valu
es,w
her
eva
lues
not
repo
rted
aretrea
ted
asm
issing.
An
exce
ptio
nis
thelo
anam
ount
(IPL
)an
dLT
V,wher
ewe
estim
ate
anag
ean
din
tere
stra
tead
justed
PLF
and
repl
ace
valu
eswher
eth
elo
anam
ount/
MCA
isnot
within
0.10
ofth
ePL
F,th
isre
sultin
gin
repl
acem
ento
f26pe
rcen
toft
heva
lues
.Thesa
mpl
esize
sar
esm
allerfo
rpa
rticul
arva
riab
leswith
missingda
taor
outliers.
Sour
ce:A
uthor
s’ca
lcul
atio
nsfrom
2018
HM
DA
data,e
xclu
dingpu
rchas
edlo
ans.
The Market for Reverse Mortgages among Older Americans 277
more likely to be single, to have a lower income to underwrite the loan,and be located in a lower income census tract—although still slightly abovethe median income for the Metropolitan Statistical Area (MSA). Comparedto either type of HECM borrower, proprietary reverse mortgage borrowerstend to be older and from higher income census tracts as a percentage ofthe MSA median income.
Next we compare reverse mortgage borrowers to those who take othertypes of mortgages. The average property value of $433,561 for HELOCsand second liens and $393,734 for cash-out refinancing or new first liens notfor purchase is higher than the average traditional HECM property value of$358,011. The average loan amount for HELOC and second lien borrowersof $108,918 is smaller than the average loan amount of HECM borrowers.It is important to note that an appreciable share of the HELOC and secondloan borrowers held existing first mortgages, as the combined LTV for allmortgages on the property of 0.55 is considerably higher than the LTV of0.30 for the HELOC or second loan by itself.
The average interest rate of HELOC and second loans of 5.93 per-cent is a bit higher than the 4.8 percent interest rate on HECM loans,which becomes 5.3 percent when we add the 0.5 percent mortgage insur-ance premium (MIP) that must also be paid on an FHA-insured HECM.This insurance fee also exists for traditional FHA loans, where the MIPis also unreported, but also for traditional Fannie Mae and Freddie Macloans with an LTV above 80 percent where there is a required privatemortgage insurance (PMI) policy. Loan costs are not reported in HMDAfor reverse mortgages or HELOCs, but they are reported for closed-endforward mortgages, with average up-front costs of about $4,500 for cash-out refinancing and purchase mortgages, or about 2 percent of loanproceeds.
Notably, the average combined LTV for the cash-out loan types rangesbetween 55 (HELOC and second loans) and 63 percent (cash-out refinanc-ing and nonpurchase first mortgages). This is striking, given the size ofmortgage debt owed over a repayment period of 25 to 30 years, extendinginto borrowers’ 90s and beyond. Such borrowers are taking on mortgagepayments as a share of home value that are nearly as large as much youngerborrowers who have a much longer expected working period.
Consistent with the perception of having strong credit requirements,HELOC borrowers also appear to have higher income characteristics thando reverse mortgage or other cash-out borrowers. HECM borrowers livein lower income census tracts (107% of MSA median) versus cash-outrefinancing or nonpurchase first liens (112%) or HELOCs and secondliens (120%). HELOC and second lien borrowers are less likely to be Blackor Hispanic (10.5%) than cash-out first lien borrowers (15.8%), who arecloser to the traditional HECM minority share of 15 percent. Strikingly,

278 New Models for Managing Longevity Risk
HECM borrowers are almost twice as likely to be single female (40%) versusapproximately 22 percent of HELOC and second lien borrowers.
When we examine traditional purchase or refinance mortgages, HECMborrowers have a similar share to Black or Hispanic borrowers (13–15%)and also almost double the share of single female borrowers. Further-more, those in neighborhoods for refinancing and purchase mortgageshave higher incomes relative to theirMSA compared toHECMcensus tracts.
HECM simulations using 2018 HMDA dataNext, we leverage the HMDA data to estimate a series of counterfactual sim-ulations to determine whether applicants in the HMDA data could haveobtained HECMs instead of the mortgages actually chosen. The simulationsfocus on the size of the loan requested without taking credit into account.In part, this is because we do not observe borrower credit indicators acrossall loan types. Nevertheless, relatively fewHECMborrowers are rejected dueto low credit for two reasons. First, since HECMs do not have required prin-cipal and interest payments, borrowers must only show the ability to payproperty T&I, a much lower income standard. Second, HECM borrowerswith a poor credit history or low income can always choose to take a low-er IPL and set aside borrowing proceeds to pay future T&I.15 Thus, HECMborrowers can have a poor credit history or low income and still qualify forthe loan.
To examine eligibility for an HECM, we determine the amount of moneya borrower could qualify for using the initial PLF tables from the HECMprogram in 2018. Inputs to the IPL tables include the age of the youngestborrower and the property value, estimates of which are reported inHMDA.For the expected interest rate on an HECM loan, another input requiredfor the PLF table, we use two different values as described below. We com-pare the loan size requested through a forward mortgage with what weestimate the borrower could have obtained with an HECM.
We run the simulation with two different sets of assumptions regardingthe HECM expected interest rate and loan costs. The first scenario is aconservative estimate, with the maximum permissible loan origination feeand an expected interest rate of 4.75 percent (the median rate in 2018).The second scenario relaxes some of these assumptions, waiving the lenderorigination fee and using an expected interest rate of three percent.
The lower interest rate in the second scenario is important, as borrow-ers are able to obtain the maximum possible proceeds in the PLF table bygaining access to a lower interest rate loan. In practice, borrowers who shoparound are often able to obtainmore preferable terms on anHECM, includ-ing lower rates and thus higher loan proceeds. Also, lenders are often willingto offer borrowers a lower interest rate on their HECMs if the borrowers take

The Market for Reverse Mortgages among Older Americans 279
more proceeds. This is especially true where the lower rate allows a borrowerto obtain an HECM when, at a higher rate, that borrower would not obtainsufficient proceeds to pay off a previous lien. The second scenario would beparticularly relevant in times when the 10-year treasury rate falls below thatin 2019, when rates peaked above three percent, compared to average ratesthat were 0.5 to 1 percent lower in the other years between 2016 and 2019.In 2020, with COVID-19 and recent Fed moves, many reverse mortgagesare being originated at or near the three percent rate that obtains a max-imum PLF. Recent experience along with the data in this chapter suggestthat demand for reverse mortgages may be quite sensitive to interest ratesdue to the much larger proceeds available in lower interest rate economicenvironments.
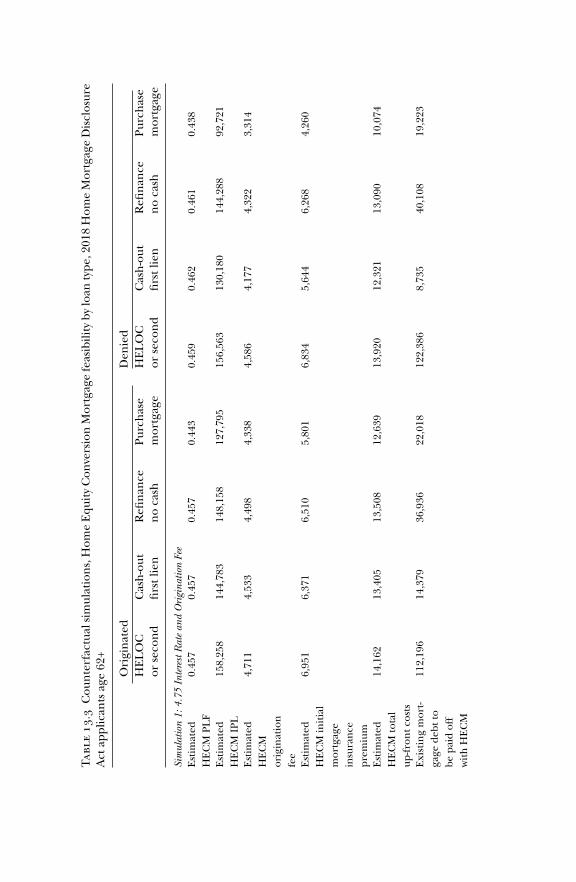
We conduct the simulations for both originated forward mortgages andfor applications for forward mortgages that were denied—the latter beinga group of older adults with an expressed preference for borrowing fromhome equity who were unable to do so through the mortgage type selected.The results for originated forward mortgages and for denied applicationscan be seen in Table 13.3.
To illustrate our approach, consider the case of HELOC and second lienoriginations in Table 13.3. Based on the age of the youngest borrower andan expected interest rate of 4.75 percent, the estimated average PLF is 0.457percent (top section of Table 13.3). Multiplying this factor by the borrower’sproperty value or the loan limit of $679,650 (whichever is less) results in anaverage maximum HECM loan amount (IPL) of $158,258. Note that reduc-ing the expected interest rate to 3 percent (bottom section of Table 13.3)increases the PLF by nearly 10 percentage points, raising themaximum loanamount to $192,299.
We then calculate the borrower-specific up-front costs associated with anHECM, comprised of lender origination fees, an up-front MIP charged byHUD, and standard closing costs (e.g. appraisal and closing fees). For thesimulation at the top of Table 13.3, we assume that the maximum origi-nation fee is assessed by a lender at an average of $4,711 for HELOC andsecond lien borrowers in our sample.16 We waive the origination fee in thebottom of Table 13.3, as this fee is assessed at a lender’s discretion andlenders might choose not to charge it for borrowers who take large pro-ceeds and also comparison shop on prices. The up-front MIP is currentlyset by HUD at two percent of the home value, amounting to $6,951 for theaverage HELOC or second lien borrower in our sample. We also include anestimated $2,500 for standard closing costs,17 resulting in total estimatedup-front costs of $14,162 for the average HELOC borrower (top section),or $9,451 with the origination fee waived (bottom section).
It is important to note that the MIP for an HECM buys some protectionsnot available for other types of mortgages, especially HELOCs. All HECMs
Tabl
e13
.3Cou
nte
rfac
tual
sim
ulatio
ns,
Hom
eEqu
ityCon
versio
nM
ortg
agefe
asib
ility
bylo
antype
,201
8H
omeM
ortg
ageDisclos
ure
Act
appl
ican
tsag
e62
+
Originated
Den
ied
HELO
Cor
seco
nd
Cas
h-out
firstl
ien
Refi
nan
ceno
cash
Purc
has
em
ortg
age
HELO
Cor
seco
nd
Cas
h-out
firstl
ien
Refi
nan
ceno
cash
Purc
has
em
ortg
age
Sim
ulat
ion
1:4.
75In
tere
stR
ate
and
Ori
gina
tion
Fee
Estim
ated
HECM
PLF
0.45
70.45
70.45
70.44
30.45
90.46
20.46
10.43
8
Estim
ated
HECM
IPL
158,25
814
4,78
314
8,15
812
7,79
515
6,56
313
0,18
014
4,28
892
,721
Estim
ated
HECM
origin
atio
nfe
e
4,71
14,53
34,49
84,33
84,58
64,17
74,32
23,31
4
Estim
ated
HECM
initial
mor
tgag
ein
sura
nce
prem
ium
6,95
16,37
16,51
05,80
16,83
45,64
46,26
84,26
0
Estim
ated
HECM
total
up-fr
ontc
osts
14,162
13,405
13,508
12,639
13,920
12,321
13,090
10,074
Existin
gm
ort-
gage
debt
tobe
paid
off
with
HECM
112,19
614
,379
36,936
22,018
122,38
68,73
540
,108
19,223

Estim
ated
totall
oan
amou
ntw
ith
HECM
236,68
423
7,41
123
1,17
226
8,11
024
0,37
722
8,24
424
5,77
825
5,16
7
Estim
ated
HECM
loan
tova
lueor
MCA
0.64
30.71
50.66
50.85
90.68
0.79
80.74
80.95
2
Cou
ldob
tain
HECM
0.28
20.16
10.25
20.06
40.25
90.11
20.17
70.02
9
HECM
PLF
less
estim
ated
HECM
LTV
−0.186
−0.259
−0.208
−0.416
−0.221
−0.335
−0.287
−0.514
Shor
tfallf
orH
ECM
−0.324
−0.335
−0.327
−0.453
−0.36
−0.397
−0.38
−0.533
Sim
ulat
ion
2:3.
0In
tere
stR
ate
and
No
Ori
gina
tion
Fee
Estim
ated
HECM
PLF
0.55
50.55
50.55
50.54
20.55
70.56
0.55
90.53
8
Estim
ated
HECM
IPL
192,29
917
5,99
218
0,05
215
6,49
919
0,04
415
7,77
917
4,97
011
3,91
7
Con
tinue
d
Tabl
e13
.3C
ontin
ued
Originated
Den
ied
HELO
Cor
seco
nd
Cas
h-out
firstl
ien
Refi
nan
ceno
cash
Purc
has
em
ortg
age
HELO
Cor
seco
nd
Cas
h-out
firstl
ien
Refi
nan
ceno
cash
Purc
has
em
ortg
age
Estim
ated
HECM
initial
mor
tgag
ein
sura
nce
prem
ium
6,95
16,37
16,51
05,80
16,83
45,64
46,26
84,26
0
Estim
ated
HECM
total
up-fr
ontc
osts
9,45
18,87
19,01
08,30
19,33
48,14
48,76
86,76
0
Existin
gm
ort-
gage
debt
tobe
paid
off
with
HECM
112,19
614
,379
36,936
22,018
122,38
68,73
540
,108
19,223
Estim
ated
totall
oan
amou
ntw
ith
HECM
231,96
923
2,87
722
6,66
626
3,71
723
5,76
122
4,03
824
1,41
425
1,35
4
Estim
ated
HECM
loan
tova
lueor
MCA
0.62
70.69
90.64
90.84
30.66
40.78
10.73
20.93
5
Cou
ldob
tain
HECM
0.39
50.26
80.38
0.12
0.35
60.18
90.28
20.05
8
HECM
PLF
less
estim
ated
HECM
LTV
−0.072
−0.144
−0.094
−0.301
−0.107
−0.221
−0.173
−0.397
Shor
tfallf
orH
ECM
−0.26
−0.261
−0.267
−0.362
−0.292
−0.313
−0.313
−0.43
N27
4,38
833
4,79
126
8,21
041
9,26
620
5,92
217
6,39
112
6,73
775
,189
Sour
ce:A
uthor
s’ca
lcul
atio
nsfrom
2018
HM
DA
data.
The Market for Reverse Mortgages among Older Americans 283
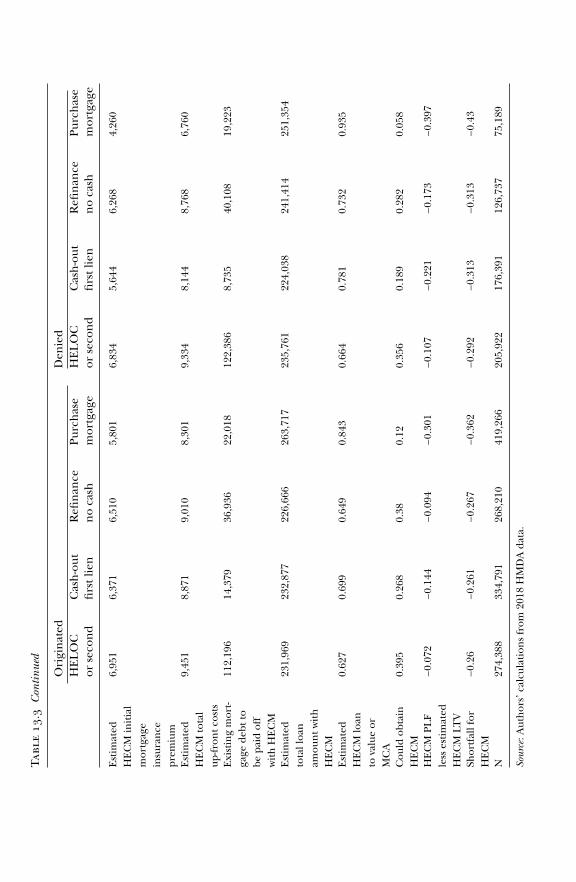
are non-recourse, which means that borrowers, their heirs, and lenders arenot responsible for anything owed on the HECM balance beyond the val-ue of the home. By contrast, for HELOCs, borrowers in most states bearpersonal liability for any negative equity. Personal liability is a feature ofalmost all second liens and some first lien mortgages, depending on thestate. Also, HELOCs are subject to being suspended in an environment offalling home prices, whereas the HECM LOC will not be cut if home pricesdecline (although the LOC can be suspended if a borrower fails to meetother reverse mortgage obligations such as making timely payment of prop-erty T&I, adequately maintaining the home, and living in the home as theirprimary residence).
To estimate the total loan amount from the HECM, we add together theborrower’s requested loan amount for the forward mortgage, any existingmortgage debt held by the borrower in addition to the new loan beingrequested (e.g. the balance on a first mortgage for borrowers requestinga second lien or HELOC), and the estimated HECM closing costs. We thendivide this amount by the borrower’s property value or the MCA (whicheveris lower) to get the estimated LTV if the borrower were to obtain an HECM.If the estimated LTV is less than the estimated PLF, the borrower couldobtain an HECM. For HELOC and second lien borrowers, the ratio aver-ages 0.643 (top panel) or 0.627 percent (bottom panel), which exceeds theestimated maximum PLF by an average of 0.186 (top panel) or 0.072 per-cent (bottom panel). At an expected interest rate of 4.75 percent and withthe full origination fee, we estimate that 28 percent of HELOC and sec-ond lien borrowers could have obtained an HECM. At an expected rate ofthree percent with no origination fee, this proportion increases to about 40percent of HELOC and second lien originations.
Across all loan types, we estimate that about 17 to 27 percent of olderadults originating mortgages in 2018 could have obtained an HECM for thesame loan amount obtained through a forward mortgage, correspondingto a total of 225,000 to 350,000 older adults. A key reason that a majorityof borrowers may be choosing a traditional mortgage is simply that theyare borrowing too much money to choose an HECM. In other words, thelarge required debt means that an HECM was not an option for at leastthree-quarters of older mortgage borrowers in 2018.
Equally interesting is that roughly the same proportion of rejected borrowersmay have qualified for an HECM as for actual borrowers. The simulationsin the right hand columns of Table 13.3 indicate that 17 to 25 percentof denied forward mortgage borrowers would have sufficient home equityto originate an HECM at their requested loan amount, corresponding to98,000 to 147,000 older adults. For the rejected borrowers, an HECM wouldhavemade the difference between getting and not getting amortgage, whileat the same time eliminating the required mortgage payment.
284 New Models for Managing Longevity Risk
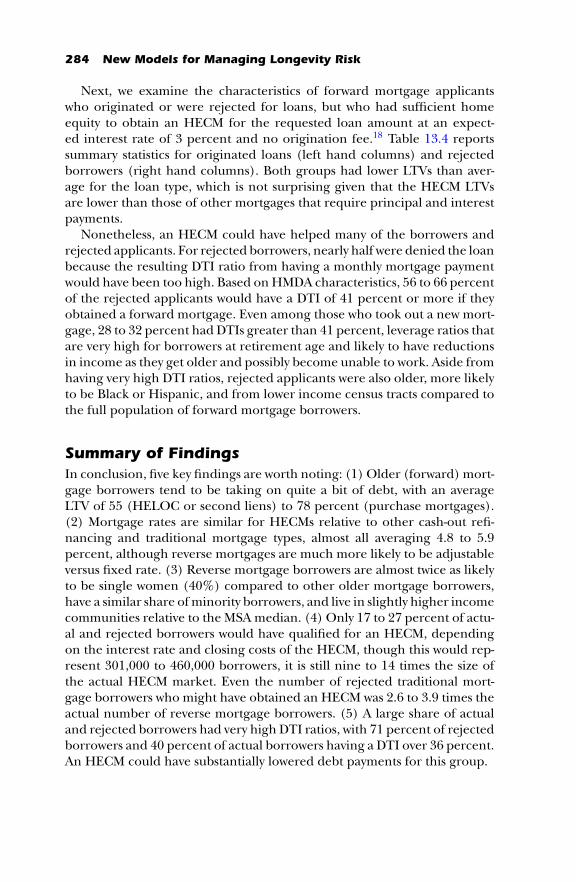
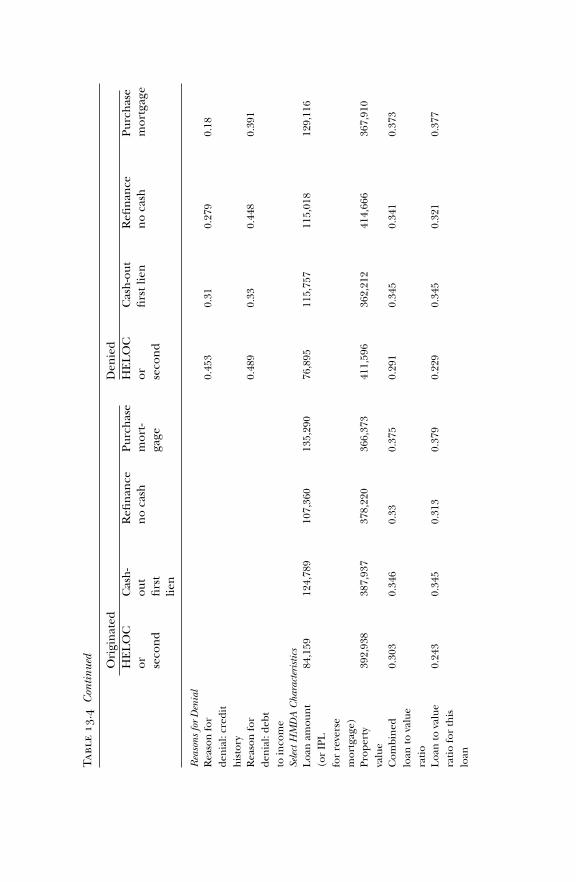
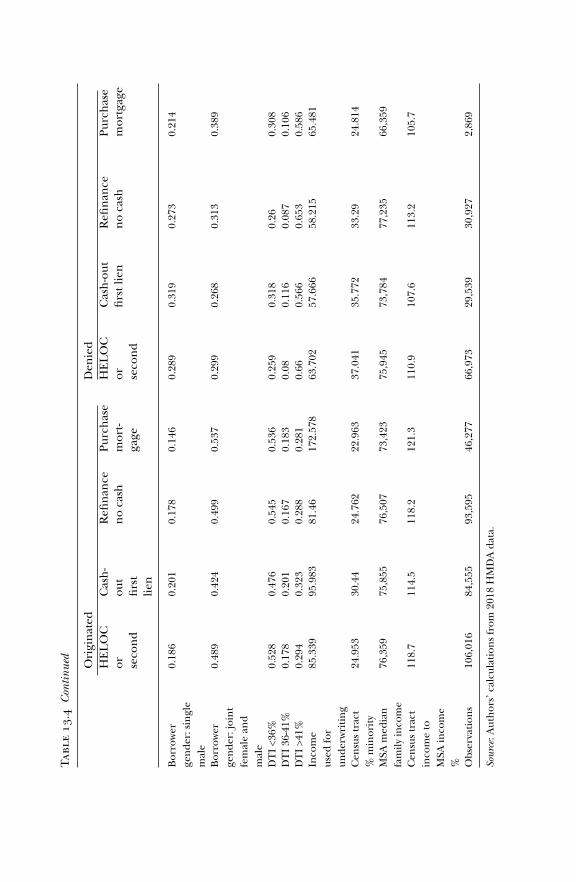
Next, we examine the characteristics of forward mortgage applicantswho originated or were rejected for loans, but who had sufficient homeequity to obtain an HECM for the requested loan amount at an expect-ed interest rate of 3 percent and no origination fee.18 Table 13.4 reportssummary statistics for originated loans (left hand columns) and rejectedborrowers (right hand columns). Both groups had lower LTVs than aver-age for the loan type, which is not surprising given that the HECM LTVsare lower than those of other mortgages that require principal and interestpayments.
Nonetheless, an HECM could have helped many of the borrowers andrejected applicants. For rejected borrowers, nearly half were denied the loanbecause the resulting DTI ratio from having a monthly mortgage paymentwould have been too high. Based onHMDA characteristics, 56 to 66 percentof the rejected applicants would have a DTI of 41 percent or more if theyobtained a forward mortgage. Even among those who took out a new mort-gage, 28 to 32 percent had DTIs greater than 41 percent, leverage ratios thatare very high for borrowers at retirement age and likely to have reductionsin income as they get older and possibly become unable to work. Aside fromhaving very high DTI ratios, rejected applicants were also older, more likelyto be Black or Hispanic, and from lower income census tracts compared tothe full population of forward mortgage borrowers.
Summary of FindingsIn conclusion, five key findings are worth noting: (1) Older (forward) mort-gage borrowers tend to be taking on quite a bit of debt, with an averageLTV of 55 (HELOC or second liens) to 78 percent (purchase mortgages).(2) Mortgage rates are similar for HECMs relative to other cash-out refi-nancing and traditional mortgage types, almost all averaging 4.8 to 5.9percent, although reverse mortgages are much more likely to be adjustableversus fixed rate. (3) Reverse mortgage borrowers are almost twice as likelyto be single women (40%) compared to other older mortgage borrowers,have a similar share ofminority borrowers, and live in slightly higher incomecommunities relative to the MSA median. (4) Only 17 to 27 percent of actu-al and rejected borrowers would have qualified for an HECM, dependingon the interest rate and closing costs of the HECM, though this would rep-resent 301,000 to 460,000 borrowers, it is still nine to 14 times the size ofthe actual HECM market. Even the number of rejected traditional mort-gage borrowers who might have obtained an HECM was 2.6 to 3.9 times theactual number of reverse mortgage borrowers. (5) A large share of actualand rejected borrowers had very high DTI ratios, with 71 percent of rejectedborrowers and 40 percent of actual borrowers having a DTI over 36 percent.An HECM could have substantially lowered debt payments for this group.

Tabl
e13
.4Su
mm
arych
arac
teristicsof
2018
Hom
eM
ortg
ageDisclos
ureAct
appl
ican
ts,w
ould
qualifyfo
rH
omeEqu
ityCon
versio
nM
ortg
ageat
3.0ra
te Originated
Den
ied
HELO
Cor se
cond
Cas
h-
out
first
lien
Refi
nan
ceno
cash
Purc
has
em
ort-
gage
HELO
Cor se
cond
Cas
h-out
firstl
ien
Refi
nan
ceno
cash
Purc
has
em
ortg
age
Estim
ated
HEC
ML
oan
Cha
ract
eris
tics
Estim
ated
HECM
total
up-fr
ontc
osts
14,367
14,367
14,043
14,614
9,44
39,05
69,70
59,29
2
Mor
tgag
ede
btto
belaid
offw
ith
HECM
28,151
2,88
69,42
61,19
929
,820
2,84
012
,106
2,07
4
Estim
ated
loan
amou
nt
with
HECM
121,87
713
7,24
012
6,11
914
6,09
911
6,15
812
7,65
413
6,82
914
0,48
3
Estim
ated
HECM
loan
tova
lueor
MCA
0.35
20.39
30.37
80.41
60.34
10.39
40.39
10.41
9
Con
tinue
d
Tabl
e13
.4C
ontin
ued
Originated
Den
ied
HELO
Cor se
cond
Cas
h-
out
first
lien
Refi
nan
ceno
cash
Purc
has
em
ort-
gage
HELO
Cor se
cond
Cas
h-out
firstl
ien
Refi
nan
ceno
cash
Purc
has
em
ortg
age
Rea
sons
for
Den
ial
Rea
son
for
denial:cr
edit
histo
ry
0.45
30.31
0.27
90.18
Rea
son
for
denial:de
btto
inco
me
0.48
90.33
0.44
80.39
1
Sele
ctH
MD
AC
hara
cter
istic
sLoa
nam
ount
(orIP
Lfo
rre
verse
mor
tgag
e)
84,159
124,78
910
7,36
013
5,29
076
,895
115,75
711
5,01
812
9,11
6
Prop
erty
valu
e39
2,93
838
7,93
737
8,22
036
6,37
341
1,59
636
2,21
241
4,66
636
7,91
0
Com
bined
loan
tova
lue
ratio
0.30
30.34
60.33
0.37
50.29
10.34
50.34
10.37
3
Loa
nto
valu
era
tio
forth
islo
an
0.24
30.34
50.31
30.37
90.22
90.34
50.32
10.37
7

Inte
rest
rate
4.93
34.59
64.40
24.54
8.
..
.In
tere
stra
tesp
read
0.21
20.59
30.15
70.36
1.
..
.
Totall
oan
costs
266
2,91
62,15
13,25
9.
..
.
Perc
ent
repo
rtin
gto
tall
oan
costs
0.04
80.95
40.48
80.97
30
00
0
Black
orH
ispa
nic
0.10
10.14
10.09
90.07
90.26
20.21
90.19
20.14
3
Bor
rower
gende
r:single
fem
ale
0.27
30.29
40.26
40.26
20.36
60.32
30.33
90.30
7
Con
tinue
d
Tabl
e13
.4C
ontin
ued
Originated
Den
ied
HELO
Cor se
cond
Cas
h-
out
first
lien
Refi
nan
ceno
cash
Purc
has
em
ort-
gage
HELO
Cor se
cond
Cas
h-out
firstl
ien
Refi
nan
ceno
cash
Purc
has
em
ortg
age
Bor
rower
gende
r:single
male
0.18
60.20
10.17
80.14
60.28
90.31
90.27
30.21
4
Bor
rower
gende
r:jo
int
fem
alean
dm
ale
0.48
90.42
40.49
90.53
70.29
90.26
80.31
30.38
9
DTI<3
6%0.52
80.47
60.54
50.53
60.25
90.31
80.26
0.30
8DTI36
-41%
0.17
80.20
10.16
70.18
30.08
0.11
60.08
70.10
6DTI>4
1%0.29
40.32
30.28
80.28
10.66
0.56
60.65
30.58
6In
com
eus
edfo
run
derw
riting
85.339
95.983
81.46
172.57
863
.702
57.666
58.215
65.481
Cen
sustrac
t%
min
ority
24.953
30.44
24.762
22.963
37.041
35.772
33.29
24.814
MSA
med
ian
fam
ilyin
com
e76
,359
75,855
76,507
73,423
75,945
73,784
77,235
66,359
Cen
sustrac
tin
com
eto
MSA
inco
me
%
118.7
114.5
118.2
121.3
110.9
107.6
113.2
105.7
Obs
erva
tion
s10
6,01
684
,555
93,595
46,277
66,973
29,539
30,927
2,86
9
Sour
ce:A
uthor
s’ca
lcul
atio
nsfrom
2018
HM
DA
data.
The Market for Reverse Mortgages among Older Americans 289
What about older borrowers with an existing mortgage?In other work, Moulton and Haurin (2019) examined the potential size ofthe HECM market among older Americans with a mortgage. They foundthat in 2016, at least half of existing older homeowners with a mortgagewould have been able to take out an HECM: at least five million house-holds in total. This much larger group was still making mortgage payments,although only a minority appeared to have a DTI as high as the newmortgage borrowers in our sample above.
Why Older People Do Not Use ReverseMortgagesThe large proportion of older adults for whom home equity is their pri-mary source of wealth, combined with growing levels of consumer andmortgage debt held by older adults—and resulting increases in their DTIburden—presents a puzzle: why do older adults in the US not turn toreverse mortgages more often? In this section, we consider several reasonswhy this may be the case, including why people may be reluctant to spenddown home equity generally in retirement as well as reasons specific to theinstitutional features of the American reverse mortgage market.
Reluctance to consume home equity in retirementIt is well-established that people tend to not spend down their wealthin retirement as would be predicted by a simple life cycle hypothesis(Modigliani and Brumberg 1954; De Nardi, French, and Jones 2010, 2016;Lockwood 2018). Housing wealth is no exception, and in fact it tendsto be the last asset consumed, typically only near the end of life follow-ing a major health event or the death of a spouse (Venti and Wise 1990,2004; Poterba et al. 2011, 2017; Mayer 2017; Englehardt and Eriksen 2019).Financial wealth is more liquid and accessible than housing wealth, with-out the transaction costs of selling the home or taking out a loan. Thereare also numerous financial and tax incentives to spend down financialwealth before housing wealth, including housing wealth being treatedmorefavorably by tax policy when left as a bequest.
The economics literature generally suggests two interrelated reasons forholding on to wealth in retirement: (1) precautionary savings for uncer-tain health costs, including long-term care; and (2) Importantly, thesemotivations do not necessarily preclude borrowing from home equity inretirement. For example, retaining home equity as precautionary savingsfor major health expenses suggests that homeowners anticipate beingable to liquidate home equity when a health shock occurs. Nevertheless,

290 New Models for Managing Longevity Risk
such motivations may help explain the timing and nature of home equityconsumption in retirement.
Health costs in retirement can be considerable. While the majority ofolder adults receive Medicare, nearly 20 percent of health expendituresare paid for as out-of-pocket costs (De Nardi, French, Jones, and McCauley2016). Recent estimates indicate that the average 65-year-old man or wom-an needs $72,000 or $93,000 (respectively) to have a 50 percent chance ofbeing able to cover necessary health expenses in retirement; for those whoexperience major health shocks, this could exceed $350,000 (Fronstin andVanDerhei 2017). Further, more than half of older adults will require long-term care in a nursing home or at home prior to death (Favreault and Dey2015;Hurd et al. 2013, with average lifetime costs of $133,700 in 2015 dollars(Favreault and Dey 2015).
Despite these risks, few households purchase long-term care insurance;instead viewing home equity as a precautionary saving to cover such costsif they do arise (Costa-Font et al. 2018; Davidoff 2010). Indeed, evidenceindicates that home equity is one of the main resources used to pay forlong-term care in the US (Costa-Font et al. 2018), with Medicaid coveringcosts for 60 percent of nursing home residents (Borella et al. 2018). Medi-caid policy further incentivizes older homeowners to hold assets in the formof home equity rather than as liquid wealth. To qualify for Medicaid, house-holds must spend down their financial assets to a minimum set by states,typically around $2,000, but home equity is typically exempt from eligibilitythresholds (Ricks 2018). Therefore, older adults with a high probability ofneeding long-term care (and potentially having to rely on Medicaid to payfor such services) may have a strategic incentive to spend down or trans-fer financial wealth, and to save remaining wealth in the form of homeequity.
In line with a precautionary savings motive, recent studies document adecline in home equity after a health shock (Gilligan et al. 2018; Guptaet al. 2018; Poterba et al. 2018), with home equity being second only toformal health insurance for financing health-related consumption after ahealth shock in later life (Dalton and LaFave 2017). The ability to accesshome equity is also linked to better health outcomes. In an analysis of cancerpatients, Gupta et al. (2018) found that cancer patients who borrowed fromtheir home equity were 23 percent were more likely to perform necessarytreatments and had lower rates of mortality than those who did not borrowfrom home equity.
In addition, a desire to leave a bequest to heirs may prevent spendingfrom home equity in retirement; in fact, this need not be a separatemotivation and can actually reinforce precautionary savings. For example,adults who intend to leave a bequest but are uncertain of their future healthrisks may prefer to self-insure through precautionary savings rather than
The Market for Reverse Mortgages among Older Americans 291
purchase long-term care insurance or spend down their financial assets toqualify for Medicaid (Lockwood 2018).
Whether intended or unintended, a large proportion of older adultsdo leave home equity to their heirs when they die: bequests from homeequity totaled an estimated $90 to $100 billion per year from 1992 to 2014(Englehardt and Erikson 2019). Several economists have estimated struc-tural models to parse out the importance of an intentional bequest motive,relative to other factors that might lead older adults to retain wealth inretirement (De Nardi, French, and Jones 2010, 2016; Ameriks et al. 2011;De Nardi, French, Jones, and McCauley 2016; Lockwood 2018; Nakajimaand Telyukova 2020). These models generally indicate that, while bequestsare certainly an important factor in explaining wealth holding, they do notexplain everything. For instance, Nakajima and Telyukova (2020) estimatedthat bequest motives explained about 7 to 28 percent of median net worthin retirement, depending on the individual’s age—well below the amountof home equity left to heirs at death.
Structural models estimating demand for reverse mortgages predicthigher home equity use for those with weaker bequest motives, elders whohave low levels of financial wealth relative to housing wealth, and for thosewith relatively high levels of pre-existing debt (Nakajima and Telyukova2017; Cocco and Lopes 2019). Health expenditures are complicated: onthe one hand, those with high uncertainty regarding future health costsare predicted to retain home equity as precautionary savings. On the oth-er hand, those with high health expenditures due to underlying healthconditions or the onset of a health shockmay have a higher demand for bor-rowing through a reverse mortgage to help pay for health-related expenses(Nakajima and Telyukova 2017).
Despite a general tendency to hold more wealth than would be predictedfollowing a life cycle model, as demonstrated above, older adults can anddo extract equity in retirement—they just more commonly use other debtinstruments rather than reverse mortgages to do so. As we discussed earlier,this is not the case in some countries like the UK or Canada, where equityrelease products are much more widely used by older borrowers. Further-more, these countries saw sharp rises in the use of equity release through2019, a pattern similar to the large growth of reverse mortgages in the USthrough 2009; nevertheless, the growth in Canada and theUK occurred dur-ing an economic boom, versus during a downturn in the US. The uneveneconomic pattern combined with sharp increases and decreases in equi-ty release usage over a few years is inconsistent with a bequest motive orprecautionary savings as the main explanation for why US retirees do notchoose equity release more often. This raises questions about the institu-tional features of reverse mortgages and the market in the US that may beimpeding their use.
292 New Models for Managing Longevity Risk
Institutional features of reverse mortgages in the USOne longstanding claim is that high costs limit demand for reverse mort-gages; in particular, there are substantial costs associated with taking outthese loans (Lucas 2015; Nakajima and Telyukova 2017). Traditional reversemortgages do carry up-front costs that are larger than up-front costs associat-ed with other home equity borrowing options. For HECMs, this is primarilydue to the up-front MIP charged by HUD, which is currently set at 2 percentof the value of the home.19 Yet it is not clear that the MIP is excessive, orthat it is driving down demand for HECMs.
In an analysis of reverse mortgage costs, Davidoff (2012) found that theability of a borrower to walk away from negative equity (the ‘put option’embedded in the HECM) was worth more than the cost of the mortgageinsurance, if borrowers used the product to the maximum. It could bethat borrowers do not value the embedded put option, as they typicallydo not extract all remaining equity and default on the loan when houseprices fall (Davidoff and Wetzel 2014). If this were the case, then one wouldexpect demand to rise if the MIP were reduced or eliminated. Yet from 2010through 2013, there was little demand for a ‘Saver’ version of the HECMproduct with a negligible up-front MIP. This does not imply that high up-front costs might not be part of the equation for low demand, but it certainlydoes not seem to be the driving factor. In a survey of older homeowners whoconsidered but did not originate a reverse mortgage, 26 percent indicatedhigh costs being a factor behind their decision: the same proportion thatindicated a desire to leave their home as a bequest as a reason for not takinga reverse mortgage (Moulton et al. 2017).
Another possibility is that the interest rate charged to borrowers is toohigh, with the spread between the cost of credit to the lender rangingbetween one and three percent (Lucas 2015). But as noted in the previoussection, interest rates on reverse mortgages, including the ongoing MIP,were quite similar to those on other more commonly used traditional mort-gage products, including HELOCs, cash-out or straight refinancings, andpurchase mortgages. Also, borrowers in traditional mortgages paid closingcosts that ranged from zero (HELOC) to two percent (cash-out refinanc-ing) of total proceeds. Reverse mortgage origination costs are much higher,especially because they include an up-front MIP charged by the FHA equalto two percent of the MCA (home value) plus an origination fee that iscapped at $2,500 to $6,000, depending on home value.
To do an apples-to-apples comparison of the impact of higher up-frontcharges on the total cost of the mortgage, we added the up-front cost to themortgage balance and then computed the increase in the imputed inter-est rate required to pay those costs over the life of the loan (assumed to be12 years). A similar calculation is often presented to borrowers at closing,called the TALC (total annual loan cost). While HMDA does not report
The Market for Reverse Mortgages among Older Americans 293
the actual value of the closing costs and the origination fee charged, weran two scenarios, one with a higher rate (4.75%) plus maximum chargesfor the origination fee, and a second scenario with a lower rate (3.0%)and no origination fee. In both cases, the mortgage borrower would alsopay a 0.5 percent annual MIP. In the case of the high-rate loan, the costincreased from 5.3 to 6.6 percent, an increase of 1.3 percentage points. Forthe low-cost loan, the rate increased from about 3.5 to 4.1 percent, about0.6 percentage points per year.
By comparison, in the UK, where in 2019 equity release mortgages rep-resented about 36 percent of total mortgage originations for borrowers age55+, the quoted mortgage rate was 5.21 percent versus a rate of 2.66 per-cent on a 75 percent LTV 10-year fixed rate mortgage, an annual spread ofalmost 2.6 percent (before considering any difference in origination costsfor an equity release mortgage). From 2017 to 2019, that spread was nearlyconstant, even as the equity release market grew 32 percent. So higher costsof equity release, at least in the UK, were not an appreciable impairment tomuch faster growth than in the US.
Aside from the costs of reverse mortgages, other barriers to demandinclude lack of accurate information about how reverse mortgages work,combined with generally negative product perceptions. In a survey of a ran-dom sample of older adults in the US population, Davidoff et al. (2017)found older adults were generally aware of reverse mortgages but had inac-curate information about how they worked. For example, only 56 percentanswered correctly that the borrower can stay in the home if the loanbalance exceeds the value of the home. Their results also indicated a signif-icant and positive relationship between having accurate knowledge of theproduct and the stated intention to use a reverse mortgage in the future.
According to a Fannie Mae National Housing Survey (2016), 49 per-cent of homeowners age 55+ were familiar with reverse mortgages, andonly six percent of homeowners indicated preferring reverse mortgages toextract equity. Twenty percent of the homeowners who were familiar withreverse mortgages reported that the risk of being scammed was their biggestconcern about reverse mortgages.
Further, lending to an aging population where death is often the waythat the mortgage resolves, creates the potential for headline risk, exac-erbating negative public perceptions and discouraging larger institutionalactors from participating in the market. A 2018 industry survey of lendinginstitutions indicated that reputational risk was the leading reason that cer-tain banks did not originate reverse mortgages (Cameron 2018). Headlinerisks can be lowered by reducing the threat of evicting a borrower whilealive, such as for failure to pay property taxes (preventative servicing),maintaining good communication with heirs, etc.
Of course, there is also one other appreciable common factor in the UKgrowth after 2012 and in the US up to 2011: the impact of large brand
294 New Models for Managing Longevity Risk
name financial institutions selling reverse mortgages. In the US, during thegrowth and in peak years, banks such as Wells Fargo, Bank of America, andBNY Mellon, as well as the insurance company MetLife, were in the reversemortgage business. In the UK, large, brand name insurers and asset man-agers such as Aviva, Legal and General, and Canada Life, sell equity releaseproducts. In addition, in the UK, financial planners may also sell (and earncommissions from) reverse mortgages as long as they have an appropriatelicense, which American financial planners almost never obtain. In the US,the exit from themarket of brand name financial services firms was followedby an appreciable decline in originations of the HECM product.
ConclusionThis chapter has examined the usage of reversemortgages amongmortgageborrowers age 62+, as well as looking at reasons for applicants, of the sameage, being rejected for new mortgage credit. We find that 17 to 27 percentof actual and rejected borrowers would likely have qualified for an HECM,depending on the interest rate and closing costs. This group of 301,000 to460,000 borrowers is nine to 14 times the size of the actual HECM market.These potential borrowers chose another product (or were rejected fromtheir preferred product) despite having very high DTI ratios of 36 to morethan 50 percent in the case of half or more of the sample. Among seniorswith an existing mortgage, at least five million could have used a reversemortgage to eliminate mortgage payments.
The existence of a large number of seniors with an existing mortgage ortaking out new mortgages with quite high LTVs (an average of 55 to 78%combined LTV, depending on the product) suggests that many seniors do,in fact, utilize home equity in order to fund their retirement. However, theychoose products that requiremonthly payments that last decades into retire-ment and rise as a share of (falling) income as they get older. Of course, thepuzzle remains for home equity as for other savings, as to why seniors enterretirement with fewer assets than the life cycle model would predict andspend less in retirement than the model implies would be optimal.
We consider a number of possible explanations for why American seniorsdo not use reverse mortgages to spend home equity and instead relyon loans with high required monthly payments, reasons which includeprecautionary savings for health shocks, bequest motives, high costs ofreverse mortgages, and the lack of brand name institutions in the reversemortgage business. We show that equity release products have exhibitedenormous growth in the last decade in Canada and the UK, the latter ofwhich has an active market that includes large insurance companies. In theUS, the reverse mortgage market hit its peak at a time when brand namefinancial institutions sold the product to the public. Thus, it appears thatinstitutional barriers that discourage entry by brand name companies may

The Market for Reverse Mortgages among Older Americans 295
be an important factor limiting the distribution of reverse mortgages inthe US.
Of course, this then raises the question as to why these companies do notenter the reverse mortgage business. One possibility is the negative repu-tation of reverse mortgages, which may discourage companies sensitive totheir brands. Policies by the US government in the HECM program thatrequire foreclosures as a way to resolve the failure to pay T&I suggest thepotential for appreciable headline risk. By comparison, in the UK, foreclo-sures to resolve T&I defaults are nearly non-existent. In the US, regulationalso restricts financial planners or insurers from selling reverse mortgageswithout obtaining a mortgage origination license. Such licensing is timeconsuming, expensive, and has potential legal risks associated with cross-selling different products. In the future, the continued rise of fee-basedplanners who are paid for advice rather than product sales could spur plan-ners to consider home equity as part of the planning process. Finally, theadoption of a fiduciary or ‘best interest’ standard might also move plannersto consider housing in the planning process.
AcknowledgementsMayer is also CEO of Longbridge Financial, a reverse mortgage lender. Theauthors wish to thank Michael McCully for helpful comments and data.
Endnotes1. See, for example, Goodman et al. (2017); Lusardi et al. (2017, 2020); Mayer
(2017); and Brown et al. (2020).2. Authors’ calculations using the 1992–2016 Survey of Consumer Finances in 2016
dollars (Goodman et al. 2017).3. See Goodman et al. (2017) and Haurin et al. (2019).4. In one survey (EBRI 2019), eight in 10 workers reported that they expect-
ed to work in retirement, but only 28 percent of retirees actually work forpay.
5. While we do not have formal data, equity release issuance in Australia hasdeclined in recent years as some larger banks exited the market. Germany, Ire-land, Italy, Portugal, and Spain have small markets with fewer than five lenders.Norway has between five and 10 lenders (EY 2020).
6. We report some data on private-label reverse mortgages in the empirical workthat follows for 2018.
7. The MCA is subject to a cap, which was $679,650 in 2018, but lower in previousyears.
8. Data on the UK from Equity Release Council, 2018 and 2019 market reports.9. Approximately 600,000 HECMs are outstanding today out of a pool of approx-
imately 26 million elderly homeowners age 65+. Factoring in those age 62–64probably lowers the number by about 10 percent.
296 New Models for Managing Longevity Risk
10. These new reporting requirements were added by the Consumer Financial Pro-tection Bureau through a 2015HMDA rule that amended Regulation C (HMDA’simplementing legislation). The new reporting requirements first went into effectwith the 2018 HMDA data release. Not all lenders are required to report underHMDA, with exemptions for smaller institutions and those originating a smallnumber of loans in the prior two years (CFPB 2019).
11. A small number of proprietary reverse mortgages are offered to borrowers age60+, but these private-label products were quite rare in 2018 and available in onlya handful of states.
12. An estimated eight percent of all homes in 2019 according authors calculationsusing data from Zillow.
13. While the FHA data indicate that 41,690 HECM loans were endorsed by HUDin 2018, the number originated in 2018 is smaller (endorsements typically occurone to two months after closing). Based on a one-month lag between loan closingand endorsement, we estimate that about 37,000 HECM loans closed during the2018 calendar year. The 2018 HMDA data thus represents about 85 percent ofHECM loans closed.
14. To correct for HMDA reporting errors, we merged in the PLF from HUD datausing the borrower’s age and interest rate in HMDA. If the lender reported loanamount (property value or loan limit) was 0.1 percentage points smaller or largerthan the PLF, we replaced the lender reported loan amount with an estimatedIPL using the HUD PLF. This resulted in the replacement of about 26 percentof reported HECM loan amounts in the 2018 HMDA data. Most of the replacedloan amounts were much smaller than the IPL, and likely reflected misreportingof the loan amount as the initial draw amount rather than the IPL.
15. This is called a Life Expectancy Set Aside (LESA) and is used by between five and10 percent of HECM borrowers.
16. HUD sets the maximum lender origination fee to be two percent of the first$200,000 of property value or $2,500 (whichever is greater), plus one percentof additional property value above $200,000, with a maximum of $6,000.
17. Closing costs vary widely by state and mortgage amount and can be higher instates with a mortgage recording tax, for example, in Florida.
18. The characteristics are quite similar for those who would have qualified at the 3and 4.75 percent rate groups, so we presented the former group to economizeon tables. Results are available for the 4.75 percent group upon request.
19. The lender origination fee of $2,500 to $6,000 is another potential up-front cost.However, this is negotiable, and can be reduced or eliminated depending on themarket and the circumstances of the borrower.
ReferencesAmeriks, J., A. Caplin, S. Laufer, and S. Van Nieuwerburgh. (2011). ‘The Joy of Giv-
ing or Assisted Living? Using Strategic Surveys to Separate Public Care Aversionfrom Bequest Motives,’ Journal of Finance, 66: 519–561.
Begley, J. and S. Chan (2019). ‘Understanding Older Adult Mobility Decisions: TheRole of Children,’ Working Paper. New York, NY: NYU Furman Center for RealEstate and Urban Policy.
The Market for Reverse Mortgages among Older Americans 297
Binette, J. and K. Vasold (2018). Home and Community Preferences: A National Sur-vey of Adults Age 18-Plus. Washington, DC: AARP. August: https://doi.org/10.26419/res.00231.001
Borella, M., M. De Nardi, and E. French (2018). ‘Who Receives Medicaid in OldAge? Rules and Reality,’ Fiscal Studies, 39(1): 65–93.
Brown,M., D. Lee, J. Scally, andW. van der Klaauw (2020). ‘TheGraying of AmericanDebt,’ in O. S. Mitchell and A. Lusardi, eds., Remaking Retirement: Debt in an AgingEconomy. Oxford: Oxford University Press, pp. 35–59.
Cameron, J. (2018). ‘Moving Forward in Reverse,’ Stratmor Group Insight Report,February. https://www.stratmorgroup.com/insights_article/moving-forward-in-reverse/
CFPB (Consumer Financial Protection Bureau) (2019). ‘Introducing New andRevised Data Points in HMDA,’ OIG, Washington, DC, August 30.https://www.consumerfinance.gov/data-research/research-reports/introducing-new-revised-data-points-hmda/
Cocco, J. F. and P. Lopes (2019). ‘Aging in Place, HousingMaintenance, and ReverseMortgages,’ The Review of Economic Studies, 87(4): 1799–1836. https://doi.org/10.1093/restud/rdz047
Costa-Font, J., R. G. Frank, and K. Swartz (2018). ‘Access to Long Term Care aftera Wealth Shock: Evidence from the Housing Bubble and Burst,’ NBER WorkingPaper No. 23781. Cambridge, MA: National Bureau of Economic Research.
Dalton, M. and D. LaFave (2017). ‘Mitigating the Consequences of a HealthCondition: The Role of Intra-and Interhousehold Assistance,’ Journal of HealthEconomics, 53: 38–52.
Davidoff, T. (2010). ‘Home Equity Commitment and Long-term Care InsuranceDemand,’ Journal of Public Economics, 94(1): 44–49.
Davidoff, T. (2012). ‘Can ‘High Costs’ Justify Weak Demand for the HomeEquity Conversion Mortgage?’ The Review of Financial Studies, 28(8):2364-98.
Davidoff, T., P. Gerhard, and T. Post (2017). ‘Reverse Mortgages: What Homeowners(Don’t) Know and How it Matters,’ Journal of Economic Behavior and Organization,133: 151–171.
Davidoff, T. and J. Wetzel (2014). ‘Do Reverse Mortgage Borrowers Use Credit Ruth-lessly?’ University of British Columbia Working Paper (July 22). https://papers.ssrn.com/sol3/papers.cfm?abstract_id=2279930
De Nardi, M., E. French, and J. B. Jones (2010). ‘Why Do the Elderly Save? The Roleof Medical Expenses,’ Journal of Political Economy, 118: 38–75.
De Nardi, M., E. French, and J.B. Jones (2016). ‘Savings after Retirement: A Survey,’Annual Review of Economics, 8: 177–204.
De Nardi, M., E. French, J.B. Jones, and J. McCauley. (2016). ‘Medical Spending ofthe US Elderly,’ Fiscal Studies, 37(3–4): 717–747.
EBRI (Employee Benefit Research Institute) (2019). 2019 Retirement ConfidenceSurvey Summary Report. Washington, DC: EBRI.
Englehardt, G. and M. Eriksen (2019). ‘Homeownership in Old Age and at the Endof Life,’ Presented at the Symposium for Housing Tenure and Financial Secu-rity, Fannie Mae and the Joint Center for Housing Studies, Harvard University,Cambridge, MA, March.

298 New Models for Managing Longevity Risk
EY (Ernst & Young Global Limited) (2020). 2020 Global Equity Release RoundtableSurvey. London: Ernst & Young Global Limited.
Fannie Mae (2016). ‘Older Homeowners: Accessing Home Equity in Retirement,’National Housing Survey, Topic Analysis, Q2. http://www.fanniemae.com/resources/file/research/housingsurvey/pdf/Q2-2016-accessing-home-equity-in-retirement.pdf
Favreault, M. and J. Dey (2015). ‘Long-Term Services and Supports for Older Amer-icans: Risks and Financing Research Brief, Office of the Assistant Secretary forPlanning and Evaluation, US Department of Health and Human Services, Wash-ington, DC. https://aspe.hhs.gov/basic-report/ong-term-services-and-supports-older-americans-risksand-financing-research-brief
Fisher, J. D. (2019). ‘Who Files for Personal Bankruptcy in the United States?’ TheJournal of Consumer Affairs, 53(4): 2003-26.
Fronstin, P. and J. Van Derhei (2017). ‘Savings Medicare Beneficiaries Need forHealth Expenses: Some Couples Could Need as Much as $350,000,’ EBRI Notes,38: 1
Gilligan, A. M., D. S. Alberts, D. J. Roe, and G. H. Skrepnek (2018). ‘Death orDebt? National Estimates of Financial Toxicity in Persons with Newly-diagnosedCancer,’ The American Journal of Medicine, 131(10): 1187–1195.
Goodman, L., K. Kaul, and J. Zhu (2017). ‘What the 2016 Survey of ConsumerFinances Tells Us about Senior Homeowners,’ Urban Institute Research Report,November. https://www.urban.org/sites/default/files/publication/94526/what-the-2016-survey-of-consumer-finances-tells-us-about-senior-homeowners.pdf
Goodman, L. and C. Mayer (2018). ‘Homeownership and the American Dream,’Journal of Economic Perspectives, 32(1) Winter: 31–58.
Gupta, A., E. R. Morrison, C. R. Fedorenko, and S. D. Ramsey (2018). ‘Home EquityMitigates the Financial and Mortality Consequences of Health Shocks: Evidencefrom Cancer Diagnosis.’ Working Paper: New York University, Stern School ofBusiness.
Haurin, D., C. Loibl, and S. Moulton (2019). ‘Debt Stress and Mortgage Borrow-ing in Older Age: Implications for Economic Security in Retirement,’ WorkingPaper prepared for the Retirement Disability Research Consortium. Madison:University of Wisconsin.
Haurin, D. R. and S. Moulton (2017). ‘International Perspectives on Homeowner-ship and Home Equity Extraction by Senior Households,’ Ohio State UniversityWorking Paper, June 5: https://ssrn.com/abstract=2985917
Hurd, M., P.-C. Michaud, and S. Rohwedder (2013). ‘The Lifetime Risk of Nurs-ing Home Use.’ National Bureau of Economic Research. Microsoft Word - LifetimeNH_Hurd_Michaud_Rohwedder.docx (nber.org)
Li, W. and M. White (2020). ‘Financial Distress among the Elderly: BankruptcyReform and the Financial Crisis.’ In O. S. Mitchell and A. Lusardi, eds, RemakingRetirement: Debt in an Aging Economy. Oxford: OxfordUniversity Press, pp. 89–105.
Lockwood, L. M. (2018). ‘Incidental Bequests and the Choice to Self-insure Late-lifeRisks,’ American Economic Review, 108(9): 2513–2550.
Lucas, D. (2015). ‘Hacking Reverse Mortgages,’ MIT Center for Financial PolicyWorking Paper. Cambridge, MA: Massachusetts Institute of Technology. http://gcfp.mit.edu/wp-content/uploads/2013/08/ReverseMortgagesV10.pdf

The Market for Reverse Mortgages among Older Americans 299
Lusardi, A., O. S. Mitchell, and N. Oggero (2017). ‘Debt and Financial Vulnerabilityon the Verge of Retirement,’ NBER Working Paper No. w23664. Cambridge, MA:National Bureau of Economic Research.
Lusardi, A., O.S. Mitchell, and N. Oggero (2020). ‘Debt Close to Retirement and itsImplications for Retirement Wellbeing,’ in O. S. Mitchell and A. Lusardi, eds.,Remaking Retirement: Debt in an Aging Economy. Oxford: Oxford University Press,pp. 15–34.
Mayer, C. (2017). ‘Housing, Mortgages, and Retirement,’ in L. Fennell and B. Keys,eds., Evidence and Innovation in Housing Law and Policy. New York: CambridgeUniversity Press, pp. 203-30.
Modigliani, F. and R. H. Brumberg (1954). ‘Utility Analysis and the ConsumptionFunction: An Interpretation of Cross-section Data,’ Iin K. Kurihara, ed., Post-Keynesian Economics. New Brunswick, NJ: Rutgers University Press, pp. 388–436.
Moulton, S., S. Dodini, D. R. Haurin, and M. D. Schmeiser (2019). ‘Seniors’Home Equity Extraction: Credit Constraints and Borrowing Channels,’ OhioState University Working Paper, June 25. https://papers.ssrn.com/sol3/papers.cfm?abstract_id=2727204
Moulton, S. and D. Haurin (2019). ‘Unlocking Housing Wealth for Older Amer-icans: Strategies to Improve Reverse Mortgages,’ Brookings Economic Stud-ies Working Paper, October. https://www.brookings.edu/wp-content/uploads/2019/10/ES_20191016_MoultonHaurin_ReverseMortgages.pdf
Moulton, S., C. Loibl, and Haurin, D. (2017). ‘Reverse Mortgage Motivations andOutcomes: Insights from Survey Data.’ CityScape, 19(1), 73-98.
Nakajima, M. and I. A. Telyukova (2017). ‘Reverse Mortgage Loans: A QuantitativeAnalysis,’ The Journal of Finance, 72(2): 911–950.
Nakajima, M. and I. A. Telyukova (2020) ‘Home Equity in Retirement,’ InternationalEconomic Review, 61(2): 573-616.
NRMLA (National Reverse Mortgage Lenders Association) (2020). ‘SeniorHousing Wealth Reaches Record $7.23 Trillion,’ April 3. https://www.nrmlaonline.org/about/press-releases/senior-housing-wealth-reaches-record-7-23-trillion
Poterba, J. and S. Venti (2017). ‘Financial Well-being in Late Life: Understand-ing the Impact of Adverse Health Shocks and Spousal Deaths,’ Preparedfor the 19th Annual Joint Meeting of the Retirement Research Consortium,August 3–4. Washington, DC. http://crr.bc.edu/wp-content/uploads/2017/08/4a.-James-Poterba.pdf
Poterba, J., S. Venti, andD.Wise (2011). ‘TheComposition andDrawdown ofWealthin Retirement,’ Journal of Economic Perspectives, 25(4) Fall: 95–118.
Poterba, J., S. Venti, and D. Wise (2017). ‘What Determines End-of-life Assets: ARetrospective View,’ in D. Wise, ed., Insights in the Economics of Aging. Chicago, IL:University of Chicago Press, pp. 127–157.
Poterba, J., S. Venti, and D. Wise (2018). ‘Longitudinal Determinants of End-of-lifeWealth Inequality,’ Journal of Public Economics, 162: 78–88.
Rexrode, C. (2020). ‘Over 60 with Decades Left on the Mortgage: The New Retire-ment Math,’ Wall Street Journal, April 11. https://www.wsj.com/articles/over-60-with-decades-left-on-the-mortgage-the-new-retirement-math–11586556588

300 New Models for Managing Longevity Risk
Ricks, J. S. (2018). ‘Homeowner Behavior, Health Status, and Medicaid Payment Eli-gibility: Evidence from the Deficit Reduction Act of 2005.’ Journal of Policy Analysisand Management, 37(4) 732–54.
Venti, S. and D. Wise (1990). ‘But They Don’t Want to Reduce Housing Equity,’ inD. Wise, ed., Issues in the Economics of Aging. Chicago, IL: University of ChicagoPress, pp. 13–29.
Venti, S. and D.Wise (2004). ‘Aging andHousing Equity: Another Look,’ in D.Wise,ed., Perspectives on the Economics of Aging. Chicago. IL: University of Chicago Press,pp. 127–181.