multidimensional integration of absorbances: an approach to absolute analyte detection
TRANSCRIPT

Multidimensional integration of absorbances: An approach to absoluteanalyte detection1
Albert Kh. Gilmutdinova,*, James M. Harnlyb
aDepartment of Physics, Kazan State University, 18 Kremlevskaja St., Kazan, 420008, RussiabU.S. Department of Agriculture, Beltsville Human Nutrition Research Center, Food Composition Laboratory, Building 161, BARC-East,
Beltsville, MD 20705, USA
Received 12 January 1998; accepted 20 April 1998
Abstract
The problem of absolute analyte detection is considered in this paper. It is shown that integration in absorbance, not inintensity, is a pre-requisite for absolute detection in atomic absorption spectrometry. A design for an atomic absorptionspectrometer of the future is described which measures absorbance resolved in three key areas: wavelength, space and time.Intensity must be measured with sufficient temporal, spatial and spectral resolution to guarantee the accuracy of the computedabsorbance. Technically, such measurements can be made simultaneously with a continuum source, a high resolution echellespectrometer and a two dimensional solid-state array detector. All computed absorbances are fully background and stray lightcorrected. With such measurements, and a proper optical configuration, absolute analyte detection can become a reality and thepossibility of absolute analysis becomes more obtainable.q 1998 Published by Elsevier Science B.V. All rights reserved
Keywords:Atomic absorption spectrometry; Absolute analysis; Absolute detection; Spatial integration; Spectral integration;Continuum source; Array detector
1. Introduction
The vast majority of samples to be analyzed byatomic spectrometry are in the condensed state. Atthe same time, all versions of analytical spectrometry,emission, absorption, fluorescence and mass spectro-metry, can only detect free atoms, ions and moleculesthat are in the gas phase. Thus, an analyte initiallypresent in solution at a concentrationc must first betransferred into the gas phase via the vaporization/atomization process to produceN free atoms in theatomizer volume. The analyte atoms (or ions) are then
detected by their emission, absorption, fluorescence(or mass to charge ratio) resulting in an analyticalsignal, S. Thus, the general scheme of analyticalspectrometry can be presented in a simplified wayas follows:
c (liq) →volatilization and atomizationN (g) →detection
S
↑ calibration ↓(1)
The measured analytical signal,S, is usually related tothe unknown analyte concentration,c, via a calibra-tion procedure. Theoretically, there are no restrictionsfor performing absolute analysis (i.e. obtainingcdirectly from S without calibration) provided that allthe steps of signal formation are well understood and
Spectrochimica Acta Part B 53 (1998) 1003–1014
0584-8547/98/$19.00q 1998 Published by Elsevier Science B.V. All rights reservedPII S0584-8547(98)00146-3
* Corresponding author. Tel.: +7 8432 368635; Fax: +7 8432631134; e-mail: [email protected]
1 Published in honour of Prof. C.L. Chakrabarti.

can be described quantitatively (i.e., volatilization/ato-mization efficiency and detection efficiency are knownfor each element and matrix). The problem of quantifi-cation is dramatically simplified if 100% efficiency canbe achieved for each phase for all elements and matrices.
Atomic absorption spectrometry (AAS) detectsatoms (usually) in the ground state that are probedby a radiation beam filling the whole atomizervolume. In emission, fluorescence and mass spectro-metry, detection of gas phase analyte atoms or ionsrequires the additional steps of excitation and ioniza-tion. The analytical signal is generated by a smallfraction of the analyte population in a highly non-uniform excitation/ionization source. The small popu-lation of excited or ionized atoms is easily perturbedby atomizer conditions and the sample matrix. Withits dependence on ground-state atoms, AAS is thetechnique that potentially comes closest to the goalof absolute analysis. This goal was first formulatedby Walsh in his original paper [1] introducing analy-tical flame AAS, and has been re-examined severaltimes by L’vov [2–4] for graphite furnace atomization(GF-AAS). Progress in understanding the principlesof furnace atomization has resulted in development ofthe stabilized temperature platform furnace (STPF)concept [5,6] that has resulted in accuracy levels of25% based on the use of characteristic masses.
This paper, however, will show that the next majorstep, absolute detection, is now possible as a result ofrecent instrumental improvements. It will be shownthat all the components necessary for absolute GF-AAanalysis are available and the final step is their inte-gration into a multidimemsional AA spectrometer.Basic features of the instrument include a continuumsource, a high-resolution echelle spectrometer, a two-dimensional solid-state array detector, and an opticalconfiguration that passes collimated radiation fromthe source through the furnace. These features makeit possible to implement new concepts for spectral[7,8] and spatial integration [9,10]. Multidimensionalintegrated absorbances based on resolved intensitiesprovide the potential for absolute detection, a require-ment for absolute analysis.
2. Integrated detection
AAS is based on absorption of probing radiation
from a primary source by analyte atoms in the atomi-zer gas phase. GF-AAS uses a discrete volume ofsolution to produce a total ofN0 analyte atoms inthe gas phase. The analyte atoms are distributedwith respect to space (Fig. 1(a)) and time (Fig. 1(b))in the furnace and the absorption coefficient isdistributed with respect to wavelength (Fig. 1(c)).The major goal of analytical AAS is to detect all theanalyte atoms that are distributed non-uniformly withnumber densityn(x,y,z) over the atomizer volume,V:
N0 =�tend
V
�t0
n(x,y,z; t) dV dt: (2)
Fig. 1. Analyte atoms are distributed physically with respect to (a)time, and (b) space, and absorption coefficient is distributed withrespect to (c) wavelength.
1004 A.Kh. Gilmutdinov, J.M. Harnly/Spectrochimica Acta Part B 53 (1998) 1003–1014

A measure of the analyte amount in the gas phase isatomic absorbance,A. Obviously, the analyticallyideal situation would be if the measured absorbancewas dependent only on the number of analyte atoms:
A= f (N0): (3)
This would provide a basis for absolute analyte detec-tion. In this section, we first summarize absorbancedependencies in order to understand major limitationsof conventional AAS and, secondly, develop a newdefinition of absorbance that would be closest to idealrelationship defined by Eq. (3).
The process of radiation absorption has two distin-guishable parts – spectral and spatial [10]. Firstly, thespectral profile,J(l), emitted by the primary source,interacts with the absorption profile,k(l), of the ana-lyte atoms in the atomizer. Secondly, the probingradiation has a non-uniform intensity distribution,J(x,y), over the beam cross-section that is absorbedby an analyte,n(x,y,z), non-uniformly distributed inthe atomizer volume. All conventional AA spectro-meters use monochromators of medium resolutionthat allow only isolation of the absorption profileand detectors (photomultiplier tubes or singlephotodiodes) that spatially integrate all the incidentradiation. Radiant fluxes,F, measured by suchinstruments are spatially and spectrally integratedover the slit area,j, and spectral bandwidth of themonochromator:
F =�
j
�l
J(x, y,l) dj dl: (4)
Atomic absorbance,A, provided by such an instru-ment is the logarithm of the ratio of the incident radi-ant flux,F0, to the radiant flux,F, that is transmittedthrough the atomizer. Applying Beer–Lambert’s lawto express transmitted fluxF, one can obtain the fol-lowing expression for the absorbance recorded by aconventional AA spectrometer [9]:
A(t) = logF0
F(t)
� �
= log
�j
�l
J(x,y,l) dj dl�j
�l
J(x,y,l)exp� l
0(l,x, y, z, t)
� �dj dl
0BBB@1CCCA:
(5)
The atomic absorption coefficient,k(l; x,y,z,t),depends on the concentration of absorbing atoms inthe ground state,n(x,y,z,t), and the spectral profilefunction,S(l), of the absorption line [11]:
k(l; x, y,z, t) =8:82× 10−13 × l2mn(x, y,z, t)fS(l),
(6)
wherelm is the peak wavelength,f is the oscillatorstrength of the spectral transition. It follows from Eq.(5) that the absorbance recorded by a conventionalinstrument is dependent on three groups of factors:(1) the spectral characteristics of the analysis line(dependence ofJ andk on l); (2) the cross-sectionaldistribution of intensity in the incident beam,J(x,y);and (3) spatial distribution of the analyte within theatomizer (dependence ofk on x,y,z).
The situation is further complicated by the presenceof molecules or particles at concentrationN9 in theradiation path that absorb or attenuate radiation, andstray radiation that decreases the true absorbance.Thus, in conventional AAS the measured absorbance,A, depends not only on the number,N, of analyteatoms but also on the spectral features of the analyti-cal lines and the spatial distribution of analyte atomsand radiation intensity in the probing beam:
A= f (N; N9, spectral, spatial, stray): (7)
Eq. (7) is much more complex than the ideal relation-ship, Eq. (2), needed for absolute AA analysis. By theuse of additional devices (deuterium arc lamp or a mag-net for Zeeman splitting), conventional AAS providessuccessful means of background correction but thedependence of measured signal on the spectral and spa-tial features is inherent and cannot be avoided withoutsevere modifications in the method of analyte detection.
The key concept for approaching the ideal relation-ship of Eq. (2) is the measurement of transmittedintensities with spectral and spatial resolution. Indeed,considering a narrow probing beam of a lateral sizedx dy, for the radiant flux dF(x,y,t; l) transmittedthrough the part of the atomizer having coordinates(x,y) within a spectral interval (l, l + dl) one obtains:
dF(x,y, t; l) =Jtr(x,y, t; l) dx dy dl
=J(x,y; l) exp −cS(l)� l
0n(x, y,z, I ) dz
� �dx dy dl,
(8)
1005A.Kh. Gilmutdinov, J.M. Harnly/Spectrochimica Acta Part B 53 (1998) 1003–1014

wherec denotes a constant originating from Eq. (6).Based on this equation, one can introducespectrally, spatially and temporally resolved absor-banceA(x,y,t; l) defined by the following equation:
A(x,y, t; l) = logJ(x,y; l)
Jtr(x,y, t; l)
� �= (log e)cS(l)N(x,y, t), (9)
whereJtr is the radiant intensity transmitted throughthe part of the furnace having coordinates (x,y). Nowtaking into account that integral over the spectralprofile function is equal to unity for any absorptionprofile:�
lS(l) dl =1 (10)
one can introduced an ‘ideal’ absorbance:
Aideal=�
l
�j
�tA(x, y, t; l) dl dj dt
=c�
j
�tA(x,y, t) dj dt =cN0 (11)
that is proportional to the total number of analyteatoms irrespective of any spectral and spatial features.Thus, absorbance defined in this way coincides withEq. (2) stated for absolute analysis. The principledifference between this absorbance definition andthe conventional one is that here integration occursin the domain of absorbances obtained on the basisof spectrally and spatially resolved detection of trans-mitted intensities. Technical realization of such ameasurement and the means of background andstray radiation correction will be described in thesubsequent sections.
3. Spectral resolution
Conventional GF-AAS employs line sources, HCLsand EDLs, which emit line spectra of the element tobe analyzed. Modern versions of these sources arebright, stable and spectrally pure in the vicinity ofthe analysis line. However, the narrowness of theselines restricts the calibration range and variations intheir widths limit the reproducibility of the absor-bance measurements and restrict their applicability
to absolute detection. For HCLs and EDLs, the com-puted absorbance is dependent on the ratio of thewidth of the source emission line and the width ofthe absorption profile; the broader the emission linethe less the computed absorbance. The width of thesource emission line will vary with lamp design, oper-ating current, age, and manufacturer. Consequently,variations in characteristic masses as large as a factorof 2 have been reported for measurements in differentlaboratories with similar instruments and similarconditions [4].
Continuum sources offer radiation from below180 nm to over 800 nm, although the radiation inten-sity typically drops by a factor of 10 between 300 nmand 200 nm [12]. With respect to the spectral regionaround an absorption line (, 1 nm), however, a con-tinuum source provides a uniform intensity (J(l) =constant). Use of a continuum source with an arraydetector allows absorbances to be measured over theconvoluted absorption image (convolution of the trueabsorption profile and the rectangular entrance slitfunction) at the focal plane [7,8], as shown in Fig. 2.With a medium resolution monochromator, the con-voluted profile will primarily reflect the entrance slitfunction. With a high resolution echelle spectrometer,the convoluted profile will approach the true absorp-tion profile. Use of a two-dimensional array detectorwith an echelle spectrometer will allow intensities tobe measured at regular vertical intervals over andbetween the orders (Fig. 2).
Fig. 2 presents modeled data for a continuumsource and an echelle spectrometer which will beused to illustrate how stray light and background cor-rected absorbances are computed. The model repre-sents data collected with a two-dimensional arrayconsisting of 1232 pixels; 56 rows, or order segments,and 22 columns, or wavelength segments. The ridgerunning parallel to the wavelength axis is the trans-mitted intensity (I o = 1000) of the spectral order whichcontains the analyte absorption profile. The order issuperimposed on a continuum background arisingfrom far stray (I sl = 500 or 50% stray radiation). Thewidth of the order is dependent on the entrance slitheight and the width of the absorption profile isdependent on the resolution of the echelle. The levelof stray is exaggerated here to illustrate its effect onthe absorbance calculation.
Stray light corrected intensities,I x,y9, are computed
1006 A.Kh. Gilmutdinov, J.M. Harnly/Spectrochimica Acta Part B 53 (1998) 1003–1014
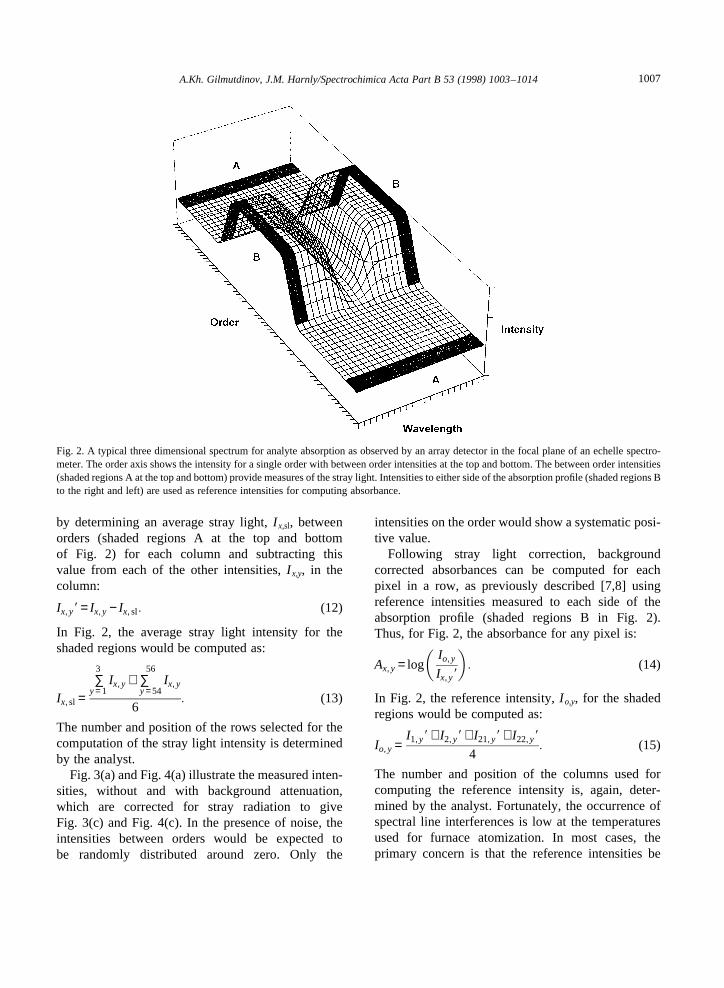
by determining an average stray light,I x,sl, betweenorders (shaded regions A at the top and bottomof Fig. 2) for each column and subtracting thisvalue from each of the other intensities,I x,y, in thecolumn:
Ix, y9 = Ix,y − Ix, sl: (12)
In Fig. 2, the average stray light intensity for theshaded regions would be computed as:
Ix, sl =∑3
y=1Ix,y + ∑
56
y=54Ix, y
6: (13)
The number and position of the rows selected for thecomputation of the stray light intensity is determinedby the analyst.
Fig. 3(a) and Fig. 4(a) illustrate the measured inten-sities, without and with background attenuation,which are corrected for stray radiation to giveFig. 3(c) and Fig. 4(c). In the presence of noise, theintensities between orders would be expected tobe randomly distributed around zero. Only the
intensities on the order would show a systematic posi-tive value.
Following stray light correction, backgroundcorrected absorbances can be computed for eachpixel in a row, as previously described [7,8] usingreference intensities measured to each side of theabsorption profile (shaded regions B in Fig. 2).Thus, for Fig. 2, the absorbance for any pixel is:
Ax, y = logIo, y
Ix,y9
� �: (14)
In Fig. 2, the reference intensity,I o,y, for the shadedregions would be computed as:
Io, y =I1,y9 + I2, y9 + I21,y9 + I22,y9
4: (15)
The number and position of the columns used forcomputing the reference intensity is, again, deter-mined by the analyst. Fortunately, the occurrence ofspectral line interferences is low at the temperaturesused for furnace atomization. In most cases, theprimary concern is that the reference intensities be
Fig. 2. A typical three dimensional spectrum for analyte absorption as observed by an array detector in the focal plane of an echelle spectro-meter. The order axis shows the intensity for a single order with between order intensities at the top and bottom. The between order intensities(shaded regions A at the top and bottom) provide measures of the stray light. Intensities to either side of the absorption profile (shaded regions Bto the right and left) are used as reference intensities for computing absorbance.
1007A.Kh. Gilmutdinov, J.M. Harnly/Spectrochimica Acta Part B 53 (1998) 1003–1014

measured far enough from the line center to permitextended calibration. Usually, this is a distancegreater than 10 times the spectral width of theentrance slit image (10ls).
The stray radiation and background correctedabsorbances obtained using Eqs. (5)–(8) are shownin Fig. 3(d) and Fig. 4(d). It can be seen that 50%attenuation of the source intensity in Fig. 4 does notchange the computed absorbance. This illustrates theinherent background correction for the computation ofabsorbance using intensities to either side of theabsorption profile, thus removing the influence ofthe source intensity. In principle, absorbance is depen-dent only on the number of analyte atoms in the lightpath. Barring saturation of the transition by an intenselaser source, the analyte atoms will absorb a constant
fraction of the incident radiation. A difference inabsorbance as a function of background is observedonly if there is no correction for stray light (Fig. 3(b)and Fig. 4(b)).
Wavelength integrated absorbance,Al,y, for anyrow, y, in Fig. 4 is defined as:
Al,y =lp ∑20
x=3Al, y, (16)
wherelp is the normalization constant equal to thespectral width of a pixel. In this example, the wave-length interval,x = 3 to 20, specifies all the pixels inthe row not used as reference pixels. Obviously, thebest signal-to-noise ratio will be obtained using thefewest pixels necessary to cover the absorptionprofile.
Fig. 3. Intensity (a) and computed absorbance (b) for an analyte absorbance of 1.0 with a source intensity of 1000 and 50% stray light (500).Intensity (c) and computed absorbance (d) after correction for stray light.
1008 A.Kh. Gilmutdinov, J.M. Harnly/Spectrochimica Acta Part B 53 (1998) 1003–1014

The effect of ‘frequency’ of pixels, i.e., the numberof pixels per spectral unit (in terms of the half width ofthe absorption profile) on the measured absorbance isconsidered in Fig. 5. It can be seen that if only themaximum absorbance is determined, then a high fre-quency of pixels (at least 20 per half width of theabsorption profile) is necessary to obtain a valuewithin 5% of the true value. If absorbances aresummed, then a much lower frequency of pixels isnecessary. Fig. 5 shows that the pixel width canequal the half width of the absorption profile andstill provide integrated values close to 100% of thetrue value. For an echelle spectrometer, the resolutionis approximately equal to the half width of the absorp-tion profile. As a result, the halfwidth of the image atthe exit plane will be slightly greater than the width ofthe entrance slit. Consequently, for the computation of
wavelength integrated absorbance (Eq. (16)), the pixelwidth should be equal to or less than the entrance slitwidth.
Wavelength and height integrated absorbance,Al,h,is defined as:
Al,h =hp ∑37
y=16lp ∑
20
x=3Ax,y, (17)
wherehp is the pixel height inmm. In this example, theheight interval,y = 16 to 37, specifies only the rowsfound on the order, i.e., pixels which are non-zeroafter stray light correction. This represents the normalcase, since absorbances computed for pixels betweenorders will be undefined if the corrected intensity isless than or equal to zero.
Absorbances measured with a continuum sourceare independent of the spectral features of the source
Fig. 4. Same as Fig. 3 except the source intensity has been attenuated 50% by non-specific background absorption.
1009A.Kh. Gilmutdinov, J.M. Harnly/Spectrochimica Acta Part B 53 (1998) 1003–1014

and dependent only on the spectral features of theabsorption profile. Summation of the absorbancesover the width and height of the absorption profileand normalization by the spectral width and heightof a pixel provides an integrated absorbance whichis theoretically dependent only on the number of ana-lyte atoms in the radiation path. The integrated absor-bance is not affected by the source intensity, theresolution of the spectrometer, the width or heightof the pixel, or the splitting, broadening, or shiftingof the absorption profile. Integrated absorbance with acontinuum source is a more fundamental value thanthat obtainable with an HCL [8].
Historically, the major drawback associated withcontinuum source AAS was the poor detection limitsbelow 280 nm due to the decreased intensity of thesource and reduced transmission efficiency of theechelle in the far UV [12]. With improved echelletransmission efficiency in the UV and with the useof solid-state detectors which provide enhanced
quantum efficiency in the UV and a multiplex advan-tage, detection limits have been achieved that areequivalent to or better than those for line source GF-AAS [8,13].
4. Spatial resolution
Cross-sectional (height and width, see Fig. 1(a))variations in intensities transmitted through the fur-nace are the result of uneven distribution of intensitiesfrom the source beam and uneven distribution ofatoms (with respect to height and width) in the furnace[9,10]. This uneven distribution of analyte atoms cangive rise to a non-linear relationship between concen-tration and absorbance. A linear relationship betweenconcentration and absorbance can be maintained bydetecting intensities at regular intervals across theheight and width of the transmitted image and com-puting separate absorbances. There will also be a sig-nificant variation in the longitudinal distribution ofanalyte atoms (Fig. 1(a)), but this will not produce anon-linearity.
Conventional GF-AAS (Fig. 6(a)) uses an opticalsystem that focuses the image of the primary sourceinto the center of the furnace and then focuses theimage of the source and the furnace onto the entranceslit of the spectral device. The monochromator opticsform a set of monochrome images of the entrance slitonto the focal plane at the wavelengths present in theprimary source. Thus, the horizontal axis of the spec-trometer presents intensity as a function of wave-length. The height of the image at the focal plane isequal to the height of the entrance slit but anypossibility of obtaining spatial information is lostwith the use of a single detector (a photomultipliertube) which integrates all the intensities passingthrough the exit slit.
Proper design of the optical system, in combinationwith an appropriate wavelength selection device and atwo-dimensional array detector, will allow intensitiesto be measured across the height and width of thefurnace [9,10]. The optical system must collimatethe source radiation (Fig. 6(b) and (c)), pass it throughthe furnace, and direct it onto a two-dimensional arraydetector. If a narrow bandwidth filter is insertedbetween the furnace and the detector, the image ofthe furnace will appear on the detector and the vertical
Fig. 5. Relative peak absorbance (l) and integrated absorbance (X)as a function of the ratio of the pixel width to the half with of theimage of the absorption profile (a convolution of the entrance slitfunction and the absorption profile).
1010 A.Kh. Gilmutdinov, J.M. Harnly/Spectrochimica Acta Part B 53 (1998) 1003–1014

axis of the detector will view intensities as a functionof height in the furnace and the horizontal axis willview intensities as a function of width. This technique,called shadow spectral filming, has been employed byGilmutdinov et al. [9,10] to measure the spatial dis-tribution of intensities and absorbance in the furnace.The spatial resolution of the measurements will bedetermined by the size of the image and the pixels.
If a spectrometer is inserted between the furnaceand the two-dimensional array detector, the verticalaxis of the detector will view intensities as a functionof height in the furnace and the horizontal axis willview intensity as a function of wavelength. Thus, hor-izontal resolution is sacrificed for spectral resolution.The vertical resolution is determined by the entranceslit and pixel heights and the spectral resolution isdetermined by the reciprocal linear dispersion of thespectrometer and the width of the pixels. Thisapproach is much more practical for routine operation.It offers better spectral isolation than the narrow band-width filter while still offering vertical resolution ofintensities. Experimentally, it has been shown that thelargest variations in analyte distribution occur verti-cally and are asymmetrical because of the dosing hole[9,10]. Horizontal variations are symmetrical andshow much less variation.
Combination of the optical design in Fig. 6(c) witha continuum source, a high-resolution echelle spectro-meter, and a two-dimensional array detector will pro-duce the image shown in Fig. 2 at the exit plane. Now,the intensities on the order axis correspond to thetransmitted intensities as a function of height in thefurnace. If the pixel height for the modeled data inFig. 2 is 25mm, then the entrance slit is approximately500mm tall (pixels 16 to 37). If the image of thefurnace is properly focused onto the entrance slit ofthe echelle, then the vertical order intensities alsocorrespond to the vertical intensities from the 6 mmtall furnace. Each pixel measures intensity fromapproximately a 0.3 mm (6 mm/22) section of the fur-nace. Summation of absorbances over the order, asdescribed in Eq. (10), corresponds to vertical integra-tion over the transmitted furnace image.
The effect of the ‘frequency’ of pixels, i.e., thenumber of pixels used to cover the furnace height,on the relative absorbance is addressed in Fig. 7. Itcan be seen that relative absorbance decreases as thenumber of pixels used decreases. In addition, the rela-tive absorbance decreases as the drop in absorbanceacross the furnace height increases. This data suggeststhat a minimum of 10 pixels (pixel height/entrance slitheight= 0.1) is necessary to obtain 97% accuracy if
Fig. 6. Three optical arrangements for an atomic absorption instrument using a hollow cathode lamp (HC) and a continuum source (Cs). (a)shows a conventional arrangement while (b) and (c) show the arrangements necessary to achieve the collimated radiation beam necessary tomeasure the spatial distribution of analyte atoms in the furnace (F) where the lens (L) and monohromator entrance slit (ES) are labeledaccordingly.
1011A.Kh. Gilmutdinov, J.M. Harnly/Spectrochimica Acta Part B 53 (1998) 1003–1014

the absorbance changes from 0 to 1.9 across the heightof the furnace. Although this degree of variation mayseem excessive, there is little data to date on which tobase an assessment as to what is normal.
5. Temporal and thermal resolution
Transient temporal signals are most easilycharacterized by measuring the peak height or thepeak area. Time integrated absorbance,At, is obtainedquite easily by summing the absorbances over thedesired period of time:
At =�
A(t) dt = tA ∑ logI0(t)I (t)
: (18)
All values must be normalized by the time betweenabsorbance computations,tA, to ensure that integratedabsorbance is not dependent on the sampling fre-quency. Time integrated absorbance is commonlyused because it is recognized that, while the shapeof the peak can depend on the sample matrix, thetotal area should simply be a function ofN0 [15].Thus, the integrated absorbance should remain con-stant while the peak shape and the peak height varywith the sample matrix. This simplified modelassumes that, while the appearance rate of the analytemay vary, the loss rate of analyte from the furnace isconstant. This requires that the furnace temperature isconstant and that data is acquired at a faster rate thanthe transmitted intensity is changing, so integrationtakes place in the absorbance domain.
The furnace is a temperature resolved atomizer,that is, the temperature is programmable with time[14] unlike the flame or inductively coupled plasma.This provides the advantage of preselecting drying,charring, ashing, and atomization temperatures up to3000 K using any desired temperature program. Thedisadvantage is that the transition time between thediscrete temperature steps is finite and analyte atomscan experience complex and individually differenttemperature programs during the volatilization/atomi-zation process. In theory, each absorbance could becorrected for the furnace temperature at the measure-ment time and then summed to provide a thermallyintegrated absorbance. In practice, however, physicalmodifications of the furnace design have been used totry to provide spatial and temporal isothermality.
The first modification, suggested by L’vov [2], wasto install a platform in the furnace. Since the platformis heated at a slower rate than the furnace wall, placingthe sample on the platform retards volatilization of theanalyte until the temperature of the furnace wall andthe gas phase are in close agreement and at a tempera-ture capable of atomizing the analyte. In this manner,the analyte is introduced, in theory, into a temporallyisothermal atmosphere. The platform temperature,however, is governed by the tube wall temperature.This serves to limit control of the rate of platformheating. The second modification was to heat thefurnace transversely [16]. This produces faster andmore uniform heating of the furnace wall. At anymoment in time, the furnace should be spatially iso-thermal. Unfortunately, depending on the atomization
Fig. 7. Relative absorbance as a function of the ratio of the pixelheight to the height of the entrance slit (assuming spectrometeroptics that provide a 1:1 image of the entrance slit at the focalplane) for an absorbance change of (X) 0.12, (B) 0.25, (l) 0.5,(O) 1.0, and (W) 1.9 across the furnace height. If the entrance slit is500mm, then ratios of 0.05, 0.25, 0.5, and 1 correspond to pixelheights of 25, 125, 250, and 500mm.
1012 A.Kh. Gilmutdinov, J.M. Harnly/Spectrochimica Acta Part B 53 (1998) 1003–1014
temperature, the first two modifications can still resultin non-uniform temperatures. Spatial and temporalisothermality, and complete separation of the volati-lization and atomization processes, is best achievedthrough a third modification, the two-step atomizer[15,17]. Sample vaporization occurs from a cupvaporizer while atomization occurs in a pre-heatedtube atomizer. Temperatures of the two parts of thesystem are fully independent. Such an atomizer is thebest device to ensure complete atomization, which iscrucial for absolute analysis.
The frequency of intensity measurements is deter-mined by two factors, the rate of change of the analyteabsorbance and the rate of change of the non-specificbackground absorbance. The latter factor is not a con-cern with a linear or two-dimensional array detectorprovided the intensities are shifted vertically (perpen-dicular to the wavelength axis) for storage prior tobeing read. If a shutter is not used, a vertical shiftmay produce some smearing with respect to the hor-izontal resolution [18], but temporally the analyticaland reference intensities are read simultaneously. Thisprovides the maximum accuracy for background cor-rection. This is in contrast to conventional GF-AAS,which relies on rapid sequential measurements of theanalytical and reference intensities or mathematicalcorrection.
The rate of change of the analyte absorbance isdetermined by the analyte mass, the volatility of theelement, and the rate of heating of the furnace. Earlywork by Sturgeon and Chakrabarti [19] showed littledifference in the absorbance versus time profiles forabsorbance computation frequencies of 60 and100 Hz. With the more rapid heating of the transver-sely heated furnace and the need to use higher tem-peratures for multielement determinations, anabsorbance computation rate of 80 to 100 Hz is prob-ably going to be necessary.
An additional, and largely unexplored, dimensionof the atomization process is the gas phase pressure.The use of increased [19,20] or reduced [21],pressures have been reported in the literature. Ele-vated pressures, with a continuum source and anarray detector, result in enhanced sensitivities; whilereduced pressures decrease the sensitivity and extendthe working range to microgram regions of analytemass. In addition, reduced pressures will minimizecollisional broadening. In conjunction with a
high-resolution monochromator, it is possible toresolve isotope shifts for elements with low or highmasses.
6. The next generation instrument
Commercially available GF-AAS instruments pro-vide only spectral isolation of emission source andspatial isolation of the probing beam, without anyresolution of intensities. Thus, all the radiation thatpasses through an aperture with a spectral intervalof ls and a slit heighth is measured simultaneouslywith a single detector. The computed absorbance forconventional AAS [10] is presented by the relation-ship shown in Eq. (4). This method employs integra-tion in the intensity domain and depends not only onthe number of analyte atoms in the furnace but also onthe spectral and spatial features of the source and thefurnace. This approach is not suitable for absolutedetection.
Design of a GF-AAS instrument based on a conti-nuum source, a high resolution echelle spectrometer, atwo dimensional CCD and the optical design shown inFig. 6(c), would produce an image like that shown inFig. 2 and would be capable of resolving intensitieswith respect to wavelength and height in the furnace.The integrated absorbance for wavelength, height andtime, Al,h,t or ATot, would be computed by combiningEqs. (17) and (18):
ATot = tA ∑tend
t = tahp ∑
37
y=16lp ∑
20
x=3Ax, y (19)
or, substituting with Eq. (14):
ATot = tA ∑tend
t = tahp ∑
37
y=16lp ∑
20
x=3log
Io,y9
Ix, y9
� �, (20)
where all the variables have been previously definedand the intervals forx andy are specific to the modelshown in Fig. 2.
Eq. (20) is the practical application of Eq. (11). Theonly difference is the definition of the referenceintensity. For Eq. (20), the reference intensities werechosen to the left and right of the array.
From the discussion above, it is clear that one of theobvious trends in further development of AAS shouldbe the development of a multidimensional AAspectrometer. With the tremendous progress in the
1013A.Kh. Gilmutdinov, J.M. Harnly/Spectrochimica Acta Part B 53 (1998) 1003–1014

development of solid-state detectors and echellespectrometers [22], it is now possible to simulta-neously obtain spectral and spatial resolution keepingsufficient temporal resolution as well. The combina-tion of such a detection system with a continuumsource and a two-step furnace makes it is possible toobtain absorbances which approach absolute detec-tion and increases the possibility for absolute analysis.
Acknowledgements
A.Kh.G. wishes to thank USDA for providing aresearch grant to visit Dr. Harnly’s laboratory; thekey ideas of this paper were developed during the visit.
References
[1] A. Walsh,, Spectrochim. Acta 7 (1955) 108.[2] B.V. L’vov,, Spectrochim. Acta B 33 (1978) 153.[3] B.V. L’vov,, Spectrochim. Acta B 45 (1990) 633.[4] B.V. L’vov,, Fres. J. Anal. Chem. 355 (1996) 222.[5] W. Slavin, G.R. Carnrick, D.C. Manning, E. Pruszkowska, At.
Spectrosc. 4 (1983) 69.
[6] W. Slavin, Graphite Furnace AAS, A Source Book, ThePerkin-Elmer Corporation, Norwalk, CT, USA, 1984.
[7] J.M. Harnly,, J. Anal. At. Spectrom. 8 (1993) 317.[8] C.M.M. Smith, J.M. Harnly,, Spectrochim. Acta B 49 (1994)
387.[9] A.Kh. Gilmutdinov, K.Yu. Nagulin, Yu.A. Zakharov,, J. Anal.
At. Spectrom. 9 (1994) 643.[10] A.Kh. Gilmutdinov, B. Radziuk, M. Sperling, B. Welz,, Spec-
trochim. Acta B 51 (1996) 1023.[11] J.D. Ingle, Jr., S.R. Crouch, Spectrochemical Analysis, p. 215,.[12] J.M. Harnly,, Fres. J. Anal. Chem. 355 (1996) 501.[13] J.M. Harnly, C.M.M. Smith, D.M. Wichems, J.C. Ivaldi, P.L.
Lunberg, B. Radziuk,, J. Anal. At. Spectrom. 12 (1997) 617.[14] B.V. L’vov,, Spectrochim. Acta B 39 (1984) 159.[15] B.V. L’vov, Atomic Absorption Spectrochemical Analysis,
Hilger, London, UK, 1970.[16] W. Frech, D.C. Baxter, B. Hutsch,, Anal. Chem. 58 (1986)
1973.[17] W. Frech, S. Jonsson,, Spectrochim. Acta B 37 (1982) 1021.[18] R.E. Fields, J.M. Harnly, in preparation.[19] R.L. Sturgeon, C.L. Chakrabarti,, Prog. Anal. Atom. Spec-
trosc. 1 (1978) 5.[20] C.M.M. Smith, J.M. Harnly,, J. Anal. At. Spectrom. 10 (1995)
197.[21] D.C. Hassel, T.M. Rettberg, F.A. Fort, J.A. Holcombe,, Anal.
Chem. 60 (1988) 2680.[22] H. Becker-Ross, S.V. Florek,, Spectrochim. Acta B 52 (1997)
1367.
1014 A.Kh. Gilmutdinov, J.M. Harnly/Spectrochimica Acta Part B 53 (1998) 1003–1014