multi scale modeling of ignition and combustion of micro
TRANSCRIPT

The Pennsylvania State University
The Graduate School
Department of Mechanical and Nuclear Engineering
MULTI SCALE MODELING OF IGNITION AND COMBUSTION
OF MICRO AND NANO ALUMINUM PARTICLES
A Dissertation in
Mechanical Engineering
by
Puneesh Puri
© 2008 Puneesh Puri
Submitted in Partial Fulfillment of the Requirements
for the Degree of
Doctor of Philosophy
December 2008

The dissertation of Puneesh Puri was reviewed and approved* by the following:
Vigor Yang Professor of Mechanical Engineering Dissertation Advisor Chair of Committee
Richard Yetter Professor of Mechanical Engineering
Daniel Haworth Professor of Mechanical Engineering
Robert Kunz Associate Professor of Aerospace Engineering
Steve Son Special Member Associate Professor of Mechanical Engineering at Purdue University
Karen A. Thole Head of the Department of Mechanical and Nuclear Engineering
*Signatures are on file in the Graduate School

iii
ABSTRACT
With renewed interest in nano scale energetic materials like aluminum, many
fundamental issues concerning the ignition and combustion characteristics at nano scales,
remain to be clarified. The overall aim of the current study is the establishment of a
unified theory accommodating the various processes and mechanisms involved in the
combustion and ignition of aluminum particles at micro and nano scales. A
comprehensive review on the ignition and combustion of aluminum particles at multi
scales was first performed identifying various processes and mechanisms involved.
Research focus was also placed on the establishment of a Molecular Dynamics (MD)
simulation tool to investigate the characteristics of nano-particulate aluminum through
three major studies. The general computational framework involved parallelized pre-
processing, post-processing and main code with capability to simulate different
ensembles using appropriate algorithms. Size dependence of melting temperature of pure
aluminum particles was investigated in the first study. Phenomena like dynamic co-
existence of solid and liquid phase and effect of surface charges on melting were
explored. The second study involved the study of effect of defects in the form of voids on
melting of bulk and particulate phase aluminum. The third MD study was used to analyze
the thermo-mechanical behavior of nano-sized aluminum particles with total diameter of
5-10 nm and oxide thickness of 1-2.5 nm. The ensuing solid-solid and solid-liquid phase
changes in the core and shell, stresses developed within the shell, and the diffusion of
aluminum cations in the oxide layer, were explored in depth for amorphous and
crystalline oxide layers. In the limiting case, the condition for pyrophoricity/explosivity

iv
of nano-particulate aluminum was analyzed and modified. The size dependence of
thermodynamic properties at nano scales were considered and incorporated into the
existing theories developed for micro and larger scales. Finally, a phenomenological
theory for ignition and combustion of aluminum particles was proposed. The whole time
history from ignition till particle burnout was divided into five stages. An attempt was
made to explore different modes of ignition based on the effect of pressure, temperature,
oxidizer, oxide thickness and particle diameter and was investigated using length and
time scales involved during ignition and combustion.

v
TABLE OF CONTENTS
LIST OF FIGURES .....................................................................................................viii
LIST OF TABLES.......................................................................................................xiv
NOMENCLATURE ....................................................................................................xvi
ACKNOWLEDGEMENTS.........................................................................................xxii
Chapter 1 Introduction ................................................................................................1
1.1 Background and Motivation ...........................................................................1 1.2 Issues Concerning Metal Particle Combustion...............................................4
1.2.1 Heterogeneous vs. Homogeneous Combustion....................................5 1.2.2 Limiting Flame Temperature................................................................8 1.2.3 Diffusion vs. Kinetically Controlled Mechanism.................................10 1.2.4 Mode of Ignition...................................................................................13
1.3 Objectives .......................................................................................................14
Chapter 2 Micro Scale Aluminum Combustion..........................................................17
2.1 Aluminum.......................................................................................................17 2.2 Experiments at Micro Scales ..........................................................................19
2.2.1 Particle Generation ...............................................................................20 2.2.2 Characteristics at Micro Scales ............................................................20 2.2.3 Three Stages of Micron-sized Particle Combustion.............................22 2.2.4 Asymmetric Burning ............................................................................24 2.2.5 Diffusion of Ions within the Oxide Layer ............................................25 2.2.6 Phase Transformations .........................................................................27 2.2.7 Experimental Data ................................................................................32
2.3 Thermodynamics and Transport Properties....................................................39 2.4 Burning Rate...................................................................................................40 2.5 Theoretical Modeling at Micro Scales............................................................41 2.6 Chemical Kinetics...........................................................................................46 2.7 Summary and Conclusions .............................................................................49
Chapter 3 Nano Scale Aluminum Combustion...........................................................51
3.1 Unique features at Nano Scales ......................................................................51 3.2 Oxide Thickness .............................................................................................52 3.3 Literature Survey ............................................................................................53 3.4 Existing Simplified Models ............................................................................59 3.5 Comparison with Micro Scale Combustion....................................................67

vi
3.5.1 Heterogeneous vs. Homogeneous Mechanism.....................................67 3.5.2 Diffusion vs. Kinetically Controlled Mechanism.................................68 3.5.3 Mode of Ignition...................................................................................70
3.5.3.1 Cracking vs. Melting of Oxide Layer.........................................71 3.5.3.2 Thermodynamic Explanation .....................................................72
3.6 Summary and Conclusions .............................................................................73
Chapter 4 Nano Scale Simulations .............................................................................75
4.1 Molecular Dynamics Simulation Framework.................................................75 4.2 Potential Functions .........................................................................................78 4.3 Equations of Motion .......................................................................................89 4.4 Boundary Conditions ......................................................................................94 4.5 Statistical Ensembles ......................................................................................99 4.6 Structural and Thermodynamic Properties .....................................................104 4.7 Parallel Numerical Framework.......................................................................106 4.8 Code Validation ..............................................................................................110
Chapter 5 Thermo-Mechanical Behavior of Pure Aluminum at Nano Scales............119
5.1 Background.....................................................................................................119 5.2 Objectives .......................................................................................................121 5.3 Results and Discussion ...................................................................................123 5.4 Conclusions.....................................................................................................131
Chapter 6 Effect of Voids and Pressure on Melting of Nano-Particulate and Bulk Aluminum.............................................................................................................133
6.1 Background.....................................................................................................133 6.2 Objectives .......................................................................................................136 6.3 Results and Discussion ...................................................................................137 6.4 Conclusions.....................................................................................................152
Chapter 7 Thermo-Mechanical Behavior of Nano Aluminum Particles with Oxide Layers ...................................................................................................................154
7.1 Background.....................................................................................................154 7.2 Objectives .......................................................................................................156 7.3 Results and Discussion ...................................................................................157 7.4 Conclusions.....................................................................................................172
Chapter 8 Pyrophoricity of Aluminum at Nano Scales ..............................................174
8.1 Background.....................................................................................................174 8.2 Size Dependence of Properties at Nano Scales ..............................................177

vii
8.2.1 Thermodynamic Properties ..................................................................177 8.2.2 Ignition Characteristics.........................................................................181
8.3 Pyrophoricity of Nascent Aluminum Particles ...............................................181 8.4 Pyrophoricity of Oxide-Coated Aluminum Particles .....................................185
8.4.1 Particles with Thin Oxide Shell............................................................185 8.4.2 Particles with Thicker Oxide Shell.......................................................188
8.5 Glassman’s Criterion for Pyrophoricity..........................................................190 8.6 Conclusions.....................................................................................................192
Chapter 9 Unified Theory of Aluminum Particle Combustion...................................193
9.1 Ignition and Combustion at Multi Scales .......................................................193 9.2 Stages of aluminum oxidation ........................................................................198
9.2.1 Stage I ...................................................................................................202 9.2.2 Stage II..................................................................................................207 9.2.3 Stage III ................................................................................................210 9.2.4 Stage IV ................................................................................................211 9.2.5 Stage V .................................................................................................215
9.3 Modes of ignition............................................................................................216 9.4 Ignition Formulation using Phase Transformations .......................................222 9.5 Conclusions.....................................................................................................224
Chapter 10 Summary and Future Work ......................................................................226
10.1 Summary.......................................................................................................226 10.2 Recommendations for Future Work .............................................................230
10.2.1 Ignition Behavior of Metal-Coated Aluminum Particles ...................230 10.2.2 Oxidation of Aluminum in Flow Environments.................................232 10.2.3 Flame Speed Calculations in Particle Laden Flows ...........................233
Bibliography ................................................................................................................233

viii
LIST OF FIGURES
Figure 1.1: CEC Calculation for crossover pressures..................................................6
Figure 2.1: Different techniques adopted to calculate ignition point of aluminum (Trunov et al., 2005b) ...........................................................................................33
Figure 2.2: Sequence of true color image showing evolution of aluminum particle flame structure upon transition from spherically symmetric to non-symmetric combustion regime (Dreizin, 1999b)....................................................................38
Figure 2.3: Modeling in Combustion Science .............................................................42
Figure 3.1: SEM micrograph of Alex Aluminum particles (Risha, 2005)...................52
Figure 3.2: (a) TEM (light field) and SAED of aluminum nanoparticles within Al/PPK nano-composite (b) Al particle size distribution (Pivkina et al., 2004) ..56
Figure 3.3: Burning rate vs. pressure for propellant with different Al size (Meda et al., 2005) ...............................................................................................................57
Figure 3.4: Effect of aluminum content on detonation velocity for TNT/Al mixes at a charge diameter of 25.4 mm (Brousseau and Anderson, 2002).....................57
Figure 3.5: Chains of clusters in the cloud of low gravity combustion (60 atm, O2 +Ar) (Assovskiy, 2002) ........................................................................................58
Figure 3.6: XRD patterns for partially oxidized aluminum powder samples (Trunov et al., 2005) .............................................................................................59
Figure 3.7: Comparison of kinetic data for aluminum nanoparticles obtained from SPMS and TGS methods; k is diffusion limited rate constant (Park et al., 2005) .....................................................................................................................60
Figure 3.8: Experimental and calculated dependences of ignition delay on particle diameter (Fedorov and Kharlamova, 2003)..........................................................61
Figure 3.9: (a) Snapshot of structure of pure aluminum nanoparticle at 500 K (b) Radial distribution function for nanoparticle (c) Charge distribution for aluminum particle from Streitz-Mintmire potential (Alavi et al., 2005) ..............62
Figure 3.10: A 20 nm aluminum particle with 4 nm oxide thickness..........................63
Figure 3.11: SEM images of Al-1and Alex (Eisenreich et al., 2004)..........................64

ix
Figure 3.12: Experimentally observed aluminum particle burning time as a function of particle diameter (Huang et al., 2006)................................................70
Figure 3.13: Ignition temperature of aluminum particle as function of particle diameter ................................................................................................................71
Figure 4.1: Lennard-Jones potential for aluminum......................................................82
Figure 4.2: Glue potential for aluminum .....................................................................83
Figure 4.3: Sutton-Chen potential for aluminum.........................................................85
Figure 4.4: Streitz-Mintmire potential for aluminum ..................................................88
Figure 4.5: Flow chart of a typical MD simulation .....................................................90
Figure 4.6: Various lattice types for crystalline structures ..........................................94
Figure 4.7: FCC Lattice for aluminum ........................................................................96
Figure 4.8: Supercell for alumina ................................................................................97
Figure 4.9: Schematic diagram showing periodic boundary condition for Cartesian coordinates............................................................................................................98
Figure 4.10: Expand and fold operations showing communications among 8 processors in three steps (Plimpton, 1995) ...........................................................107
Figure 4.11: Speed-up and efficiency vs. number of processors for the MD code......108
Figure 4.12: Parallel computing facility at Penn State ................................................109
Figure 4.13: Comparison with results of Solca et al. for Validation ...........................112
Figure 4.14: Variation in Potential energy during melting for an Argon crystal at 44.56 kbar .............................................................................................................113
Figure 4.15: Validation for NPT ensembles using argon at 0.25 kbar, time step of 8.6 fs .....................................................................................................................113
Figure 4.16: Simulation of a liquid droplet of argon at 100 K (a) argon droplet in its saturated vapor at 100 K; (b) density contour at 100 K...................................114
Figure 4.17: Radial distribution functions for liquid argon using NVE simulations...115
Figure 4.18: Gaseous phase argon at 200K and 7.5 MPa ............................................116

x
Figure 4.19: Radial distribution functions for Al-Al, Al-O, and O-O interactions .....117
Figure 4.20: Fragmentation and decomposition of Al2O3 from an alumina particle when heated beyond 4000 K; initial diameter of 5 nm.........................................118
Figure 5.1: Variations of thermodynamic and structural properties during melting of bulk aluminum in vacuum; the glue potential ..................................................124
Figure 5.2: Variations of thermodynamic and structural properties during melting of nano-sized aluminum particle; the glue potential.............................................125
Figure 5.3: A 4 nm aluminum particle in solid state; the glue potential......................126
Figure 5.4: Melting point of nano-sized aluminum particle as function of particle size ........................................................................................................................127
Figure 5.5: Spherical shape assumed by nano-scale aluminum particles after melting ..................................................................................................................129
Figure 5.6: Variation of equilibrium potential energy with temperature for 2 nm sized particle (256 atoms).....................................................................................130
Figure 5.7: Surface charge development for 3 nm aluminum particle using the embedded-atom and Streitz-Mintmire potentials .................................................131
Figure 6.1: Variations of structural and thermodynamic properties during melting of bulk aluminum; perfect crystal of 864 atoms without defects .........................138
Figure 6.2: Different void geometries considered for bulk aluminum with 864 atoms.....................................................................................................................139
Figure 6.3: Effect of void size on melting of bulk aluminum with 864 atoms ............140
Figure 6.4: Variations of structural and thermodynamic properties during melting of bulk aluminum; crystal of 864 atoms with 1.05 nm3 void ...............................141
Figure 6.5: Variations of structural and thermodynamic properties of bulk aluminum showing lattice collapse; crystal of 864 atoms with 4.0 nm3 void ......142
Figure 6.6: Temporal evolution of atomic positions, showing mechanisms of melting and structural collapse for bulk aluminum with 864 atoms (a) without defect, (b) with a void size of 1.05 nm3, and (c) with a large void size of 4 nm3........................................................................................................................144
Figure 6.7: Effect of void size on melting of bulk aluminum with 2048 atoms ..........145

xi
Figure 6.8: Variation of critical void size for lattice collapse as a function of bulk aluminum volume .................................................................................................146
Figure 6.9: Different void geometries considered for a spherical 5.5 nm aluminum particle ..................................................................................................................147
Figure 6.10: Effect of void size on melting for a spherical 5.5 nm aluminum particle ..................................................................................................................147
Figure 6.11: Time evolution of atomic positions, showing mechanism of melting for a 5.5 nm nanoparticle (a) without defect, (b) with a void size of 0.98 nm3, (c) with a large void size of 8.2 nm3.....................................................................148
Figure 6.12: Time evolution of density contours, showing mechanism of melting for a 5.5 nm nanoparticle (a) without defect, (b) with a void size of 0.98 nm3, (c) with a large void size of 8.2 nm3.....................................................................149
Figure 6.13: Effect of void size on melting of a spherical 8.5 nm aluminum nanoparticle...........................................................................................................150
Figure 6.14: Time evolution of atomic positions, showing mechanism of melting for a 8.5 nm nanoparticle (a) without defect, (b) with a void size of 5.0 nm3, (c) with a large void size of 20.0 nm3...................................................................151
Figure 6.15: Time evolution of density contours, showing mechanism of melting for a 8.5 nm nanoparticle (a) without defect, (b) with a void size of 5.0 nm3, (c) with a large void size of 20.0 nm3...................................................................152
Figure 7.1: Schematic of a spherical nanoparticle with aluminum core and oxide shell.......................................................................................................................156
Figure 7.2: Aluminum nanoparticles with crystalline oxide layer at room temperature ...........................................................................................................158
Figure 7.3: Equilibration calculations for 5 nm particle (3 nm core diameter and 1 nm crystalline oxide thickness) ............................................................................159
Figure 7.4: Evolution of Lindemann indices for aluminum core and crystalline oxide layer; 5 nm particle (3 nm core diameter and 1 nm oxide thickness) .........160
Figure 7.5: Density distributions at various temperatures during heating of 5 nm particle ..................................................................................................................161
Figure 7.6: Evolution of Lindemann indices for aluminum core and crystalline oxide layer; particle size of 5-10 nm (3-8 nm core diameter and 1.0 oxide thickness) ..............................................................................................................162

xii
Figure 7.7: Evolution of Lindemann indices for aluminum core and crystalline oxide layer; particle size 7-10 nm (5 nm core diameter and 1.0-2.5 nm oxide thickness) ..............................................................................................................163
Figure 7.8: Variation of melting points as function of core size and oxide layer thickness ...............................................................................................................163
Figure 7.9: Evolution of Lindemann index during heating of 5 nm pure crystalline alumina particle ....................................................................................................164
Figure 7.10: Evolution of Lindemann indices during heating of 5 nm particles with crystalline and amorphous oxide layers (3 nm core diameter and 1 nm oxide thickness) ....................................................................................................165
Figure 7.11: Snapshots of 5-8 nm nano aluminum particles with crystalline oxide layer, showing diffusion of aluminum cations (core size of 3-6 nm and oxide thickness of 1 nm).................................................................................................168
Figure 7.12: Snapshots of 7-9 nm nano aluminum particles with crystalline oxide layer, showing diffusion of aluminum cations (core size of 5 nm and oxide thickness of 1-2 nm) .............................................................................................169
Figure 7.13: Snapshot showing diffusion of aluminum cations in crystalline and amorphous oxide layers for 5 nm particle (oxide thickness of 1 nm) ..................170
Figure 7.14: Domain for application of continuum laws based on particle diameter and Pressure ..........................................................................................................171
Figure 8.1: Size dependence of melting point and heat of fusion for nano-particulate aluminum ............................................................................................179
Figure 8.2: Size dependence of vaporization temperature for nano-particulate aluminum ..............................................................................................................180
Figure 8.3: Pyrophoricity at nano scales with melting of aluminum core as primary mechanism of ignition.............................................................................182
Figure 8.4: Time evolution of temperature for nascent aluminum particles................185
Figure 8.5: Time evolution of temperature and oxide thickness for particle with 10 nm core diameter and 0.3 nm oxide thickness using ion transport in non-adiabatic conditions ..............................................................................................187
Figure 8.6: Time evolution of temperature and oxide thickness using ion transport for particle with 10 nm core diameter and 0.3-0.4 nm oxide thickness in adiabatic conditions ..............................................................................................188

xiii
Figure 8.7: Evolution of temperature and oxide thickness for particle with 10 nm core diameter and 0.5 nm oxide thickness............................................................190
Figure 9.1: Al-O phase diagram (Goldsmith et al., 1960) ...........................................199
Figure 9.2: A schematic showing aluminum oxide thickness on a nanoparticle .........200
Figure 9.3: Various Stages of Aluminum Particle Ignition and Combustion ..............202
Figure 9.4: Fourier Analysis based on characteristic time and length scales associated with oxide layer...................................................................................208
Figure 9.5: Regimes of Diffusion vs. Kinetically controlled mechanism as a function of different pressures and particle size ...................................................212
Figure 9.6: Different modes of ignition based on length and time scales....................217
Figure 9.7: Schematic of different modes of ignition for oxide coated aluminum particles.................................................................................................................220
Figure 9.8: Effect of Pressure on Characteristic Time Scale Study.............................221
Figure 9.9: Effect of Temperature on Characteristic Time Scale Study......................222
Figure 9.10: Predicted temperature histories and overall thickness of oxide layers for 100 nm particle introduced in air at 1250 K ...................................................223
Figure 9.11: Predicted temperature histories and overall thickness of oxide layers for 500 nm particle introduced in air at 1750 K ...................................................224
Figure 9.12: Predicted temperature histories and overall thickness of oxide layers for 5 mµ particle introduced in air at 2100 K.......................................................224

xiv
LIST OF TABLES
Table 1.1: Properties of metal and metal oxides..........................................................7
Table 2.1: Properties of aluminum...............................................................................18
Table 2.2: Properties of aluminum oxide.....................................................................18
Table 2.3: Adiabatic temperature of aluminum combustion with different oxidizers................................................................................................................19
Table 2.4: Values of kinetic parameters used in models for aluminum oxidation and ignition ...........................................................................................................30
Table 2.5: Existing experimental data on aluminum at micro-scale............................33
Table 2.6: Existing numerical models for micro-scale aluminum combustion (Brooks and Beckstead, 1995)..............................................................................42
Table 2.7: Reactions involved in aluminum combustion along with rate constants....46
Table 3.1: Existing data on aluminum at nano scales..................................................54
Table 4.1: Various length and time scales in physical world (material science).........76
Table 4.2: Coordinates for Al2O3 lattice ......................................................................95
Table 5.1: Cohesive energies for bulk aluminum ........................................................126
Table 5.2: Melting points of nano-scale aluminum particles as function of particle diameter ................................................................................................................128
Table 7.1: Stresses developed inside the oxide shell due to melting ...........................166
Table 8.1: Thermo physical properties of bulk aluminum and alumina ......................179
Table 8.2: Kinetic parameters determined for phase transformations .........................189
Table 8.3: Constants used in expression for growth of oxide layer.............................189
Table 8.4: Properties used in determination of pyrophoricity .....................................191
Table 9.1: Thermo-physical properties of aluminum and alumina..............................201
Table 9.2: Kinetic parameters determined for phase transformations .........................204

xv
Table 9.3: Constants used in expression for growth of oxide layer.............................215
Table 9.4: Various regimes of particle behavior during ignition.................................216

xvi
NOMENCLATURE
Symbols
A surface area, pre-exponential factor
a half distance from one potential minimum to the next
Al aluminum
Al2O3 aluminum oxide
b,c,d constants
c, cp, cv specific heat
C molar concentration
di scaled coordinates
d, D diameter of particle, particle size
Da Damkohler number
D gas mass diffusivity
E activation energy, total energy of a particle
E0 Electric field due to Mott’s potential, VM
f ratio of structural to thermodynamic melting point, probability, fraction
F force, activation energy, energy required to embed an atom in an
environment with given electron density
g constant
J second derivative associated with self-Coulomb repulsion
h, H enthalpy
h critical thickness, heat transfer constant

xvii
H Hamiltonian
K kinetic energy, activation energy
k rate constant, conductivity
kB Boltzmann’s constant
L latent heat of fusion/vaporization, Lagrangian, length scale of simulation
l length of Al-Al atomic bond
MW molecular weight
m mass flow rate
m, M mass
n number of cations per unit area, mole number, reaction order
N number of atoms/molecules
NA Avogadro’s number
P, p pressure
p momentum
qi scaled coordinates, charges
q heat loss
Q heat release
r0 mean free path
ri coordinates for a particular location
rij distance between two atoms
r, R particle radius
RK reaction front location

xviii
uR Universal gas constant
s scaling factor
S surface area
t time
T temperature
U potential energy, energy barrier
V volume, potential
VM Mott’s potential
W molecular weight
X mole fraction
x coordinates, oxide thickness
Yi mass fraction of species i
ZD frequency factor
Z pre exponential constant
Greek Symbols
α energy accommodation constant, material constant, alpha phase for
alumina
β constant, heating rate
γ gamma phase for alumina
δ oxide thickness, Lindemann index
ε epsilon (constant for LJ potential), mass fraction of reacting species

xix
ζ decay length for atomic orbital, friction length
ξ constant used in Streitz-Mintmire potential
κ lattice vector
κ lattice vector
λ translational order parameter, mean free path
µ viscosity, constant used for charge evolution, molecular weight
ν potential, velocity, Stoitiometric ratio, electrostatic interaction energy
1ν monometer volume calculated using density of aluminum
ρ density
σ sigma (constant for LJ potential), surface tension, stress
τ burn time
υ attempt frequency of cation jump
ϕ pair wise atomic interactions, potential function
χ electro-negativity, mole fraction
ψ wave function
ω production/oxidation/reaction rate
Planck’s constant
Γ phase space
Ζ core charge
Λ wavelength
Ω entropy, volume of oxide formed per cation

xx
Subscripts
0 initial condition
Al aluminum
Al2O3 aluminum oxide
bpt boiling point
b bulk properties
c condensed phase
cr critical
diff diffusion
el electron
fus fusion
g gaseous phase
i, j, k indices
kin kinetic
LJ Lennard Jones
m melting point
n nucleus
o oxidizer
ox oxidation
p particle
s surface

xxi
SC Sutton Chen
vap vaporization
Superscripts
(.) vector
( ). ′ first derivative
( ). ′′ second derivative

xxii
ACKNOWLEDGEMENTS
With deep gratitude, first I wish to express my sincere thanks to my advisor, Dr.
Vigor Yang, for giving me an opportunity to work under him and kindly providing
guidance throughout the development of the study. He has been the source of inspiration
and his support, encouragement, and comments have been of greatest help at all times.
Sincere thanks also go to Dr. Dan Haworth, Dr. Robert Kunz, Dr. Steve Son and
Dr. Richard Yetter for serving as my committee members. They took effort in reading
and gave me valuable suggestions on the earlier versions of this thesis. I would also like
to thank Dr. Barbara Garrison, Dr. Saman Alavi and Dr. Leonid V. Zhigilei for their
advise and interactions during the early stages of my learning of nano scale simulations.
This work was sponsored by the U.S. Army Research Office under the Multi-
University Research Initiative under Contract No. W911NF-04-1-0178. The financial
support and encouragement provided by Drs. David Mann, Kevin L. McNesby, and
Ralph Anthenien are gratefully acknowledged.
I also wish to express thanks to all my friends and research mates for their
company and support. I take this opportunity to express my love and sincere thanks to my
parents, grandparents and my sister for their endless love and support. They taught me the
value of hard work and provided me enormous support all my life. I owe this
accomplishment to The Almighty who has given me the mind, intellect, body and energy
to accomplish such a task.
Chapter 1
Introduction
1.1 Background and Motivation
Energetic materials are substances that can store large amounts of chemical
energy and are characterized by a very high rate of energy release on burning. Nano-
phase materials and composites, characterized by ultra fine grain size, have especially
attracted widespread interest in recent years due to their unusual energetic properties.
Such nano-sized metallic and explosive powders have been used with solid propellant
and explosive mixtures to increase the overall efficiency. Excess energy of surface atoms
and reduced activation energy values for chemical reactions contribute to the
extraordinary chemical activity of nanoparticles (Pivkina et al., 2004).
It has been found that addition of aluminum nanoparticles in particular can
enhance the burning rate of propellants by 5-10 times as compared to conventional
aluminum particles (Mench et al., 1998). Aluminum nanoparticles have been used as an
ingredient in solid rocket propellants because of their high density, high heat release
during oxidation, and low cost. The addition of aluminum has resulted in an increase in
specific impulse of around 10%. It also suppresses combustion instability. Some
disadvantages of using aluminum are smoky, luminous exhaust trails, contamination with
Al2O3, and potential of increase metal fire damage in case of a launch failure. The first
experiments with aluminized propellants were conducted in mid-1950s. Nothing much

2
was known about aluminum combustion and only some thermo chemical calculations
suggested substantial power gains. Aluminum was also used in several tactical rockets in
1960s and for long-range ballistic missiles, use of aluminum became a must if missiles
were to be of practical size. Suppression for combustion instability has always been a
concern for aluminum combustion.
Many fundamental issues concerning the ignition and combustion characteristics
at nano scales, however, remain to be clarified. Before moving to a full multi-scale
modeling with simulations of the generation, transport, and combustion of nano-sized
energetic materials in flow environments, good understanding of the combustion of a
single particle in a quiescent medium is required. Moreover, the theories developed for
micron-sized particles cannot be directly applied to study the ignition and combustion of
nano-sized particles. The combustion mechanisms at such scales can no longer be
controlled by transport rates and are speculated to be kinetically controlled. Also, the
mode of combustion may switch to heterogeneous reactions because of the small length
scales. There is a diversity of opinions regarding the ignition of nanoparticles as well.
The overall aim of the current study is the establishment of a unified theory
accommodating the various processes and mechanisms involved in the combustion and
ignition of aluminum particles at micro and nano scales. Such a theory helps understand
the single particle behavior with high fidelity, and can also act as a sub-model in
predicting the collective behavior of particles at large scales.
Another critical issue relevant to the future development of nano-structured
energetic materials is the basic understanding of structures that provide desirable
performance, thermo-mechanical, and ignition and combustion characteristics. In light of

3
the inconsistency and uncertainties of existing theories concerning the particle behavior
at nano scales, fundamental research based on well-calibrated techniques appeared to be
imperative, in order to achieve improved understanding of the effects of particle size on
the ignition and combustion behavior.
With this point of view a comprehensive review of work done on aluminum
particles at micro-scale and nano scale has been performed (Glassman, 2001; Bucher et
al., 1998; Bucher et al., 1999; Bucher et al., 2000; Brooks and Beckstead, 1995; Babuk et
al., 2001b; Price and Sigman, 2001). Various processes and mechanisms involved were
identified. Research focus was placed on the continued development of a unified theory
for particle ignition and combustion, and on the establishment of a Molecular Dynamics
(MD) simulation tool to handle the problems at nano scales.
Once the theoretical and computational tools were established, the main objective
was then to investigate the characteristics of bulk and nano-particulate aluminum by
means of MD simulations using three major studies. The general computational
framework involved parallelized pre processing, post processing and main solvers with
capability to simulate different ensembles using appropriate algorithms. Size dependence
of melting temperature of pure aluminum particles up to 9 nm was investigated in the
first study. Phenomena like dynamic co-existence of solid and liquid phase and the effect
of surface charges on melting were also explored. The second study involved the study of
effect of defects in the form of voids on melting of bulk and particulate phase aluminum.
The third MD study was used to study the thermo-mechanical behavior of nano
aluminum particles coated with crystalline and amorphous oxide layers during melting.
The effect of particle size in the range of 5-10 nm with oxide thickness in the range of 1-

4
2.5 nm was investigated. Various fundamental processes, including structural changes,
stress development, and phase transformations in both the aluminum core and the oxide
shell, were examined and quantified systematically. The diffusion of aluminum cations
through the oxide layer was also explored. In addition, a structural analysis was applied
to determine the stress field in the oxide shell due to the volume dilatation in the
aluminum core. In a following theoretical study, the condition for pyrophoricity and
explosivity of nano-particulate aluminum was analyzed and modified. The size
dependence of thermodynamic properties at nano scales, including melting and,
vaporization temperatures, heat of fusion and heat of vaporization were considered and
incorporated into the existing theories developed for micro and larger scales. Finally, a
phenomenological theory for ignition and combustion of aluminum particles was
proposed. The whole time history from ignition till particle burnout was divided into five
stages. An attempt was made to explore different modes of ignition based on the effect of
pressure, temperature, oxidizer, oxide thickness and particle diameter. This was
investigated using time and length scales involved during ignition and combustion.
1.2 Issues Concerning Metal Particle Combustion
Due to their high ignition temperatures, metals were often not thought as being
combustible. Once ignited, they release more heat on burning as compared to other fuels.
Burning metal particles is different than hydrocarbons because of the presence of
condensed species. This is a very challenging scientific research topic and these days it is
being used in some important practical applications. One of the reasons for their

5
widespread use is the high energy densities as compared to hydrocarbons. Metal cutting,
welding, metal fires like the oxygen generator fire on Mir, and self propagating high-
temperature synthesis of materials are some examples of metal combustion. In propulsion
systems however, the combustion of metals typically occurs via small diameter particles
which can be either of micro or nano size.
Since the phase transition temperatures vary with the chemical composition of
atmosphere and pressure, the resulting combustion mechanism is dependant on the
oxidizer type and pressure. The transport phenomenon through the condensed and gas
phase further complicates the combustion mechanism. Due to the formation of high
temperature condensed-phase products, radiation effects also play a role in energy
conservation of burning particles. Moreover, inter solubility of metal and its products can
also affect the combustion behavior and can lead to disruption or break up of solid metal
(Yetter and Dryer, 2001).
1.2.1 Heterogeneous vs. Homogeneous Combustion
Three factors influence the mode of metal combustion in a major way:
1. Volatility of metal relative to that of the oxide
2. The comparison between the energy required to gasify the metal or its
oxide with the overall energy available from the oxidation reaction
3. Size of the particle
On the basis of the first two thermodynamic factors, metal combustion is
classified as heterogeneous or homogeneous. The process can either occur with the metal

6
and oxidizer in gas phase for a volatile metal, leading to vapor phase reaction or with
metal and a condensed phase, leading to a heterogeneous reaction.
The limiting flame temperatures, boiling points of pure metals, and hence the
mode of combustion are also a strong function of pressure. At a particular limit called the
crossover pressure, the boiling point of the metal equals adiabatic flame temperature of
the system under consideration. If the pressure is increased further, the boiling
temperature exceeds the adiabatic flame temperature and combustion proceeds via
reactions on particle surface. Figure 1.1 shows the cross over pressures for different
systems. It can be seen that the oxidation with oxygen always occurs in the gas phase for
all practical purposes. For Al-H2O and Al-CO2 systems, cross over pressures of 1.4 atm
and 4.6 atm were obtained, respectively. This can be done through CEC calculations and
Clasisus-Claperyon equation to obtain variation of boiling point with pressure.
Table 1.1 shows the properties of various metals and their oxides (Glassman,
2001). The table lists metal, its boiling point, the oxide formed during oxidation, the
oxide’s properties like volatilization temperature, heat of formation, heat of volatilization,
Pressure (atm)
Tem
pera
ture
(K)
10-1 100 101 1022000
3000
4000
5000
6000 2Al+1.5O2
2Al+1.5(O2+3.76N2)
2Al+3CO2
Al Vaporization 2Al+3H2O(l)
2Al+0.75NH4ClO4
Figure 1.1: CEC Calculation for crossover pressures

7
and the sum total of energy required to heat the oxide to its volatilization temperature and
dissociate. As can be seen from the table, since for metals like Al, Be, Ti etc. the boiling
point of the metal is significantly below the decomposition temperature of their oxides,
the combustion proceeds via formation of a detached flame in the gas phase. But in
metals like boron that have a very high boiling point, the combustion proceeds via
heterogeneous reactions. In terms of enthalpy, the chemical energy released is sufficient
to vaporize the metal oxide but insufficient to change the phase of metal. From the table,
since boiling point of aluminum is significantly below decomposition of aluminum oxide,
it will proceed with a detached diffusion flame.
Metal Tbp (K) Oxide Tvol (K) ,298fH∆ (kJ/mol) volH∆ (kJ/mol) , 298T vol volH H H− + ∆ (kJ/mol) Al 2791 A12O3 4000 -1676 1860 2550 B 4139 B2O3 2340 -1272 360 640 Be 2741 BeO 4200 -608 740 1060 Cr 2952 Cr2O3 3280 -1135 1160 1700 Fe 3133 FeO 3400 -272 610 830 Hf 4876 HfO2 5050 -1088 1014 1420 Li 1620 Li2O 2710 -599 400 680 Mg 1366 MgO 3430 -601 670 920 Ti 3631 Ti3O5 4000 -2459 1890 2970 Zr 4703 ZrO2 4280 -1097 920 1320
Unlike hydrocarbons, the temperature profile for most of the metals is like a flat
top distribution, over a significant range of radial distances above the particle surface,
where the oxide vaporization takes place. However, in some cases if due to radiation
losses the temperature drops below the boiling point of metal, then combustion proceeds
on the surface of the particle.
Table 1.1: Properties of metal and metal oxides

8
1.2.2 Limiting Flame Temperature
In case of metal combustion the flame temperature is fixed by the vaporization-
dissociation temperature (volatilization/limiting temperature) of the metal oxide product
formed as a result of oxidation. This is because the heat required to vaporize/decompose
the oxide is greater than the heat available to raise the oxide above its boiling point
(Glassman, 1977). The flame temperature can exceed the limiting temperature only when
the heat released during the reaction exceeds the combined heat required to raise the
products to the volatilization temperature and that required for dissociation. As
mentioned before in addition to the boiling temperature, the volatilization temperature,
and the heat of formation, Table 1.1 also shows the heat of volatilization and a combined
sum of heat of volatilization with the enthalpy required to raise the product to the
volatilization temperature. This issue should be taken care of while simulating metal
particles. Due to limiting flame temperatures, Glassman’s criterion for vapor phase
combustion states that for a metal to burn as vapor, the oxide volatilization temperature
must be greater than the metal boiling point. At steady state the temperature at the surface
of the metal is a few degrees below its boiling point.
Thermodynamic calculations show that adiabatic flame temperature does not vary
much with the equivalence ratio and this is attributed mostly to the fact that the
temperature is limited by the vaporization-decomposition temperature of aluminum
oxide. It can be exceeded if initial temperature is higher than the ambient. Off
stoichiometric for metal oxygen systems, temperature varies minimally as stoichiometric
ratio is approached and that too if equilibrium of decomposed metal oxide species is

9
influenced by excess of one of the reactants. The enthalpy of vaporization-decomposition
can be calculated using isobaric-isoenthalpic numerical simulations and for Al2O3 the
value is 1860 kJ/mol. However such calculations hold only for stoichiometric conditions.
The enthalpy of reaction for oxidation of aluminum is 1676 kJ/mol. The enthalpy
required to heat Al2O3 in liquid state to its volatilization temperature is 688 kJ/mol.
Furthermore, we can have distinction between volatilization temperature and
decomposition temperature if the product species of oxide decomposition are in
condensed phase.
There is a subtle difference between vaporization temperature and decomposition
temperature of metal oxides. In practice metal oxides always decompose to more than
one species close to the boiling temperature reported in thermodynamic property tables.
The term vaporization would be the temperature at which free energies of liquid and
gaseous phases are equal and strictly speaking heat of vaporization can be calculated
from the standard heat of formations of liquid and gaseous phases. However, both the
terms have different meanings and definitions, if the oxide decomposes instead of
vaporizing. Recently, the term volatilization has been used to replace vaporization-
decomposition (Brewer, 1953).
During volatilization of Al2O3, AlO(g) is the major species, and
2 3 2Al O AlO O→ + is one of the primary reactions. As the pressure is increased for Al-
O system, by Le Chatelier’s principle, dissociation is reduced. As a result heat required to
volatilize the oxide reduces and adiabatic temperature increases. A ten fold increase in
pressures results in 15% increase in the temperature and 7% reduction in the heat of
volatilization.

10
1.2.3 Diffusion vs. Kinetically Controlled Mechanism
Combustion of metal particles also involves chemical and transport time scales.
These can be compared to further classify the mode of combustion mechanism. If the
reaction rates are slow as compared to the rates of mass and energy diffusion, the spatial
non-uniformities can be eliminated and the process is kinetically controlled. But fast
reaction chemistry leads to temperature and species spatial gradients, which cause
conduction and diffusion of heat and species, respectively. This leads to diffusion
controlled mechanism.
Pressure and particle diameter play a very important role in determining the type
of combustion mechanism by affecting the characteristic diffusion time relative to the
kinetic times. For diffusion controlled mechanism the combustion time can be derived as:
where d0 is the initial particle diameter, pρ the particle density, ρ the gas density, D the
gas mass diffusivity, ν the mass stoichiometric fuel-oxidant ratio, and Y the mass
fraction. In case of a kinetically controlled mechanism the mass consumption rate is
given by:
where Xo is the oxidizer mole fraction, P the pressure, r the radius, MW the molecular
weight, and k the surface reaction rate with the oxidizer. This on integration gives a
characteristic time of
20
,,8 ln(1 )
pb diff
O
dt
D Yρ
ρ ν ∞
=+
(1.1)
,24 p O sp
m MW kPXrπ
= (1.2)

11
To determine the dominant combustion mechanism (Yetter and Dryer, 2001) the
Damkohler number, Da, for surface reaction is defined as:
This implies that small particles at low pressures generally burn under kinetically
controlled conditions.
From a different perspective, the Surface kinetics is given by 2[ ]Al skM Oω′′ =
where ω′′ is kg/s.m2, M is molecular weight of aluminum, k is rate coefficient
expressed as a u sE R Tk Ae−= , 2[ ]sO is oxygen concentration in kmol/m3 which can be
written as 2
2
2 ,[ ] mixs O s
o u s
M PO YM R T
= . Here, Ru is the universal gas constant, and T is the
temperature. This yields,
where rs is the radius of the surface. From flux balance we can derive that
The above two expressions can be combined to obtain
0,
,2p
b kinp o
dt
MW kPXρ
∞
= (1.3)
, 0 ,
, ,4 ln(1 )b diff p o
b kin o
t MW kPd XDa
t D Yρ ν∞
∞
= =+
(1.4)
2
2
2,4 mix
Al s c O so u s
M Pm r kM YM R T
π= (1.5)
2 2 2 2
2 2
, , , ,
, ,
4 ln 1 4O O s O O sAl s s
O s O s
Y Y Y Ym r D r D
Y Yπ ρ π ρ
ν ν∞ ∞⎡ ⎤− −
= + ≈⎢ ⎥+ +⎢ ⎥⎣ ⎦
(1.6)
2
2
,
,2
0
4 4
OAl
O su s
s mix s
Ym YR T
r kM P r Dνν
π π ρ
∞ −=+
+
(1.7)

12
The above equation can also be interpreted using circuit analogy as a relation of
resistances due to diffusion/kinetics and the potential difference. And we can express
them as
At large rs, and high pressures, the process is diffusion controlled because diff kinR R> . At
high temperatures, k increases rapidly compared to T and hence we have diffusion
controlled mechanism (Turns, 1996).
Such characteristic time scales can also be used to look at ignition and explosion
using well established theories by Semenov and Frank-Kamenetskii. If the reaction
proceeds at a constant rate the characteristic reaction time can be defined as
for the reaction rate ( ) ( )exp expn n nu uAC E R T A E R Tω ρ ε= − = − . Here ρ is the
density, ε the mass fraction of reacting species, A the pre-exponential factor, E the
activation energy, n the overall reaction order, and Ru the universal gas constant. Also, a
characteristic heat loss time can be expressed as
where V is the volume of vessel, cv the specific heat, h the heat transfer coefficient, and S
the surface area. The limit of thermal explosion is given by using Semenov’s criteria,
implying if r lτ τ is greater than a particular value, thermal explosion is not possible.
According to non stationary solution by Frank-Kamenestskii, a similar result can be
2 ,24 4
O su skin diff
s mix s
YR TR Rr kM P r D
ννπ π ρ
+= = (1.8)
( )0expn nr uA E R Tτ ρ ρ ε⎡ ⎤= −⎣ ⎦ (1.9)
l vV c hSτ ρ= (1.10)

13
derived and we can obtain the induction time associated with the whole system before
ignition
Here, Z is the pre exponential factor and Q is the heat thermal heat release during
reaction.
1.2.4 Mode of Ignition
Particle size plays a significant role in determining the characteristics of ignition
and combustion of aluminum particles and there is a diversity of opinion regarding the
ignition. For micron-sized and larger aluminum particles, the ignition temperature
coincides with the melting point of the surface oxide (Al2O3) layer at 2327K (Bucher et
al., 2000). The impervious nature of aluminum oxide inhibits the ignition of aluminum.
Once the layer melts, it coalesces to form an oxide cap, and the aluminum core is then
exposed to the ambient gases for oxidation. Researchers like Ermakov et al., Boiko et al.,
Lokenbakh et al., Boiko et al., Rozenband and Vaganova (Lokenbakh et al., 1985; Boiko
et al., 1989), however have concluded that ignition of aluminum in particular occurs due
to the failure of oxide shell integrity at micro scales. At nano scales (less than 100 nm),
the ignition occurs near the melting point of aluminum at 940 K by cracking of the oxide
shell, possibly caused by the pressure buildup (Rai et al., 2004; Rozenband and
Vaganova, 1992) and/or phase transformations (Dreizin, 2003; Trunov et al., 2006) inside
the shell. According to Rai et al., oxidation of alumina-coated nano-sized aluminum
0
20 1
uE R Tv uind
c R T eQ E Zρτ = (1.11)

14
particles is initiated by melting of the aluminum core. The resultant volume dilatation
causes a pressure build-up inside the shell formed by the oxide layer. Because of the
higher curvature as compared to micron-sized particles, the stress developed due to the
pressure becomes unsustainable and the shell subsequently ruptures. This concept was
originally introduced by Rozenband (Rozenband and Vaganova, 1992), who developed a
model taking into account the mechanical stresses at the metal-oxide interface. Trunov et
al. (Trunov et al., 2006) attributed the observed low ignition temperature of nano-sized
particles to the transformation from the amorphous to the gamma and alpha phases in the
oxide layer. As a consequence of the density variations in different phases, the layer
develops cracks, which permit direct oxidation of aluminum in the core. A proper
justification of all the processes leading to ignition, which covers a broad range of scales,
needs to be developed.
1.3 Objectives
Summarizing the previous works, it was realized that a lot of work needs to be
done to develop a theory for micro and nanoparticle combustion which is applicable at all
scales. The primary objectives are:
To obtain fundamental understanding of the physics and reactive behavior of a
single particle at different length scales, particularly with regard to sensitivity,
ignition, burning characteristics, and mechanical properties. Thus, enabling design
optimization for nano-structured energetic materials

15
To systematically investigate essential difference between physiochemical
mechanisms under micro and nano regime
To establish the nano scale simulation framework and validate it extensively with
existing literature data
To explore the size-dependence of properties at nano scales and focus on the
melting phenomena for bulk and particulate phase using pure aluminum particles
To investigate the thermo mechanical characteristics of oxide coated aluminum
particles
To explore the pyrophoricity and explosivity of aluminum at nano scales
To provide an explanation for different modes of ignition based on detailed study
of length and time scales associated with different processes
The approach follows three steps:
Investigation of the existing literature on micro-particle combustion and
observations made by experimentalists at nano scales
Establishing nano scale simulation framework on a parallel computing platform to
observe key thermo-mechanical characteristics based on literature survey using
molecular dynamics simulations
Performing detailed theoretical studies like pyrophoricity of particulate
aluminum, explanation of modes of ignition based on length and time scales and
establishing a five stage theory
The following Chapter 2 introduces the work done in literature for micro-particle
burning. It includes major experimental observations and numerical models which exist

16
at micro-scale. Chapter 3 discusses the work done so far in the area of nanoparticle
combustion. Chapter 4 presents the nano scale simulation framework and other finer
details related to code development and validation. Chapter 5, 6, and 7 present the results
of three major molecular dynamics studies performed using the framework discussed in
Chapter 4. Chapter 8 explores the pyrophoricity of aluminum at nano scales. Chapter 9
summarizes all the key results and also discusses the five stage theory using the study of
different length and time scales. A brief summary of the current research and proposed
future work are provided in Chapter 10.

Chapter 2
Micro Scale Aluminum Combustion
2.1 Aluminum
Aluminum is the most abundant metal and the third most abundant element in the
Earth's crust, after oxygen and silicon. It makes up about 8% by weight of the Earth’s
solid surface and is chemically too reactive to occur in nature as a free metal. Instead, it is
found in combined state in over 270 different minerals. The chief ore of aluminum is
bauxite, a mixture of hydrated aluminum oxide (Al2O3•xH2O) and hydrated iron oxide
(Fe2O3.xH2O). Another mineral important in the production of aluminum metal is cryolite
(Na3AlF6). However, cryolite is not used as an ore i.e. aluminum is not extracted from it.
The commercial process allowing its recovery economically was not discovered until
around the turn of the 20th century.
Aluminum metal is silvery white, has a low specific gravity (2.70) and a low
melting temperature (933 K). Except for iron and steel, aluminum is probably used for
more purposes than any other metal. Aluminum as a metal has light weight – about one-
third that of steel. Pure aluminum is soft and ductile. Other reasons of its use in industry
are the ease with which the metal can be cast, machined, rolled, forged, extruded, and
drawn. It has high electrical conductivity and significant resistance to atmospheric
corrosion. Aluminum paint, beverage cans, baseball bats, high-voltage power lines, house
siding, boats, and airplanes are just a few examples of aluminum in use as a metal. As an

18
energetic material, it can be used as very good source of energy with the heat of reaction
as high as 32 kJ/g. Various properties of aluminum and its oxide alumina are shown in
Table 2.1 and 2.2, respectively
Atomic Number 13 Atomic Weight 26.98 kg/kmol Density 2700 kg/m3 Molar Volume 10 cm3 Young Modulus 70 GPa Rigidity Modulus 26 GPa Elastic Modulus 70-79 GPa Bulk Modulus 76 GPa Tensile Strength 230-570 MPa Yield Strength 215-505 MPa Poisson Ratio 0.35, 0.33 Melting Point 933 K Boiling Point 2740 K Specific Heat 938 J/kg K Latent heat of fusion 397 kJ/kg Thermal Conductivity 0.5 cal/s cm K Van der wall Radius 0.143 nm Ionic Radius 0.05 nm Thermal expansion coefficient 20.4-25.0 *10-6 /K
Molecular Weight 101.961 kg/kmol Melting Point 2327 K Boiling Point 3273 K Density 4000 kg/m3 Flexural Strength 330 MPa Elastic Modulus 300 GPa Shear Modulus 124 GPa Bulk Modulus 165 GPa Poisson’s Ratio 0.21 Compressive Strength 2100 Hardness 1175 kg/mm2 Fracture Toughness 3.5 MPa/m0.5 Thermal Conductivity 18 W/m K Specific Heat 880 J/ kg K
The adiabatic flame temperatures for aluminum and products obtained from
different oxidizers are shown in Table 2.3 (Yetter and Dryer, 2001). Unlike combustion
Table 2.1: Properties of aluminum
Table 2.2: Properties of aluminum oxide

19
in oxygen or H2O, fluorination is a vigorous and highly exothermic reaction and
Glassman’s criterion for vapor-phase combustion does not apply here. Due to the
sublimation of AlF3, aluminum particle combustion in fluorine is similar to hydrocarbon
droplet combustion. It also provides maximum flame temperature in excess of 4000 K.
The adiabatic flame temperature with pure oxygen is also around 3900 K. This further
proves the high energy density of a metal particle like aluminum.
Reactants Adiabatic temperature (K)
Products > 1 mol% at Tad Products
2Al(s) + 1.5O2 3977.0 Al, AlO, Al2O, O, O2, Al2O3(l) Al2O3(a) 2Al(s) + 1.5(O2+3.76Ar) 3624.8 Al, AlO, Al2O, Ar, O, Al2O3(l) Al2O3(a) 2Al(s) + 1.5(O2+3.76N2) 3546.5 Al, AlO, NO, N2, O, Al2O3(l) Al2O3(a) 2Al(s) + 3N2O 3746.9 Al, AlO, Al2O, NO, N2, O, O2, Al2O3(l) Al2O3(a) 2Al(s) + 3H2O 3052.8 H, H2, H2O, Al2O3(l) Al2O3(a) 2Al(s) + 3CO2 3144.4 CO, CO2, Al2O3(l) Al2O3(a) 2Al(s) + 3CO 2277.2 Al, Al2O, CO, Al(l), Al2O3(a), C(cr) Al2O3(a) 2Al(s) + 1.5F2 4414.5 AlF, AlF2, AlF3, Ar, F AlF3(a) 2Al(s) + 1.5(F2+3.76Ar) 3873.5 AlF, AlF2, AlF3, Ar, F AlF3(a)
2.2 Experiments at Micro Scales
This section summarizes different characteristics associated with micron-sized
aluminum particle combustion. Generation of aluminum particles, unique characteristics
during the flame front formation, three stages of combustion, asymmetric burning,
diffusion of ions through the layer, phase transformations, and burning data under
different experimental conditions are discussed in detail.
Table 2.3: Adiabatic temperature of aluminum combustion with different oxidizers

20
2.2.1 Particle Generation
There are diverse techniques reported in literature that are used to generate
aluminum particles and analyze their combustion characteristics. For example, at JNIT
the study has been conducted using generator of mono-disperse metal droplets also
referred to as GEMMED (Dreizin, 1995). 150 microns diameters droplets are produced
up to velocities of 3 m/s using this technique. Other techniques like milling, DC arc
discharge, and laser ablation also exist. During the study of aluminum particles,
droplets/particles are either burned completely or quenched in inert gases like Argon and
Helium. In most of the experimental studies, the burned particles are quenched and
micro-sections are prepared on glass slides at different combustion times to study the
composition and structure of particles. Even the shape of smoke traces surrounding the
quenched particles can be investigated. Electron Probe micro analyzer, energy dispersive
spectroscopy detector and wavelength dispersive spectroscopy scan are utilized to
determine the particle internal compositions. The emission due to combustion is
monitored using brightness pyrometer transducer and is generally used as an indicator of
the combustion process. The temperatures are measured using the wavelength pyrometer
or optical pyrometry.
2.2.2 Characteristics at Micro Scales
For micron-sized particles, aluminum ignites at the melting point of oxide i.e.
2323 K. In combustion of a metal like aluminum there are gas phase reactions and also
surface oxidation resulting in volatile and non volatile products which include oxide and

21
sub oxide species. Some current models allow for deposition of non volatile products
(Dreizin, 2000). After ignition, due to the high flame temperature, aluminum starts
evaporating and a detached flame front is formed. The species/oxides produced at the
flame front are transported back to the aluminum surface. The oxygen is transported in
the form of AlO, Al2O and Al2O2 species. In air, NO is the main species involved. NO
reactivity is negligible in the vapor phase Al-O reaction mechanism. Because of the low
reactivity and longer lifetimes, the oxide cap for cases with aluminum oxidation in air is
larger as compared to the other oxidizers. Molecular and atomic oxygen are less likely to
reach the surface because of the high probability of reaction with Al and sub oxide
vapors. The species like AlO, Al2O and Al2O2, and NO react in a heterogeneous mode
and also add to the oxygen content inside the particle. The dissolution of oxygen in the
droplet results in a three phase equilibrium between the liquid Al2O3, liquid Al-O solution
and the gas. The composition of evaporated species is also affected due to the formation
of the Al-O liquid. Aluminum sub oxide vapor is generated at oxygen rich locations at the
particle surface, in addition to aluminum. This also results in the change in boiling point
of aluminum at different places inside the particle, based on the composition. The
ongoing heterogeneous reactions can increase or decrease the burning time. It can lead to
faster consumption of aluminum or on the other hand can block aluminum vaporization.
Micron-sized particle combustion is characterized by some well known features
such as brightness oscillations, disruptive burning, burning droplet speed variations,
oxygen build-up within the molten particle, micro-explosions, asymmetric combustion,
and follows d2 burning rate law. Most of these were investigated by Dreizin et al.
(Dreizin, 1995). The main conclusions from the preliminary studies performed on

22
micron-sized aluminum particles suggested that the oxide is not formed on the burning
particle surface during initial period of combustion and gas dissolves in particles causing
internal holes. The disruptive events change the combustion time significantly and also
aluminum particles agglomerate after ignition. Micro-explosions are generally associated
with temperature jumps.
2.2.3 Three Stages of Micron-sized Particle Combustion
The combustion of micron-sized aluminum particles can be further divided into
three stages corresponding to different temperatures, internal compositions and flame
shapes. The first stage involves spherically symmetric vapor phase combustion,
consistent with the metal vapor phase burning model. The second stage is associated with
an increase in the size and the density of the smoke cloud, non symmetric burning
regime, strong oscillations in particle radiation, flame distortion and spinning. The
asymmetric burning is attributed to the dissolution of oxygen and other gases, internal
phase changes ensuring eutectic, monotectic and peritectic phase transitions and will be
discussed in detail in the following sections. The third stage involves oxide cap formation
and its growth. This stage is also characterized by oscillations but decrease in radiation
intensity. In addition to exploring these three stages, measurements of flame shape,
particle diameter, and temperature histories during the entire process of particle
combustion in air was done in an experimental study by Dreizin et al. (Dreizin, 1996).
Using transfer number at 3000 K and 1500 K, theoretical burning time was evaluated

23
using d2 law. A significant discrepancy was found between predicted and experimental
results due to the heterogeneous reactions.
The transition between three stages can be explained in detail through the
formation of different Al-O phases (Dreizin, 2000). Aluminum ignites at temperature
close to the melting point of Al2O3 (2327 K). Because the adiabatic flame temperature is
so high, the particle self heats to aluminum boiling point (2730 K). This marks the onset
of Stage I with the formation of flame front. The gaseous oxides Al2O, AlO, Al2O2 and
NO are transported back to the surface. Molten aluminum can dissolve up to 0.1 atomic
percent oxygen, and produce liquid phase L1. Oxygen solubility in this L1 phase
increases with the decrease in temperature. On particle cooling the solution cannot
become super saturated like other metals. Hence, the solution boiling temperature
decreases from 2730 for pure aluminum to 2510 for L1, as concentration of oxygen in L1
increases. At 2510, a new oxygen rich L2 phase forms and there is a three phase
equilibrium. This starts Stage II. L1 and L2 are immiscible and hence non-uniformity
occurs. The boiling point of L2 is 3250 K as compared to that of 2510 for L1. This
reduces the aluminum evaporation rate. When particle size decreases, heat flux from the
flame becomes smaller than required for the aluminum to boil, and temperature drops.
Stage II begins when the particle temperature decreases from 2510 K and combustion
rate drops as well due to the decrease in the aluminum vaporization rate. When the
temperature decreases to 2323 K, a monotectic phase transition occurs. L1 and L2 phases
combine to form Al2O3 and it precipitates out to form an oxide cap.
Pressure affects the formation of L1 phase. The monotectic reaction is
independent of pressure but the temperature of L1-L2-gas equilibrium increases at higher

24
pressures. Thus in case of high radiative/convective losses, it is probable that the boiling
point of even L1 might not be reached under some conditions, and monotectic phase
transition would play the role similar to aluminum surface reactions.This all qualitatively
explains experimentally observed phenomena. The particle can explode in the cases if
oxygen solubility decreases with temperature, the solution becomes super saturated and
heat release can cause particle temperature to increase. Gaseous species like N2 can also
be released.
2.2.4 Asymmetric Burning
Microgravity eliminates the effects of buoyancy and convection as compared to
the normal conditions. Experiments are performed in microgravity by different
researchers to explore the physics behind various phenomena associated with the
aluminum particle combustion (Yetter and Dryer, 2001; Dreizin, 1999). Through such
experiments, it was concluded that the flame asymmetry is an intrinsic feature of the
aluminum particle burning. Al-O solution is formed inside the particle during
combustion. The onset of non symmetric burning is accompanied by formation of highly
radiative condensed products at several locations within the particle flame zone. Spinning
is also observed and explained on the basis of flame asymmetry and torque exerted on the
particle by gases. There are combustion models which ascribe non symmetry to
accumulation of condensed oxide on particle surface. Dreizin conducted experiments at
high and low Reynolds number. The bulk gas velocity due to aluminum evaporation

25
correlated well with the gas velocity needed to accelerate particle experimentally
(Dreizin, 1999b).
To explore and identify the conditions under which asymmetric combustion
develops, single aluminum particles have also been burned in N2/O2, Ar/O2 and He/O2
environments. It was found that oxide caps in O2/Ar are smaller than other environments.
No brightness oscillations were observed in O2/Ar either. Nitrogen intensifies oxide
dissolution especially through NO. Diffusion in He is faster than Ar, and as a result the
asymmetry was more prominent in the former. Smaller drops are more asymmetric. A
combination of all these phenomena can increase or decrease burning time (Dreizin,
1999). Free falling metal droplets are formed using pulsed micro arc discharge ignited
using a cold tool cathode and a consumable wire anode in work by Dreizin et al. (Dreizin,
2003). Experiments were aimed at identifying correlations between burning particle
temperature and composition histories. Most experiments were conducted in microgravity
and in air, argon-oxygen, helium-oxygen, and carbon di oxide environments.
2.2.5 Diffusion of Ions within the Oxide Layer
Jeurgens et al. have studied the structure and morphology of thin aluminum oxide
films (Jeurgens et al., 2002b), determined the chemical composition and chemical state of
the Al and O ions (Jeurgens et al., 2002c), and devised a novel method to determine the
thickness of film using XPS (X-ray photoelectron spectroscopy) spectra (Jeurgens et al.,
1999). A more mathematical approach followed to determine the total metallic primary
zero loss (PZL) intensity and total oxidic PZL intensity for aluminum oxide films. In

26
recent work by Jeurgens (Jeurgens et al., 2002) the growth kinetics of aluminum oxide
films formed by dry thermal oxidation of aluminum, at partial oxygen pressure of 1.33
10-4 Pa, and in a temperature range of 373-773 K, was studied using x-ray photoelectron
spectroscopy. For temperatures less than 573 K, an amorphous oxide film develops and
attains limiting thickness. For temperatures greater than 573 K, there is no limiting
thickness. At higher temperatures the initial rate is faster and in comparison to the low
temperature case where the thickness is self limiting, the oxide layer grows slowly. The
initial regime of very fast growth is followed by slower stage. The second stage is only
observed at high temperatures (>673 K). The transition occurs at around 3 nm for study
performed at 773 K. The fast growth rate is realized by outward migration of aluminum
cations into and through the close packing of oxygen anions in developing oxide film.
However, the decrease of oxygen sticking coefficient with increase in temperature may
indirectly (due to a low Mott’s potential, cation transport rate determining) or directly
(supply rate of chemisorbed oxygen is rate determining) lead to lower growth rate during
the initial stage, as compared to corresponding rate at lower temperatures. During the
second slow oxidation stage, the initially aluminum-enriched amorphous oxide film
attains stoichiometric composition of Al2O3 and becomes crystalline γ -Al2O3.
Simulations conducted using thermodynamic equilibrium code for Al-air system
also show high concentration of ions like Al+ and AlO- and electrons. Experimentally the
researchers observed distortion in smoke cloud in the external electric field. Also the
temperature history and combustion time changed in presence of electric field suggesting
that transport processes are affected due to the electric field.

27
The growth rate is quantified through Mott’s potential using Mott-Cabrera model.
It is assumed that no net charge is transported through the oxide and no space charge
builds up in the film. The cation movement is the rate determining step in oxidation at
low temperatures. The rate of electron transport across the developing oxide film by
tunneling decreases exponentially with increasing oxide thickness. This results in the
limiting oxide thickness. The free electron movement results in establishment of an
electric potential which lowers the energy barriers for interstitial movement of cations
from metal into the oxide film. The mathematical equation governing the process is given
by
where Ω is the volume of oxide formed per cation, n the number of cations per unit area
which may jump the energy barrier U , υ the attempt frequency of cation jump, q the
charge of migrating cation, 2a the distance from potential minimum to next potential
minimum, k the Boltzmann constant, T the temperature, 0E the electric field due to
Mott’s potential MV , and ( )x t denotes the oxide film thickness at time t . The constants
are given in detail in work by Jeurgens et al. (Jeurgens et al., 2002).
2.2.6 Phase Transformations
Trunov and his co-workers established a numerical framework to simulate
ignition using correlations/kinetic parameters obtained through thermal analysis. The
melting point of alumina is chosen as the criteria for ignition. The methodology proposed
0exp U qaEdx ndt kT
υ − +⎛ ⎞= Ω ⎜ ⎟⎝ ⎠
(2.1)

28
by Trunov (Trunov et al., 2006) treats heterogeneous oxidation as an exothermic process
leading to ignition. The ignition is assumed to occur when the particle’s temperature
exceeds alumina melting point. This model also analyzes the process of simultaneous
growth and phase transformations in the oxide. The kinetic parameters for both, direct
oxidative growth and phase transformations, are determined from the thermal analysis.
The model can be used to predict the ignition for particles of different sizes.
The entire oxidation stage till ignition is divided into different stages. In the
model, the growth of three phases of alumina namely, amorphous, γ , and α and their
transformations from one form to the other have been considered. The oxidation process
starts with the growth of natural amorphous alumina layer. The rate of this process is
controlled by outward diffusion of Al cations. The energy of oxide metal interface
stabilizes the oxide only up to a critical thickness of about 5 nm. When the temperature is
sufficiently high, the amorphous oxide transforms to γ phase. If prior to the phase
change, the thickness of amorphous layer is less than 5 nm, gamma alumina no longer
forms a continuous layer covering the surface, due to its higher density. As a result,
oxidation rate increases rapidly because of the direct attack of oxidizer. These openings
heal gradually and the oxidation rate decreases. As discussed before, this is an alternative
explanation of cracking. Cracking was also mentioned to be occurring due to thermal
expansion by Rai et al. in previous sections (Rai et al., 2005). The growth of γ alumina
continues and the oxidation is limited by inward grain boundary diffusion of oxygen
anions. This is also accompanied by transformations from γ phase to θ andδ phases,
which do not affect the oxidation rate significantly. This γ phase alumina finally

29
transforms to a coarse and dense α phase alumina. Thus the processes, in order of their
occurrence at increasing temperatures, are given by
1. Growth of amorphous oxide
2. Amorphous to γ -alumina phase change
3. Growth of γ -alumina
4. γ -Alumina to α -alumina phase change
5. Growth of α -alumina
The kinetic parameters were obtained from TGA experiments. The absolute value
of diffusion rate during the growth of layers is given by the solution of radial diffusion
equation:
where AD is the diffusion coefficient, oxAC , Al
AC the molar concentrations of species A on
the interfaces of oxide with aluminum and oxidizing gas respectively, r the radius and
subscripts Al, and ox refer to the aluminum core and oxide layer. With the help of
experiments, the rate of diffusion limited oxidation for a spherical oxide layer was given
by:
where, iC is the coefficient describing diffusion of a species obtained from TGA
experiments. The subscript i refers to specific phase of oxide and 1i − refers to
41 1
ox AlA A A
A
Al ox
C C DN
r r
π−=
− (2.2)
( )
ii
piioxi
rr
RTECm
11/exp
1
−
−=
−
(2.3)

30
underlying layer. The fraction of aluminum surface, f exposed to direct oxygen is
calculated using density ratio of parent and a newly formed (higher density) oxide phase.
Thus, 1 0.17amf γρ ρ= − = when the amorphous phase changes to γ phase. An
additional assumption was made regarding the diffusion resistance. It was assumed that
the newly formed γ and α phases provide negligible resistance. There exists a critical
thickness at which these layers stop behaving as individual crystallites producing no
resistance and start behaving as polycrystalline oxide scales. Based on the literature data,
this was chosen as 5 nm for γ phase and 30 nm for α phase. In this period, till the
critical thickness is reached, the constant iC is replaced by an effective constant eiC ,
based on oxide thickness using the relation:
where 200X γ = , 150Xα = , 5mh nmγ = and 30mh nmα = . Also, ( )2 expe mi i i ih h G L β= + −
where 7.71G nmγ = , 116G nmα = 1.066 /L s Kγ = and 0.439 /L s Kα = . β is defined as the
heat rate, given by /dT dt with units of K/s. All other constants obtained from
experimental study are tabulated in Table 2.4.
Kinetic Parameter Value amE 120 kJ/mol
Eγ 227 kJ/mol
Eα 306 kJ/mol
amC 5.098 x10⁻⁸ kg/m-s
Cγ 4.0784x10⁻³ kg/m-s
Cα 2.3791 x10⁻² kg/m-s
( )1m
e i ii i i ie m
i i
h hC X X Ch h
⎡ ⎤−= − −⎢ ⎥−⎣ ⎦
(2.4)
Table 2.4: Values of kinetic parameters used in models for aluminum oxidation and ignition

31
amE γ→ 458 kJ/mol
Eγ α→ 394 kJ/mol
amK γ→ 1 x10¹² J/mol-m
Kγ α→ 1x10⁸ J/mol-m
amF γ→ 2x10¹⁵ m/s-K
Fγ α→ 5x10⁶ m/s-K
For phase transformations the rate of mass increase, ( 1)tri im − → of the oxide phase i
transformed from oxide phase 1i − is described as:
where pT is the temperature of the particle, 1ih − the oxide thickness, and F , K ,and E are
determined experimentally. For direct attack of oxygen at the surface, and assuming
diffusion controlled mechanism, using Stefan’s law the rate of oxidation has been
computed as
where 2OD is the diffusion coefficient in air, gasρ the density of gas, µ the molar mass,
and χ is the molar fraction of oxygen in gaseous environment. In a separate experiment,
in which aluminum particles are heated in oxygen up to 1500 0C, during 300-550 0C, the
thickness of natural amorphous layer on particle surface increases. The oxide transforms
to gamma at about 4 nm and 550 0C. Later on gamma grows and transforms to alpha and
theta polymorphs. Previously too such studies have been performed to obtain activation
energies of phase transformations between alumina polymorphs. The model predicts
2( 1) 1 ( 1)4tri i i i i im r vπ ρ− → − − →= (2.5)
1 1 11 1 1 exp expi i i i i
i i i i pp p
K h EF TRT RT
ν − → − − →− → − →
⎧ ⎫⎛ ⎞ ⎛ ⎞⎪ ⎪= − − −⎜ ⎟ ⎜ ⎟⎨ ⎬⎜ ⎟ ⎜ ⎟⎪ ⎪⎝ ⎠ ⎝ ⎠⎩ ⎭ (2.6)
2 3
2 2
2
2
8ln 1
3Al Oox O
O gas O pgas O
m D r fπµµχ ρ
µ µ⎛ ⎞
= − −⎜ ⎟⎜ ⎟⎝ ⎠
(2.7)

32
different ignition temperatures based on particle size but values are a little over predicted
compared to lower ignition temperatures of nanoparticles.
2.2.7 Experimental Data
Various sources of Aluminum combustion data, along with a brief summary of
their experimental conditions will be discussed in subsequent sections. Different
techniques like gas burner, laser, flash, shock, etc have been used to ignite aluminum
particles. All these experiments have been directed with an aim to find the burning rate
for aluminum. Figure 2.1 below summarizes different techniques adopted in literature to
calculate the ignition point of aluminum under different physical and experimental
conditions.

33
Ambient Gas Concentrations (%) Author Date D0( mµ ) T0(K) P(atm) H2O O2 CO2 CO N2 Ar HCl
Friedman & Macek (Friedman and Maeck, 1962; Friedman and Maeck, 1963)
1962-63 15-67 2510 1 17-18 5-6 12-14 0 63-65 0 0
Davis (Davis, 1963)
1963 60-96 2200-3200 1-204 0.5-50 0-27 9-50 9-41 9-41 0 0-21
Macek (Maeck, 1967)
1967 32-49 2500 1 0-17 8-16 13-43 0 40-58 0 0
Hartman (Hartman, 1971)
1971 23-94 3000-3189 25.5 27-34 0-4 17-23 9-30 13-20 0 0-8
Figure 2.1: Different techniques adopted to calculate ignition point of aluminum (Trunov et al., 2005b)
Table 2.5: Existing experimental data on aluminum at micro-scale
Flat flame burner Ignition of aluminum wire
Bulk sample ignition Thermal analysis

34
Wilson & Williams (Wilson and Williams, 1971)
1971 24-74 298 2-5 0 10-30 0 0 70-90 90 0
Prentice (Prentice, 1974)
1974 250-400 298 1 0-3 15-75 0-50 0 0-80 0-85 0
Turns & Wong (Wong and Turns, 1987; Turns et al., 1987)
1987 300-760 1809-1827 1 29-31 10-25 27-30 15-49 46-64 0 0
Roberts et al. (Roberts et al., 1993)
1993 20 2225-2775 1-34 99 1
Marion (Marion and Gokalp, 1995; Marion and Gokalp, 1996)
1995 35-40 298 1-39 0 21 0 0 79 0 0
Olsen & Beckstead (Olsen and Beckstead, 1996)
1996 40-70 3000 1 66-89 11-16 0-18 0 0 0 0
Melcher et al. (Melcher et al., 1999)
1999 106 2300 13-22 38-41 0-11 12-16 2-9 10 0 18
Dreizin (Dreizin, 1999; Dreizin, 1999b)
1999 90-200 298 1 5-100 5-90 0-95
Zenin (Zenin et al., 1999;Zenin et al., 2000)
2000 185-500 298 1-40 0 0-20 0-100 0 0-80 0-80 0
Table 2.5 summarizes existing experimental data at micro-scales. Davis (Davis,
1963) prepared ammonium per chlorate and para-formaldehyde propellants with less than
1% aluminum by mass. The propellants were ignited in a ‘bomb’ apparatus with
pressures up to 200 atm. Using aluminum particles with initial diameters ranging from
53-103 mµ , an exponent of 1.8 for a burning time expression of nCDτ = was shown,
where C is a constant depending on concentrations of various products in gas phase. An

35
increase in burning rate was also observed as pressure was increased from 20 to 70 atm.
Davis also ignited aluminum particles with a carbon monoxide flame and observed a
flame front several diameters larger than the particle size thus providing evidence for
vapor phase diffusion.
Similar to Davis, Friedman and Macek (Friedman and Maeck, 1962; Friedman
and Maeck, 1963),and Maeck (Maeck, 1967) also created aluminized propellant samples
which burned with pressures ranging up to 135 atm. They noticed production of hollow
spheres for burning at atmospheric pressures and provided some of the first reported
burning time data for aluminum particle combustion. The experiments showed consistent
fragmentation during vigorous burning in oxygen rich environments. In both the studies a
fine oxide smoke and porous or hollow oxide spheres were formed.
Hartman (Hartman, 1971) chose particle distributions with mean diameters of 23,
54, and 94 mµ . In these experiments, modified double base propellants were used to
provide a wider range of oxidizer environments in which aluminum could burn. For
pressures of 19, 26 and 50 atm, he found pressure and environment dependence of
burning rate similar to Davis. He also gave a pressure exponent of 0.4.
Wilson and Williams (Wilson and Williams, 1971) ignited single aluminum
particles with a laser in argon and oxygen atmospheres. They found that argon suppressed
oxide cap formation and without a cap the particles burn in accordance with vapor phase
model, as suggested by Glassman.
Prentice et al. (Prentice, 1974) used lasers to ignite individual particles. In
addition a Xenon flash tube was used to ignite small aluminum foils. Oxide caps did not

36
form in argon and oxygen environment, similar to observations made by Wilson and
Williams.
Wong and Turns (Wong and Turns, 1987; Turns et al., 1987) added aluminum
powder to jet fuel (JP-10) to create slurry droplets with diameters ranging from 500 to
1100 mµ . Upon burnout of Jet fuel, the aluminum agglomerated forming particles of
diameters 300-800 mµ . Using high speed cinematography, they observed smaller flame
fronts for methane flame where water would be present, as compared to dry environment
of carbon monoxide flame.
Robert et al. (Roberts et al., 1993) used a shock tube to ignite aluminum and its
alloys with magnesium at pressures up to 34 atm in almost pure oxygen. Here, the
researchers concluded that the burning time for aluminum was not a strong function of
pressure although a slight decrease in burning time was noticed for an increase in
pressure.
Marion et al. (Marion and Gokalp, 1995; Marion and Gokalp, 1996) measured
burning time of 40 mµ aluminum at pressures of 1 to 40 atm in air using laser for
ignition. Burning times were observed to decrease slightly with pressure increasing from
1 to 4 MPa. They predicted a residual oxide particle approximately 70% the size of
original aluminum particle, increasing slightly with pressure. With nitrogen/oxygen
atmospheres, particles fragmented irrespective of the amount of water vapor present.
Olsen and Beckstead (Olsen and Beckstead, 1996) used a carbon
monoxide/hydrogen flame to ignite aluminum particles one at a time. Particles ranging in
size from 40-80 mµ were chosen under a microscope. They concluded that oxidizer

37
concentration has a strong effect on the particle’s burning rate. They also found that
burning rate exponent changed during the combustion history of particle, ranging from
approximately two at ignition and decreasing towards one at burnout. They explained it
on the basis of increasing fraction of aluminum oxide covering the molten aluminum
sphere.
In addition to the above data, Price et al. (Price et al., 1966) performed a number
of aluminum particle combustion experiments, many of them qualitative, but some of
them quantitative. Their burners used hydrogen, carbon monoxide, and cyanogen
combined with oxygen. Particles ranged in size from 30-400 mµ . Foelsche (Foelsche et
al., 1998) used photodiodes to measure the burning time of a small cloud of aluminum
powder (approx. 22 mµ ) inside a combustion bomb with pressure ranging from 38 to
145 atm. His data compared favorably well with Davis and others but showed a greater
pressure dependency.
Dreizin and Trunov (Dreizin, 1999b) ignited 150 micron Aluminum droplets in
air at room temperature, similar to Prentice’s work. They reported a region of spherically
symmetric burning, followed by two oscillatory regions, with particles giving off smoke
jets and spiraling as shown in Figure 2.2. Dreizin has published a series of papers
explaining this oscillatory phenomenon for micro-aluminum particle (Dreizin, 1995;
Dreizin, 1996; Dreizin, 1999; Dreizin, 1999b; Dreizin, 2000; Dreizin, 2003). The
explanation of asymmetric burning has been given on the basis of deposition of
condensed phase on aluminum surface, extent of dissolution of oxygen at different
places, and hence asymmetric vaporization rate of aluminum, based on thermodynamic

38
phase diagrams. It was also concluded that asymmetric burning is not due to convection
or buoyancy.
Orlandi made an interesting observation (Orlandi and Fabignon, 2000) that as XO2
increases, the gaseous phase reaction approaches aluminum liquid surface. The
concentration of aluminum vapor at the surface is a function of surface temperature.
When the ejection velocity at aluminum surface is small, the vaporization rate depends on
the concentration gradient in the gas phase. As XO2 increases, diffusion rate of oxygen
increases. Corresponding to this the vaporization rate of aluminum increases. To meet
this increase in vaporization rate, the flame region naturally approaches the liquid surface
to steepen the concentration gradient of aluminum in the gas phase near surface. As
temperature increases the flame zone moves away from the surface and also results in an
increase in the burning rate due to an increased vaporization rate.
Most of the work for aluminum has so far been done at micro-scale where
aluminum unlike other particles, like boron or magnesium, burns with a detached flame.
Figure 2.2: Sequence of true color image showing evolution of aluminum particle flame structure upon transition from spherically symmetric to non-symmetric combustion
regime (Dreizin, 1999b)
14 ms 28 ms 34 ms
Particle size: 165 µm

39
2.3 Thermodynamics and Transport Properties
The transport phenomenon has been explained by Jeurgens et al. (Jeurgens et al.,
1999; Jeurgens et al., 2000; Jeurgens et al., 2000b; Jeurgens et al., 2002; Jeurgens et al.,
2002b; Jeurgens et al., 2002c) in terms of aluminum cation motion through the
amorphous film and inward diffusion of oxygen along the grain boundaries in crystalline
films. An explanation is also given regarding the growth kinetics and mechanisms of thin
aluminum-oxide layer on a bare Al substrate in the temperature range of 373-773 K. The
concepts of limiting oxide thickness at temperatures less than 573 K and slower oxidation
stage at temperatures above 573 K can contribute to the development of theory of
heterogeneous oxidation of aluminum nano and micro- sized particles.
Unlike micron-sized particles, the oxidation of a nanoparticle is speculated to be
more of a surface phenomenon. This involves collision of oxygen molecules with the
surface of particle and transport of oxygen through the oxide shell that is being formed as
the reaction progresses. As a result, the diffusion properties of Al and O through oxide
layer are also needed. A survey was done to obtain the diffusion coefficient of various
species in the oxide layer as a function of temperature. Gall et al. (Gall et al., 1995) have
obtained the expressions for diffusion coefficients of Al and O in alumina but in the
temperature range of 1700-2000 K. Further experimental/numerical work needs to done
to get the variation of these coefficients over the whole temperature range of concern for
use in theory or simulations.

40
2.4 Burning Rate
The aluminum combustion is assumed to follow a dn law. This exponent lies
between 1 and 2. As discussed before, the characteristic burning time follows d1 law and
is inversely proportional to pressure under kinetically controlled mechanism. It is
independent of pressure, following a d2 law in a diffusion controlled mechanism.
Typically for aluminum, the values lie between 1.5~1.8. Beckstead et al. have
(Beckstead, 2002) proposed an equation that can be used to estimate the burning times of
aluminum particles based on a compilation of data from various sources.
where 2 2 20.6 0.22eff O H O COX C C C= + + , 41a = for 1.5n = , and 136a = for 1.8n = .
Here p is the pressure in atm, T the temperature in K, D the diameter in mµ , and t the
time in ms. The formula for Xeff was suggested by Brooks to consider the relative
effectiveness of various oxidizers based on experiments.
For experimental studies at micro scales, the main reason for a value of exponent
between 1 and 2 was attributed to the fact that the droplet does not regress uniformly.
There is an inherent assumption in the diffusion controlled model that the spherical
droplet is regressing uniformly. Secondly, it is assumed that the particle burns out to a
diameter of zero, which in practice is not consistent with experimental observations.
Burning time should decrease with a decrease in the oxidizer concentration because in a
diffusion flame, the concentration gradient is the principle driving force for the flame and
so higher concentrations should result in shorter burning times.
0.1 0.20
n
beff
aDtX P T
= (2.8)

41
Changes in the ambient temperature have very little effect on the burning time
and the flame can be seen as a thermal barrier that protects the droplet from ambient
conditions. Flame is closer to the surface with an increase in pressure. Reduction in the
droplet diameter leads to thickening of the flame and increased vaporization mass flow
rate.
2.5 Theoretical Modeling at Micro Scales
Combustion of metals involves the study of chemical and physical processes
simultaneously occurring in three phases i.e. solid, liquid and gas. The assumption of
spherical symmetry simplifies the complexity for the problem and as a result the
combustion can be viewed as a one-dimensional system, allowing full chemical kinetics
and transport processes. To study this complex phenomenon of metal combustion, gas
phase and condensed phase can be modeled and validated separately. After
accommodating the interfacial surface processes through sub models, the full particle
combustion can then be simulated as shown in Figure 2.3

42
Several analytical and numerical models have been developed to gain an in-depth
understanding of aluminum particle combustion. Table 2.6 shows the comparison
between different models introduced and unique contributions of each model (Brooks and
Beckstead, 1995).
Model
Ana
lytic
al
Solu
tion
Diff
usio
n th
roug
h co
nden
sate
Flam
e te
mpe
ratu
re
= f(
oxid
e co
nden
satio
n)
Prod
uct
cond
ensa
tion
on
surf
ace
Con
dens
ed
build
up o
n su
rfac
e
Exte
nded
co
nden
satio
n zo
ne
Kin
etic
s of
Al+
CO
2
Var
iabl
e tra
nspo
rt pr
oper
ties
Mul
tiple
oxi
dize
rs
Flam
e te
mpe
ratu
re
= f(
oxid
izer
s)
Rad
iatio
n ef
fect
s
Con
vect
ive
effe
cts
Brzustowski
(Brzustowski and Glassman, 1964)
Law (Law, 1973) Law (Law and Williams, 1974)
King (King, 1977)
Figure 2.3: Modeling in Combustion Science
Table 2.6: Existing numerical models for micro-scale aluminum combustion (Brooks and Beckstead, 1995)
Parameter Models Molecular dynamics Quantum Chemistry
Thermo-chemical Kinetic
Transport
Research Models Detailed Chemistry
1-Dimensional Laminar
Engineering Models Multidimensional
Complex geometry Turbulence
Simplified Chemistry
Microview Macroview
Gas-Phase Research Models and Experiments
Fuel Particle Combustion Add interfacial Surface Processes to
Gas-phase and Condensed-phase
Condensed-Phase Research Models and Experiments

43
Micheli (Micheli and Schmidt, 1977)
Kudryavtsev (Kudryavtsev et al., 1979)
Gremyachkin (Gremyachkin et al., 1979)
Turns and Wong (Turns et al., 1987)
Bhatia and Sirignano (Bhatia and Sirignano, 1993)
Brooks (Brooks and Beckstead, 1991)
Very early phenomenological models by Glassman (Glassman, 1977) and
Brzustowski (Brzustowski and Glassman, 1964) have been based on hydrocarbon droplet
combustion for volatile metals. They assumed vapor phase diffusion flame. The model
takes into account infinitely fast flame sheet, with fuel and oxidizer reacting in
stoichiometric proportions. Diffusion processes were assumed to limit the rate of
combustion. The maximum gas phase temperature was constrained to the decomposition
temperature of metal oxide.
To include the effects of accumulation of oxide and surface condensation, models
have been proposed by Law (1973), Williams (1974), King (1978), Brooks and
Beckstead (1995), and Marion et al. (1996). Law allowed for diffusion of dissociated
product species like AlO, Al2O from the flame sheet to the particle surface. He later
included an extended oxide condensation zone which was found to be important for low
temperature surroundings. Law’s combustion model accurately predicts the vapor phase
diffusion flame and surface formation of aluminum oxide due to diffusion of sub oxides

44
from the flame. Assumptions include pseudo steady state burning, spherical symmetry,
negligible viscous forces, isobaric conditions, infinitely thin flame zone, Fick’s and
Fourier’s laws, and burning aluminum particles at their boiling points.
Brooks and Beckstead (Brooks and Beckstead, 1991) accounted for accumulation
of surface oxide as an inhibition to the surface processes. The aluminum burning-rate
constant has been found to be a strong function of the oxidizer. Burning was also found
to be a strong function of oxidizer concentration and particle size (Brooks and Beckstead,
1995). The transport properties are calculated by using a weighing factor in this model. In
order to account for change in combustion rate, due to surface coverage, the burning rate
is proportioned according to the surface area covered by oxide to a surface area if no
oxide is present. Oxide cap has been approximated as fractions of attached spheres. The
growth rates are related to volumetric changes which in turn are converted to change in
surface area. However, the size of the oxide cap is to be calculated using the density
corresponding to ambient conditions. Transport property evaluation and diffusion
parameters are found to have a large influence on the burning rate.
King (King, 1977) relaxed the assumption that the kinetics of the reaction was
infinite. He predicted a value of 1.35-1.9 for the exponent n in burning rate law. King’s
numerical studies have indicated that combustion process may be partially kinetically
controlled. He developed a numerical model using the rate data for the reaction:
Al (g) + CO2 → AlO + CO
Aluminum monoxide produced was permitted to react infinitely fast with liquid
aluminum on the surface to form Al2O. The location of aluminum oxide condensation is
determined by specification of condensation temperature. The burning rate exponent was

45
predicted to range from 1.35 to 1.9. Models emphasizing convective effects have been
published in Russian Literature (Kudryavtsev et al., 1979; Gremyachkin et al., 1979)
Bucher et al. (Bucher et al., 1998) have included a full detailed species transport
and didn’t invoke thin condensation sheet approximation. It was also assumed that the
gas-phase kinetics between the particle surface and the flame are much faster as
compared to the mass transport, thus a spatial local equilibrium exists. As a result, there
is no need of kinetic parameters and the process is assumed to be diffusion controlled.
However, the transient processes such as ignition, and extinction cannot be studied with
this assumption. Assuming no buoyancy effects, no forced convection, no Dufor effects,
and negligible dissipation, a one dimensional model can be established for the particle
combustion. Condensation process and growth of condensed phase have not been
included in this model. They have only assumed vaporization of aluminum at the surface
and radiation heat transfer has been neglected. A quasi steady model is taken into
consideration where the particle radius is not allowed to regress. Differences were found
between experimental and simulation results, due to absence of finite rate chemistry and
treatment of Al2O3 as a gas phase species.
Bhatia and Sirignano’s (Bhatia and Sirignano, 1993) model is analogous to Law’s
model and also determines flame and surface temperature from thermodynamics and
vapor pressure data. They also allow for transient heating of particle.
Beckstead et al. have formulated a comprehensive model for the burning behavior
of spherical aluminum particles at several length scales and have proposed mechanisms
of oxide lobe formation, particle regression rate, and ignition criteria. They have
extended the Law’s steady state aluminum combustion model to include the effects of

46
multiple oxidizers, oxide accumulation on the surface, and convection. Assumption of
unity Lewis number is also relaxed by calculating the transport and thermodynamic
properties internally.
A similar study of heterogeneous combustion has been done by King (1993), Li
and Williams (1991), and Kuo (1996) but for boron particles. Detailed models for metal
combustion are limited due to the lack of fundamental data on kinetic rates and transport
properties in gas and condensed phases.
Barlett et al. (Bartlett et al., 2004) studied the combustion of aluminum particles
in methane-oxygen flame and postulated that the combustion of aluminum particles was
not necessarily controlled by a gas phase diffusion mechanism, but instead it was
controlled by the diffusion of aluminum vapor through the oxide shell. This is very
similar to what is observed at the nano scales.
2.6 Chemical Kinetics
Table 2.7 lists the chemical kinetic mechanisms for gas phase reactions of Al2O3.
These have been collected from various sources and compiled together. For some
reactions, there might be two kinetic expressions depending on the source.
No. Reactions A (cm3/mol-s) n E (cal/mol) 1 Al+O2=AlO+O 9.72E13 0. 159.95 Dr. Catorie (Catorie,
2004) 2 Al+O+M=AlO+M 3.0E17 -1. 0. Dr. Catorie (Catorie,
2004) Kuo (Tatum and Kuo,
Table 2.7: Reactions involved in aluminum combustion along with rate constants

47
2003) 3 AlO+O2=OAlO+O 4.62E14 0. 19885.9 Dr. Catorie (Catorie,
2004) 4 Al2O3=AlOAlO+O 3.0E15 0. 97649.99 Dr. Catorie (Catorie,
2004) 5 Al2O3=OAlO+AlO 3.0E15 0. 126999.89 Dr. Catorie (Catorie,
2004) 6 AlOAlO=AlO+AlO 1.0E15 0. 117900 Dr. Catorie (Catorie,
2004) 7 AlOAlO=Al+OAlO 1.0E15 0. 148900 Dr. Catorie (Catorie,
2004) 8 AlOAlO=AlOAl+O 1.0E15 0. 104249.94 Dr. Catorie (Catorie,
2004) 9 OAlO=AlO+O 1.0E15 0. 88549.86 Dr. Catorie (Catorie,
2004) 10 AlOAl=AlO+Al 1.0E15 0. 133199.94 Dr. Catorie (Catorie,
2004) 11 AlOH=AlO+H 1.0E15 0. 114700 Dr. Catorie (Catorie,
2004) 12 AlOH=Al+OH 1.0E15 0. 132000 Dr. Catorie (Catorie,
2004) 13 Al+H2O=H+AlOH 1.14E12 0. 879.8 Dr. Catorie (Catorie,
2004) 14 Al+H2O=AlO+H2 9.6E13 0. 5700 Dr. Catorie (Catorie,
2004) 15 AlO+CO2=OAlO+CO 1.50E10 0. -794.8 Dr. Catorie (Catorie,
2004) 16 Al+CO2=AlO+CO 1.74E14 0. 6400 Dr. Catorie (Catorie,
2004) 17 AlH3+H=AlH2+H2 4.75E09 0. 0.0 Dr. Catorie (Catorie,
2004) 18 AlH2(+M)=AlH+H(+M) 1.46E15 0. 46448. Dr. Catorie (Catorie,
2004) LOW 9.68E14 0. 39664. TROE/5.1 21.6 493. 942./ 19 AlH3(+M)=AlH+H2(+M) 1.48E13 0. 61112. Dr. Catorie (Catorie,
2004) LOW 1.01E15 0. 53826. TROE/0.06 885. 552.
3807/
20 Al+H+M=AlH+M 1.6E17 -0.34 0. Dr. Catorie (Catorie, 2004)
21 AlH+H=Al+H2 1.0E13 0. 0. Dr. Catorie (Catorie, 2004)
22 AlH2+H=AlH+H2 2.0E13 0. 0. Dr. Catorie (Catorie, 2004)
23 Al=Al(l) 1.0E14 0. 0. Ying et al. (Huang et al., 2005)
24 Al2O3=Al2O3(l) 1.0E14 0. 0. Ying et al. (Huang et al., 2005)
25 Al(g) + H2O(g)=AlO+H2 60.5 3.59 525 NISTDatabase (Mallard et al., 1994 ) (298-1174 K)
26 Al(g) + CO2=AlO+CO 6.75E15 0. -10689 NISTDatabase (Mallard et al., 1994) (1500-1880 K)
27 Al(g)+O2=AlO+O 2E13 0. 0. NISTDatabase (Mallard et al., 1994) (300-2000 K)
28 Al(g)+HCl=AlCl+H 3.3E11 0. -3925 NISTDatabase (Mallard et al., 1994) (1000-4000 K)

48
29 Al(l)=Al(g) Beckstead et al. (Widener et al., 1999) Kuo (Tatum and Kuo, 2003) (Surface Reaction)
30 Al(l)+AlO(g)=Al2O(g) Al(l)+AlO(g)=Al2O(g)
Beckstead et al. (Widener et al., 1999) Kuo (Tatum and Kuo, 2003) (Surface Reaction)
31 Al(g)+O2=AlO+O 9.76E13 0. -80 Bucher et al. (Bucher et al., 1996) (Gas Phase) Kuo (Tatum and Kuo, 2003)
32 AlO+O2=OAlO+O 4.63E14 0. -10008 Bucher et al. (Bucher et al., 1996) (Gas Phase) Kuo(Tatum and Kuo, 2003) (Surface Reaction)
33 O+O+M=O2+M 6.17E15
-0.5
0.
Bucher et al. (Bucher et al., 1996) (Gas Phase) Kuo (Tatum and Kuo, 2003)
34 Al2O3=2AlO+1/2O2 Bucher et al. (Bucher et al., 1996) (Dissociation)
35 2AlO+1/2O2=Al2O3(l) 2AlO+CO2=Al2O3(l)+CO 2AlO+H2O=Al2O3(l)+H2
Bucher et al. (Bucher et al., 1996) (Condensation, High rate constants)
36 Al2O+O2=Al2O3(l) Al2O+2CO2=Al2O3(l)+2CO Al2O+2H2O=Al2O3(l)+2H2
Bucher et al. (Bucher et al., 1996) (Condensation)
37 AlO2+AlO2=Al2O3(l)+1/2O2 Bucher et al. (Bucher et al., 1996) (Condensation)
38 Al+CO2=AlO+CO 1.5E11(A1) 8.4E14(A2) 2.5E-13(A1) 1.4E-9(A2)
0.5(n1) 0.5(n2) 0.5(n1) 0.5(n2)
-2050(E1) -27800(E2) -1030(E1) -14000(E2)
Fontijin&Felder ( Fontijin and Felder, 1977) (300-1900K) Kuo (Tatum and Kuo, 2003)
39 Al+H2O=AlO+H2 1.1E12(A1) 9.6E13(A2) 1.9E-12(A1) 1.6E-10(A2)
0.(n1) 0.(n2) 0.(n1) 0. (n2)
880(E1) 570(E2) 443(E1) 2868(E2)
McClean et al.(McClean et al., 1993) (298-1174K) Kuo (Tatum and Kuo, 2003)
40 Al2O=Al+AlO Kuo (Tatum and Kuo, 2003)
41 Al2O2=AlO+AlO Kuo (Tatum and Kuo, 2003)
42 H+H+M=H2+M Orlandi et al. (Orlandi and Fabignon, 2000)
43 O2+M=O+O+M Orlandi et al. (Orlandi and Fabignon, 2000)
44 H+OH+M=H2O+M Orlandi et al. (Orlandi and Fabignon, 2000)
45 O+N2=NO+O 1.8E12 0. -38345 Kuo (Tatum and Kuo, 2003)
46 N+O2=NO+O 6.4E9 0. -3125 Kuo (Tatum and Kuo, 2003)
47 2AlO=AlO2+Al Kuo (Tatum and Kuo, 2003)
48 Al2O+O=2AlO Kuo (Tatum and Kuo, 2003)
49 Al2O+O2=AlO+AlO2 Kuo (Tatum and Kuo, 2003)

49
50 2AlO+M=Al2O2+M Kuo (Tatum and Kuo, 2003)
51 Al+AlO2+M=Al2O2+M Kuo (Tatum and Kuo, 2003)
52 O+Al2O+M=Al2O2+M Kuo (Tatum and Kuo, 2003)
53 Al2O+O2=Al2O2+O Kuo (Tatum and Kuo, 2003)
54 AlO+Al2O=Al2O2+Al Kuo (Tatum and Kuo, 2003)
2.7 Summary and Conclusions
Micron-sized aluminum particles ignite at the melting point of oxide i.e. 2323 K.
In metal combustion like aluminum there are gas phase reactions and also surface
oxidation resulting in volatile and non volatile products which include oxide and sub
oxide species. Micron-sized particle combustion is characterized by some well known
features such as brightness oscillations, disruptive burning, burning droplet speed
variations, oxygen build-up within the molten particle, micro-explosions, asymmetric
combustion, and follows dn burning rate law. The exponent typically lies between
1.5~2.0.
These unique characteristics, along with techniques for generation of aluminum
particles, three stages of combustion, asymmetric burning, diffusion of ions through the
layer, phase transformations, and burning data under different experimental conditions
have been studied and discussed in detail.
Literature on combustion of aluminum indicates that ignition can take place via
two potential pathways. One is the destruction of oxide layer due to cracking, and the
other is self heating due to oxidizer diffusion through the oxide layer, and hence melting

50
of the layer. Various factors like the particle diameter, oxidizing species, pressure, and
temperature affect the burning rate of the particle. It can be concluded that, the difference
in the burning rate exponent among different researchers is as much due to varied data
reduction techniques used, as it is due to the diverse physical conditions of each
experiment. The oxygen concentration has a very pronounced effect on the burning rate.
Higher the concentration of oxide, shorter is the burning time. This is expected because in
the diffusion flame, concentration gradient is the principal driving force for the flame.
Russian work suggests that pressure has very small effect on the burning rate, at least till
20 atm. The differential equation for diffusion contains the product of diffusivity and
density. The product is almost independent of pressure and since diffusivity is
proportional to a 1.65 power of temperature, it is slightly dependent on temperature (0.65
power). All these phenomena and physics at micro-scale are to be used to develop and
extend the theory at nano scales. The explanation of asymmetric burning has been given
on the basis of deposition of condensed phase on aluminum surface, extent of dissolution
of oxygen at different places, and hence asymmetric vaporization rate of aluminum based
on thermodynamic phase diagrams. It was also concluded that asymmetric burning is not
due to convection or buoyancy.

Chapter 3
Nano Scale Aluminum Combustion
3.1 Unique features at Nano Scales
Most of the work so far has been done at micro-scale where aluminum unlike
other particles, like boron or magnesium, burns with a detached flame. However, at nano
scales again depending on the mode of ignition, it is possible that the oxide layer does not
melt. In such a case, the ignition will be heterogeneous till all the molten aluminum is
consumed. At micro-scales there is an issue of diffusion controlled or kinetically
controlled burning. But at nano scales, if the rate limiting step is just diffusion through
the oxide layer, then the whole process is always diffusion controlled. During direct
heterogeneous oxidation at crack site, the process will be kinetically controlled due to
low Damkohler numbers. Phenomena associated with detached flame like spinning of
droplet, instabilities, etc. might not be observed at nano scales at all. After the ignition,
the question of particle burning heterogeneously or with a detached flame is also to be
answered. Nanoparticle oxidation is a very open ended research problem and in this
chapter some key aspects and existing literature on nanoparticle burning will be
discussed.

52
3.2 Oxide Thickness
The aluminum particle is covered with a layer of aluminum oxide. The oxide
layer acts as a passivation layer and protects the aluminum particle from getting ignited.
During ignition, this layer either cracks or melts and hence, the thickness is an important
parameter. The layer has been observed to be of the order of 3~5 nm. In the case of
nanoparticles the thickness of the layer is very important because it reduces the active
aluminum content of the particle. Figure 3.1 shows the Scanning Electron Microscope
(SEM) micrograph of Alex aluminum particles. The particle size ranges from 50 to 250
nm and the oxide layer thickness is around 3.1 nm.
In later sections, an attempt has been made to explain and hence predict the
thickness using thermodynamics. A lot of work has been done by Dreizin (Dreizin, 1995;
Dreizin, 1996; Dreizin, 1999; Dreizin, 1999b; Dreizin, 2000; Dreizin, 2003) emphasizing
the reactions and phase changes occurring within the burning metal in addition to those
occurring on and above the metal surface. The explanation is given on the basis of Al-O
binary phase diagrams. Gas dissolution within the burning metal, ensuing phase changes,
and their effects on combustion are discussed. It also explains the transition from
Figure 3.1: SEM micrograph of Alex Aluminum particles (Risha, 2005) 20,000 times magnification 100,000 times magnification

53
spherically symmetric to non-symmetric combustion regime as discussed in Chapter 2.
The familiar concept of phase-diagrams has been applied here to predict the initial
thickness of passive oxide layer, which is about 3-5 nm.
For experimental work done at nano scales, mostly researchers have used particles
of the range of 50-100 nm and hence have quoted a thickness of the order of 3-5 nm. In
the experimental work done by Eisenreich et al. (Eisenreich et al., 2004), total increase in
the mass of aluminum nanoparticles after oxidation was calculated. This data was used to
obtain the fraction of aluminum particle unavailable for oxidation, which basically is the
fraction of oxide layer. According to their analysis, a value of 0.2 was obtained.
Moreover, the value of 0.2 is a bit over predicted because it has been obtained using only
one type of sample which had a weight increase of 71%. With other samples, they
obtained a weight increase of 85-88%, implying an averaged value 82.75%. This gives
the fraction occupied by aluminum oxide as 0.12, it being in agreement with 0.13
(calculated in the present study using phase diagrams), assuming experimental
uncertainties. This simple correlation using thermodynamics can be used to get a very
good initial guess of the oxide thickness based on particle size. This will be discussed in
detail in Chapter 9.
3.3 Literature Survey
Table 3.1 summarizes some key studies performed on nano-sized aluminum over
a period of past few years.

54
Researchers/ Authors
Particle Size
Ambient Conditions
Experimental Set up Comments/Summary
Eckert et al. (1992)
< 100 mµ Powders milled in argon, hydrogen and oxygen atmospheres
Ball milling used to synthesize particles, Contamination levels studied using EDX, WDX, X ray diffraction and TEM also used for analysis
Synthesis mechanisms, structure and melting behavior at nano scales studied
Dreizin et al. (1995-2003)
100-500 mµ
Burned in air and oxygen environments
Aluminum droplets produced using GEMMED in free fall, emission measured using brightness pyrometer, quenched in Ar/He, wavelength pyrometer, Electron Probe micro analyzer, energy dispersive spectroscopy detector and a wavelength dispersive spectroscopy
Brightness oscillations, burning droplet speed variations, micro explosions, spinning smoke cloud shape, mini jets small secondary particle satellites observed at micro scales and explored the similar phenomena at nano scales
Jeurgens et al. (2000-2002)
aluminum substrates and alumina films
Vacuum, oxygen and air
Low temperature oxidation and structures of alumina studied using x ray photoelectron spectroscopy,
Investigated growth kinetics of alumina on aluminum substrates, structure of alumina films, movement of ions across the film
Assovskiy (2002)
50 nm -3 mµ
Combustion in O2 and CO2+Ar
Normal and low gravity experiments performed. SEM, TEM combined with X ray diagnostics used
Study of clusters and nano-agglomerates in aluminum droplet combustion
Brousseau et al. (2002)
100-200 nm
Cast cured plastic bonded explosives, TNT based melt cast and ammonium nitrate fuel oil formulations tested
Velocity of detonation measured using ionization probes. Heat of detonation measured using detonation bomb calorimeter
Detonation properties of aluminum studied and aluminum content was varied
Kwon et al. (2003)
100 nm Superrfine powders in air
Powders produced by exploding heated wires, SEM, X ray diffraction, chemical analysis performed
Formation of AlN studied, combustion of aluminum in air, reaction mechanisms, and heat release studied
Eisenreich et al. (2004)
20-100 nm Oxygen enviroenment
Particles visualized using SEM, weight analysis using TGA,
Low temperature oxidation of particles studied in oxygen, oxidation occurs in two steps, kinetic parameters determined using TG curves
Risha et al. (2005)
5-8 mµ +100nm
Aluminum particles and air, dust concentration varied from 263-448 g/m3
Laminar flame speed calculation using Bunsen burner dust cloud apparatus, Energy dispersion spectroscopy performed
Laminar flame speed (~22 cm/s)independent of equivalence ratio, increases with introduction of H2,
Meda et al. (2005)
0.17-50 mµ
Aluminum used in AP/HTPB binder
Samples burned in nitrogen flushed window bomb to measure burning rates, XPS, XRD, SEM analyses done
Different propellant formulations investigated by varying aluminum content
Table 3.1: Existing data on aluminum at nano scales

55
Park et al. (2005)
19-150 nm Particles oxidized in aerosol flow reactor at (25-1100 0C)
Aluminum particles produced using DC arc, Oxidation rate studied using single particle mass spectrometer
Size dependant diffusion rates and kinetic rate constants measured
Rai et al. (2005)
100 nm Oxidation in air inside a tube furnace
Aluminum particles generated using DC arc discharge plasma method or laser ablation, Oxidation rate studied using single particle mass spectrometer
Phenomenological model developed to describe oxidation of aluminum nanoparticle based on free molecule formulation
Risha et al. (2006)
5-8 mµ Liquid water and steam
Bunsen burner dust cloud apparatus
Burning rates measurements, burning rate 8.6 cm/s, pressure exponent 0.47, lower flame temperature
Trunov et al. (2005-2006)
50 nm-10 mµ
Oxygen, air Thermal analysis, TGA, heating rates from 5-40 K/min
Focused on polymorphic phase transformations inside alumina and its role in ignition
Risha et al. (2007)
38-130 nm Aluminum and water
Measurements of linear and mass burning rates as a function of pressure, mixture composition, particle size
Linear burning rate of 8.6 cm/s, mass burning rate per unit area increased from 1.0-5.8 for equivalence ratio of 0.5-1.25, inversely proportional to particle diameter
Nano-sized aluminum and other metallic particles can be extensively used in
many propulsion and energy-conversion applications due to their unusual energetic
properties, such as increased catalytic activity and higher reactivity. The application of
nano aluminum particles for propulsive and energetic application has been explored in
many studies (Ilyin et al.,2001; Kwon et al., 1996; Mench et al., 1998). Pivikina et al.
(Pivkina et al., 2004) investigated the effects of nano-sized materials on combustion
characteristics as compared to micro-sized particles in terms of heat release and mode of
combustion. They introduced a new approach for production of nano-composites of some
energetic materials like ammonium nitrate, RDX, and aluminum using vacuum co-
deposition technique. Excess energy of surface atoms, and reduced activation energy
values for chemical reactions contributed to extraordinary chemical activity of
nanoparticles. They also proposed a reduction in time scales of chemical reactions
because of smaller distances. According to this study, the oxidation and other chemical

56
properties of aluminum were determined by cooperative effects arising in Al/polymer.
Figure 3.2 shows the TEM of Al nanoparticles within Al/PPX (poly-para xylene)
composite.
Meda et al. (Meda et al., 2005) also looked at the effect of adding nano-aluminum
to solid rocket propellants. The aim of their work was to study different components
(binder and aluminum powders) of solid propellants to improve performance. Figure 3.3
shows the effect of adding different size aluminum on the burning rate. The propellants
were burned in a nitrogen flushed window bomb and were ignited by hot nickel chrome
wire. The composition of the propellant was 68% ammonium perchlorate, 17% HTPB
and 15% aluminum. The burning rate increased by an order of magnitude by reducing
aluminum particle size.
Figure 3.2: (a) TEM (light field) and SAED of aluminum nanoparticles within Al/PPK
nano-composite (b) Al particle size distribution (Pivkina et al., 2004)
Diameter, nm
Freq
uenc
y, %
Al
Al 50 nm
40
30
20
10
0 0 20 40 60 80 100

57
Brousseau et al. (Brousseau and Anderson, 2002) looked at the detonation
properties of certain explosives after the addition of aluminum powder. No enhancement
was found for plastic-bonded explosives. However, for nano-powder, the increase was
significant. It was also concluded that nano-aluminum reacts faster than regular micron-
sized particles in TNT/Al composites. Figure 3.4 shows the effect of nano-aluminum on
detonation velocities for TNT.
Figure 3.3: Burning rate vs. pressure for propellant with different Al size (Meda et al.,
2005)
Figure 3.4: Effect of aluminum content on detonation velocity for TNT/Al mixes at a
charge diameter of 25.4 mm (Brousseau and Anderson, 2002)
Pressure, bar
Bur
ning
rate
, mm
/s
Al content, %
VoD
, m/s

58
Assovskiy (Assovskiy, 2002) presented some experimental and theoretical
evidences of the important role of clusters and nano-aggregates in the mechanism of
aluminum droplet combustion. The experiments were used to determine peculiar clusters
in case of high pressures. Figure 3.5 shows chains of clusters in the cloud of low gravity
combustion, for a pressure of 60 atm in oxygen and argon environment.
Trunov et al. (Trunov et al., 2005) have used thermogravimetry to study oxidation
of aluminum powder at elevated temperatures. The partially oxidized samples were
recovered from selected intermediate temperatures and oxide phases present were
analyzed by X-ray diffraction as shown in Figure 3.6. Corresponding to the peaks in
diffraction pattern, presence of various oxides was observed. The aluminum powders
were found to oxidize in five distinct stages: namely, growth of amorphous layer,
transformation from amorphous to γ phase, growth of γ layer, transformation from γ to
α , and finally growth of α layer.
Figure 3.5: Chains of clusters in the cloud of low gravity combustion (60 atm, O2 +Ar) (Assovskiy, 2002)

59
3.4 Existing Simplified Models
In addition to some key oxidation characteristics of nano-sized aluminum
particles investigated by researchers, there also exist simplified numerical models to get
some quantitative data. Based on heterogeneous combustion, models have been proposed
by Rai et al. (Rai et al., 2005) and Park et al. (Park et al., 2005). Rai et al. have reported
experimental results on the oxidation of a single aluminum nanoparticle using a
quantitative single particle mass spectrometer. They also have developed a
phenomenological model to describe the oxidation of aluminum nanoparticles based on
free molecule formulation. It has been reiterated that burning of the nanoparticle will be
different from micro-sized particle in a way that it will be heterogeneous and controlled
by diffusion of oxygen through the oxide layer. Park et al. observed oxidation rates using
single particle mass spectrometer. Aluminum particles were generated by DC arc
Figure 3.6: XRD patterns for partially oxidized aluminum powder samples (Trunov et al., 2005)
Inte
nsity
(a.u
)
2 ( )Θ °

60
discharge or laser ablation. They performed size resolved kinetic measurements assuming
diffusion through the oxide. Figure 3.7 shows the kinetic data obtained for aluminum
nanoparticles using SPMS and TGS methods.
Fedorov et al. (Fedorov and Kharlamova, 2003) have suggested a mathematical
model for ignition of a single aluminum particle under steady state conditions based on
the framework of Semenov’s theory of thermal explosion. According to this model, the
experimental dependences of ignition delay on radius and limiting ignition temperature
are described. The growth of the oxidation layer according to this model has been
described using the exponential oxidation law:
where h is the oxide film thickness, h0 the thickness at initial time, E the activation
energy, R the universal gas constant, K the pre-exponent in the oxidation law, Cox the
Figure 3.7: Comparison of kinetic data for aluminum nanoparticles obtained from SPMS
and TGS methods; k is diffusion limited rate constant (Park et al., 2005)
0//e h hm E RTox
dh KC edt
−−= (3.1)

61
oxidizer concentration near the particle surface, and m the order of the reaction. Another
frequently used expression is:
where n determines dependence of oxidation rate on film thickness. The constants were
again determined from the curve fit and Figure 3.8 shows comparison between
experimental and calculated dependences of ignition delay on particle diameter.
Alavi et al. (Alavi et al., 2005) have considered oxidation of aluminum particles
from classical molecular dynamics point of view. Comparisons have been made between
structures and charge distributions. The also observed the tendency towards
fragmentation and oxide layer coating formation in their simulations. Figure 3.9 shows
the evolution of oxidation for a nano-cluster of aluminum.
Campbell et al. investigated the oxidation of aluminum nano clusters based on
dynamic charge transfer among atoms. The simulations were performed for a 20 nm
aluminum particle composed of 252,158 atoms as shown in Figure 3.10. For oxidation
/em
E RToxn
KCdhdt h
−= (3.2)
Figure 3.8: Experimental and calculated dependences of ignition delay on particle
diameter (Fedorov and Kharlamova, 2003)

62
530,720 oxygen atoms distributed randomly outside aluminum were considered.
Formation of a 4 nm thick oxide layer was simulated and structural and dynamic
characteristics of the oxide layer were explored in the process (Campbell et al., 1999).
The simulations consider oxygen in both O and O2 forms (Campbell et al., 2005).
Oxidation of aluminum single crystals was also studied by considering low index
surfaces ((100), (110) and (111)) at room temperature. The mechanism of oxide growth
was again explored and it was found that the growth kinetics is independent of
crystallographic orientation (Hasnaoui et al., 2005). The group performs multimillion
atom molecular dynamics simulations of nanostructures on parallel computers (Vashishta
et al., 2003).
Figure 3.9: (a) Snapshot of structure of pure aluminum nanoparticle at 500 K (b) Radial distribution function for nanoparticle (c) Charge distribution for aluminum particle from
Streitz-Mintmire potential (Alavi et al., 2005)

63
At nano scales, pyrophoricity also becomes an issue. Glassman et al. (Glassman et
al., 1992) have discussed the concept of pyrophoricity in the context with metal ignition.
The study has been applied to finely powdered metals with no protective oxide coating. A
metal is considered pyrophoric when, in its nascent stage, it is small enough that initial
oxide coat which forms due to heterogeneous reactions with air under ambient conditions
generates sufficient heat to vaporize the remaining metal. For a thickness of 25 A , a
particle of diameter 25 nm should be pyrophoric.
Eisenreich et al. (Eisenreich et al., 2004) have investigated the low temperature
oxidation of Al particles. The oxidation of Al-particles down to nano scales was
investigated by TG, SEM and in-situ X-ray diffraction. They have proposed that the
oxidation occurs in two steps. The first step is the building up of a layer of 6 to 10 nm
Figure 3.10: A 20 nm aluminum particle with 4 nm oxide thickness

64
thickness, where the reaction is dominated by chemical kinetics. The second step
combines diffusion and chemical reaction, and proceeds slowly. The kinetic parameters
are obtained using experimental results while fitting it to TG-Curves. The X-ray
diffraction shows that a particle smaller than 1 mµ builds 2 3Al Oγ and 2 3Al Oθ which
later transforms to 2 3Al Oα . The study primarily used Alex (electro-exploded aluminum).
Figure 3.11 shown below shows SEM images of nano-aluminum obtained in the study.
The expressions for conversion of diffusing oxygen were given by
where, On is the oxygen mole number, KR the reaction front, c the concentration, KZ , KE
the frequency factor and activation energy of chemical reaction, and DZ , DE are the
frequency factor and activation energy of diffusion respectively. The authors conclude
that over-simplification limits the applicability and there is significant mismatch between
experimental results and calculated values.
Figure 3.11: SEM images of Al-1and Alex (Eisenreich et al., 2004)
2,4 ( )O
K O Kdn R k T cdt
π∝ − /( ) KE RTKk T Z e−= (3.3)
24K
O OK
r R
dn dcR Ddt dr
π=
⎛ ⎞∝ − ⎜ ⎟⎝ ⎠
/( ) DE RTDD T Z e−= (3.4)

65
Risha et al. recently performed an experimental investigation to determine
laminar flame speeds of micron and nano-sized aluminum particle-laden aerosols using
Bunsen burner type dust cloud apparatus (Risha et al., 2005). The particles of size 5-8
microns and 100 nm were considered. The measured flame speeds were independent of
the equivalence ratio because of the independence of flame temperature. The flame speed
increased with increase in oxygen concentration. The effect of addition of species like
hydrogen that enhanced thermal properties also increased the flame speed. The ignition
of nano-sized particles at low temperatures was supported by this study from the
observation that the addition of nano-sized particles resulted in smaller cone size and less
luminosity. The thickness of oxide layer of 21 nm was however, much larger than the
values reported in literature (2-5 nm).
With renewed interest in under water aluminum combustion, experiments were
conducted to study the effect of liquid and gas phases of water as an oxidizer on both
micron and nano-sized aluminum particles. The flame temperature was lower than
aluminum air or aluminum oxygen flames. Using volume optical pressure vessel, burning
rates of nano aluminum and liquid water were measured. Burning rate of 8.6 cm/s and
corresponding mass burning rate of 6.1 g/cm2s was observed. The pressure exponent was
0.47 and is independent of the equivalence ratio. The results were opposite to that by
Ivanov et al. reporting an increase in pressure exponent due to an increase in
concentration of water. The major difference between the results was the use of gelling
agent used in the experiments conducted by Ivanov et al. As compared to the aluminum
air case this involves heterogeneous combustion, with flame temperatures lower than
aluminum vaporization temperature and close to melting point of the oxide. The work

66
was continued to perform linear and mass burning rate measurements of quasi-
homogeneous mixtures of aluminum and liquid water as a function of pressure, mixture
composition, and particle size.
Study of combustion of nano-sized aluminum particles with various oxidizers in a
well-characterized laminar particle laden flow is also done through numerical and
theoretical approaches. Particles are treated as large molecules in the limiting case in such
a study. The particle laden flow is modeled as a one-dimensional, laminar, steady flow of
premised gas mixture and flame structure is investigated (Huang et al., 2005). In the
molecular limit, the numerical results indicate that the flame speeds of an aluminum
mixture with air are significantly higher than that with H2O, mainly due to the greater
reaction rate of Al with O2 versus H2O. The kinetic bottleneck results from the Al2O3
formation, in which O atoms play an influential role, in the aluminum-steam system. For
micro-sized particles, the theoretical analysis shows that the aluminum-steam flame
speed is slightly larger than that of an aluminum-air mixture. Flame propagation in a
bimodal nano and micro-sized aluminum particle mixture with air is studied in a separate
study (Huang et al., 2006; Huang et al., 2007). For a mono-dispersed particle laden flow,
the flame speed increases with increasing particle concentration under fuel-lean
conditions, but with decreasing particle size. A companion numerical model, which treats
very fine aluminum particles as large molecules, is developed to obtain the flame speed at
the molecular limit. For a bimodal particle laden flow, the flame structure may display
either an overlapping or a separated configuration, depending on the combustion
properties of aluminum particles at different scales. At low percentages of nanoparticles
in the fuel formulation, the flame exhibits a separated spatial structure with a wider flame

67
regime. At a higher loading of nanoparticles, an overlapping flame configuration is
observed. Ying et al. also proposed a burning rate correlations based on data fit for nano-
sized aluminum particles.
where d is the particle diameter in cm, C2 is 45.5 10× , Eb is 73.6 kJ/mol and Ru is the
universal gas constant.
3.5 Comparison with Micro Scale Combustion
3.5.1 Heterogeneous vs. Homogeneous Mechanism
At micro-scale, there are different types of modes of ignition. One of the modes
can be like that of magnesium. Magnesium has a melting point and boiling point of 923
K and 1363 K, respectively. The oxide has a melting point of 2915 K. Thus, as the
temperature rises magnesium melts, boils and builds up the pressure in the un-molten
oxide shell. Finally, the shell is shattered and particles do not burn with any surface or
flame temperature. In the case of boron, the melting and boiling point exceeds that of the
oxide. As the temperature increases, the oxide shell melts and then vaporizes. The
vaporization of boron oxide coincides with the melting of boron and the oxidizer reacts
heterogeneously at the surface. The flame temperature is limited to the boiling point of
the oxide that is formed.
0.3
/2 .b ub E R T
eff
dC e X
τ −= (3.5)

68
The melting point and boiling point of aluminum are 933 and 2791 K,
respectively. For the oxide, the melting and boiling points are 2327 and 4000 K. As the
temperature rises, the aluminum melts first, then oxide melts and coalesces allowing the
Al vapor to diffuse to a gas phase flame, and the particle ignites. Thus, aluminum burns
in a gas phase reaction where flame front is at a detached distance of 1.5-4.0 times the
droplet radius from the droplet surface. The hot oxide products dissociate outward, and
Al2O3 condenses and forms a smoke cloud that emits thermal radiation at a temperature
of 3800K. At nano scales, due to smaller length scales, the reactions are primarily
heterogeneous at the surface of the particle. The particles have been observed to ignite
close to the melting point of the aluminum core and the ignition point shows a large
variation in values for different experimental studies. The whole particle is consumed by
the time the boiling point of the aluminum is reached, due to heterogeneous reactions,
with oxygen either diffusing through the layer or directly reacting at the surface.
3.5.2 Diffusion vs. Kinetically Controlled Mechanism
Combustion of metal particles also involves chemical and transport time scales.
These can be compared to further classify the mode of combustion mechanism. If the
reaction rates are slow compared to the rates of mass and energy diffusion, the spatial
non-uniformities can be eliminated and the process is kinetically controlled. But fast
reaction chemistry leads to temperature and species spatial gradients which cause
conduction and diffusion of heat and species respectively, leading to diffusion controlled
mechanism.

69
To determine the dominant combustion mechanism (Yetter and Dryer, 2001) the
Damkohler number, Da, for surface reaction is defined as:
This quantitative analysis shows that very small particles at low pressures
generally burn under kinetically controlled conditions. Similarly, larger particles at high
pressures with a very high probability will undergo a diffusion controlled mechanism. As
a result, the characteristic burning time follows d1 law and is inversely proportional to
pressure under kinetically controlled mechanism. It is independent of pressure, following
a d2 law in a diffusion controlled mechanism.
At micro-scale, the aluminum droplet burning rate follows d2 law which
theoretically implies diffusion controlled mechanism (Beckstead, 2002). It is also
speculated that because of the geometry of nano-sized particles, the oxidizer species need
not diffuse across a relatively large distance before reaching the particle surface. This
results in significantly shorter diffusion times and could lead to a chemical-kinetic-
controlled situation. Figure 3.12 shows experimentally observed burning time for
aluminum as a function of particle diameter.
, 0 ,
, ,4 ln(1 )b diff p o
b kin o
t MW kPd XDa
t D Yρ ν∞
∞
= =+
(3.6)

70
3.5.3 Mode of Ignition
Figure 3.13 shows a compilation of results in literature showing the observed
ignition temperature vs. particle diameter. It can be seen that the particles with size
greater than approximately 1 micron show ignition at around 2327 K, which is the
melting point of oxide layer. However for particle sizes below 1 microns, a wide range of
observed ignition temperatures are observed down to as low as 940 K, which coincides
with the melting point of aluminum core.
Figure 3.12: Experimentally observed aluminum particle burning time as a function of
particle diameter (Huang et al., 2006)
Particle diameter, µm
Bur
ning
time,
ms
10-2 10-1 100 101 102 10310-1
100
101
102
103
104
105Wilson and Willams [27]Wong and Turns [29]Prentice [28]Olsen and Beckstead [30]Hartman [26]Friedman and Macek [21]Davis [25]Parr et al. [9] (T0=1500 K)Parr et al. [9] (T0=2000 K)Models
d0.3
d1.8
1500 K
2000 K
3500 K

71
3.5.3.1 Cracking vs. Melting of Oxide Layer
As mentioned before, there is a diversity of opinion regarding the ignition of
aluminum particles. Researchers like Ermakov et al., Boiko et al., Lokenbakh et al.,
Boiko et al., Rozenband, and Vaganova (Lokenbakh et al., 1985; Boiko et al., 1989), all
have concluded that ignition can occur due to the failure of oxide shell integrity and not
necessarily melting. Ignition can occur by fracture of the oxide shell due to the
mechanical stresses caused by thermal expansion.
From the experimental work done by other researchers at micro-scale, it is
observed that the ignition temperature coincides with the melting point of Al2O3 layer,
i.e. ~2327K (Bucher et al., 2000). This is due to the impervious nature of aluminum
oxide, which inhibits ignition.
However, at nano scales the particles get ignited at a much lower temperature
which is near the melting point of aluminum, i.e. ~933K. Oxidation of alumina coated
××
× × ×××××
× × ×× × ×
Particle diameter, µm
Igni
tion
Tem
pera
ture
,K
10-1 100 101 102 103 104 1050
500
1000
1500
2000
2500
bulk alumina
bulk aluminum
Figure 3.13: Ignition temperature of aluminum particle as function of particle diameter
Friedman et al., 1962Belyaev et al., 1968Fedoseev et al., 1970Alekseev et al., 1971Merzhanov et al., 1977Derevyga et al., 1977Ermakov et al., 1982Yuasa et al. 1997Brossard et al., 1997Zhu et al., 1998Assocskiy et al., 1999Johnson et al., 2000Parr et al., 2003Bulian et al., 2004Trunov et al., 2004
×

72
nano-aluminum particles is presumably initiated by the melting of aluminum core and
subsequent rupture of the oxide coating (Rai et al., 2004). This occurs when the layer is
subjected to mechanical stresses caused by density differences due to rapid heating. This
difference in the mode of ignition can be explained on the basis of simple heat transfer
and solid mechanics analysis. The bulk modulus of Aluminum is 76 GPa and upon
melting, the density changes from 2.7 g/cc to 2.4 g/cc (Rai et al., 2004). From solid
mechanics, a pressure of 83340 atm is developed as a result of phase change. Comparing
with ultimate tensile strength of oxide layer, it has been shown that the oxide layer cannot
sustain this stress developed due to pressure inside the shell, formed by oxide layer.
Chapter 8 and 9 discuss these in detail from numerical and theoretical viewpoint
respectively.
3.5.3.2 Thermodynamic Explanation
Fourier number analysis further explains the whole phenomenon. As the particle
size decreases to nano scales, this ratio increases and hence, the shell conducts heat
easily. This eventually melts the aluminum core before the shell melts and results in
rupture at around 933K. In the case of a micro-sized particle, the energy stored is more as
compared to conduction. This high thermal resistance to conduction results in rapid
heating and eventual melting of the shell before the solid core.
It has been reported recently that aluminum nanoparticles can ignite as measured
by thermogravimetry (TGA) and differential thermal analysis (DTA), at a temperature of
about 820 K which is close to the melting point of aluminum. Ashish et al. conducted

73
experiments on aluminum nanoparticles and found that for particles of 20-30 nm size
with a coating of less than 3 nm, the ignition and rupture was found to occur at around
940 K which is again close to the melting point of aluminum. Such a speculation has
been made because of high pressure developed inside the oxide shell which is
dynamically unstable upon melting of the core. Moreover, because of higher curvature it
is also under higher tension and should rupture with ease as compared to large particles.
The reason for lower prediction of about 800 K by other researchers was attributed solely
due to the technique used. Such dynamic thermal techniques such as thermogravimetry
were thought to have high uncertainties associated with the heat and mass transfer
(Ortega, 2001). A more sound explanation of cracking has been given on the basis of
phase transformations of the oxide layer. According to Dreizin, the oxide layer
transforms from amorphous to gamma and alpha phases. Because of the density
differences during the transformation, the layer develops cracks which lead to direct
oxidation and hence self heating. The current research also takes into account cracking
but the cause of cracking is two fold and has been explored. All these have been
explained in detail in Chapter 9 using a combined study of length and time scales
involved.
3.6 Summary and Conclusions
From the existing literature, it can be concluded that modeling for nano-aluminum
is still in nascent stages. All the existing models agree that nano-aluminum particle
burning is different from micro-size particle burning. In case of direct oxidation at the

74
nano scales, the process is kinetically controlled due to small diffusion scales involved. In
case of heterogeneous oxidation through the oxide layer, the process is diffusion
controlled due to slow diffusion of aluminum cations or oxygen anions. In case of
heterogeneous oxidation through the direct attack of oxygen molecules, the process is
kinetically controlled with low Damkohler numbers.
The ignition stage always starts with heterogeneous reactions and phase
transformations and ignition is observed at relatively lower temperatures as compared to
the micro-scale. Cracking in the oxide layer can occur either due to the phase
transformation of aluminum oxide or thermal expansion caused by the melting of the
solid core. This leads to ignition. Due to fast rate of heterogeneous reactions, the particles
are totally consumed in a pure heterogeneous fashion till the time the boiling point of
aluminum is reached and there is no detached flame front formation.
All the phenomenological models form an expression based on diffusion of
oxygen and then calculate the model’s parameters based on experimental data to match
the observed phenomenon. There is still a lot of work to be done to explain the
phenomena of agglomeration, pyrophoricity, ignition, and burning rate. A model/theory
should be developed that accounts for all the issues of diffusion through the layer,
pressure gradients, phase transformations, and cracking/melting of layer, rather than just
calculating parameters based on experimental data.

Chapter 4
Nano Scale Simulations
4.1 Molecular Dynamics Simulation Framework
Molecular Dynamics is a computer simulation technique that helps in predicting
the time evolution of a system of interacting particles (atoms, molecules etc.). The
macroscopic properties are then computed based on the aggregate particle positions and
velocities. Molecular dynamics conceptually is the simplest example of
stochastic/deterministic methods. A large number of atoms are chosen and assigned
initial positions. Then, Newton's equations of motion are solved assuming a classical
force function. The simulation is monitored and the desired properties are measured and
averaged over time. First MD simulation was reported in 1957 by Alder and Wainwright
investigating solid fluid transition for 500 particles at University of California Radiation
Lab (Alder and Wainwright, 1957). Rahman (Rahman, 1964) in 1964 used L-J potential
to simulate 864 Argon atoms at University of Illinois. Evans and Hoover also highlight in
an article that Fermi began Molecular Dynamics studies with 16 particles (Hoover, 1985).
Molecular Dynamics simulations gained popularity in material science in 1970s with
applications in the areas of defects, interactions, fracture, melting, and alloys. It has also
been used in quantum chemical models by chemists, for drug design, study of structure of
membranes, dynamics of large molecules, protein folding in biochemistry, as a part of
dynamical systems in theoretical physics, symplectic integrators & statistical mechanics

76
by mathematicians and to simulate correlated many body motions. It has also been used
to support chemistry and biology research for many years.
Molecular dynamics simulations are valuable tools but they are computationally
demanding. One of the requirements for efficient parallel operations is the even loading
of the computations across all the processors. A three dimensional molecular dynamic
code has been developed in this research for the transient studies. Before proceeding with
the details of the work performed to investigate some of the issues at nano scales using
molecular dynamics, a review of molecular dynamics is provided. This chapter covers
fundamental concepts which were utilized to develop the simulation codes. More detailed
molecular dynamic coding requirements and the implementation of parallel molecular
dynamic algorithms is discussed in Section 4.7.
The length and time scales in the physical world can be divided into four major
categories (Nano, Micro, Meso and Macro). Each category has its own set of applications
and numerical tools to address the research issues. A detail is shown in Table 4.1.
Scale Length Scale Time Scale
Applications Models
Nano
10-9-10-7 m
10-14-10-10 s
Atomic level, dislocations, vacancies etc.
Microscopic/Atomistic Models: Classical Molecular Dynamics, Metropolis Monte Carlo, Ab Initio MD, Quantum Monte Carlo
Micro
10-8-10-6 m
10-11-10-8 s
Cracks, defect interactions, nucleation
Microscopic/Atomistic Models: Classical Molecular Dynamics, Metropolis Monte Carlo, Ab Initio MD, Quantum Monte Carlo
Meso
10-7-10-4 m
10-9-10-3 s
Grain size simulations, re-crystallization, fracture, collective dynamics of microstructure
Mesoscopic Models: Dislocation Dynamics, Cellular Automata, Kinetic Monte Carlo
Macro
>10-3 m
>10-3 s
Mechanics, structure etc. Continuum models: Partial differential equations, Finite Difference Methods, FEM
Table 4.1: Various length and time scales in physical world (material science)

77
Molecular dynamics simulations are used as tools for studies performed at nano
and micro scales. However like any other numerical technique it has some constrains and
limitations. In any MD simulation, the electrons are represented through a potential
energy surface and that surface is approximated by an analytic function (discussed in
detail in section 4.2). In classical description, the Schrödinger equation for nuclei is
replaced with classical motion. The quantum effects can only be considered negligible if
the de Broglie wavelength is much smaller than the inter particle distance. Inter atomic
spacing is of the order of 1-3 Angstroms and De Broglie wavelength can be expressed
using
where, thΛ is the wavelength, h the Planck's constant, m the mass of the atom, Bk the
Boltzmann's constant, and T the temperature. Values for some of the elements at room
temperature are
0
0
0
0
1 (300 )
0.19 (300 )
0.16 (300 )
0.07 (300 )
th
th
th
th
for a H atom K
for a Si atom K
for an Ar atom K
for a Au atom K
Λ = Α
Λ = Α
Λ = Α
Λ = Α
In terms of simulation time scale, the maximum time step is limited by the fastest motion
in the system. The integration time step must also be smaller than the mean free time of
atoms which can be approximated as
2thB
hmk Tπ
Λ = (4.1)
130 7.9 103 /B
r sk T m
−= × (4.2)

78
where 0r is the mean free path and other symbols have their standard meanings. Since the
vibrational frequencies of the order of 10 fs, the time step must be large enough to
capture the effect. Due to the upper limit on time step, only few nanoseconds or
picoseconds of simulation is possible because of the computational costs involved. Due
to memory constraints also, it is not possible to simulate very large systems. Storing
positions and velocities of atoms requires memory of the order of gigabytes. In any case,
the length scale of the simulation must be large enough to simulate the physical domain
without boundary conditions disrupting the behavior and must be limited by constraints
involved due to computational costs.
4.2 Potential Functions
Intermolecular forces are computed based on intermolecular potential functions.
The classical conservation of energy using Newton’s laws can be written as
which can be rewritten as
In making transition to a wave equation the physical variables take the form of
“operators”
2 21 12 2
mv kx E+ = (4.3)
221
2 2p kx Em+ = (4.4)
22
2
12 2
p H kxi x m x∂ ∂
→ → − +∂ ∂
(4.5)

79
and transforms to Schrödinger equation H EΨ = Ψ . In order to approximate solutions to
Schrödinger equation, Born-Oppenheimer Approximation is invoked (Born and
Oppenheimer, 1927). According to this approximation, electronic and nuclear motion in
molecules can be separated and electronic wave function depends upon nuclear positions
but not on their velocities. This can be written as
where ψ is the wave function, and ,i ir R are position vectors for electron and nuclei
respectively. In general nuclear motion is so slower than electronic motion that the nuclei
can be considered fixed and it sees a smeared out potential from the speedy electrons.
The speed of electron and nucleus can be compared using the ratio of their masses
The problem hence can be reformulated in terms of two separate Schrödinger
equations. The equation of electronic problem gives the Eigen value of energy as a
function of atomic positions, which depends parametrically on the coordinates of nuclei.
This is called inter atomic potential.
In classical MD, the Schrödinger equation is replaced with the Newton equation if
de Broglie thermal wavelength is small. The electrons are represented through a potential
energy surface which is a solution of the electronic Schrödinger equation within Born-
Oppenheimer approximation. However these surfaces are not available for most of the
practical problems and approximation of actual solution of the Schrödinger equation
through the potential function difficult. The potentials can have an assumed functional
( , ) ( , ) ( )molecule i i electrons i i nuclei ir R r R Rψ ψ ψ= (4.6)
~ ~ 100el
n
Mm
ωω
(4.7)

80
form and then parameters can be optimized to reproduce by a set of experimental data
e.g. structural (cohesive energies, elastic constants, elastic moduli), and thermodynamic
(melting point, latent heat). These are called empirical functions like Lennard Jones.
Sometimes, electronic wave function can be calculated and one can obtain semi-empirical
potentials using some approximations e.g. Glue potentials. On the extreme side one can
perform direct quantum mechanical calculations and these are called ab-initio MD
simulations. Any potential to be used extensively should have three basic characteristics:
1. Accuracy- It should be able to reproduce properties as closely as possible
2. Transferability- It can be used to study properties for which it is not fit
3. Computational speed- it should be able to help in fast calculations
Potential function in most generalized form can be written as
where 1U is called one body term, due to external field, 2U is called two body term and
potential approximating till this point is called pair potential. This implies that interaction
between a pair of atoms depends only on the spacing and not effected by other atoms. 3U
is a three-body term and implies that other atoms also influence the interaction between
two atoms. Thus potentials are either two body or many body. In literature aluminum has
been modeled using different potentials. In this research, five potentials have been chosen
on the basis of frequency of usage in literature. The potential functions considered are the
two-body Lennard-Jones potential, many-body Glue potential, embedded atom potential,
Sutton-Chen potential and Streitz-Mintmire potential (which also considers charges on
atoms). Other than these five potentials, Vorter-Chen potentials (Vorter and Chen, 1987),
( ) ( ) ( ) ( )1 2 1 2 2, ,..., , , , ...n i i j i j ki i j i i j i k j
U r r r U r U r r U r r r> > >
= + + +∑ ∑∑ ∑∑∑ (4.8)

81
Finnis-Sinclair potential (Finnis and Sinclair, 1984) and Mei-Davenport potentials (Mei
and Davenport, 1992) were also found to be commonly used in MD studies for
aluminum. Vorter and Chen have been used in a numerical work done by Sebetci et al. to
study clusters of aluminum (Sebetci and Guvenc, 2005). Sturgeon (Sturgeon and Laird,
2000) and Song (Song and Morris, 2003) worked on thermodynamic properties of
aluminum using variations of the Mei and Davenport potential. Some potentials for
aluminum are specifically developed to perform a particular numerical study. For
example potentials were developed by Tomar (Tomar and Zhuo, 2006) and Johnson
(Johnson, 1988; Johnson, 1989) to study mechanical strength for nano crystalline Al-
Fe2O3 system and alloy compositions respectively. Cleri-Rosato potential developed for
transition metals and alloys has an analytical form that can be used to reproduce the
thermal behavior of transition metals making use of a small set of adjustable parameters
(Cleri and Rosato, 1993). Morse potential for diatomic molecules can be obtained from
Schrödinger equation representing the motions of nuclei in a diatomic molecule (Morse,
1929) and Girifalco et al. describes in detail the constants used in this potential (Girifalco
and Weizer, 1959). There also exist Pseudo potentials that can be sued to calculate
thermodynamic properties for metals like Li, Na, K and aluminum (Jones, 1973). Out of
these five potentials, except the Lennard-Jones potential, all other four potentials are
many-body potentials and only Streitz-Mintmire potential is capable of handling both
aluminum and aluminum oxide using a method for charge equilibrium.
The Lennard-Jones potential is defined as
( ) ( )12 6( ) 4LJ LJ LJ LJV r r rε σ σ⎡ ⎤= −⎣ ⎦ (4.9)

82
where LJε and σ are the empirical parameters accounting for the depth of the potential
well and the distance between two atoms at which the potential is zero, respectively.
Their specific values of / 4551Bk Kε = and 2.62σ = Α were provided by Halicioglu et
al., based on the physical properties (such as lattice constants, heat capacity, and thermal
expansion constant) for crystalline-state aluminum ( Matyushov and Schmid, 1996;
Halicioglu and Pound, 1975). Figure 4.1 shows the variation of the potential as a function
of the distance between the atoms.
The Glue potential is defined by a pair potential, ( )rϕ , an atomic density
function, ( )rρ , and a Glue function, ( )U ρ . Ercolessi et al. presented a scheme to extract
numerically optimal inter-atomic Glue potentials from the results produced by first-
principle calculations involving electronic structures (Ercolessi and Adams, 1994). The
potential has also been used and well tested for other metals like gold (Au) (Ercolessi and
Tosatti, 1986; Ercolessi et al., 1988). The method is based on fitting the potential to ab
initio atomic forces of diverse atomic configurations including surfaces, clusters, liquids,
r (nm)
V(J
),10
-3eV
0.25 0.50 0.75 1.00-50.0
-25.0
0.0
25.0
50.0
75.0Aluminum
Figure 4.1: Lennard-Jones potential for aluminum

83
and crystals at different temperatures. Figure 4.2 shows the three functions constituting
the optimized Glue potential for aluminum. The functional form for the Glue potential is
The difference between the two-body Lennard-Jones and the many-body Glue
potential can be analyzed by comparing Figs. 4.1 and 4.2. In the Lennard-Jones potential,
the potential energy surface is represented using a single expression which captures both
the attractive and repulsive forces between two atoms as a function of their separation.
The Glue potential, however, consists of two functions. The first function ( )ijrϕ bears a
,
1 ( ) ( )2glue ij ij
i j i jV r U rϕ ρ⎛ ⎞
= + ⎜ ⎟⎝ ⎠
∑ ∑ ∑ (4.10)
ρ
U(e
V)
0.00 0.25 0.50 0.75 1.00-3.0
-2.0
-1.0
0.0
r (A)
ρ(r
)
2 3 4 5
0.00
0.02
0.05
0.07
0.10
r (A)
ϕ(r)
(eV
)
2 3 4 5-0.50
-0.25
0.00
0.25
0.50
0.75
1.00
Figure 4.2: Glue potential for aluminum

84
close resemblance to the Lennard-Jones potential and captures repulsive forces when the
separation between atoms is small. The second part, ( )U ρ , known as the Glue function,
characterizes the effect of atomic density on the forces between two atoms. Since metals
feature strong cohesive forces, many-body potentials can be more effective in predicting
metal properties accurately than the Lennard-Jones potential. Glue potential falls under
the category of a particular type of potentials called embedded atom potentials. These
potentials are semi-empirical, many-atom and are used especially for metallic systems to
investigate problems like point defects (Daw and Baskes, 1984), melting, thermal
expansion (Foiles and Daw, 1998), other thermodynamic properties (Foiles and Adams,
1989), alloying (Foiles et al., 1986; Foiles and Daw, 1986b), grain boundary structure,
dislocations, segregation (Foiles, 1985), fracture (Hoagland et al., 1990), surface
structure, calculation of cohesive energies (Daw, 1989) etc. A comprehensive review of
these has been provided by Daw et al. (Daw et al., 1993).
The Sutton-Chen potential extends the empirical N-body potentials, originally
developed by Finnis and Sinclair for description of cohesion in metals (Joswig and
Springborg, 2003), to include a long-range modification using the van der Walls tail
(Sutton and Chen, 1990). This potential takes the form
The constants ε , c and a have values of 0.033147 eV , 16.399 , and 4.05Α
respectively. The functional form is similar to the Glue potential because of the presence
( )
( ) ( ) ( )7 6
12
;
SC SC ij ii j i i
ij ij i ijj i
V V r c
V r a r a r
ε ρ
ρ
≠
≠
⎡ ⎤= −⎢ ⎥
⎣ ⎦
= =
∑∑ ∑
∑ (4.11)

85
of pair potentials and atomic-density-dependent terms. Figure 4.3 shows the functions
used in the description of Sutton-Chen Potential.
The Streitz-Mintmire potential has the same functional form as the Glue and
Sutton-Chen potentials, but includes electrostatic forces due to the charges on atoms
(Streitz and Mintmire, 1994; Keffer and Mintmire, 2000). It consists of two parts: an
embedded-atom part and an electrostatic part accounting for charges on atoms. The
embedded-atom potential used in the current study is a modification of the Streitz-
Mintmire potential, consisting of only the embedded-atom part of the complete potential.
r (A)
V(e
V)
2.0 2.5 3.0 3.5 4.0 4.5 5.0
0
50
100
150
r (A)
cερ0.
5
0 25 50 75 100
0.0
2.0
4.0
6.0
r (A)
ρ(r
)
2.0 2.5 3.0 3.5 4.0 4.5 5.0
0
25
50
75
Figure 4.3: Sutton-Chen potential for aluminum

86
The electrostatic part and associated charge development are not considered. The
embedded-atom part of the potential is defined as
where ( )i iF ρ represents the energy required to embed atom i in electron density iρ , and
( )ij rϕ the pair-wise interaction. The parameters used in the above functional forms for
aluminum are
The pair potential, as also seen in other potentials, becomes strongly repulsive at
smaller distances. The functions used in embedded-atom part of Streitz-Mintmire
potential are shown in Figure 4.4. The electrostatic part is given by
( ) ( )
*
* *
( )
*2
[ ] ( )
( )
( )
( ) 2 1 ( )
j ij j
ijij ij
EAM i i ij iji i j
r ri j
i j
ii i i
i
r r r rij ij ij ij
V F r
r e
F A
r B e C r r e
β
βα
ρ ϕ
ρ ξ
ρρξ
ϕ α
<
− −
≠
− − − −
= +
=
= −
⎡ ⎤= − + −⎣ ⎦
∑ ∑
∑ (4.12)
* * *
1 1 1
0.147699; 1.0
3.365875 ; 2.358570 ; 2.005092
2.017519 ; 4.507976 ; 6.8713290.763905 ; 2.116850
0.075016 ; 0.154548 ; 1.69
Al O
Al Al Al O O O
Al Al Al O O O
Al O
Al Al Al O O O
r r r
A eV A eVB eV B eV B
ξ ξ
β β β− − −
− − −− − −
− − −
= =
= Α = Α = Α
= Α = Α = Α
= == = =
1 1 1
31450.159472 ; 0.094594 ; 1.865072
1.767488 ; 4.233670 ; 8.389842Al Al Al O O O
Al Al Al O O O
eVC eV C eV C eV
α α α− − −
− − −− − −
= = =
= Α = Α = Α
(4.13)
0 0 2
3 31 2 1 2 12
1( ) ( ; ; )2
1( ) (0)2
( ; ; ) ( ; ) ( ; ) /
ES i i ij ij i ji
i i i i i i i
ij ij i j i i j j
V v q v r q q
v q v q J q
v r q q d r d r r q r q r
χ
ρ ρ
= +
= + +
=
∑
∫ ∫
(4.14)

87
where ( )i iv q is the local atomic energy, 0iχ the electro negativity, and 0
iJ the second
derivative associated with the self-Coulomb repulsion. ( ; ; )ij ij i jv r q q denotes the
electrostatic interaction energy between atoms i and j . The charge density distribution,
( ; )i ir qρ for a Slater 1s orbital about atom i for a charge iq , is defined as
where iζ is the decay length for the atomic orbital, and iΖ the effective core charge.
Further simplification of the interaction energy using an analytical expression for
Coulomb integrals (Roothan, 1951) yields
The constants in the above integrals are given by
32( ; ) ( ) ( ) i ir ri
i i i i i ir q r r q Z e ζζρ δπ
− −⎛ ⎞= Ζ − + − ⎜ ⎟
⎝ ⎠ (4.15)
( )
( ) ( ) ( ) ( )
( ) ( )
0 2 0
2 222
22 3
1 1 1( ) ( ) ( )2 2
1 1( ) 2 2
4 411 3 1( ) 18 4 6
1( )
ji
i
ES i i j i ij ij ij i i i j ij iji j i i j i ij
rrij i j i j
r
ij i i i i j
jj
V q Z r r q J q q rr
r r e r e forr r
er r r r forr
r
ζζ
ζ
χ ω υ υ
κ κυ κ ζ κ ζ ζ ζ
υ ζ ζ ζ ζ ζ
ζω
≠ ≠
−−
−
⎛ ⎞⎡ ⎤= + − + + +⎜ ⎟⎢ ⎥ ⎜ ⎟⎣ ⎦ ⎝ ⎠
− += − + + − − + ≠
⎧ ⎫= − + + + =⎨ ⎬⎩ ⎭+
= −
∑ ∑ ∑ ∑
( ) ( )
2
2 2 2 2/
j r
i j i j
re
rζ
κ ζ ζ ζ ζ
−
= + −
(4.16)
0 0
0 0
1 1
0.0 ; 5.4847630.746759; 0.0
10.328655 ; 14.035715
0.968438 ; 2.143957
Al O
Al O
Al O
Al O
eV eVZ Z
J eV J eV
χ χ
ζ ζ− −
= == =
= =
= Α = Α
(4.17)

88
Using dynamic charge transfer, the charges iq on each atom are calculated by
minimizing the electrostatic energy (i.e., the electro negativity equalization condition)
(Rappe and Goddard, 1991), subject to the charge neutrality constraint, 0ii
q =∑ . This
yields a set of linear equations
and charges are obtained using ;i i i i ii i
s t q s tµ µ= = −∑ ∑ . Because of the functional
form of the potential, and the way in which the constants are defined, the Streitz-
Mintmire potential can be used for Al-O, O-O and Al-Al interactions
; 1ij j i ij jj j
V s V tχ= − = −∑ ∑ (4.18)
rij (A)
ϕ ij(r
ij)
2.0 3.0 4.0 5.0 6.0
0.0
1.0
2.0
3.0
rij (A)
ρ i
2.0 2.5 3.0 3.5 4.0
0.0
1.0
2.0
3.0
ρi
F i(e
V)
5 10 15 20 25 30 35
-10
-5
0
Figure 4.4: Streitz-Mintmire potential for aluminum

89
4.3 Equations of Motion
The displacement of each atom in a molecular dynamic simulation is based on
Newtonian particle dynamics. The atomic accelerations are a direct function of inter-
atomic forces. These forces are conservative, non-dissipative and are therefore computed
as the negative gradient of the potential energy function between two atoms.
The problem is set up by defining initial conditions i.e. positions and velocities
for all the atoms describing the system. Then the forces are calculated at the current time
step. The solution stems from a common simplifying assumption for soft sphere
interactions and the potentials are considered pair wise additive. This means the force on
an atom due to interactions with surrounding neighbors can be computed by summing the
interactions with each neighbor alone. In other words the force between two particles is
considered independent of any other particles present. When pair wise additivity is
assumed, the resultant force on atom i can be mathematically expressed as the sum of all
the pair wise forces due to the surrounding j atoms
Utilizing the Newton’s Law F ma= allows the computation of the acceleration
of each particle directly from the force components. Assuming this acceleration is
constant across a given time increment and is of the order of few femto-seconds,
velocities and displacements can be computed using discretization in time.
2
,2 ( )ii i i i id rm F U r vdt
= = −∇ (4.19)
1
N
i ijjj i
F F=≠
= ∑ (4.20)

90
Once the displacement is computed, the entire process of computing inter-atomic
forces and the particle displacements can be repeated for the next time step as shown in
the flow chart in Figure 4.5.
So a deterministic model of molecular motions can be developed using these
fairly straight forward equations. A simple time dicretization can lead to instability in the
code. So, special algorithms are used to update velocities and displacements at each time
1 1( ) ( ) ( ) ( )i n i n i n i nr t r t v t v t+ +→ → (4.21)
Figure 4.5: Flow chart of a typical MD simulation

91
step. The main algorithm of MD simulations is the integrator that calculates the
trajectories with time using the equation of motion for interacting particles. There are
four different types of numerical methods for integrating Newton's equations, such as
Verlet, Velocity Verlet, leapfrog, and the predictor-corrector algorithm, that are used in
the MD simulations discussed in this study (Allen & Tildesley, 1989; Frenkel & Smit,
2002).
Verlet Algorithm:
Verlet algorithm follows a simple discritization in time. After calculation of
forces, the atomic positions are updated as a function of previous values, followed by
calculation of velocities as a function of displacement over a period of time.
Velocity Verlet:
A related, and more commonly used, algorithm is the Velocity Verlet algorithm.
This uses a similar approach but explicitly incorporates velocity. It can be shown that the
error on the Velocity Verlet is of the same order as the basic Verlet. Velocity Verlet
algorithm is less memory consuming, because it's not necessary to keep track of the
velocity at every time step during the simulation. The standard implementation scheme of
this algorithm is:
2( ) 2 ( ) ( ) ( )r t t r t r t t t a tδ δ δ+ = − − + (4.22)
( ) ( )( )2
r t t r t tv tt
δ δδ
+ − −= (4.23)

92
Leap frog algorithm:
Leap frog algorithm is a modified version of the Verlet algorithm as shown below
It is computationally less expensive than the Predictor-Corrector approach, and
requires less storage. This could be an important advantage in the case of large scale
calculations. Moreover, the energy is conserved, even at large time steps. Therefore, the
computation time could be greatly decreased when this algorithm is used. However, when
more accurate velocities and positions are needed, another algorithm should be
implemented, like the Predictor-Corrector algorithm.
Fifth order Predictor corrector:
The predictor-corrector algorithm is based on a Taylor expansion. If the position,
velocity, acceleration and time derivative of the acceleration are known at time t, these
quantities after time step can be predicted up to a certain order as shown in the following
equations:
21( ) ( ) ( ) ( )2
r t t r t tv t t a tδ δ δ+ = + + (4.24)
1 1( ) ( ) ( )2 2
v t t v t ta tδ δ+ = + (4.25)
1 1( ) ( ) ( )2 2
v t t v t t ta t tδ δ δ δ+ = + + + (4.26)
[ ]1( ) ( ) ( ) ( )2
v t t v t t a t a t tδ δ δ+ = + + + (4.27)
1( ) ( ) ( )2
1 1( ) ( ) ( )2 21 1 1( ) ( ) ( )2 2 2
r t t r t tv t t
v t t v t t ta t
v t v t t v t t
δ δ δ
δ δ δ
δ δ
+ = + +
+ = − +
⎛ ⎞= + + −⎜ ⎟⎝ ⎠
(4.28)

93
Once the forces have been evaluated, the difference between the predicted and calculated
is called error. The error in acceleration can be found as
Finally the corrected values are calculated using the error and constant chosen to
maximize the stability of the algorithm.
where the constants have values
The best choice for these coefficients depends on the order of both the differential
equations and the Taylor series. These coefficients are computed based on the order of
2 3 4 5
2 3 4
2 3
1 1 1 1( ) ( ) ( ) ( ) ( ) ( ) ( )2! 3! 4! 5!1 1 1( ) ( ) ( ) ( ) ( ) ( )2! 3! 4!1 1( ) ( ) ( ) ( ) ( )2! 3!
( ) ( ) ( )
pi i i i i i i
pi i i i i i
pi i i i i
pi i i
r t t r t v t t a t t b t t c t t d t t
v t t v t a t t b t t c t t d t t
a t t a t b t t c t t d t t
b t t b t c t t
δ δ δ δ δ δ
δ δ δ δ δ
δ δ δ δ
δ δ
+ = + + + + +
+ = + + + +
+ = + + +
+ = + 21 ( )2!
( ) ( ) ( )
( ) ( )
i
pi i i
pi i
d t t
c t t c t d t t
d t t d t
δ
δ δ
δ
+
+ = +
+ =
(4.29)
( ) ( ) ( )c pi i ia t t a t t a t tδ δ δ δ+ = + − + (4.30)
0
1
2
3
4
5
( ) ( ) ( )
( ) ( ) ( )
( ) ( ) ( )
( ) ( ) ( )
( ) ( ) ( )
( ) ( ) ( )
c pi i ic pi i i
c pi i i
c pi i i
c pi i i
c pi i i
r t t r t t c a t t
v t t v t t c a t t
a t t a t t c a t t
b t t b t t c a t t
c t t c t t c a t t
d t t d t t c a t t
δ δ δ δ
δ δ δ δ
δ δ δ δ
δ δ δ δ
δ δ δ δ
δ δ δ δ
+ = + + +
+ = + + +
+ = + + +
+ = + + +
+ = + + +
+ = + + +
(4.31)
0 1
2 3
4 5
3 / 20 251/ 3601 11/181/ 6 1/ 60
c cc cc c
= =
= =
= =
(4.32)

94
the algorithm being used in the simulation. Verlet algorithm is fast but not accurate for
long time steps. In present research work, velocity Verlet and predictor corrector have
been used in various simulations. The Predictor corrector algorithm has very good local
energy conservation, can be used with velocity-dependant forces, and is not time
reversible. Verlet on the other hand has much better long term energy conservation
compared to the predictor-corrector, and is time reversible.
4.4 Boundary Conditions
As mentioned before, the initial structure is set according the crystal type.
Figure 4.6 below shows different crystals structures present in metals. Aluminum takes
the face-centered (fcc) shape and alumina has hexagonal closed packed structure.
A separate code has been written to generate bulk or nano particulate aluminum
and alumina using these lattice types as basis. For aluminum the FCC crystal structure is
chosen with lattice spacing of 4.032 Angstorms. For alumina the hexagonal packed
structure is used with the following unit vectors for the basis:
Figure 4.6: Various lattice types for crystalline structures
Face centered Hexagonal close packing Body centered

95
The fractional indices are listed in Table 4.2. This 30 atoms unit cell is repeated in
three dimensions to generate any bulk or particulate alumina.
Atom # Fractional coordinates Type 1 0.306 0.000 0.250 O 2 0.000 0.306 0.250 O 3 0.694 0.694 0.250 O 4 0.694 0.000 0.750 O 5 0.000 0.694 0.750 O 6 0.306 0.306 0.750 O 7 0.000 0.000 0.352 Al 8 0.000 0.000 0.648 Al 9 0.000 0.000 0.852 Al
10 0.000 0.000 0.148 Al 11 0.639 0.667 0.917 O 12 0.333 0.973 0.917 O 13 0.027 0.361 0.917 O 14 0.027 0.667 0.417 O 15 0.333 0.361 0.417 O 16 0.639 0.973 0.417 O 17 0.333 0.667 0.019 Al 18 0.333 0.667 0.315 Al 19 0.333 0.667 0.519 Al 20 0.333 0.667 0.815 Al 21 0.973 0.333 0.583 O 22 0.667 0.639 0.583 O 23 0.361 0.027 0.583 O 24 0.361 0.333 0.083 O 25 0.667 0.027 0.083 O 26 0.973 0.639 0.083 O 27 0.667 0.333 0.685 Al 28 0.667 0.333 0.981 Al 29 0.667 0.333 0.185 Al 30 0.667 0.333 0.481 Al
If the fractional coordinates for each atom are labeled as qi =(q1i, q2i, q3i) and unit
vectors are ( , ,a b c ) then Cartesian coordinates r = (xi, yi, zi) are obtained from ri = q1i a
( )
( )
4.7589 1,0,0
1 34.7589 , ,02 2
12.990 0,0,1
a
b
c
=
⎛ ⎞= −⎜ ⎟⎜ ⎟
⎝ ⎠=
(4.33)
Table 4.2: Coordinates for Al2O3 lattice

96
+ q2i b + q3i c . For the x coordinate of r, for example, xi = q1i ax + q2i bx + q3i cx. To
make a (l m n) replica of the unit cell for the simulation super-cell, the Cartesian
coordinates of unit cell are taken and multiples of the unit cell vectors are added to get
additional coordinates of atoms in the super-cell. For example: rα (l,n,m) = q1α ia + q2α jb
+ q3α kc. To get all the coordinates summation is done from i = 1 to l, j = 1 to m and k = 1
to n and over all the atoms in the unit cell. Figures 4.7 and 4.8 show a super-cell created
for aluminum and alumina respectively.
Figure 4.7: FCC Lattice for aluminum

97
The atoms are arranged in a crystalline structure and are given random velocities
according to Maxwell Distribution.
The system is first equilibrated at particular temperature and then evolved in time.
Boundaries can be of different types in a MD simulation:
1. Free boundaries: Used for ultrafast processes, processes in vacuum, ion
bombardment etc.
2. Rigid Boundaries: Unphysical, should be carefully implemented, used in
combination with others
3. Periodic Boundary Conditions: Most popular, used along with minimum image
criterion, size of the cell vs. characteristic length scale
Figure 4.8: Supercell for alumina
3/ 2 22( ) 4 exp
2 2m mvf v vkT kT
ππ
⎡ ⎤−⎛ ⎞= ⎜ ⎟ ⎢ ⎥⎝ ⎠ ⎣ ⎦
(4.34)

98
4. Mixed Boundary conditions: Non isotropic simulations, dislocations and
defects
5. Stochastic Boundary Conditions: Used in special ensembles
The most common boundary condition used in molecular dynamics is the periodic
boundary and can model a system as an infinitely repeating physical domain. If a
molecule is close to the right side of the domain it can interact with the molecules on the
left side as neighbors. Also if a molecule leaves the physical domain it will re-emerge on
the opposite side as shown in Figure 4.9. However, it is good only for systems with short
range forces.
Figure 4.9: Schematic diagram showing periodic boundary condition for Cartesian
coordinates

99
4.5 Statistical Ensembles
Ensemble is an idealization consisting of large number of copies of a system,
considered all at once, each of which represents a possible state that the real system might
be in. There are four major ensembles considered in Molecular Dynamics:
1. Microcanonical (NVE): used for constant density/equilibrium simulations
2. Canonical (NVT): used for isochoric and isothermal simulations
3. Isothermal isobaric (NPT): used for isobaric isothermal simulations
4. Isobaric isoenthalpic (NPH): used for constant pressures simulations
To simulate the system in a particular ensemble we need to derive equations using
Lagrangian and Statistical Mechanics. Lagrangian Mechanics is re-formulation of
classical mechanics and was introduced by Louis Lagrange in 1788. It is derived from the
difference between kinetic and potential energy and simplifies many physical problems.
The equations of motion thus obtained are called Lagrange’s equations. It is especially
useful for non Cartesian coordinate frames. The Lagrangian, L, of a dynamical system is
a function that summarizes the dynamics of the system. Hamiltonian is obtained by
performing Legendre transformation on Lagrangian and was invented in 1833 by William
Hamilton. This is used mainly in Quantum mechanics.
For scaled coordinates defined in terms of old coordinates using
Lagrangian equations of motion can be derived as
( , , )r f q q t′= ; ( , , )r f q q t′ ′= (4.35)
i i
d L Ldt q q
∂ ∂=
′∂ ∂ (4.36)
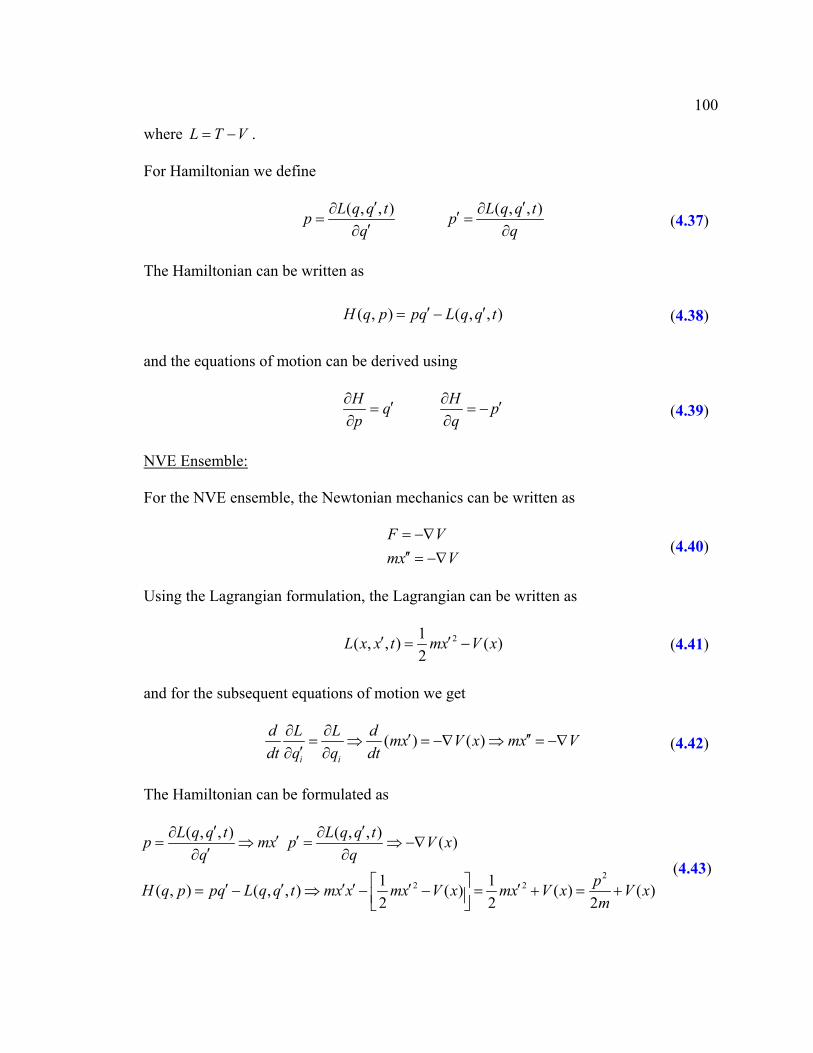
100
where L T V= − .
For Hamiltonian we define
The Hamiltonian can be written as
and the equations of motion can be derived using
NVE Ensemble:
For the NVE ensemble, the Newtonian mechanics can be written as
Using the Lagrangian formulation, the Lagrangian can be written as
and for the subsequent equations of motion we get
The Hamiltonian can be formulated as
( , , ) ( , , )L q q t L q q tp pq q′ ′∂ ∂′= =′∂ ∂
(4.37)
( , ) ( , , )H q p pq L q q t′ ′= − (4.38)
H Hq pp q
∂ ∂′ ′= = −∂ ∂
(4.39)
F Vmx V= −∇′′ = −∇
(4.40)
21( , , ) ( )2
L x x t mx V x′ ′= − (4.41)
( ) ( )i i
d L L d mx V x mx Vdt q q dt
∂ ∂ ′ ′′= ⇒ = −∇ ⇒ = −∇′∂ ∂
(4.42)
22 2
( , , ) ( , , ) ( )
1 1( , ) ( , , ) ( ) ( ) ( )2 2 2
L q q t L q q tp mx p V xq q
pH q p pq L q q t mx x mx V x mx V x V xm
′ ′∂ ∂′ ′= ⇒ = ⇒ −∇′∂ ∂
⎡ ⎤′ ′ ′ ′ ′ ′= − ⇒ − − = + = +⎢ ⎥⎣ ⎦
(4.43)

101
and resulting equations of motion are:
NPH ensemble:
In order to simulate the system in NPH ensemble, a system of N atoms is coupled to an
external source by introducing additional variables into the Lagrangian. NPH ensemble
was first introduced by Anderson using volume as an extra degree of freedom through
mechanical coupling (Anderson, 1980). Assuming that atoms behave as classical point-
like masses, the Lagrangian of the system is expressed as
where M is a constant fictitious mass associated with the volume of the system , m the
mass of the atom, V the volume, treated as a dynamic variable, P the pressure, and id
the scaled position of atom i . The above equation is obtained using scaled coordinates
1/3 1/3i i i ir V d r V d= = . The potential and kinetic energy can be written as
The Lagrangian equations of motion can be obtained using
H q p mxpH p p Vq
∂ ′ ′= ⇒ =∂∂ ′ ′= − ⇒ = −∇∂
(4.44)
2/3 2 21/3 1/3
1 3( ,..., )2 2
iN
i
mV d MVL U V d V d PV= + − −∑ (4.45)
1/3 1/31 3
2 /3 2 2
. . ( ,..., )
. .2 2
N
i
i
P E U V d V d PV
mV d MVK E
= +
= +∑ (4.46)
i i
d L Ldt q q
∂ ∂=
′∂ ∂ (4.47)

102
where iq are generalized coordinates. Substituting iq for V and id in Eqn. 4.47, the
equations of motion for the case of NPH ensemble take the form
where id and id denote the first-order and second-order derivatives with respect to time,
and iF the net force on atom i . Equation 4.48 can be numerically integrated using a fifth-
order predictor-corrector algorithm.
NVT Ensemble:
For NVT ensemble the temperature needs to be constant. The temperature is
controlled using a parameter that also evolves with time and helps in keeping the
temperature constant. The whole system can be assumed to be in contact with a reservoir
that helps in maintaining the temperature constant (Nose, 1984; Nose, 1985). The scaling
can be done as
The resultant Potential energy, kinetic energy and Lagrangian can be written as
Using Lagrangian mechanics we obtain:
2/3 2 1/3
1/3
13
23
i i i ii i
i ii i i
MV P V m d V F dV
mVdm d V FV
−
⎡ ⎤= − + +⎢ ⎥⎣ ⎦
= −
∑ ∑ (4.48)
/
i i
t t sx x s′ =′ =
(4.49)
1 32 2 2
2 2 2
1 3
. . ( ,..., ) ln
. .2 2
( ,..., ) ln2 2
N
i
i
iN
i
P E U x x gkT s
ms x QsK E
ms x QsL U x x gkT s
= +
= +
= + − −
∑
∑
(4.50)

103
which can be further simplified by using time derivative with respect to real time as
Sometimes a friction constant ζ is used to simplify the equations.
If the kinetic energy is greater than gkT , ζ is greater than zero and ζ increases
and becomes positive. The equation for ix with positive ζ describes a system with
frictional force and hence velocities and kinetic energy decrease accordingly. The
opposite happen if kinetic energy is smaller than gkT .
NPT ensemble:
NPT ensemble is an extension of NVT and NPH ensembles. Basically the
pressure and temperature are controlled by scaling the size of unit cell and velocity
respectively. The scaled coordinates are given by
Potential, kinetic energies and Lagrangian can then be derived as
2
2
2
i ii
i i ii i
gkTQs s m xs
F m sxm xs s
= −
= −
∑ (4.51)
22
i ii
i ii i i
QsQs s m x sgkTs
m sxm x Fs
= − +
= −
∑ (4.52)
(ln )d s s sdt
ζ ζ= ⇒ =
2i i
i
i i i i i
Q m x gkT
m x F m x
ζ
ζ
= −
= −
∑
(4.53)
1/3
1/3
i i
i i
x V d
x sV d
=
= (4.54)

104
The equations of motion and thus be given by
4.6 Structural and Thermodynamic Properties
Statistical Mechanics can be used to predict bulk properties of matter in terms of
the microscopic particles of which it is composed. Thermodynamics can be treated as
merely statistical mechanics at macroscopic level. Boltzmann and Gibbs in late
nineteenth century laid the foundation of Statistical mechanics. Using the concept of
discrete energy states, Boltzmann’s relation can be written as
This forms the basis for extracting thermodynamic properties of the system using
the motions at atomistic level. The macroscopic thermodynamic properties of the system
are derived from the instantaneous values using the equation of state and statistical
1/3 1/31 3
2 2/3 2 2 2
2 2/3 2 2 21/3 1/3
1 3
. . ( ,..., ) ln
. .2 2 2
( ,..., ) ln2 2 2
N
i
i
iN
i
P E U V d V d PV gkT s
ms V d MV QsK E
ms V d MV QsL U V d V d PV gkT s
= + +
= + +
= + + − − −
∑
∑
(4.55)
22/3 2 1/3
1/3
2
2 /3 2
3
2 23
i i i ii i
i i i i ii i
i ii
sMV P V m d V F dV
V F mVd m sdm ds V s
gkTQs sV m ds
−
⎡ ⎤= − + −⎢ ⎥⎣ ⎦
= − −
= −
∑ ∑
∑
(4.56)
lnS k= Ω (4.57)

105
mechanics. For example, the temperature can be determined from the kinetic energy of
atoms according to the equi-partition principle.
For any physical property A, A denotes an average over time given by
where iΓ represents a 6N-dimensional phase space consisting of positions and momenta
of all atoms. The pressure is calculated through the virial equation of state, as a function
of the temperature of the system and forces experienced by all the atoms.
The melting point is identified based on the variations in the potential energy,
Lindemann index, and translational order parameter. The Lindemann index, defined as
(Zhuo et al., 2002),
measures the vibrational motion of atoms, and can be calculated as a function of inter-
atomic distance. The increase in vibrational motion is a characteristic of the phase change
in materials, and the Lindemann index is expected to increase abruptly by a factor of
more than three during melting. The translational-order parameter, λ , is a measure of
the structure present in the solid, expressed as (Gezelter et al., 1997)
23 B
KT
Nk= (4.58)
1
1 ( )stepN
iistep
A AN =
= Γ∑ (4.59)
1
1 .3
N
B i ii
P Nk T r F=
= + ∑ (4.60)
222
( 1)ij ij tt
i j ij t
r r
N N rδ
<
−=
−∑ (4.61)

106
where k is an arbitrary vector of the lattice and L the side length of the simulation
domain. In a solid, atoms simply vibrate about their lattice positions, and hence there is
perfect order in the crystal. Such order, however, disappears in a liquid state, and the
corresponding translational-order parameter is reduced by an order of magnitude.
4.7 Parallel Numerical Framework
Parallel computers are essentially many processors linked together and set to
operate concurrently. If a given computational task is shared evenly among the
processors the task can be efficiently accomplished. Programming on parallel
architectures requires considerations in terms of division of the computational workload
and minimal communications between the processors. Both are important factors in
generating efficient parallel code. The even division of computational work is termed
load balancing. Molecular dynamic codes are especially sensitive to load imbalances. The
work detailed herein is multifaceted. It involves the combining of combustion related
thermo-fluid dynamics and molecular dynamics using the high speed capabilities of
parallel computers.
The code developed for current Molecular Dynamics study can handle micro-
canonical (NVE), isobaric-isoenthalpic (NPH), and isobaric-isothermal (NPT) ensembles
( )
2 2
1 1
1/3
1 cos( . ) sin( . )
2( 1,1,1)
N N
i ii i
k r k rN
Nk
L
λ
π
= =
⎛ ⎞ ⎛ ⎞= +⎜ ⎟ ⎜ ⎟⎝ ⎠ ⎝ ⎠
⎛ ⎞= −⎜ ⎟⎜ ⎟⎝ ⎠
∑ ∑ (4.62)

107
using the Verlet and predictor-corrector algorithms, respectively. These have been
parallelized using the atomic decomposition method (Plimpton, 1995). This method
consists of a series of expand and fold operations as shown in Figure 4.10 and makes the
communications load much faster as compared to normal send and receive operations
using MPI.
A separate post-processing code has also been established to superimpose the grid on the
geometry under consideration, and to analyze the results using the contours of various
thermodynamic properties. The code also has the capability of handling multi-atom
simulations and can treat liquid and solid phases. Using the techniques mentioned by
Long et al. (Long et al., 1996) and Thompson et al. (Thompson et al., 1984) a separate
subroutines have been written to calculate the droplet radius in case of coexistence of
liquid and gas phases.
Figure 4.11 shows the parallel speed-up obtained for 16384 atoms using up to 64
processors. The algorithmic speed-up varies almost linearly with the number of
Figure 4.10: Expand and fold operations showing communications among 8 processors in
three steps (Plimpton, 1995)

108
processors, reaching up to a factor of 30 in the current case, and improves significantly
with the problem size. The simulations were performed on a parallel architecture of a
Beowulf system of PIII, PIV and AMD processors.
A Beowulf system is a multi-computer architecture used for parallel
computations. In a Beowulf system, one server computer and many other client
computers are connected together via high-speed networks. It is a distributed memory,
MIMD system built primarily using commodity hardware components, such as any PC
capable of running the free operating system Linux, standard Ethernet adapters, and
switches. The first Beowulf system was built by Donald Becker in 1994, and consisted of
16 486DX4-100MHz machines each with 16 MB of memory. The main advantage of a
Beowulf system is its high performance/price ratio in comparison with other systems.
Another important characteristic of the Beowulf clusters is the compatibility. Changes of
hardware, including the node and network system, will not affect the programming
model. A Beowulf system also uses commodity software, such as the Linux
Processors
Alg
orith
mic
Spee
d-up
Para
llelE
ffic
ienc
y(%
)
10 20 30 40 50 60
5
10
15
20
25
30
50
60
70
80
90
100
Speed-upParallel Efficiency
NPH Code for Aluminum100 Iterations,16384 Atoms
Figure 4.11: Speed-up and efficiency vs. number of processors for the MD code

109
operating system, Message Passing Interface (MPI) and other available open-source
software. The work conducted for this study was implemented on an in-house Beowulf
system, consisting of three Intel-based and one AMD-based Linux clusters. The parallel
computing system presently includes 164 dual PIII, 173 single PIV and 160 AMD
Opteron processors as shown in Figure 4.12. These computers are connected with nine
100M Fast Ethernet switches and four gigabit switches in a tree topology to facilitate
parallel processing. The cumulative internal memory is 584 GB, and the total file storage
is 5.5 TB. This system can sustain 1200 gigaflops total peak performance, providing
substantial number-crunching capabilities for large-scale computations. The operating
system was RedHat Linux. The Message Passing Interface (MPI) involving a library of
functions and macros that can be used in C, FORTRAN, and C++ Program were used to
exchange the information among the processors.
Figure 4.12: Parallel computing facility at Penn State

110
The time step for most of the simulations is chosen to be one femto-second,
considering that the time scale for vibration of atoms is of the same order. Annealing is
sometimes achieved using the velocity scaling, and the temperature of the nanoparticle is
increased at a rate of 0.01 K per time step. A parametric study was performed on a bulk
FCC crystal consisting of 2048 atoms with different temperature rises of 1, 0.1, 0.01, and
0.001 K per femto-second for each time step. A rate lower than 0.01 K/step increases the
total computational time, and a higher rate gives insufficient time for particles to
equilibrate at each step leading to erroneous results. An optimum rate of 0.01 to 0.1
K/step also helps in accurately predicting the melting point because it produces better
resolution in the variations of thermodynamic and structural properties.
4.8 Code Validation
The NVE and NPH algorithms developed in the present study have been validated
against argon in different phases (solid, liquid and vapor), as well as its thermodynamic
transition from the solid to the liquid phase, because of the availability of extensive and
reliable experimental and numerical data (Solca et al., 1997; Solca et al., 1998; Agarwal
et al., 2003). An attempt was made to fully understand the various types of numerical
simulations performed for Argon at different pressures to obtain thermodynamic
properties (Ermakova et al., 1994; Konning et al., 2001; Woon, 1993; Zha et al., 1986).
The inter-atomic interactions were simulated using the Lennard-Jones potential. Melting
was identified using the radial-distribution function, translational-order parameter,
Lindemann index, and time evolution of the average potential energy. The solid-state

111
simulations predict an equilibrium lattice spacing of 5.26 Α , which matches exactly the
values in the literature. The kinetic, potential, and total energies per atom are obtained for
the system equilibrated at different random temperatures using both the NVE and NPH
ensembles. With the equilibrium pressure from the NVE ensemble as a known condition,
calculations were carried out using the NPH ensemble. Identical results were achieved.
This was used as a validation tool for the two codes because the micro-canonical (NVE)
and isobaric-isoenthalpic (NPH) ensembles should be equivalent for calculations of
thermodynamic quantities, without sacrificing the dynamical description of the fluid.
Extensive validation tests were performed for phase transition. The predicted melting
points agree well with the data in literature. The results also matched those from the
molecular-dynamics simulations conducted by Agarwal et al. and Solca et al. at their
respective ambient conditions.
The first simulation was conducted at a pressure of 90.0 MPa with 256 atoms,
representing the bulk argon, through periodic boundary conditions. The time step chosen
was 8.6 femto-seconds and heat was added to the solid crystal, by increasing the
temperature at the rate of 0.001 K per step. The velocities of atoms were scaled at each
time step corresponding to this increase in temperature. The phase transition was
observed at around 117 K as shown in Figure 4.13 which matches perfectly with the
similar NPH runs performed by Solca et al (Solca et al., 1997; Solca et al., 1998).

112
The second validation run was performed for simulations by Agarwal et al. for
melting of argon at 44.56 kbar. The study by Agarwal was an isothermal isobaric
ensemble using leapfrog Verlet algorithm. They used Melchionna modification
(Melchionna et al., 1993) of Nose-Hover equations of motion. However in this study the
calculations were performed in NPH ensemble which is also called isobaric-isoenthalpic
trajectory. Figure 4.14 shows the plot of temperature and potential energy as the system
evolves. During the time interval monitored in the simulation (I), the temperature
increased from 650.0 K to 900.0 K. Melting was found to occur at 837.7 K as compared
to 840.9 K by Agarwal et al. A comparison was also made with another simulation (II) in
which the parameters were kept same as melting simulation, except the temperature
gradient. It resulted in an isothermal isobaric trajectory with temperature fixed at 775.0
K. The purpose of this was to allow a comparison of properties generated from a standard
isothermal-isobaric trajectory with those generated during a simulation having
temperature gradient. The average pressure was matched perfectly with the study of
Iterations
Tem
pera
ture
(K)
Tran
slat
iona
lord
erpa
ram
ater
5.0E+04 1.0E+050
25
50
75
100
125
150
0.0
0.5
1.0
TemperatureT.O.P
Drop in Translational Order Parameter during melting
Figure 4.13: Comparison with results of Solca et al. for Validation
Literature Present Study

113
Agarwal et al. (i.e. 44.56 kbar). The average energies per atom reported in the current
study were 0.956 and 0.993 eV in simulations I and II respectively. Similarly, the average
atomic densities were 0.03236 and 0.03288 atoms/A3 in simulations I and II respectively.
These values were close to 0.1317 eV for energy per atom and 0.03403 atoms/A3 for
atomic density as obtained in the study done by Agarwal (Agarwal et al., 2003).
NPT ensembles were validated and verified by comparing the results with study
performed by Nose et al. (Nose, 1985b) for argon at 0.25 kbar as shown in Figure 4.15
Iterations
Tem
pera
ture
(K)
Pote
ntia
lEne
rgy/
atom
(eV
)
1.0E+05 2.0E+05600
700
800
900
0.81
0.84
0.87
0.90
0.93TemperatureP.E.
Jump in Potential Energy during melting
Figure 4.14: Variation in Potential energy during melting for an Argon crystal at 44.56
kbar
Iterations
Vol
ume
(cm
3 /mol
)
Tem
pera
ture
(K)
200000 300000 400000 500000
25
30
35
40
75
100
125
150
175Temperature (K)Volume (cm3/mol)
Figure 4.15: Validation for NPT ensembles using argon at 0.25 kbar, time step of 8.6 fs
Literature Present Study

114
The validation study for the liquid phase was conducted by simulating a liquid
droplet of argon in equilibrium with its saturated vapor using the Lennard-Jones potential
and NPH ensemble as shown in Figure 4.16. Different studies have been done in
literature, which deal with various issues related to a liquid phase simulation and
formation of droplets (Fowler et al., 1984; Powles et al., 1983; Powles et al., 1983b;
Powles et al., 1984; Powles et al., 1985; Thompson et al., 1984; Long et al., 1996). The
system comprising of droplet and the vapor consisted of 16384 atoms, using periodic
boundary conditions. The temperature was maintained constant at 100 K. The average
density of the droplet (1200 3/kg m ) matched the value reported at the saturation
temperature in a similar research work involving Argon (Little, 1996). Figure 4.16 also
shows a slice through the centre plane of the system volume and shows density contours.
The spherical shape of the droplet can be easily seen and the density value inside the
droplet matches with the saturated value at 100K.
Figure 4.16: Simulation of a liquid droplet of argon at 100 K (a) argon droplet in its
saturated vapor at 100 K; (b) density contour at 100 K
Density (kg/m3)

115
Figure 4.17 shows the radial distribution function of bulk liquid argon at a
reduced density ( )3ρσ of 0.844 and a reduced temperature of 0.71 ( )/Bk T ε . Excellent
agreement was obtained with the result reported in texts.
Gaseous phase argon was also simulated at a temperature of 200 K and pressure
of 7.5 MPa, using 70304 atoms, and periodic boundary conditions as shown in
Figure 4.18. Again the equilibrium pressure, kinetic energy and potential energy were
very close to similar studies done in literature (Little, 1996). The total kinetic energy and
potential energy obtained in this study were 2.91E-16 J and -1.0E-16 J respectively. This
matches very well with the values of 2.9E-16 and -1.06E-16 in literature. Thus, the code
has been validated by testing it extensively on different phases of argon.
r/σ
g(r)
1.0 2.0 3.0 4.0
0
1
2
3
4Allen & Tildesley (1989)Current Study
Radial distribution function at ρ*=0.844 and T*=0.71
Figure 4.17: Radial distribution functions for liquid argon using NVE simulations

116
The overall approach was also examined by comparing the calculated cohesive
energies and melting points for both aluminum and alumina against experimental data.
Figure 4.19 shows the calculated Al-Al, Al-O, and O-O radial distribution functions for
alumina. The inter-atomic distances for peak values for Al-Al, Al-O and O-O
coordination are 2.9, 1.58 and 2.65 A respectively. Good agreement with experimental
values is obtained (Miguel et al. 1998; Gutierrez et al., 2001). Figure 4.20 shows Al2O3,
AlO, and Al2O fragments coming out of a 5 nm alumina particle when heated beyond
4000 K. The Al and O atoms in the crystal are initially packed in a hexagonal structure,
equilibrated at room temperature, and then heated at 800 MPa until decomposition
occurs. The decomposition products qualitatively validates that the SM potential can
indeed simulate molecular interactions involved in the alumina particle.
Figure 4.18: Gaseous phase argon at 200K and 7.5 MPa

117
r (A)
g al-a
l(r)
2.5 5.0 7.5 10.00.0
0.3
0.5
0.8
1.0Al-Al
r (A)
g al-o
(r)
2.5 5.0 7.5 10.00
5
10
15
20Al-O
r (A)
g o-o(r
)
2.5 5.0 7.5 10.00.00
0.25
0.50
0.75
1.00
1.25O-O
Figure 4.19: Radial distribution functions for Al-Al, Al-O, and O-O interactions

118
Figure 4.20: Fragmentation and decomposition of Al2O3 from an alumina particle when heated beyond 4000 K; initial diameter of 5 nm
Al2O3
Decomposition of Al2O3

Chapter 5
Thermo-Mechanical Behavior of Pure Aluminum at Nano Scales
5.1 Background
Nano-sized aluminum and other metallic particles have been extensively used in
many propulsion and energy-conversion applications due to their unusual energetic
properties, such as increased catalytic activity and higher reactivity (Ilyin et al.,2001;
Kwon et al., 1996). The excess energy of surface atoms and reduced activation energies
for chemical reactions contribute to these extraordinary chemical characteristics (Pivkina
et al., 2004; Mench et al., 1998).
Along with these energetic properties, particles at nano scales exhibit many
thermo-physical features as well which are distinct from those found at micro scales. As
the size decreases beyond a critical value, due to the increase in the surface-to-volume
ratio, the melting temperature deviates from the bulk value and becomes a size-dependant
property (Alavi et al., 2006). This phenomenon has been studied experimentally by
means of transmission electron diffraction by Wronski for nano-sized tin (Wronski,
1967). The apparatus consists of an evaporator attached to a small furnace, and 5-10 nm
particles are produced by evaporating tin pellet from the surface and then condensing it
on a thin carbon or silicon monoxide substrate. The melting points agree reasonably well
with the predictions based on classical theories, which show a non-linear relationship
with the reciprocal of the particle size. The melting temperature of tin becomes size-

120
dependant for particles smaller than 10 nm, reducing from a bulk value of 505 K to 425 K
for a 5 nm particle. Eckert et al. synthesized nano-crystalline aluminum powders by
mechanical attrition in argon, hydrogen and oxygen atmospheres, and observed a similar
reduction in the melting point with decreasing grain size (Eckert et al., 1993). The study
was performed for 13-40 nm particles using differential scanning calorimetry (DSC). The
melting point increases from 840 K for 13 nm particles, and reaches its bulk value of 940
K for 40 nm particles. In addition to these experimental studies, Alavi et al. performed
molecular-dynamics simulations for clusters of aluminum atoms using the Streitz-
Mintmire potential and canonical (NVT) ensembles (Alavi et al., 2006). Special attention
was given to the structure of the cluster and dynamic coexistence of the liquid and solid
phases. However, only clusters up to a size of 3 nm (i.e., 1000 atoms) were considered.
Campbell et al. (Campbell et al., 2005) conducted molecular-dynamics simulations for
the oxidation of a 20 nm aluminum particle. However, the effect of particle size on the
melting and ignition of aluminum was not addressed.
As discussed before, particle size plays a significant role in determining the
characteristics of ignition and combustion. For micron-sized and larger aluminum
particles, the ignition temperature coincides with the melting point of the surface oxide
(Al2O3) layer at 2327K (Bucher et al., 2000). The impervious nature of aluminum oxide
inhibits the ignition of aluminum. Once the layer melts, it coalesces to form an oxide cap,
and the aluminum core is then exposed to the ambient gases for oxidation. At nano scales
(less than 100 nm), the ignition occurs near the melting point of aluminum at 940 K by
cracking of the oxide shell, possibly caused by the pressure buildup (Rai et al., 2004;
Rozenband and Vaganova, 1992) and/or phase transformations (Dreizin, 2003; Trunov et

121
al., 2006) inside the shell. According to Rai et al., oxidation of alumina-coated nano-sized
aluminum particles is initiated by melting of the aluminum core. The resultant volume
dilatation causes a pressure build-up inside the shell formed by the oxide layer. Because
of the higher curvature as compared to micron-sized particles, the stress developed due to
the pressure becomes unsustainable and the shell subsequently ruptures. This concept was
originally introduced by Rozenband (Rozenband and Vaganova, 1992), who developed a
model taking into account the mechanical stresses at the metal-oxide interface. Trunov et
al. (Trunov et al., 2006) attributed the observed low ignition temperature of nano-sized
particles to the transformation from the amorphous to the gamma and alpha phases in the
oxide layer. As a consequence of the density variations in different phases, the layer
develops cracks, which permit direct oxidation of aluminum in the core.
5.2 Objectives
In light of the inconsistency and uncertainties of the various theories concerning
the particle behavior at nano scales discussed in section 5.1, fundamental research based
on well-calibrated techniques appeared to be imperative, in order to achieve an improved
understanding of the effects of particle size on the melting and ignition behavior. Since
this was the first of the series of MD studies performed, the purpose of the present work
was to study the melting of aluminum particles in the size range of 2-9 nm consisting of
256-23328 atoms. The influence of the surface passivating layer was not considered, and
was treated in other studies. This will be discussed in subsequent chapters. The results not
only provided basic information about particle behavior at nano scales, but also set the

122
stage for a study of the ignition and combustion of aluminum particles over a broad range
of scales. The melting process was characterized using a combination of structural and
thermodynamic parameters, including the potential energy, Lindemann index,
translational-order parameter, and radial-distribution functions. Both bulk material and
nanoparticles were considered. The dynamic coexistence of the solid and liquid phases
was also explored. In addition, the effect of surface charge development on melting was
examined using the Streitz-Mintmire potential.
A major assumption involved in any Molecular Dynamics study before using any
potential is the Born-Oppenheimer Approximation as discussed in Chapter 4. According
to this theory, the nuclear and electronic motion in molecules can be separated and the
nuclear motion sees a smeared out potential from the speedy electrons. The potential
functions are an approximation to this potential energy surface and are basically fitted to
such experimental data as structural, thermodynamic or material properties. Moreover,
almost all the potentials considered are fitted to the properties for bulk materials. One of
the key issues in nanoparticle or cluster simulations is the size dependence of properties
which has been shown in literature. The accuracy of a model can be judged from its
ability to simulate properties like size dependence of melting point. An ideal potential to
be used for current research should be able to accurately predict thermodynamics, elastic
properties, surface energies and surface relaxation of crystalline oxide and aluminum.
Hence, the second goal of this work was to compare the existing potentials, most of
which have been either fitted to thermodynamic or structural properties for the bulk. Due
to the availability of a wide range of potentials, a comparison has been made, using the
melting phenomenon for an aluminum nanoparticle as a benchmark. MD simulations

123
involving a large number of particles are computationally very expensive and a correct
choice of the potential can save a lot of computational time. The aim was to select an
optimum potential which predicts the aluminum nanoparticle melting to a good level of
accuracy and is also computationally not too expensive for nano-sized aluminum particle
studies. Five existing potentials (the Lennard-Jones, glue, embedded-atom, Streitz-
Mintmire, and Sutton-Chen potentials) were implemented and evaluated.
5.3 Results and Discussion
After validation, the general framework described in Chapter 4 was employed to
study the melting of nano-sized aluminum particles. Figure 5.1 shows the melting
phenomenon of bulk aluminum in a vacuum. The simulation was performed using the
glue potential and periodic boundary conditions. An FCC lattice was adopted to calculate
the initial position vectors for the known number of aluminum atoms. Melting was
observed at a temperature of 1244 K, at which point sharp variations occur in the
potential energy, atomic density, translational-order parameter, radial-distribution
function, and the Lindemann index.
The melting of nano-sied aluminum particles was examined in the size range of 2-
9 nm. The simulations started with solid phase aluminum using an FCC crystal structure
in a cubic configuration. Figure 5.2 shows the changes in the same thermodynamic and
structural properties for a 4 nm particle consisting of 2048 atoms. Melting occurs at 735
K. Since the potential energy and atomic density vary smoothly at the melting point for a

124
particle, only the translational-order parameter and Lindemann index are employed to
characterize the melting point for the rest of the study.
The phenomenon of surface pre-melting represents a qualitative difference
between the calculated bulk-material and particle melting. A bulk solid can be simulated
by enforcing periodic boundary conditions in all three spatial directions, whereas a
particle is associated with a free surface. In the case of a particle, the surface acts as a
nucleation site for the phase transition and propagates to the interior. Hence, the phase
change in a particle is manifested by a gradual increase in such properties as the potential
Temperature, K
Pote
ntia
lEne
rgy,
eV
Ato
mic
Den
sity
,ato
ms/
nm3
400 800 1200 1600 2000-3.5
-3.4
-3.3
-3.2
-3.1
-3.0
-2.9
-2.8
45
50
55
60Potential EnergyAtomic Density
Temperature, K
Lind
eman
nIn
dex,δ
Tran
slat
iona
lord
erpa
ram
eter
,λ
400 800 1200 1600 2000-0.05
0.00
0.05
0.10
0.15
0.20
0.25
0.00
0.50
1.00
λδ
r, nm
Rad
iald
istri
butio
nfu
nctio
n,g(
r)
1 2 3 4 50
3
6
9Before MeltingAfter Melting
Figure 5.1: Variations of thermodynamic and structural properties during melting of bulk
aluminum in vacuum; the glue potential

125
energy and Lindemann index, as opposed to the abrupt variations found in a bulk
material.
Starting with the FCC aluminum in the solid phase, the nano-sized aluminum
particle takes on a spherical shape due to surface tension in the liquid phase after melting.
A solid-state spherical nanoparticle can be obtained by cooling the liquid aluminum down
to a temperature below the melting point, as shown in Figure 5.3. The density contour can
be obtained using the post-processing code, in which the atoms in the computational
domain are mapped on a grid and the thermodynamic properties like density are
Temperature, K
Pote
ntia
lEne
rgy,
eV
200 400 600 800 1000-3.2
-3.1
-3.0
-2.9 Potential Energy
Temperature, K
Lind
eman
nIn
dex,δ
Tran
slat
iona
lord
erpa
ram
eter
,λ
200 400 600 800 1000-0.03
0.00
0.02
0.05
0.07
0.10
0.12
0.00
0.50
1.00
λδ
r, nm
Rad
iald
istri
butio
nfu
nctio
n,g(
r)
1 2 3 4 50
1
2
3
4
5Before MeltingAfter Melting
Figure 5.2: Variations of thermodynamic and structural properties during melting of
nano-sized aluminum particle; the glue potential

126
calculated by averaging the properties in all the cells. The result agrees closely with the
density of solid-state aluminum of 2700 kg/m3, further validating the simulations.
The calculations using the five potentials were also checked against the cohesive
energies of bulk aluminum in the solid state using the micro-canonical ensemble.
Table 5.1 shows the comparison of cohesive energies obtained in the current study with
those reported in the literature. The calculated energies match exactly the values found in
the literature.
Potential Calculated (eV) Literature (eV) Lennard-Jones Potential -3.353 - Glue Potential -3.360 -3.360 (Ercolessi and Adams, 1994)
Embedded Atom Potential -3.385 -
Streitz-Mintmire Potential -3.385 -3.390 (Streitz and Mintmire, 1994)
Sutton-Chen Potential -3.312 -3.340 (Sutton and Chen, 1990)
26002200180014001000600200
Figure 5.3: A 4 nm aluminum particle in solid state; the glue potential
Table 5.1: Cohesive energies for bulk aluminum
Density (kg/m3)

127
The effect of particle size on melting in vacuum was investigated. Figure 5.4
shows the results using isobaric-isoenthalpic ensembles based on five different potentials.
The corresponding numerical values are listed in Table 5.2. The melting temperature
increases from 473 K for a 2 nm particle and reaches the bulk value of 937 K for 8 nm
and larger-sized particles. Annealing was accomplished with the velocity scaling at a rate
of 0.01 K per step. The results obtained in the present study bears a close resemblance to
the experimental data of Eckert et al., but cannot be compared quantitatively because of
the absence of oxide layer in the simulations (Eckert et al., 1993).
The two-body Lennard-Jones potential failed to predict the melting point for
nano-scale aluminum particles. Even at 1200 K, the particle still remains in the solid
state, and only an increase in the vibrational frequency was observed. A similar
phenomenon was noted in the simulations for bulk aluminum. The Sutton-Chen potential
was found to predict geometrical structures for nano clusters very accurately, but failed to
provide an accurate prediction of the melting point for nano-sized aluminum particles.
This is an example where a potential fitted to structural properties like elastic constants
Particle Size (nm)
Mel
ting
Tem
pera
ture
,K
2 3 4 5 6 7 8 9200
400
600
800
1000
1200 GlueEAMStreitz-MintmireSutton-Chen
Figure 5.4: Melting point of nano-sized aluminum particle as function of particle size

128
and bulk modulus fails to perform well for thermodynamic properties. The glue and
Streitz-Mintmire potentials are comparable. The former generally leads to a melting
temperature about 50-100 K higher than the latter does. The success of the glue and
Streitz-Mintmire potentials in capturing the effect of size on melting of nano-sized
aluminum particles once again underlines the importance of many-body potentials for
modeling aluminum behavior.
Potentials Particle Size (Atoms)
2nm (256)
3nm (864)
4nm (2048)
5nm (4000)
6nm (6912)
7nm (10976)
8nm (16384)
9nm (23328)
Bulk (pbc)
Lennard-Jones
- - - - - - - - -
Glue 473 673 735 798 912 928 937 937 1244 Embedded-
Atom 448 652 716 790 873 891 898 898 1146
Streitz-Mintmire
448 652 716 790 873 891 898 898 1146
Sutton-Chen 400 386 385 452 436 429 435 435 529
The glue and Streitz-Mintmire potential predict bulk melting points of 1244 K and
1146 K, respectively, which are greater than the thermodynamic melting point by about
18%. According to the study by Lutsko et al. a factor should be introduced between the
simulated (structural) and the actual (thermodynamic) melting points when periodic
boundary conditions are enforced for bulk materials (Lutsko et al., 1989). The
thermodynamic melting point is approximately 0.75-0.85 times its structural counterpart.
Applying this factor to obtain the predicted thermodynamic melting point gives a value
close to 940 K for bulk aluminum. Since, in the case of particles, the free surface acts as a
Table 5.2: Melting points of nano-scale aluminum particles as function of particle diameter

129
nucleation site for melting, the phase change predicted by NPH simulations directly
corresponds to the thermodynamic melting and no correction factor is required.
Figure 5.5 shows final spherical shapes attained by aluminum nanoparticles in the
size range of 2-9 nm at 1200 K as a result of surface tension. All the simulations
commenced with cubic geometries and were based on glue potential.
In all the simulations discussed above, the aluminum temperature was increased
continuously by means of velocity scaling, and melting was identified based on the
variations in the structural and thermodynamic properties. The procedure amounts to the
heating of a solid material in vacuum until the transition to a liquid state is achieved. For
particles containing 500 atoms or less, uncertainties arise in characterizing the phase
transition due to the co-existence of the solid and liquid phases. An alternative approach
to obtain the melting point is thus implemented by equilibrating the particle at specific
temperatures and calculating the thermodynamic and structural properties for each
Figure 5.5: Spherical shape assumed by nano-scale aluminum particles after melting
Bulk
6 nm 5 nm
2 nm 3 nm 4 nm
7 nm
8 nm 9 nm

130
respective state. The method is more appropriate for small clusters, although it is
computationally more expensive. Figure 5.6 shows the results for a 2 nm particle (256
atoms) from such equilibrium simulations in terms of the variation of potential energy as
a function of temperature. The melting was characterized by fluctuations in the potential
energy, a phenomenon referred to as dynamic melting by Alavi et al (Alavi et al., 2006).
The particle oscillates between the liquid and solid phases in the temperature range of
450-475K, as evidenced by the fluctuations in potential energy. As in the previous
simulations, the Lennard-Jones and Sutton-Chen potentials could not predict the dynamic
melting behavior accurately. The glue and Streitz-Mintmire potentials, although they
produce different magnitudes of equilibrium potential energy, result in the same
temperature range for dynamic melting.
The effect of surface charges on the melting of a nanoparticle also needs to be
investigated, although this phenomenon is often negligible for a bulk material due to the
lack of surface. To this end, the results of simulations performed for nanoparticles in the
Temperature, K
Pote
ntia
lEne
rgy,
eV
300 400 500 600 700 800-3.10
-3.05
-3.00
-2.95
-2.90
-2.85
-2.80GlueStreitz MintmireSutton-ChenEmbedded Atom
Figure 5.6: Variation of equilibrium potential energy with temperature for 2 nm sized
particle (256 atoms)

131
range of 2-9 nm, using the embedded-atom and Streitz-Mintmire potentials, were
analyzed. The two potentials are identical except that the former ignores completely the
electrostatic part of the latter. The development of surface charges for 2-9 nm particles
appears to be too small to exert a significant influence on the electrostatic part of the
Streitz-Mintmire potential, and both potentials result in exactly the same melting point. A
similar observation was reported by Alavi et al. based on a simulation of 500 aluminum
atoms in an FCC structure. Figure 5.7 shows the final spherical shape with charges for a 3
nm nanoparticle. For particles smaller than 3 nm, the surface charge development plays a
negligible role in determining the dynamic melting behavior as well and the results are
identical to those from embedded-atom potential.
5.4 Conclusions
Molecular-dynamics simulations using isobaric-isoenthalpic (NPH) ensembles
have been performed to characterize the melting of nano-sized aluminum particles in the
range of 2-9 nm and to investigate the effect of surface charge development on melting.
Figure 5.7: Surface charge development for 3 nm aluminum particle using the embedded-
atom and Streitz-Mintmire potentials
embedded-atom potential Streitz-Mintmire potential

132
Five different potentials were implemented. The two-body Lennard-Jones potential failed
to predict the melting point. The Sutton-Chen potential, validated against structural
properties, also led to erroneous results of the melting phenomenon. The glue and Streitz-
Mintmire potentials predicted accurately the size dependence of the melting temperature,
but the former generally yielded a melting temperature about 50-100 K higher than the
latter did. The difference in the melting behavior between a nanoparticle and a bulk
material was investigated. Sharp variations in structural and thermodynamic properties
were found across the melting point for a bulk material. In contrast, only smooth changes
were observed for nanoparticles, due to the presence of surface pre-melting. The melting
temperature of an aluminum particle increases monotonically from 473 K at 2 nm to the
bulk value of 937 K at approximately 8 nm. As the size decreases below a critical value,
the increased surface-to-volume ratio and associated higher surface energy enhanced
vibrational instability. This interface-induced disorder is responsible for the size
dependence of particles melting at nano scales. For particle sizes less than 3 nm, the solid
and liquid phases were found to coexist. The effect of surface charge development on
melting was also explored by analyzing the results from the embedded-atom and Streitz-
Mintmire potentials. The two potentials are identical except that the former ignores
completely the electrostatic part of the latter. The development of surface charges had
negligible effect on the particle melting characteristics.

Chapter 6
Effect of Voids and Pressure on Melting of Nano-Particulate and Bulk Aluminum
6.1 Background
After exploring the effect of size dependence on melting of particulate aluminum
and investigating the melting characteristics of pure aluminum nanoparticle, effort was
applied to improve the understanding of melting of particulate phase at nano scales and
the effect of parameters like internal defects (voids) on material properties. From a
structural point of view, voids have been the subject of research for both the bulk and
particulate phases. Allard et al. reconstructed the images of 5-15 nm palladium particles
from electron holograms using a field-emission-transmission electron microscope, and
reported for the first time the existence of internal voids in metallic particles (Allard et
al., 1994). Yoshiharu et al. discussed the formation of voids in pure aluminum quenched
in hydrogen gas (Shimomura and Moritaki, 1981). The number density of voids was
found to be proportional to the square root of the partial pressure of hydrogen in the gas.
Marian et al. examined nano-void deformation in aluminum subject to cyclic shear
deformations ( Marian et al., 2005) and the growth of these voids under hydrostatic
tensions (Marian et al., 2004). Hyuk et al. developed techniques for preparing colloidal
particles with hollow interiors (Hyuk et al., 2005). In parallel, considerable progress has
been recently made in molecular self assembly and supra molecular control for
synthesizing and assembling nano-structured energetic materials (Online, 2008).

134
Aluminum nanoparticles manufactured as a result of these efforts may likely contain
internal voids of some sort and can affect the melting point.
The term melting point itself has been used in the literature with different
definitions. Experimental melting point is the temperature for phase transition as
observed in an experimental set up. Thermodynamic and structural melting points are
terms used in theoretical and numerical studies. The former, Tm, ideally should be
identical to the experimental melting point for a real solid. It is based on the coexistence
of the solid and liquid phases, and theoretically is the temperature at which the solid and
liquid Gibbs free energies are equal. Since calculation of free energies is a non-trivial
task, in most molecular dynamics studies the bulk is simulated using periodic boundary
conditions without any defects. Such a numerical framework produces structural melting,
Ts. The absence of any nucleation sites in a perfect crystal leads to heating the substance
beyond Tm, a phenomenon known as superheating. Structural melting refers to the limit
beyond which there is general collapse of lattice structure. Results obtained from a
numerical simulation correspond to either structural or thermodynamic melting,
depending on the properties of the initial crystal. The theories regarding vibrational
instability, lattice shear instability, and catastrophic generation of dislocations are
associated with structural melting.
Deliberately introducing clusters of vacancy defects to avoid superheating in a
perfect crystal is referred as defect-nucleated melting. The concept was introduced and
reported in the numerical studies by Lutsko et al. (Lutsko et al., 1989) and Phillpot et al.
(Phillpot et al., 1989) These studies highlighted the fact that the nucleation of the liquid
phase at the defect is the dominant initiation mechanism of melting, and hence the

135
melting of an ideal crystal with periodic boundary conditions takes place at a temperature
higher than the experimental melting point. Phillpot et al. investigated the melting
characteristics of silicon in the presence of a grain boundary and a free surface (110)
using molecular dynamics simulations associated with the Stillinger-Weber potential.
Lutsko et al. simulated the high temperature behavior of a grain boundary, free surface
and a planar array of voids on (001) plane of copper using the embedded-atom-method
potential. The investigation found structural and thermodynamic melting points of 1450
K and 1171 K respectively for copper. Recently, the concept of defect-nucleated melting
has been implemented by Solca et al. to determine the theoretical melting curves of argon
and neon, as a function of pressure using isobaric-isoenthalpic molecular dynamics and
Lennard Jones potentials (Solca et al., 1997; Solca et al., 1998). The structural melting
points for an ideal crystal were found to be 20% higher than the thermodynamic melting
points for lattices with a defect in the form of a void. The work of Lutsko et al. shows
that there exists a constant ratio between the structural and thermodynamic melting points
( /s mf T T= ) (Lutsko et al., 1989). For copper and argon the ratios are 1.234 and 1.176,
respectively (Lutsko et al., 1989; Solca et al., 1997). Agarwal et al. simulated defect-
nucleated melting of argon over a broader range of pressures of 0.094-531.6 kbar
(Agarwal et al., 2003). The melting point was found to be independent of the shape and
location of the void.
Experimental studies have suggested that small atomic clusters exhibit
characteristics different from those of a bulk substance. A decrease of the melting point
by 30% has been measured in metallic clusters of diameters of 20-30 A (Ph. Buffat and
Borel, 1976). A modification of surface conditions can depress the melting point or

136
substantially superheat the solid. An ideal crystal melts at a temperature higher than the
experimental or thermodynamic melting point, and imperfections such as voids reduce
the melting point. The extent to which these imperfections affect the melting point,
however, is very subjective and varies with substance. Since the presence of a surface
acts as a nucleation site for melting, an alteration in the surface properties can have a
major impact on the melting temperature and related phenomena for the substance.
6.2 Objectives
In our earlier work based on molecular dynamics simulations, the effects of
particle size and surface charge development on the melting of particulate aluminum
were investigated in the range of 2-9 nm (Puri and Yang, 2007) as discussed in Chapter 5.
The work involved nano-sized aluminum particles in the range of 2-9 nm. Results
indicated that as the particle size decreases below a critical value (8 nm), owing to the
increase in the surface-to-volume ratio, the melting temperature becomes a size-
dependant property and decreases monotonically with decreasing diameter, from a bulk
value of 937 K at approximately 8 nm to 473 K at 2 nm (Puri and Yang, 2007). The
finding was found to be consistent with those from other experimental and numerical
studies (Alavi et al., 2006; Wronski, 1967; Eckert et al., 1993; Bucher et al., 2000). As an
extension of the previous work, this step explores the effect of pressure and defects in the
form of voids on the melting characteristics of nano-particulate aluminum in the range of
2-9 nm where bulk properties break down. From pure scientific perspective this also
137
helps to explore the difference between structural and thermodynamic melting for bulk
and particulate phase in case of metals like aluminum.
The present work involves MD simulations using an isobaric-isoenthalpic (NPH)
ensemble. The Glue potential is selected to treat the inter-atomic interactions, because of
its ability to capture the size dependence of thermodynamic properties for particulate
aluminum (Puri and Yang, 2007). A combination of structural and thermodynamic
parameters, including the potential energy, Lindemann index, translational-order
parameter, and radial-distribution functions, are used to characterize the melting process.
For the particulate phase, spherical nanoparticles up to 9.0 nm are considered. Voids of
different shapes and sizes are taken into account, and results are compared with perfect
particles having no defects. The underlying mechanisms of the entire melting process are
examined using snapshots of the time evolution of atomic positions and density contours.
For the bulk phase, crystals composed of 864 and 2048 atoms are considered. The
structural melting point, Ts for an ideal crystal is found to be 32% higher than the
thermodynamic melting point, Tm for lattices with a defect.
6.3 Results and Discussion
The general framework outlined in Chapter 4 and used in MD study mentioned in
Chapter 5 was first applied to study the melting of bulk aluminum with and without
defects. The simulations were carried out by arranging atoms in a FCC lattice structure
and evolving the system with periodic boundary conditions. Figure 6.1 shows the
variations of thermo-mechanical properties with increasing temperature for a perfect

138
crystal of 864 atoms in a vacuum. Homogeneous melting due to lattice instability was
observed at a temperature of 1244 K, as evidenced by abrupt changes in the potential
energy, atomic density, Lindemann index, translational order parameter, and radial
distribution function. This phenomenon is commonly referred to as structural melting,
and the associated transition temperature is greater than the thermodynamic melting point
(940 K) by 32%.
To obtain the ratio between the structural and thermodynamic melting points, bulk
crystals with different void sizes in the range of 0.19-4.0 nm3 were considered, as shown
in Figure 6.2. The procedure followed the same approach adopted in previous studies
Temperature, K
Pote
ntia
lEne
rgy,
eV
Ato
mic
Den
sity
,ato
ms/
nm3
300 600 900 1200 1500-3.5
-3.4
-3.3
-3.2
-3.1
-3.0
-2.9
-2.8
110
115
120
125
130
135
140
145
150Potential EnergyAtomic Density
Temperature, K
Lind
eman
nIn
dex,δ
Tran
slat
iona
lord
erpa
ram
eter
,λ
300 600 900 1200 1500-0.05
0.00
0.05
0.10
0.15
0.20
0.25
0.00
0.50
1.00
λδ
r, nm
Rad
iald
istri
butio
nfu
nctio
n,g(
r)
1 2 3 4 50
3
6
9 Before MeltingAfter Melting
Figure 6.1: Variations of structural and thermodynamic properties during melting of bulk
aluminum; perfect crystal of 864 atoms without defects

139
(Lutsko et al., 1989; Phillpot et al., 1989; Solca et al., 1997; Solca et al., 1998; Agarwal
et al., 2003). The influences of void shape and location were also treated. For example, a
void of 1.05 nm3 can be implemented by creating either a 4x2x2 nm3 or a 4x4x1 nm3 void
geometry, through the removal of 64 atoms from a crystal of 864 atoms. Voids provide a
nucleation site for simulating thermodynamic melting. There, however, exists a range of
critical void size for thermodynamic melting. A very small void size is insufficient for
nucleation of the liquid phase, and a void size larger than the critical value can cause
collapse of the crystal. As compared to 1244 K for a perfect crystal, the melting point for
a crystal with voids initially decreases with void size, and then plateaus close to the
thermodynamic melting point of aluminum, as seen in Figure 6.3. The situation is
consistent with observations made in previous studies on argon and copper (Lutsko et al.,
1989; Solca et al., 1997). When the void size exceeds 1.7 nm3, the crystal collapses
suddenly, and the phenomenon of phase change cannot be simulated.
Figure 6.2: Different void geometries considered for bulk aluminum with 864 atoms
2.1 nm3 1.7 nm3 1.6 nm3
1.05 nm3 1.05 nm3 0.79 nm3
0.59 nm3 0.52 nm3 0.39 nm3
0.26 nm3 0.19 nm3 0.00 nm3

140
The melting temperature is a function only of the volume of the void, not its
shape. For a volume of 1.05 nm3, the two geometries shown in Figure 6.2 produce
exactly the same melting point. When the void size falls in the range of 1.0-1.7 nm3, the
void only provides a nucleation site and leads to the same temperature for the phase
change, i.e., the thermodynamic melting point, irrespective of the shape of the void. From
all these cases, the ratio of 1.32 between the structural and thermodynamic melting points
was consistently obtained.
Figure 6.4 shows the case of thermodynamic melting for a 1.05 nm3 void. The
variations of properties are not as steep as the structural melting because of the nucleation
at the void. The situation with a large void size of 4.0 nm3 is shown in Figure 6.5, for
which the crystal collapses. The potential energy decreases, but the atomic density
increases. The trend is opposite to that observed during melting. The whole phenomenon
occurs at a temperature (800 K) much lower than the thermodynamic melting point (940
K), indicating the collapse of the crystal and no phase change.
Void Volume (nm3)
Mel
ting
Tem
pera
ture
(Tm)
0 1 2 3 4
800
1000
1200
1400Structural Melting
Defect-nucleatedThermodynamic Melting
Structural Collapse
Figure 6.3: Effect of void size on melting of bulk aluminum with 864 atoms

141
Temperature, K
Pote
ntia
lEne
rgy,
eV
Ato
mic
Den
sity
,ato
ms/
nm3
300 600 900 1200 1500-3.5
-3.4
-3.3
-3.2
-3.1
-3.0
-2.9
-2.8
45
50
55
60
65Potential EnergyAtomic Density
Temperature, K
Lind
eman
nIn
dex,δ
Tran
slat
iona
lord
erpa
ram
eter
,λ
300 600 900 1200 1500-0.05
0.00
0.05
0.10
0.15
0.20
0.25
0.00
0.50
1.00
λδ
r, nm
Rad
iald
istri
butio
nfu
nctio
n,g(
r)
1 2 3 4 50
3
6
9 Before MeltingAfter Melting
Figure 6.4: Variations of structural and thermodynamic properties during melting of bulk
aluminum; crystal of 864 atoms with 1.05 nm3 void

142
Figure 6.6 shows the temporal evolution of atomic positions, illustrating the
difference between the structural melting, thermodynamic melting, and lattice collapse of
the crystal. In the case of structural melting, the phase transition is abrupt and
homogeneous, as seen in Figure 6.6a. The crystal has solid structure up to 124.2 ps, and a
phase change occurs suddenly at 126.9 ps, due to vibrational instability without any
nucleation. In the case of thermodynamic melting, however, the nucleation starts near the
void, as indicated by the local concentration of atoms around the void, and proceeds to
the rest of the crystal. Figure 6.6b shows thermodynamic melting with a void size of 1.05
Temperature, K
Pote
ntia
lEne
rgy,
eV
Ato
mic
Den
sity
,ato
ms/
nm3
300 600 900 1200 1500-3.5
-3.4
-3.3
-3.2
-3.1
-3.0
-2.9
-2.8
40
45
50
55
60Potential EnergyAtomic Density
Temperature, K
Lind
eman
nIn
dex,δ
Tran
slat
iona
lord
erpa
ram
eter
,λ
300 600 900 1200 1500-0.05
0.00
0.05
0.10
0.15
0.20
0.25
-0.50
-0.25
0.00
0.25
0.50λδ
r, nm
Rad
iald
istri
butio
nfu
nctio
n,g(
r)
1 2 3 4 50
3
6
9 Before CollapseAfter Collapse
Figure 6.5: Variations of structural and thermodynamic properties of bulk aluminum showing lattice collapse; crystal of 864 atoms with 4.0 nm3 void

143
nm3. The nucleation starts near the void at 85.8 ps, and the whole crystal melts by 102.3
ps. If the void size exceeds its critical value, the whole crystal collapses and cannot be put
in the category of either thermodynamic or structural melting. The breakdown of the
structure with a void of 4 nm3 is evidenced in Figure 6.6c, and is comparatively different
from the mechanism of melting. At 78.9 ps, when the temperature of the crystal is around
790 K, the atoms close to the void leave their positions and fill up the void space. No
phase change is observed in this case.

144
To study the effect of the number of atoms in bulk aluminum on defect-nucleated
melting, a similar analysis was performed for a crystal with 2048 atoms. The structural
and thermodynamic melting points (plateau region) are the same as those for 864 atoms,
i.e., 1244 and 940 K, respectively. Figure 6.7 shows the variation of the melting point as
a function of void size for bulk aluminum with 2048 atoms. The structural melting point
Figure 6.6: Temporal evolution of atomic positions, showing mechanisms of melting and structural collapse for bulk aluminum with 864 atoms (a) without defect, (b) with a void
size of 1.05 nm3, and (c) with a large void size of 4 nm3
void
0.0 ps
124.2 ps
0.0 ps 0.0 ps
130.5 ps
126.9 ps
102.3 ps
101.1 ps
85.8 ps
83.1 ps
81.3 ps
78.9 ps void
10-1 10-1 10-1X-Axis, nm
1
0
-1 Y-A
xis,
nm
Structural Melting
Thermodynamic Melting
Structural Collapse
(a) (b) (c)
1
0
-1 Y-A
xis,
nm
1
0
-1 Y-A
xis,
nm
1
0
-1 Y-A
xis,
nm

145
for a perfect crystal is observed at 1244 K, and the melting point decreases as the void
size increases, showing a trend identical to that of bulk with 864 atoms.
The range of the void size for defect-nucleated melting increases as the number of
atoms considered to represent the bulk phase increases. Figure 6.8 shows the variation of
the critical void size for the lattice collapse as a function of bulk volume. For 2048 atoms,
a void size on the order of 2-5 nm3 results in thermodynamic melting, as compared to 1-
1.7 nm3 for 864 atoms. From the study of prefect and defected crystals, it can be
concluded that the ratio between the structural and thermodynamic melting points
( /s mf T T= ) for aluminum is 1.32, close to the ratio of 1.234 for metals like copper.
Copper is known to have stronger cohesive forces than aluminum, and hence should have
a higher structural melting point than aluminum. The thermodynamic melting point of
copper is 1357 K, and the corresponding structural melting point is 1674 K, compared to
1244 K for aluminum.
Void Volume (nm3)
Mel
ting
Tem
pera
ture
(Tm)
0.0 2.5 5.0 7.5 10.0 12.5800
900
1000
1100
1200
Figure 6.7: Effect of void size on melting of bulk aluminum with 2048 atoms

146
After establishing the benchmark result for bulk aluminum, effort was applied to
explore the melting of nano particulates in the range of 2.0-9.0 nm. The effect of voids
with different geometries and sizes were considered. Results were compared for particles
with and without voids. Figure 6.9 shows some of the defect configurations treated for a
5.5 nm nanoparticle (5072 atoms). The influence of void size up to 14.1 nm3 on the
melting temperature is given in Figure 6.10. The melting temperature remains constant at
912 K (Puri and Yang, 2007) for small voids up to 1 nm3. Since the surface is already
available for nucleation, the presence of a small void just acts as another nucleation site
and exerts little influence on the thermodynamic phase change. The melting point, starts
dropping as the void volume increases beyond 1 nm3, due to the increase in forces
causing the structural instability. As the void size exceeds 8 nm3, the particle is unable to
hold these forces associated with the introduction of the void, and the crystal collapses
abruptly at 700 K for a 10 nm3 void.
Bulk volume (nm3)
Crit
ical
void
volu
me
(nm
3 )
10 20 30 40 50 600
5
10
15
20
864256
4000 atoms
2048
Figure 6.8: Variation of critical void size for lattice collapse as a function of bulk
aluminum volume

147
The melting phenomenon is also examined through the evolution of atomic
positions and density contours in Figs. 6.11 and 6.12 , respectively. In Figure 6.12a, the
nucleation process commences at 97.2 ps and is completed by 108.9 ps for a perfect
nanoparticle. In the case with a void size of 0.98 nm3, the nucleation starts
simultaneously at the surface and void at 92.1 ps. The phase change spreads to the rest of
the particle until melting occurs at 107.1 ps, as evidenced in Figure 6.12b. The void size
Figure 6.9: Different void geometries considered for a spherical 5.5 nm aluminum particle
Void Volume (nm3)
Mel
ting
Tem
pera
ture
(Tm)
0 5 10 15 20650
700
750
800
850
900
950
Figure 6.10: Effect of void size on melting for a spherical 5.5 nm aluminum particle
2.94 nm3 4.91 nm3 6.88 nm3
8.19 nm3 8.84 nm3
0.98 nm3 0.0 nm3 0.32 nm3

148
of 8.2 nm3 shown in Figure 6.12c is too big for the particle to retain its structural stability,
and the particle starts collapsing at 76.5 ps. The above analysis was conducted in a
vacuum. The effect of pressure was investigated at 1, 5, 10, 50, 100 and 300 atm. The
influence was found to be negligible, and the same melting temperature was observed for
all the pressures considered.
Figure 6.11: Time evolution of atomic positions, showing mechanism of melting for a 5.5 nm nanoparticle (a) without defect, (b) with a void size of 0.98 nm3, (c) with a large void
size of 8.2 nm3
0.0 ps
97.5 ps
0.0 ps 0.0 ps
108.0 ps
101.4 ps
107.7 ps
102.3 ps
92.4 ps
93.6 ps
84.0 ps
76.8 ps
2.50.0-2.5X-Axis, nm
2.5
0.0
-2.5
Y-A
xis,
nm
no void void size of 0.98 nm3
void size of 8.2 nm3
2.50.0-2.5 2.50.0-2.5
void void
(a) (b) (c)
2.5
0.0
-2.5
Y-A
xis,
nm
2.5
0.0
-2.5
Y-A
xis,
nm
2.5
0.0
-2.5 Y
-Axi
s, nm

149
A similar phenomenon was observed for a 8.5 nm particle, as shown in
Figure 6.13. Thermodynamic melting occurs at 940 K, which is in agreement with the
previous result (Puri and Yang, 2007). There is no variation in the melting point by
introduction of a void up to 5 nm3. The deviation from the thermodynamic melting point
then occurs due to the effect of nucleation near the void. As the void size increases, the
Figure 6.12: Time evolution of density contours, showing mechanism of melting for a 5.5 nm nanoparticle (a) without defect, (b) with a void size of 0.98 nm3, (c) with a large void
size of 8.2 nm3
500.0 1055.6 1611.1 2166.7 2722.2
0.0 ps
97.2 ps
0.0 ps 0.0 ps
108.9 ps
101.1 ps
107.1 ps
102.0 ps
92.1 ps
93.3 ps
83.7 ps
76.5 ps
5.02.5 0.0X-Axis, nm
5.0
2.5
0.0
Y-A
xis,
nm
no void void size of 0.98 nm3
void size of 8.2 nm3
5.02.5 0.0 5.0 2.5 0.0
5.0
2.5
0.0
Y-A
xis,
nm
5.0
2.5
0.0
Y-A
xis,
nm
5.0
2.5
0.0
Y-A
xis,
nm
(a) (b) (c)
Density (kg/m3)

150
lattice stability decreases, further lowering the melting point. The lattice structure of the
particle collapses when the void size becomes around 20 nm3. The melting mechanism
can also be explored by the temporal evolution of atomic positions and density contours
shown in Figs. 6.14 and 6.15, respectively. For a perfect particle, the phase change
proceeds from the surface to the interior, as evidenced in Figs. 6.14a and 6.15a. For the
void size of 5 nm3, nucleation starts at both the void and surface at 92 ps, as shown in
Figs. 6.14b and 6.15b. For a large void size of 20 nm3 exceeding the critical value, lattice
collapse occurs directly at 57.4 ps, and no phase change is observed, as indicated in
Figs. 6.14c and 6.15c.
Void Volume (nm3)
Mel
ting
Tem
pera
ture
(Tm)
0 20 40 60 80750
800
850
900
950
1000
Figure 6.13: Effect of void size on melting of a spherical 8.5 nm aluminum nanoparticle

151
Figure 6.14: Time evolution of atomic positions, showing mechanism of melting for a 8.5 nm nanoparticle (a) without defect, (b) with a void size of 5.0 nm3, (c) with a large void
size of 20.0 nm3
0.0 ps
90.0 ps
0.0 ps 0.0 ps
109.5 ps
100.8 ps
109.5 ps
98.4 ps
91.5 ps
97.8 ps
88.2 ps
80.1 ps
4.00.0-4.0X-Axis, nm
4.0
0.0
-4.0
Y-A
xis,
nm
no void void size of 5.0 nm3
void size of 20.0 nm3
4.00.0-4.0 4.00.0-4.0
4.0
0.0
-4.0
Y-A
xis,
nm
4.0
0.0
-4.0
Y-A
xis,
nm
4.0
0.0
-4.0Y
-Axi
s, nm
void void
(a) (b) (c)

152
6.4 Conclusions
The effect of defects in the form of voids on the melting of bulk aluminum and
aluminum nano-particulates in the size range of 2-9 nm has been studied using isobaric-
Figure 6.15: Time evolution of density contours, showing mechanism of melting for a 8.5 nm nanoparticle (a) without defect, (b) with a void size of 5.0 nm3, (c) with a large void
size of 20.0 nm3
0.0 ps
90.9 ps
0.0 ps 0.0 ps
119.1 ps
106.8 ps
109.8 ps
98.7 ps
91.8 ps
97.8 ps
93.9 ps
57.4 ps
8.0
4.0
0.0
Y-A
xis,
nm
no void void size of 5.0 nm3
void size of 20.0 nm3
8.04.0 0.0X-Axis, nm
8.04.0 0.0 8.04.0 0.0
8.0
4.0
0.0
Y-A
xis,
nm
8.0
4.0
0.0
Y-A
xis,
nm
8.0
4.0
0.0
Y-A
xis,
nm
500.0 1055.6 1611.1 2166.7 2722.2
(a) (b) (c)
Density (kg/m3)

153
isoenthalpic (NPH) ensembles. A variety of void shapes and sizes were treated, and
results were compared with perfect materials. Detailed mechanisms dictating the melting
phenomenon were explored. For nanoparticles, nucleation occurs simultaneously at both
the surface and void. Void becomes effective only if its size exceeds a critical value,
which increases with increasing size of the particle. For 5.5 nm and 8.5 nm particles, the
critical void sizes are 1 and 5 nm3, respectively. The effect of pressure on the melting of
nano-particulate aluminum was found to be insignificant in the range of 1-300 atm. For
bulk aluminum, the structural melting of aluminum takes place at a temperature of 1244
K. The ratio between the structural and thermodynamic melting points was found to be
1.32, independent of the void shape and size. This ratio was comparable to the result
obtained for other metals like copper.

Chapter 7
Thermo-Mechanical Behavior of Nano Aluminum Particles with Oxide Layers
7.1 Background
Nano aluminum particles are associated with higher specific surface area, higher
reactivity, potential ability to store energy in surface defects, lower melting points, and
smaller characteristic times for mass and energy transport. The work discussed in this
chapter explores some of the fundamental issues concerning the behaviors of nano-sized
aluminum particles with oxide layers, with emphasis placed on their thermo-mechanical
properties during melting. Aluminum particles are usually covered with a passivating
oxide layer (Al2O3) with a thickness of the order of 2-5 nm (Bucher et al., 2000), which
protects the particle from further oxidation and has a significant bearing on the
thermodynamic and chemical properties of the particle. When introduced in a high
temperature environment, the particle melts. The phenomenon involves solid-solid phase
transformations, diffusion of cations and anions, and cracking within the oxide layer.
Each of these processes plays an important role in determining the characteristics of
particle ignition and combustion over a broad range of scales.
Particle size, in addition to material properties and ambient conditions, dictates
the physiochemical behaviors of particles in various oxidizing environments. For micron-
sized and larger aluminum particles, the ignition temperature coincides with the melting
point of the surface oxide layer at 2327 K. The impervious nature of aluminum oxide

155
inhibits the ignition of aluminum. Once the layer melts, it coalesces to form an oxide cap.
The aluminum core is then exposed to the ambient gases for oxidation. At nano scales
(less than 100 nm), ignition occurs near the melting point of aluminum at 940 K through
cracking of the oxide shell, possibly caused by the pressure buildup and/or phase
transformations inside the shell. The primary objective of this work is to analyze these
phenomena using Molecular Dynamics (MD) simulations.
In the previous study, the melting behavior of a pure nano aluminum particle was
studied in the size range of 2-9 nm by means of molecular dynamics (MD) simulations
(Puri and Yang, 2007). Five different potential functions (the Lennard-Jones, glue,
embedded-atom, Streitz-Mintmire, and Sutton-Chen potentials) were implemented, and
isobaric-isoenthalpic (NPH) ensembles were used. The melting temperature of a pure
nanoparticle increases monotonically with increasing size, from 473 K at 2 nm to a bulk
value of 937 K at approximately 8 nm. Among the five potentials considered, only the
many-body glue and Streitz-Mintmire potentials accurately predicted the melting
temperature as a function of particle size. A subsequent study was performed to
investigate the effect of void size and pressure on the melting temperatures of bulk and
nano-particulate aluminum (Puri and Yang, 2007b). Alavi and Thompson (Alavi et al.,
2006) performed MD simulations for clusters of pure aluminum up to 1000 atoms,
focusing on the cluster structure and dynamic coexistence of melting. Alavi et al. further
explored the structure and charge distributions of bulk crystalline Al2O3, a surface slab of
Al2O3, and an isolated Al2O3 nanoparticle (Alavi et al., 2005). Campbell et al. simulated
the oxidation of naked aluminum with a size of 20 nm (Campbell et al., 2005).

156
The aforementioned studies have provided much information about the melting
behavior of pure aluminum particles at nano scales. Detailed knowledge for particles
coated with oxide layers, however, is not available. The present study addresses this issue
based on MD simulations.
7.2 Objectives
The Streitz-Mintmire potential was selected because of its ability to capture the
size dependence of thermodynamic properties, and to handle interactions between
aluminum and oxygen atoms. The work treats a spherical aluminum core in the face-
centered cubic (FCC) structure covered with an oxide shell in both amorphous and
crystalline (corundum) forms, as shown in Figure 7.1. Various fundamental processes
involved in particle melting are explored over an appropriate range of particle size and
oxide-layer thickness.
Isobaric-isoenthalpic (NPH) and micro canonical (NVE) ensembles are employed
to model the melting of bulk and nano-particulate aluminum. In NPH ensembles, a
system of N atoms is coupled to an external source by introducing additional variables
Figure 7.1: Schematic of a spherical nanoparticle with aluminum core and oxide shell
Al core
Al2O3 shell
ri
ro

157
into the Lagrangian using volume as an extra degree of freedom through mechanical
coupling (Anderson, 1980) as discussed in Chapter 4. The equations of motion for NPH
and NVE ensembles are numerically integrated using a fifth-order predictor-corrector and
the Verlet algorithm, respectively. An optimum heating rate of 0.1 K per femto-second is
employed based on the tradeoff between computational efficiency and resolution of
calculated thermodynamic and structural properties. The macroscopic thermodynamic
properties are derived from the instantaneous values using the equation of state and
statistical mechanics. The Lindemann index measures the vibrational motion of particles,
and is calculated as a function of the distance between atoms (Zhuo et al., 2002). The
translational-order parameter is indicative of the ordered structure in any phase (Gezelter
et al., 1997). It has a value of approximately unity for a solid state, and drops to nearly
zero for a liquid state. A separate post-processing code is also developed to superimpose
the numerical grid on the geometry under consideration, and to analyze the results based
on the contours of various thermodynamic properties.
7.3 Results and Discussion
The theoretical and numerical framework summarized in the preceding section
has been applied to study the particle melting behavior in the size range of 5-10 nm. The
simulation commences with a spherical aluminum particle in an FCC crystal structure
covered with either a crystalline or an amorphous oxide layer. The oxide thickness is 1-
2.5 nm. Figure 7.2 shows the structures of nanoparticles under consideration at room
temperature. A hexagonal crystal structure is chosen to treat crystalline Al2O3. In the case

158
of an amorphous layer, the shell is pre-heated to a temperature higher than the melting
point of Al2O3 (2327 K) and cooled to room temperature. The approach follows the
standard technique of simulating amorphous Al2O3 layer in literature (Hoang et al., 2005;
Gutierrez et al., 2002; Chang et al., 2004).
Figure 7.2: Aluminum nanoparticles with crystalline oxide layer at room temperature
5 nm 6 nm
7 nm 8 nm
core
shell

159
The aluminum core and oxide layer are equilibrated at room temperature for a
minimum of 15,000 time marching steps, using a micro-canonical ensemble. Figure 7.3
shows the variation of the Lindemann index during the equilibration calculation for a 5
nm particle (3 nm of core diameter and 1 nm crystalline oxide thickness). The index is
initially set to zero. After a transient phase, it stabilizes at constant values of 0.028 and
0.012 for the core and oxide layer, respectively. The particle is then heated at a rate of 0.1
K per femto-second.
Figure 7.4 shows the evolution of the Lindemann indices for both the aluminum
core and oxide shell. Figure 7.5 shows the density contours for the particle at different
temperatures. The phase transition in various stages is clearly observed. As the particle is
heated, the Lindemann index for the aluminum core increases and reaches an inflection
point at 0.03, at which point nucleation for the solid-liquid phase transition occurs at 650
K (see Fig. 7.5c). The density of the core drops from 2700 kg/m3 in the solid state to
2400 kg/m3 in the liquid state. The Lindemann index of the oxide shell drops due to the
Number of Time Integration Steps
Lind
eman
nIn
dex,δ
0 2500 5000 7500 10000 12500 15000
0
0.01
0.02
0.03
core
Number of Time Integration Steps
Lind
eman
nIn
dex,δ
0 2500 5000 7500 10000 12500 15000
0
0.01
0.02
0.03
shell
Figure 7.3: Equilibration calculations for 5 nm particle (3 nm core diameter and 1 nm crystalline oxide thickness)

160
solid-solid phase transition, after an initial increase to a peak value of 0.018 at 500 K
during the transient phase.
Alumina is known to exist in six different polymorphs (corundum, Rh2O3, Pbnm
perovskite, R3c-perovskite, A-type rare earth sesquioxide, and B-type rare earth
sesquioxide) (Duan, 1998). The initial structure studied here is corundum, which
transforms to one of the other five denser polymorphs. The contour plot at 550 K, shown
in Fig. 7.5b, indicates a density change from 3890 to 4050 kg/m3 as a result of such a
phase transition. In the crystalline structure of Al2O3, aluminum atoms occupy tetrahedral
or octahedral voids in the lattice formed by oxygen atoms. When these aluminum atoms
change their coordination from six to a higher value, a solid-solid transition to a denser
crystalline structure occurs (Duan, 1998). As the temperature continues to increase, the
shell melts at 1129 K, where the inflection point appears in the Lindemann-index profile.
The situation is similar to that for the aluminum core. The density of the oxide shell
decreases to 3010 kg/m3 in the liquid state, as shown in Fig. 7.5d.
Temperature, K
Lind
eman
nIn
dex,δ
500.0 750.0 1000.0 1250.0 1500.00.00
0.02
0.04
0.06
0.08
0.10
coremelting
Temperature, K
Lind
eman
nIn
dex,δ
500.0 1000.0 1500.0 2000.0 2500.0 3000.00.00
0.01
0.02
0.03
0.04
shell
melting
Figure 7.4: Evolution of Lindemann indices for aluminum core and crystalline oxide layer; 5 nm particle (3 nm core diameter and 1 nm oxide thickness)

161
Figure 7.5: Density distributions at various temperatures during heating of 5 nm particle
8.0 6.0 4.0 2.0 0.0 x axis, nm
T=300 K
(a) Initial State
8.0
6.0
4.0
2.0
0.0
y ax
is, n
m
8.0 6.0 4.0 2.0 0.0 x axis, nm
T=550 K
(b) Solid-Solid Phase Transition in Al2O3
8.0
6.0
4.0
2.0
0.0
y ax
is, n
m
8.0 6.0 4.0 2.0 0.0 x axis, nm
T=700 K
(c) Solid-Liquid Phase Transition in Al
8.0
6.0
4.0
2.0
0.0
y ax
is, n
m
8.0 6.0 4.0 2.0 0.0 x axis, nm
T=1200 K
(d) Solid-Liquid Phase Transition in Al2O3
8.0
6.0
4.0
2.0
0.0
y ax
is, n
m
Density (kg/m3) 500 1000 1500 2000 2500 3000 3500 4000

162
The size dependence of the melting phenomenon is examined in the range of 5-10
nm. In each case, the thickness of the oxide layer remains at 1 nm. Figure 7.6 shows the
evolution of the Lindemann indices for the aluminum core and oxide shell as a function
of temperature. The core melts at a temperature considerably lower than its bulk value of
940 K. The oxide layer melts at 1047, 1100 and 1159 K, respectively, for particle sizes of
6, 7 and 8 nm. Nucleation of the liquid phase takes place at relatively lower temperatures
of 986 and 1008 K for 9 and 10 nm particles. These temperatures are substantially lower
than the counterpart for bulk alumina which is 2327 K. The size dependence of the
melting behavior for pure aluminum was reported in the first previous study. The results
from the present study indicate an identical trend for both the aluminum core and oxide
shell. This phenomenon can be attributed to the increase in the specific surface area as the
particle size decreases.
The effect of the oxide-shell thickness on particle melting is explored in the range
of 1.0-2.5 nm. The core diameter is fixed at 5 nm. Figure 7.7 shows the evolution of the
Temperature, K
Lind
eman
nIn
dex,δ
500.0 750.0 1000.0 1250.0 1500.00.00
0.02
0.04
0.06
0.08
0.10 5 nm6 nm7 nm8 nm9 nm
10 nm
core
melting point
Temperature, K
Lind
eman
nIn
dex,δ
500.0 1000.0 1500.0 2000.0 2500.0 3000.00.00
0.01
0.02
0.03
0.04 5 nm6 nm7 nm8 nm9 nm10 nm
shell
melting point
Figure 7.6: Evolution of Lindemann indices for aluminum core and crystalline oxide layer; particle size of 5-10 nm (3-8 nm core diameter and 1.0 oxide thickness)

163
Lindemann index. The melting point of the oxide layer increases, from 1130 K for 1.0 nm
to 1313 K for 2.5 nm thickness. The overall melting temperature results are summarized
in Fig. 7.8.
To further understand the size dependence of alumina melting, a simulation was
performed for a pure alumina nanoparticle with a diameter of 5 nm. The evolution of the
Lindemann index shown in Fig. 7.9 indicates a melting temperature of 1284 K. This
value is consistent with that of alumina with an embedded aluminum core, which falls in
Temperature, K
Lind
eman
nIn
dex,δ
500.0 750.0 1000.0 1250.0 1500.00.00
0.02
0.04
0.06
0.08
0.10 7 nm (1.0 nm Al2O3)8 nm (1.5 nm Al2O3)9 nm (2.0 nm Al2O3)10 nm (2.5 nm Al2O3)
core
melting point
Temperature, K
Lind
eman
nIn
dex,δ
500.0 1000.0 1500.0 2000.0 2500.0 3000.00.00
0.01
0.02
0.03
0.04 7 nm (1.0 nm Al2O3)8 nm (1.5 nm Al2O3)9 nm (2.0 nm Al2O3)10 nm (2.5 nm Al2O3)
shell
melting point
Figure 7.7: Evolution of Lindemann indices for aluminum core and crystalline oxide layer; particle size 7-10 nm (5 nm core diameter and 1.0-2.5 nm oxide thickness)
Particle Diameter, nm
T mel
t,K
5.0 6.0 7.0 8.0 9.0 10.0600
750
900
1050
1200
1350Al2O3 shellAl core
1nm shell thicknes
Oxide Layer Thickness, nm
T mel
t,K
0.5 1.0 1.5 2.0450
600
750
900
1050
1200
1350
1500Al2O3 shellAl core
5 nm core
Figure 7.8: Variation of melting points as function of core size and oxide layer thickness

164
the range of 986-1313 K. The Lindemann index also bears a close resemblance to the
case with an aluminum core. It increases rapidly in an initial transient phase, reaches a
peak at 0.025, and then decreases, because of the phase transformation to a denser phase.
The inflection point at 1284 K marks the transition from the solid to the liquid state.
In addition to the crystalline structure, the situation with an amorphous oxide
layer was investigated. To accomplish this, the crystalline structure was heated to a
temperature greater than its melting point and then rapidly cooled to 300 K to obtain an
amorphous layer. The resulting nanoparticle was heated afterwards to allow examination
of its thermo-mechanical behavior during the melting process. Figure 7.10 shows the
evolution of the Lindemann indices for a 5 nm particle covered with either a crystalline
or an amorphous oxide layer. The core melts at almost the same temperature for both
cases. The sharp variation of the Lindemann index for the crystalline structure, however,
is not observed in the case with the amorphous shell. For a change to the beta or the
gamma form, a minimum of 4 nm thick amorphous layer would be required (Trunov et
Temperature, K
Lind
eman
nIn
dex,δ
500 1000 1500 2000 2500 3000 35000.00
0.01
0.02
0.03
melting point
Figure 7.9: Evolution of Lindemann index during heating of 5 nm pure crystalline
alumina particle

165
al., 2005). Since the present study only considers oxide layers up to 2.5 nm thick, the
transformation from the amorphous to the gamma phase does not take place. The solid-
to-liquid phase change is also absent in the case of the amorphous oxide shell.
During the particle melting, the density of the aluminum core decreases from
2700 to 2400 kg/m3, an 11.1% change. The associated volume dilatation exerts a
significant influence on the stress development in the oxide shell. The whole process can
be theoretically treated as pressure build-up in a spherical shell. For the aluminum core,
the bulk modulus, K, is 76 GPa. The pressure developed inside the shell becomes 8.4
GPa, based on the relation K pρ ρ= − ∂ ∂ . Following basic theories in solid mechanics,
the stresses in spherical coordinates under an equilibrium condition can be obtained from
the following equation (Ragab, 1999)
Temperature, K
Lind
eman
nIn
dex,δ
500.0 750.0 1000.0 1250.0 1500.00.00
0.02
0.04
0.06
0.08
0.10CrystallineAmorphous
core
Temperature, K
Lind
eman
nIn
dex,δ
500.0 1000.0 1500.0 2000.0 2500.0 3000.00.00
0.01
0.02
0.03CrystallineAmorphous
shell
Figure 7.10: Evolution of Lindemann indices during heating of 5 nm particles with crystalline and amorphous oxide layers (3 nm core diameter and 1 nm oxide thickness)
3 3 3
3 3 3o i
r io i
r r rpr r r
σ⎛ ⎞⎛ ⎞−
= ⎜ ⎟⎜ ⎟ −⎝ ⎠⎝ ⎠ (7.1)
3 3
3 3 312
o ii
o i
r rpr r rθ φσ σ
⎛ ⎞⎛ ⎞= = + ⎜ ⎟⎜ ⎟ −⎝ ⎠⎝ ⎠
(7.2)

166
where pi is the pressure exerted on the shell due to the volume expansion of the core, r the
radial coordinate, and rσ , θσ , φσ the stresses in the radial, azimuthal and polar
directions, respectively. The subscripts i and o denote the inner and outer radii of the
oxide shell, respectively, as illustrated in Fig. 7.1. The maximum stress occurs at the
interface. Table 7.1 lists the stress values for different particle sizes. The tensile strength
of alumina is 0.2552 GPa at room temperature and decreases by an order of magnitude
when the temperature exceeds 1300 K (Shackelford, 2000). Since the stresses in the shell
caused by the core melting are an order of magnitude higher than the tensile strength, the
shell should crack. In the present MD study, however, the shell remains intact. This may
be attributed to the fact that the rate of the solid-to-liquid phase transition in the shell is
too fast to allow for any substantial stress development in the solid phase.
Core Diameter (nm)
Oxide Thickness (nm)
Particle Diameter (nm)
,θ φσ σ (GPa)
rσ (GPa)
4.0 1.0 6.0 9.505 8.4 5.0 1.0 7.0 11.424 8.4 5.0 1.5 8.0 8.269 8.4 5.0 2.0 9.0 6.807 8.4 5.0 2.5 10.0 6.000 8.4 6.0 1.0 8.0 13.394 8.4 7.0 1.0 9.0 15.396 8.4 8.0 1.0 10.0 17.419 8.4
Several experimental studies on aluminum substrates and films have revealed that
when an aluminum particle coated with an oxide layer is heated from room temperature,
the oxide layer grows due to diffusion of aluminum cations through the layer and bonding
with oxygen atoms at the surface (Jeurgens et al., 2002). It is instructive to consider
whether a similar phenomenon occurs for nanoparticles in the present research. Before
Table 7.1: Stresses developed inside the oxide shell due to melting

167
heating, the core consists of aluminum atoms arranged in a FCC structure, and the shell
contains Al2O3 atoms arranged in a hexagonal structure. The phenomenon of diffusion of
aluminum cations for cases with different core size and thickness is shown in Figs. 7.11
and 7.12 respectively. These show snapshots of particle structures with crystalline shells.
The core diameter is fixed at 5 nm, and the shell thickness varies from 1 to 2 nm The
diffusion of aluminum cations through the shell is evident, especially for smaller
particles. For an amorphous shell, the diffusion of cations proceeds much faster, as shown
in Figure 7.13. The potential gradient caused by the positive and negative charges gives
rise to the movement of cations and the ensuing growth of the shell. Once the charge
gradient is nullified due to the diminished diffusion of cations, the shell stops growing.
This commonly happens when the shell thickness reaches 5 nm, a typical oxide-layer
thickness reported in the literature (Jeurgens et al., 2002). Since the present study focuses
on thermo-mechanical behavior, all the simulations were carried out for nanoparticles in
a vacuum. If the particle were exposed to oxygen, these aluminum cations would
combine to form species like AlO, Al2O, which would then deposit on the surface and
increase the oxide thickness.

168
Figure 7.11: Snapshots of 5-8 nm nano aluminum particles with crystalline oxide layer, showing diffusion of aluminum cations (core size of 3-6 nm and oxide thickness of 1 nm)
160 ps 42 ps
Diffusing Al cations
6 nm (4 nm core, 1 nm shell) 5 nm (3 nm core, 1 nm shell)
16 ps 8 nm (6 nm core, 1 nm shell) 36 ps 7 nm (5 nm core, 1 nm shell)

169
Figure 7.12: Snapshots of 7-9 nm nano aluminum particles with crystalline oxide layer, showing diffusion of aluminum cations (core size of 5 nm and oxide thickness of 1-2 nm)
7 nm (5 nm core, 1 nm shell)
Diffusing Al cations
1129 K 8 nm (5 nm core, 1.5 nm shell) 1187 K
9 nm (5 nm core, 2.0 nm shell) 1202 K

170
Molecular dynamics simulations provide exclusive insight into the atomistic
mechanisms involved for smaller nanoparticles which can’t be explained by continuum
laws. From kinetic gas theory, the mean free path of oxygen molecules can be calculated
using Eqn. 7.3.
where Ru is the universal gas constant, T the temperature, P the pressure, NA the
Avogadro’s number and d the diameter of the gas molecule. Assuming the diameter of
oxygen molecules to be 0.37 nm, at 300 K and 1 atm pressure, the mean free path of
oxidizer species is 67 nm. As a result, continuum laws cannot be applied to particles
smaller than 67 nm. Knudsen number, defined as the ratio of molecular mean free path to
the representative physical length scale can be expressed as in Eqn. 7.4
Figure 7.13: Snapshot showing diffusion of aluminum cations in crystalline and
amorphous oxide layers for 5 nm particle (oxide thickness of 1 nm)
22u AR T d N Pλ π= (7.3)
Kn Lλ= (7.4)
Crystalline
Diffusing Al cations
Amorphous 5 nm 5 nm

171
Using calculations of mean free path and Knudsen number, different regimes for
particle combustion can be determined at different temperatures and pressures as shown
in Figure 7.14. At high temperatures and low pressures, continuum laws fail to predict the
thermo-mechanical phenomena at nano scales. In the regime with Knudsen number
greater than one, molecular dynamics simulations need to be used to explore various
phenomena. In the continuum limit with low Knudsen numbers, a careful study of length
scales and time scales can be performed to determine the mode of ignition and
combustion which is discussed in detail in next chapter.
Using the results of this particular work and previous simulations, a multi-scale
theory for the ignition and combustion of particulate aluminum is being proposed
covering a broad range of scales in Chapter 9. Based on the various thermo-mechanical
phenomena going on within the core and the shell, the whole time history from ignition
till particle burnout has been divided into five stages, which explain the behavior of nano
as well as micron-sized particles. A thermodynamic explanation for the observed
Particle diameter (m)
Pres
sure
(atm
)
10-9 10-8 10-7 10-6 10-5
10-2
10-1
100
101
102300 K500 K1000 K1500 K2000 K3000 K
Kn>1
Continuum lawsvalid (Kn<1)
Figure 7.14: Domain for application of continuum laws based on particle diameter and
Pressure

172
thickness of the oxide layer based on phase diagrams has also been provided. An attempt
has been made to explore the effect of pressure, temperature, oxidizer, oxide thickness
and particle diameter on ignition and oxidation. Characteristics like heterogeneous vs.
homogeneous combustion, diffusion vs. kinetically controlled mechanism, mode of
ignition etc. have been discussed in context of the unified model. All the phenomena are
closely coupled and the exclusive combinations of length and time scales determine the
six different modes of ignition.
7.4 Conclusions
A molecular-dynamics study was performed to examine the thermo-mechanical
behavior of nano aluminum particles coated with oxide layers in both the crystalline and
amorphous forms. The size dependence of the melting phenomenon was first examined
for particles in the range of 5-10 nm, with the oxide thickness fixed at 1 nm. In each case,
the oxide layer melted at 986-1159 K, substantially lower than the bulk value melting
point of 2327 K. The effect of the oxide-shell thickness was explored in the range of 1.0-
2.5 nm, with the core diameter fixed at 5 nm. The melting point of the oxide layer
increased from 1130 K for 1.0 nm to 1313 K for 2.5 nm thickness. The results were
compared with the case of a pure 5 nm alumina nanoparticle, for which melting was
observed at 1284 K. The Lindemann-index curve showed qualitatively the same trend as
that seen for the oxide layer with an aluminum core.
For a crystalline oxide layer, melting was preceded by a solid-solid phase
transition to a denser polymorph, characterized by a decrease in the Lindemann index, as

173
the particle was heated. This phenomenon, however, was absent in the case of amorphous
layers. A structural analysis indicated that the stresses in the shell, caused by the volume
dilatation in the aluminum core during melting, were an order of magnitude higher than
the tensile strength. The shell may therefore crack if it melts at a rate slow enough to
allow stress development in the solid phase. Diffusion of aluminum cations through the
oxide shell was also investigated.
The present study has shed much insight into the various thermo-physical
processes involved in the melting of nano aluminum particles. The results provide a basis
for the development of a multi-scale theory for the ignition and combustion of nano-
particulate aluminum.

Chapter 8
Pyrophoricity of Aluminum at Nano Scales
8.1 Background
Pyrophoricity has been the subject of various theoretical and experimental studies,
especially in the area of metal dust explosion since 1960s. The term pyrophoricity refers
to the tendency of a substance to burn spontaneously in the presence of an oxidizing
medium without any ignition source. With increasing interest in nanotechnology, and
distinct physical and chemical characteristics at such scales, nano particulates present
more handling difficulties as compared to their micron-sized counterparts. Finer particles
are more prone to ignition, and their dust clouds can even lead to violent explosion. At
nano scales, the reduced ignition temperature, high specific surface area, and high
transport rate substantially enhance the pyrophoricity of the substance. Among metals,
platinum, iron, titanium, magnesium, cobalt, nickel, and aluminum are considered highly
pyrophoric. Powders can be classified into three categories based on the degree of
explosion hazard. The first group is considered extremely explosive including aluminum
and magnesium, the second average explosive including iron, and the third slightly
explosive (Buoik, 1954).
For nano aluminum particles, serious safety concerns are raised not only for
storage and usage, but also for manufacturing (Kondis, 1976; Kondis, 1976b). Particulate
aluminum is prepared through the milling technique either in an inert atmosphere of

175
hydrocarbons, or in an environment with an appropriate oxygen concentration to form a
protective coating on the new surfaces as fine particles are formed. As the particle size
decreases, the reactivity increases due to the increase in the specific surface area and the
decrease in the diffusion time scale. Particulates then favor welding over comminution
once the particle size falls below a critical value. Moreover, the dried powders produced
from such milling processes can cause explosions or fires initiated by exposing nascent
(un-oxidized) mass to the atmosphere. Particles of the order of less than 1 micron thus
produced are considered an explosive hazard (Kondis, 1976b). Reliable measurements of
the critical particle size that can lead to explosion are required during manufacturing. On
the other hand, pyrophoricity, if controlled, can be employed for some useful applications
like decoy flare (Baldi and Alfonso, 1991). Such applications require sound knowledge of
pyrophoricity limits of aluminum.
Glassman et al. (Glassman et al., 1992) defined the conditions for metal particles
to be pyrophoric, and made a distinction between pyrophoricity and explosivity.
Pyrophoricity occurs when the energy release from the formation of the oxide shell on a
nascent particle is sufficient to heat the metal to its boiling point and to vaporize it. A
simple lump-parameter analysis based on a quasi-steady model was performed to obtain
the critical ratio of the shell thickness to the core size, ( )crRδ , for pyrophoricity. A
universal value of ( ) 0.175cr
Rδ = was found. The work ignored heat losses to ambient
gases and the transient development within the particle during the energy-release process.
Furthermore, bulk material properties were employed in the analysis. At nano scales,
particles exhibit many behaviors distinct from their counterparts at micro or larger scales.

176
The physiochemical properties become size-dependent, and the thermodynamic melting
and boiling points, heats of fusion, vapor pressure, and ignition temperature are
substantially changed from their bulk values (Eckert et al., 1993; Alavi et al., 2006; Jiang
et al., 2002; Liang et al., 2003; Zhang et al., 1999; Panda and Pratsinis, 1995; Puri and
Yang, 2007). In addition, the growth of the oxide layer is characterized by heterogeneous
surface reactions, phase transformations within the oxide layer, diffusion of Al cations
and O anions through the layer, and direct attack at the aluminum core surface by
oxidizer atoms (Jeurgens et al., 2000). All these processes are transient in nature, as a
result of the small characteristic length and time scales involved.
The purpose of the present study is to develop an improved theory of
pyrophoricity by incorporating various distinct features of nano materials. Since the
combustion mode switches from homogeneous gas-phase reactions to heterogeneous
surface reactions as the particle size reduces to nano scale, the condition for pyrophoricity
is now defined by the critical size for which the heat released during the growth of oxide
is sufficient to melt the core, and subsequently rupture the oxide shell. Both nascent and
oxide-coated (passivated) nano-particulate aluminum is explored over a range of limiting
oxide thickness of practical concern.

177
8.2 Size Dependence of Properties at Nano Scales
8.2.1 Thermodynamic Properties
Particles at nano scales show strong size dependence of properties due to high
specific surface area and reactivity. A recent molecular dynamics (MD) study by Puri and
Yang (Puri and Yang, 2007) indicated that the melting temperature of nascent particulate
aluminum decreases monotonically with decreasing diameter, from a value of 937 K at
approximately 8 nm to 473 K at 2 nm. The same trend occurs for the alumina shell, for
which the melting temperature may decrease substantially to 1100 K, compared to its
bulk value of 2327 K (Puri and Yang, 2008d).
These findings are consistent with those from other experimental and numerical
studies by Eckert et al. (Eckert et al., 1993) and Alavi et al. (Alavi et al., 2006),
respectively. Eckert et al. synthesized nano aluminum powders coated with crystalline
oxide by mechanical attrition in argon, hydrogen, and oxygen atmospheres. A significant
reduction in the melting point with decreasing grain size was observed by means of
differential scanning calorimetry (DSC) in the size range of 13-40 nm (Eckert et al.,
1993). The melting point decreases from its bulk value of 940 K at 40 nm to 840 K at 13
nm. The melting temperature and enthalpy of fusion vary linearly with the reciprocal of
the particle size, as follows
977.4 1920 / , 13 40mT D D nm= − ≤ ≤ (8.1)
14.705 177.49 / 13 40fusL D D nm= − ≤ ≤ (8.2)

178
where Tm is the melting point in K, Lfus the latent heat of fusion in kJ/mol, and D the
particle diameter in nm. The relation is valid in the size range of 13-40 nm, with the oxide
thickness of 2-5 nm.
In a recent model proposed by Jiang et al. (Jiang et al., 2002; Liang et al., 2003),
variations in the melting temperature and heat of fusion for nano-sized metal particles
were correlated based on the Lindemann criterion of melting, taking the following
general functional forms.
where Tm,b and Lfus,b are the bulk values for the melting temperature and heat of fusion,
respectively, l the length of Al-Al atomic bond and Ru the universal gas constant. A
similar expression can be written specifically for aluminum in simplified form using
Mott’s equation for the melting entropy (Zhang et al., 1999)
For aluminum, the critical radius, R0 has the value of 0.9492. The material
constant, α , takes the form
where Ru is 8.314 J/mol/K, and α is 1.9186 for aluminum. Figure 8.1 shows the melting
temperature and enthalpy of fusion as a function of particle size, calculated from Eqns.
( ) ( ) ( ), , ,exp 2 3 6 1m m b fus b m bT T L RT D l= − − (8.3)
( ) ( ) ( ) ( ) , , ,exp 2 3 6 1 1 1 6 1fus fus b fus b m bL L L RT D l D l⎡ ⎤= − − − −⎣ ⎦ (8.4)
( ), , 0
( ) ( ) 11/ 1
fus m
fus b m b
L R T RL T R R
⎡ ⎤= −⎢ ⎥−⎣ ⎦
(8.5)
, 0
( ) 1exp/ 1
m
m b
T RT R R
α⎛ ⎞−= −⎜ ⎟−⎝ ⎠
(8.6)
,
,
21
3fus b
u m b
LR T
α = + (8.7)

179
8.5 and 8.6. For comparison the thermo-physical properties for bulk aluminum and
alumina are listed in Table 8.1.
The vapor pressure, Dp , of aluminum near the surface of a liquid aluminum droplet can
be calculated using the Kelvin equation as (Panda and Pratsinis, 1995)
Particle Size (nm)
Mel
ting
Tem
pera
ture
,K
Hea
toff
usio
n,kJ
/mol
20 40 60 80 1000
200
400
600
800
1000
1200
0.0
2.0
4.0
6.0
8.0
10.0
12.0
melting tempheat of fusion
Figure 8.1: Size dependence of melting point and heat of fusion for nano-particulate
aluminum
Table 8.1: Thermo physical properties of bulk aluminum and alumina
Properties Aluminum Alumina Vaporization Temperature (1atm) 2740 K 4000 K Density 2700 kg/m3(Solid)
2377 kg/m3(Liquid) 3050 kg/m3(Amorphous) 3050 kg/m3(Gamma) 3900 kg/m3(Alpha) 3010 kg/m3(Liquid)
Heat of fusion 10.7 kJ/mol -
Heat of vaporization 293.4 kJ/mol -
( )0 1exp 4 /D Bp p k TDσν= (8.8)

180
where 1ν is the monometer volume calculated using the bulk density of aluminum. The
vapor pressure of aluminum over a flat surface, p0, and the surface tension, σ of
aluminum, can be calculated using the following formulae, (Hultgren et al., 1973; Rhee,
1970) respectively.
For a given ambient pressure and particle diameter, the above three correlations can be
solved iteratively to calculate the vaporization temperature. Consequently the effect of
particle size on vaporization temperature at different ambient pressures can be obtained,
as shown in Figure 8.2.
036373exp 13.07P atm
T⎛ ⎞= −⎜ ⎟⎝ ⎠
(8.9)
948 0.202 /T Dyne cmσ = − (8.10)
Particle Size, nm
Vap
oriz
atio
nTe
mpe
ratu
re,K
10 20 30 40 502400
2500
2600
2700
2800
2900
3000P = 2.0 atm
1.0 atm
0.5 atm
Figure 8.2: Size dependence of vaporization temperature for nano-particulate aluminum

181
8.2.2 Ignition Characteristics
Figure 3.13 summarized the ignition temperatures of aluminum as a function of
particle diameter, compiled from various experimental studies. Micron-sized and larger
particles ignite around the melting point of alumina (2327 K), and burn with a detached
flame front through the vaporization of aluminum (Glassman, 1977; Glassman, 2001;
Yetter and Dryer, 2001). When the particle size decreases to one micron or smaller,
ignition temperatures become scattered between 940-2327 K. A further decrease of the
particle size to 100 nm renders ignition at the melting temperature of aluminum core (940
K), or even less. A major factor contributing to this phenomenon is the heterogeneous
surface reactions either due to direct attack of oxidizer molecules through the cracks in
the oxide layer, or due to diffusion of ions through the oxide layer. Both mechanisms
need to be considered to provide a more complete description of particle pyrophoricity.
8.3 Pyrophoricity of Nascent Aluminum Particles
The Glassman theory of pyrophoricity assumes homogeneous reactions in the gas
phase (Glassman et al., 1992). The flame structure and associated energy release process
are diffusion controlled (Glassman, 2001). At nano scales, the situation becomes
fundamentally different. Ignition may occur at a temperature corresponding to the
melting point of the aluminum core (Rai et al., 2004). Much energy is released at the
surface through heterogeneous reactions. The process is pre-dominantly kinetics-
controlled. Under this condition, metal particle can thus be said to be pyrophoric if the
heat released during the formation of an oxide shell with a specified thickness is

182
sufficient to melt the core and rupture the oxide shell. Heterogeneous reactions involving
direct oxidation at the surface then take over and consume the metal. The whole process
is shown schematically in Figure 8.3.
The energy equation used to solve for temperature of the particle can be expressed as
Figure 8.3: Pyrophoricity at nano scales with melting of aluminum core as primary mechanism of ignition
( )2 3 2 3
, ,Al Al p Al O Al O p
Al ox ox heat mol
d m c T m c Tm H q
dt
+= − (8.11)
Al2O3(s) Al(s) Al(l)
O Anions
Al Cations
Phase Transformations
O2 Molecules
O2 Molecules
particle heating and core melting
shell cracking and oxidizer penetration
shell fragmentation and direct oxidation at aluminum surface

183
where c is the specific heat, T the temperature, m the mass, t the time, Hox the heat release
by oxidation, and q the heat loss. The heat loss in all the simulations is incorporated using
the following correlation in the molecular limit (Filippov et al., 2000).
where pT is the temperature at the surface of the aluminum core, gT the gas temperature,
gp the gas pressure, gm the mass of oxygen molecule, *γ the average value of adiabatic
constant, Bk the Boltzmann’s constant, R the particle radius, and α the accommodation
coefficient. The expression for ,Al oxm is obtained from different correlations appropriate
for the phenomenon under consideration. The mass and energy conservation equations
are simultaneously solved to obtain the temperature profiles, thickness of the oxide layer
and size of the aluminum core.
Once a nascent aluminum particle is introduced in air at room temperature, the
direct oxide attack can be formulated using inward Stefan’s flow correlation (Trunov et
al., 2006)
where, 2
oxOm is the rate of increase in mass of the oxide layer, χ the molar fraction of
oxygen in gaseous environment, µ the molecular mass, gasρ the density of the oxidizer,
2OD the diffusion coefficient of oxygen in air, R the radius of the particle, and f the
fraction of the surface exposed to oxidizer. The rate of growth can be used to calculate
*2
*
8 1 12 1
g B g g p
g
p k T m Tq R
Tπ γαπ
γ⎛ ⎞⎛ ⎞+
= −⎜ ⎟⎜ ⎟⎜ ⎟−⎝ ⎠⎝ ⎠ (8.12)
2 3
2 2
2
2
8ln 1
3Al Oox O
O gas O pgas O
m D R fπµµχ ρ
µ µ⎛ ⎞
= − −⎜ ⎟⎜ ⎟⎝ ⎠
(8.13)

184
the corresponding increase in oxide thickness and reduction in aluminum core radius.
Assuming that 1R and 1δ are the initial core size and thickness of the oxide shell
respectively and 2R and 2δ are the values after growth of oxide layer, mass conservation
between the two states can be written as
Eqns. 8.11 to 8.14 can be solved simultaneously and Figure 8.4 shows the results.
For an aluminum particle of size 5 nm, the heat released melts the core and vaporizes
aluminum instantaneously in 0.4 nanoseconds. A 14 nm particle reaches the melting
temperature, and the heat released is sufficient to melt the core too. Hence it is
pyrophoric. Using a parametric analysis, the critical particle size in the limiting case was
found to be 20 nm. Particles larger than 20 nm are stable and a case of non-pyrophoricity
is also shown in Figure 8.4 for illustration. The temperature rises to around 650 K but
drops off as the rate of heat losses become dominant.
( ) ( ) 2 3 2 3
3 33 3 3 31 1 1 1 2 2 2 2
4 4 4 43 3 3 3Al O Al Al O AlR R R R R Rπ δ ρ π ρ π δ ρ π ρ+ − + = + − + (8.14)

185
8.4 Pyrophoricity of Oxide-Coated Aluminum Particles
8.4.1 Particles with Thin Oxide Shell
It is also a well known fact that aluminum particles are covered with an oxide
coating of the order of 0.3-5 nm. So far the effort has been applied to nascent aluminum
particles. To apply the theory at nano scales, the initial effect of oxide coating also needs
to be considered. Jeurgens et al. studied the thermodynamic stability of amorphous oxide
films on aluminum and concluded that in the temperature range of up to 873 K, the
Time, ns
Tem
pera
ture
,K
0.1 0.2 0.3
500
1000
1500
2000
Temperature, K
Time, ns
Tem
pera
ture
,K
0.00 0.25 0.50 0.75250
500
750
Time (ns)
Tem
pera
ture
,K
0 10 20 30200
400
600
800
Figure 8.4: Time evolution of temperature for nascent aluminum particles
5 nm (pyrophoric) 14 nm (pyrophoric)
24 nm (non-pyrophoric)

186
amorphous layers stabilize up to 0.5, 2.5 and 5.0 nm for 111, 100, and 110
crystallographic faces (Jeurgens et al., 2000). In another study by Puri and Yang (Puri
and Yang, 2008d) it was observed that at nano scales aluminum cations can diffuse
through the oxide layer, reacting with the oxidizer ions. This would eventually increase
the thickness of the layer and simultaneously consume the aluminum core. This implies
that an aluminum particle with a coating of few nanometers, can be oxidized up to the
limiting oxide thickness and if this heat release is sufficient to melt the core and
subsequently crack the oxide coating, the small particles can explode/burn
pyrophorically.
The rate of growth is limited by the diffusion of ions and can be calculated
theoretically using Mott’s potential. The mathematical equation governing the process is
given by (Jeurgens et al., 2000)
where Ω is the volume of oxide formed per cation, n the number of cations per unit area
which may jump the energy barrier U , υ the attempt frequency of cation jump, q the
charge of migrating cation, 2a the distance from potential minimum to next potential
minimum, k the Boltzmann constant, T the temperature, 0E the electric field due to
Mott’s potential MV and ( )x t denotes the oxide film thickness at time t . The constants
are given in detail in work by Jeurgens et al. In non-adiabatic conditions the rate of ion
transport is not enough to generate sufficient heat to overcome heat loss and particles
remain stable as shown in Figure 8.5. Even a thickness of 0.5 nm is sufficient to protect
the particle from getting consumed. In other cases for 5-50 nm particle size, the
0exp U qaEdx ndt kT
υ − +⎛ ⎞= Ω ⎜ ⎟⎝ ⎠
(8.15)
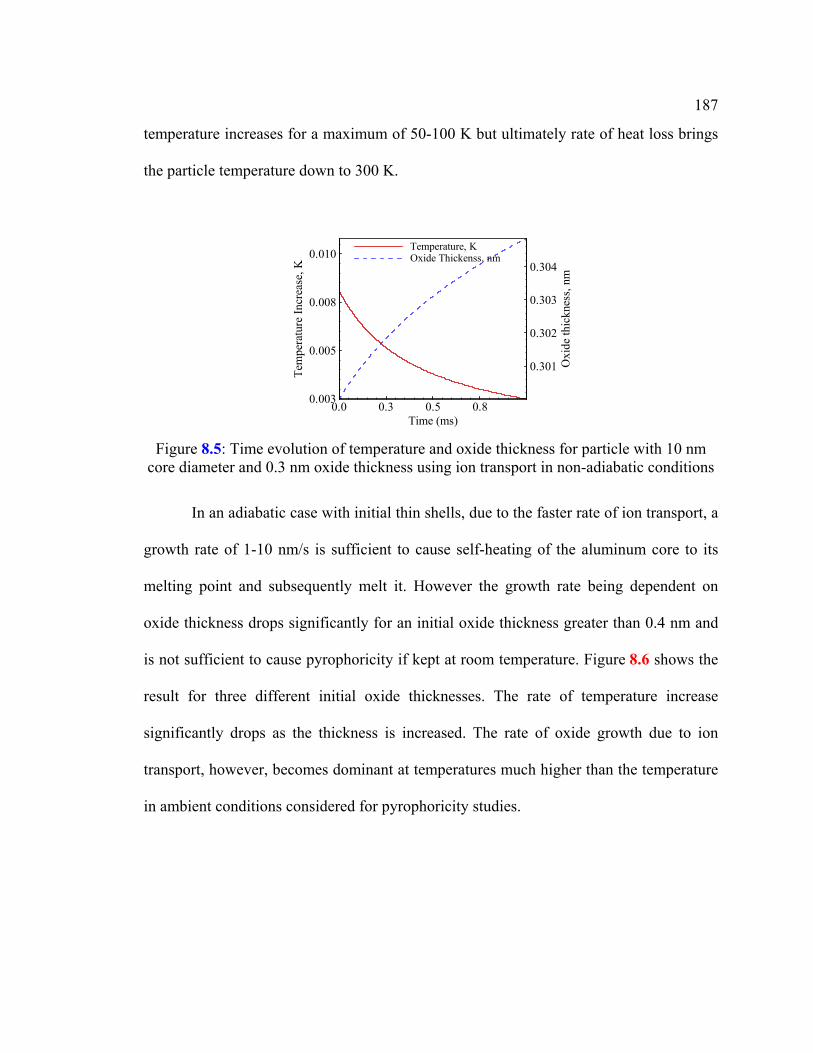
187
temperature increases for a maximum of 50-100 K but ultimately rate of heat loss brings
the particle temperature down to 300 K.
In an adiabatic case with initial thin shells, due to the faster rate of ion transport, a
growth rate of 1-10 nm/s is sufficient to cause self-heating of the aluminum core to its
melting point and subsequently melt it. However the growth rate being dependent on
oxide thickness drops significantly for an initial oxide thickness greater than 0.4 nm and
is not sufficient to cause pyrophoricity if kept at room temperature. Figure 8.6 shows the
result for three different initial oxide thicknesses. The rate of temperature increase
significantly drops as the thickness is increased. The rate of oxide growth due to ion
transport, however, becomes dominant at temperatures much higher than the temperature
in ambient conditions considered for pyrophoricity studies.
Time (ms)
Tem
pera
ture
Incr
ease
,K
Oxi
deth
ickn
ess,
nm
0.0 0.3 0.5 0.80.003
0.005
0.008
0.010
0.301
0.302
0.303
0.304
Temperature, KOxide Thickenss, nm
Figure 8.5: Time evolution of temperature and oxide thickness for particle with 10 nm
core diameter and 0.3 nm oxide thickness using ion transport in non-adiabatic conditions

188
8.4.2 Particles with Thicker Oxide Shell
Pyrophoricity of particles with thicker oxide shells was also explored. This
involves growth of amorphous layer, and phase transformations using the correlations
obtained by Trunov et al. (Trunov et al., 2006). However, the rate of increase in the
thickness of a particular phase of oxide and its transformation to other phases can be
computed by fitting experimental data to Arrehenius type expressions. For phase
transformations, the rate of mass increase, ( 1)tri im − → of the oxide phase i transformed from
oxide phase 1i − can be described as
Time (ms)
Tem
pera
ture
incr
ease
,K
Oxi
deTh
ickn
ess(
nm)
0 0.25 0.5 0.7510-10
10-8
10-6
10-4
10-2
100
0.30
0.35
0.400.30 nm0.35 nm0.40 nm
Figure 8.6: Time evolution of temperature and oxide thickness using ion transport for
particle with 10 nm core diameter and 0.3-0.4 nm oxide thickness in adiabatic conditions
2 1 1 1( 1) 1 14 1 exp exptr i i i i ii i i i i i p
u p u p
K h Em R F TR T R T
π ρ − → − − →− → − − →
⎧ ⎫⎛ ⎞ ⎛ ⎞⎪ ⎪= − − −⎜ ⎟ ⎜ ⎟⎨ ⎬⎜ ⎟ ⎜ ⎟⎪ ⎪⎝ ⎠ ⎝ ⎠⎩ ⎭ (8.16)

189
where pT is the temperature of the particle, ρ the density, h the oxide thickness, R the
radius, uR the universal gas constant, and F , K , and E experimentally determined
constants as shown in Table 8.2 below.
Kinetic Parameter Value amE γ→ 458 kJ/mol
Eγ α→ 394 kJ/mol
amK γ→ 1 x10¹² J/mol-m
Kγ α→ 1x10⁸ J/mol-m
amF γ→ 2x10¹⁵ m/s-K
Fγ α→ 5x10⁶ m/s-K
The following relation for growth of layer in each phase is proposed with
constants in the Table 8.3 below.
Kinetic Parameter Value amE 120 kJ/mol
Eγ 227 kJ/mol
Eα 306 kJ/mol
amC 5.098 x10⁻⁸ kg/m-s
Cγ 4.0784x10⁻³ kg/m-s
Cα 2.3791 x10⁻² kg/m-s
The numerical code simulates the growth of oxide layer, melting of core,
temperature rise and the results match with the observations reported in work by Trunov
Table 8.2: Kinetic parameters determined for phase transformations
( )1 11
exp /i i poxi
i i
C E RTm
r r− −−
−=
− (8.17)
Table 8.3: Constants used in expression for growth of oxide layer

190
et al. (Trunov et al., 2006). However, there was no significant growth of oxide layer
while simulating particles of the order of nanometers. At such low temperatures, the rate
of increase in mass of alumina was of the order of 10-32 and 10-49 g/s and not sufficient to
cause any substantial increase in the oxide thickness. As a result, the rate of heat loss was
significantly higher than the rate of heat release and particles remained at 300 K.
Figure 8.7 shows the evolution of temperature and oxide thickness for a 10 nm core
diameter and 0.5 nm oxide thickness.
8.5 Glassman’s Criterion for Pyrophoricity
According to Glassman et al. (Glassman et al., 1992), the critical condition for
pyrophoricity can be determined by equating the heat released through the oxidation to
the sum of the energy needed to heat the oxide coat and metal to the boiling point of
metal and also vaporize the metal. Estimation was thus made for the size of metal
Time (µs)
Tem
pera
ture
(K)
Oxi
deth
ickn
ess(
nm)
0 0.25 0.5 0.750
250
500
750
1000
10-1
100
101
Temperatureamorphousamorphous+gammaamorphous+gamma+alpha
10 nm, 300K
Figure 8.7: Evolution of temperature and oxide thickness for particle with 10 nm core
diameter and 0.5 nm oxide thickness

191
particles in their nascent stage that becomes pyrophoric, based on the following four
assumptions:
1. The problem was considered to be time independent.
2. Heat losses from the particle were ignored.
3. The oxide layer formed was assumed to grow up to a limiting value as observed
in the experiments.
4. The densities of metal and oxide were calculated at room temperature.
The condition for pyrophoricity for a particle of radius R and oxide thickness δ
can be expressed as
where ρ is the density, ooxH the heat release during the oxidation of aluminum, vapL the
enthalpy of vaporization, and H the enthalpy at a given temperature. The material
properties can be obtained from the JANAF tables, listed in Table 8.4 (JANAF, 1981).
Property Value Density of alumina, oxρ 3890 kg/m3
Density of aluminum, Alρ 2700 kg/m3
Heat release during oxidation, ( )298o
oxH− 1675 kJ/mol
( )298o obptH H− 454 kJ/mol
( )298o obpt vH H L− + 381.67 kJ/mol
Bulk aluminum melting point 940 K Bulk aluminum boiling point 2740 K Bulk alumina melting point 2327 K Bulk alumina volatilization temperature 4000 K
( )( )( )( )
( ) ( ) ( )
2 32 3
3298
3298
1
1 1
o o oAl O ox bpt of Al Al Ocr
o oAl bpt of Al vap Alcr
H H HR
H H LR
ρδ
ρδ
− − −−=
− +− − (8.18)
Table 8.4: Properties used in determination of pyrophoricity

192
After relaxing the assumptions in this model, the present research predicts a value
of 20 nm which is smaller than the size of 27.6 nm predicted by Glassman for an oxide
growth up to 2.5 nm.
8.6 Conclusions
Pyrophoricity/explosivity of nano-particulate aluminum has been explored using
the size dependence of properties like melting temperature, vaporization temperature,
heat of fusion and heat of vaporization at nano scales. In the context of unified theory at
nano scales, the limiting condition for pyrophoricity is modified from vaporization of
aluminum to melting of core and subsequent rupture of the oxide layer. The critical
particle size is evaluated using the modified criterion is found out to be 20 nm.
Pyrophoricity has so far been defined for pure aluminum particles. The study also
explored the limits for oxide coated nano aluminum particles for given values of particle
size and thickness of oxide layer. In adiabatic conditions and very thin oxide layer of the
order of 0.30-0.35 nm the diffusion of ions is sufficient enough to lead to pyrophoricity.
In non-adiabatic conditions, the particles remain stable. The phase transformations and
subsequent growth of a thick oxide layer greater than 1 nm is not enough to generate
sufficient heat to overcome heat loss and particles in this case also remain stable.

Chapter 9
Unified Theory of Aluminum Particle Combustion
9.1 Ignition and Combustion at Multi Scales
As discussed in Chapter one, nanoparticles are associated with increased catalytic
activity, higher reactivity, higher specific surface area, potential ability to store energy in
surface defects, lower melting points, and smaller characteristic times for mass and
energy transport as compared to their micro counterparts (Ilyin et al.,2001; Kwon et al.,
1996). The excess energy of surface atoms and reduced activation energies for chemical
reactions contribute to these extraordinary chemical characteristics (Pivkina et al., 2004).
These highly desirable traits of aluminum are also responsible for the difference in
combustion characteristics at nano scales.
Chapter 2 and 3 discussed the observations of various experimental and numerical
studies at micro and nano scales respectively. It was seen that particle size plays the most
significant role in determining the characteristics of ignition and combustion. For micron-
sized and larger aluminum particles, the ignition temperature coincides with the melting
point of the surface oxide (Al2O3) layer at 2327 K (Bucher et al., 2000). The impervious
nature of aluminum oxide inhibits the ignition of aluminum. Once the layer melts, it
coalesces to form an oxide cap, and the aluminum core is then exposed to the ambient
gases for oxidation. At nano scales (less than 100 nm), the ignition occurs near the
melting point of aluminum at 940 K by cracking of the oxide shell, possibly caused by

194
the pressure buildup (Rai et al., 2004; Rozenband and Vaganova, 1992) and/or phase
transformations (Dreizin, 2003; Trunov et al., 2006) inside the shell. According to Rai et
al. (Rai et al., 2004), oxidation of alumina-coated nano-sized aluminum particles is
initiated by melting of the aluminum core. The resultant volume dilatation causes a
pressure build-up inside the shell formed by the oxide layer. Because of the higher
curvature as compared to micron-sized particles, the stress developed due to the pressure
becomes unsustainable and the shell subsequently ruptures. This concept was originally
introduced by Rozenband et al. (Rozenband and Vaganova, 1992), who developed a
model taking into account the mechanical stresses at the metal-oxide interface. Trunov et
al. (Trunov et al., 2006) attributed the observed low ignition temperature of nano-sized
particles to the transformation from the amorphous to the gamma and alpha phases in the
oxide layer. As a consequence of the density variations in different phases, the layer
develops cracks, which permit direct oxidation of aluminum in the core.
Prior to performing any full multiscale simulation of the generation, transport, and
combustion of nano-sized energetic materials in flow environments, a good
understanding of the combustion of single particles in quiescent medium is required.
Many other fundamental issues concerning the combustion characteristics at nano and
micro scales like mode of combustion also remain to be clarified. After performing a
comprehensive review of work done on aluminum particles at the micro and nano scales
and in the light of inconsistencies and uncertainties of the various theories concerning the
particle behavior (Rai et al., 2004; Rozenband and Vaganova, 1992; Dreizin, 2003;
Trunov et al., 2006), fundamental research based on well-calibrated techniques appeared

195
to be imperative. It would help to achieve an improved understanding of the effects of
particle size on the melting and ignition behavior.
Both experimental and numerical studies have tried to explore the size
dependence of thermodynamic properties at nano scales (Alavi et al., 2006; Wronski,
1967; Eckert et al., 1993). As the size decreases beyond a critical value, due to the
increase in the surface-to-volume ratio, the melting temperature deviates from the bulk
value and becomes a size-dependant property (Alavi et al., 2006). Wronski and Eckert et
al. have investigated tin and nano-crystalline aluminum respectively. Wronski observed a
reduction from a bulk value of 505 K to 425 K for 5-10 nm tin particles using
transmission electron diffraction (Wronski, 1967). Eckert et al. performed a similar study
for 13-40 nm particles using differential scanning calorimetry (DSC) and observed a
similar reduction in the melting point with decreasing grain size (Eckert et al., 1993).
Theoretical studies also predict a drop in melting temperature, heat of fusion and even
vaporization temperature as a function of particle size (Jiang et al., 2002; Liang et al.,
2003; Zhao and Jiang, 2004; Zhang et al., 1999; Panda and Pratsinis, 1995).
From a theoretical standpoint, theories applied at micro scales cannot be used to
predict the ignition behavior for particles of size less than a critical value. From kinetic
gas theory, the mean free path of oxygen molecules can be calculated using
where Ru is the universal gas constant, T the temperature, P the pressure, NA the
Avogadro’s number and d the diameter of the gas molecule. Knudsen number, defined as
22u AR T d N Pλ π= (9.1)

196
the ratio of molecular mean free path to the representative physical length scale can be
expressed as
Using calculations of mean free path and Knudsen number, two different regimes for
particle combustion can be determined at different temperatures and pressures as shown
in Figure 7.14. For high temperatures and low pressures, continuum laws fail to predict
the thermo-mechanical phenomena at nano scales. In the regime with Knudsen number
greater than one, molecular dynamics simulations need to be used to explore various
phenomena leading to ignition and combustion.
Comprehensive studies based on molecular-dynamics (MD) simulations have
been performed to explore the thermo-mechanical behaviors of nano aluminum particles
(Puri and Yang, 2007; Puri and Yang, 2007b; Puri and Yang, 2008d). Molecular
dynamics simulations provide exclusive insight into the atomistic mechanisms involved
for nanoparticles which can’t be explained by continuum laws. In previous studies, the
melting behavior of a pure nano-sized aluminum particle was studied in the size range of
2-9 nm. Five different potential functions (the Lennard-Jones, glue, embedded-atom,
Streitz-Mintmire, and Sutton-Chen potentials) were implemented (Puri and Yang, 2007).
The melting temperature of a pure nanoparticle increased monotonically with increasing
size, from 473 K at 2 nm to a bulk value of 937 K at approximately 8 nm. The effect of
pressure and internal defects in the form of voids on the melting of bulk and nano-
particulate aluminum in the size range of 2-9 nm, was investigated through molecular
dynamics simulations using isobaric-isoenthalpic (NPH) ensembles (Puri and Yang,
Kn Lλ= (9.2)

197
2007b). The main objectives were to determine the critical interfacial area required to
overcome the free energy barrier for the thermodynamic phase transition, and to explore
the underlying mechanisms for defect-nucleated melting. The presence of voids did not
impact the melting properties due to the dominancy of nucleation at the surface, unless
the void size exceeds a critical value beyond which lattice collapse occurs. The effect of
pressure on the particulate melting was found to be insignificant in the range of 1-300
atm.
Finally, the thermo-mechanical behavior of nano aluminum particles coated with
crystalline and amorphous oxide layers during melting was studied. The effect of particle
size in the range of 5-10 nm with oxide thickness in the range of 1-2.5 nm was
investigated. Various fundamental processes, including structural changes, stress
development, and phase transformations in both the aluminum core and the oxide shell,
were examined and quantified systematically. The diffusion of aluminum cations through
the oxide layer was also explored. In addition, a structural analysis was applied to
determine the stress field in the oxide shell due to the volume dilatation in the aluminum
core. In the particle-size range considered, the oxide layer melted at ~1100 K,
substantially lower than the value for bulk alumina (2327 K). The oxide thickness exerted
a weak influence on the melting temperature of the shell. All these studies provided
valuable input towards the development of a multi-scale theory for the ignition and
combustion of nano-particulate aluminum.
Using the results of these simulations and theoretical correlations, a multi-scale
theory for the ignition and combustion of particulate aluminum is being proposed
covering a broad range of scales. Based on the various thermo-mechanical phenomena

198
going on within the core and the shell, the whole time history from ignition till particle
burnout has been divided into five stages, which explain the behavior of nano as well as
micron-sized particles. A thermodynamic explanation for the observed thickness of oxide
layer based on phase diagrams has also been provided. An attempt has been made to
explore the effect of pressure, temperature, oxidizer, oxide thickness and particle
diameter on ignition and oxidation. Characteristics like heterogeneous vs. homogeneous
combustion, diffusion vs. kinetically controlled mechanism, mode of ignition etc. have
been discussed in context of the unified model. All the phenomena are closely coupled
and the exclusive combinations of length and time scales determine the six different
modes of ignition.
9.2 Stages of aluminum oxidation
An aluminum particle introduced to an oxidizing environment at a pre-specified
temperature and pressure, is always covered with a layer of aluminum oxide. The
thickness of this oxide layer depends on manufacturing processes and acts as a
passivation layer, protecting the particle from getting ignited. During ignition, it either
cracks or melts and hence, the thickness of this layer becomes important.
It has been reported that the oxide thickness is always of the order of 3-5 nm. The
concept of limiting oxide thickness can be on explained the basis of ion movement within
the shell. The potential gradient caused by the positive and negative charges gives rise to
the movement of cations and ensuing growth of the shell. Once the charge gradient is
nullified due to the diminished diffusion of cations, the shell stops growing. This

199
commonly happens when the shell thickness reaches 5 nm, a typical oxide-layer
thickness reported in the literature (Jeurgens et al., 2002). However, a good estimate of
the thickness of the initial oxide layer formed during manufacturing can also be obtained
using phase equilibrium analysis in terms of Gibbs free energy. It is assumed that during
the solidification of aluminum from liquid state, oxygen dissolves in liquid aluminum
resulting in Al-O the equilibrium solution. The amount of oxygen dissolved and the rate
of cooling determines the amount of Al2O3 and Al phase that solidify, hence the thickness
of the shell. For deriving an expression for the oxide thickness, a Al-O phase diagram
(Figure 9.1) has been adapted from literature (Goldsmith et al., 1960).
Starting from the pure boiling aluminum, a quasi steady system with oxygen would
follow line ab and ac as shown in Figure 9.1. The phase diagram shown in the figure has
Figure 9.1: Al-O phase diagram (Goldsmith et al., 1960)
0 10 20 30 40 50 60 70
2000
2100
2200
2300
2400
1900
2500
Gas +Al2O3 (liquid)
a d
b c Al (liquid) + Al2O3 (liquid)
Stoichiometric Al2O3 Al-O saturated solution
Al (liquid) + Al2O3 (solid)
Al2O3 (liquid) + Gas
Al2O3 (solid) + Gas
Al (liquid) + Gas
e
Oxygen Atomic Percentage
Tem
pera
ture
, 0 C

200
the atomic percentage of oxygen which has been converted to percentage by weight for
analysis. Line ab indicates the limiting oxygen concentration that can reach in a liquid
when dissolution occurs rapidly i.e. 0.1% (0.06%.by mass). The oxygen content is always
greater than the line ab but is limited by ac, with maximum concentration corresponding
to point c, i.e. 14% (8.8% by mass). Similarly, in the second phase of aluminum oxide,
the maximum concentration of oxygen is given by 60% (47.1%by mass). If an excess of
oxygen around molten aluminum is assumed during fabrication, the maximum oxygen
dissolution in molten aluminum reaches 8.8%. When it is rapidly quenched, two different
phases of solid aluminum and solid aluminum oxide separate out. To find relative mass
fractions of these two phases in the limiting case, a simple lever rule can be applied to
obtain 2 3
0.228Al O Alm m = and2 3
0.1539Al O AlV V = . Thus, the volume fraction occupied by
oxide layer would be 0.133. Using this analysis we can relate the oxide thickness to the
size of particle as shown in Figure 9.2 to obtain 0.046 outRδ = .
This analysis predicts a thickness of the order of 2.3 nm and 4.6 nm for particles
of sizes 50 and 100 nm, respectively. In most of the experimental literature, a thickness of
the order 3-5 nm has been reported for particles in the range 50-100 nm. The oxide-layer
Figure 9.2: A schematic showing aluminum oxide thickness on a nanoparticle
Rout
Rin
δ
Al2O3(s) Al(s) Al(l)

201
thickness can also be computed from the results of Eisenreich et al. (Eisenreich et al.,
2004) This gives the fraction occupied by aluminum oxide as 0.12, which is in agreement
with 0.133, assuming experimental uncertainties.
Table 9.1 lists the properties of aluminum and its oxide that will be frequently
referred to in the discussion of the five stages. The values for nano phase have been
obtained using molecular dynamics simulations and theoretical correlations like
Lindemann index for melting. Figure 9.3 shows schematically the five-stage theory
which aims to describe the particle behavior, from the time it is introduced in an
oxidizing environment till the complete burn-out.
Substance Melting Temperature
Vaporization Temperature (@ 1 atm)
Density
Solid: 2700 kg/m3 Bulk Aluminum 940 K 2740 K Liquid: 2377 kg/m3
Nano Aluminum 448-940 K 2629-2740 K - Amorphous:3050 kg/m3
Gamma: 3660 kg/m3 Alpha: 3900 kg/m3
Bulk Alumina 2327 K 4000 K
Liquid: 3010 kg/m3 Nano Alumina Shell (1-3 nm) 986-1313 K - -
Table 9.1: Thermo-physical properties of aluminum and alumina

202
9.2.1 Stage I
The first stage involves simple heating of the aluminum core coated with
amorphous oxide layer, until the melting point of aluminum is reached. This stage is also
Figure 9.3: Various Stages of Aluminum Particle Ignition and Combustion
Detached Flame front
Oxide cap
oxidizer
particle consumed due to heterogeneous reactions
(Nano)
melting of oxide layer to form cap (Micro)
O2 Molecules Rout
Rint
δ O2
Rout
Rint
δ O2 Molecules
Rout
Rin
δ
O Anions
Al Cations
Phase Transformations
Stage I (particle heating/phase transformations)
Stage II (core melting and ignition due to melting/cracking)
Stage III (heterogeneous reactions/healing of cracks) Stage IV
Stage V (detached flame front (micro))
Al2O3(s)
Al(s) Al(l)

203
characterized by phase transformations inside the oxide layer. The concept of phase
transformations has been proposed by Trunov et al. (Trunov et al., 2006). The growth of
the three phases of alumina namely, amorphous, γ and α and their transformations from
one form to the other start in Stage I. The growth of natural amorphous alumina layer is
controlled by the outward diffusion of Al cations. The diffusion process has been
proposed in the theoretical studies (Jeurgens et al., 2002) and was observed through MD
simulations as well (Puri and Yang, 2008d). The energy of oxide metal interface
stabilizes the oxide only up to a critical thickness of about 5 nm. When the temperature is
sufficiently high, the amorphous oxide transforms to γ phase. If prior to phase change,
the thickness of the amorphous layer is less than 5 nm, gamma alumina no longer forms a
continuous layer covering the surface due to its higher density. As a result oxidation rate
increases rapidly because of direct oxidation. These openings heal gradually and the
oxidation rate decreases. The growth of γ alumina is limited by inward grain boundary
diffusion of oxygen anions. This is also accompanied by transformations from γ phase to
θ and δ phases, which do not affect the oxidation rate significantly. This γ phase
alumina finally transforms to coarse and dense α phase alumina. The rate of increase in
the thickness of a particular phase of oxide and its transformation to other phases can be
computed by fitting experimental data to Arrehenius type expressions (Trunov et al.,
2006). For phase transformations, the rate of mass increase, ( 1)tri im − → of the oxide phase i
transformed from oxide phase 1i − can be described as
2 1 1 1( 1) 1 14 1 exp exptr i i i i ii i i i i i p
u p u p
K h Em R F TR T R T
π ρ − → − − →− → − − →
⎧ ⎫⎛ ⎞ ⎛ ⎞⎪ ⎪= − − −⎜ ⎟ ⎜ ⎟⎨ ⎬⎜ ⎟ ⎜ ⎟⎪ ⎪⎝ ⎠ ⎝ ⎠⎩ ⎭ (9.3)

204
where pT is the temperature of the particle, ρ the density, h the oxide thickness, R the
radius, uR the universal gas constant, and F , K , and E experimentally determined
constants as shown in Table 9.2 below.
Kinetic Parameter Value amE γ→ 458 kJ/mol
Eγ α→ 394 kJ/mol
amK γ→ 1 x10¹² J/mol-m
Kγ α→ 1x10⁸ J/mol-m
amF γ→ 2x10¹⁵ m/s-K
Fγ α→ 5x10⁶ m/s-K
Using these experimental constants values and properties of different phases, the
rate of of mass increase for amorphous to γ phase, and γ to α phase at 450 K for a
particle of size 10 nm coated with an oxide of 2.5 nm thickness are found to be of the
order of 10-48 and 10-53 kg/s respectively.
Simpson provided direct correlations for growth of oxide layer thickness due to
phase transformations as a function of temperature (Simpson et al., 1998)
The experiments were conducted by performing time resolved reflectivity
measurements on thin films deposited on sapphire substrate. These give growth rates of
the order of 0.01 to 1.0 mm/s in the temperature range of 873 to 1123 K for the case of
amorphous to γ phase transition. Similarly, a growth rate of 0.001 to 1.0 mm/s is
Table 9.2: Kinetic parameters determined for phase transformations
( )201.549 10 exp 4.3858 /am Bh k Tγ→ = × − (9.4)
( )183.16 10 exp 5.117 / Bh k Tγ α→ = × − (9.5)

205
observed in the temperature range of 1193 to 1313 K for the case of γ to α phase
transition. Merzhanov et al., provided characteristic times associated with such phase
transformations by studying ignition of fine 50 micron aluminum wires subjected to
electrical heating in different oxidizers (Merzhanov et al., 1977). Amorphous to γ phase
transition has characteristic time given by
Similarly, for γ to α phase transition
Here uR has units of cal/mol K and time scale, τ in seconds. In the temperature range,
873 to 2073 K, am γτ → is of the order of 102 to 10-3 seconds. In the temperature range 1473
to 2073 K, γ ατ → is of the order of 0.3 to 10-5 seconds.
The oxide layer in Stage I and subsequent Stage II can also grow due to the
diffusion of anions and cations through the oxide layer. The rate of growth is limited by
the diffusion of ions and can be calculated theoretically using Mott’s potential. The
mathematical equation governing the process is given by (Jeurgens et al., 2002)
where Ω is the volume of oxide formed per cation, n the number of cations per unit area
which may jump the energy barrier U , υ the attempt frequency of cation jump, q the
charge of migrating cation, 2a the distance from potential minimum to next potential
minimum, Bk the Boltzmann constant, T the temperature, 0E the electric field due to
( )710 exp 40000 /am uR Tγτ → = (9.6)
( )165.5 10 exp 100,000 / uR Tγ ατ −→ = × (9.7)
0expB
U qaEdx ndt k T
υ⎛ ⎞− +
= Ω ⎜ ⎟⎝ ⎠
(9.8)

206
Mott’s potential MV and ( )x t denotes the oxide film thickness at time t . The constants
are given in detail in work by Jeurgens et al. The rate of increase of thickness obtained
from the constants at 450 K for 0.5 nm thickness, is of the order of 10-15 m/s. The rate is a
very strong function of oxide thickness and increases exponentially for a comparatively
thinner oxide layers.
In the quantum regime, characteristic time scales for electron transport under
diffusion, Dτ and convection, Cτ can also be calculated as 2R D and 20R Vµ
respectively. Here, R is the characteristic length scale, D the diffusivity, µ the
mobility, and 0V is the electric potential (Rode et al., 1992). Using the values given in
Rode et al., 1992, the values for a 2.5 nm thick layer are 138 10−× seconds and 142 10−×
seconds respectively. The corresponding time scales associated with the layer growth can
be calculated using 02 ox D oxC Mρ τ and 02 ox C oxC Mρ τ . Here, ρ is the density, C the
volumetric concentration and M is the molecular mass of the species. These come out to
be of the order of 85.1 10−× and 91.27 10−× seconds in case of diffusion or convection
dominated growth respectively.
The above analysis implies that diffusion of ions is one of the prominent
mechanisms in this stage along with particle heating because of thin oxide layer. The
phase transformations become prominent at higher temperatures and thicker layers i.e.
Stage II.

207
9.2.2 Stage II
The second stage begins when the melting point of aluminum core is reached. The
phase transformations continue in this stage as well and become one of the dominant
mechanisms. The melting temperature can be much lower than the bulk melting point of
aluminum based on the core size. From the previous detailed study of thermo-mechanical
behavior of oxide layers using MD simulations (Puri and Yang, 2008d), the oxide layer
can also exhibit phase transition from solid to liquid at temperatures much lower than the
bulk melting temperature of 2327 K. Existing studies on combustion of micron-sized
aluminum indicate that ignition coincides with melting of the oxide layer. However, for
nano-sized particles, ignition takes place either in Stage II or Stage III. In Stage II
ignition is due to cracking of the oxide shell. Cracking itself can occur, either due to the
pressure buildup inside the shell as a result of core melting or due to phase
transformations at the surface. As a result at nano scales, the particles get ignited at a
much lower temperature which for some particles is near the melting point of Al i.e. ~933
K.
The ratio of energy conducted to that rate of energy stored by the layer (in the
form of a spherical shell) is directly proportional to the surface area to volume ratio and
can be written as
where k is the conductivity, A the surface area, V the volume, c the specific heat, ρ the
density, t∆ the time scale, and r∆ the length scale associated with the process. As the
/ ./ .
cond
stored
E kA T r k A tE cV T t c V rρ ρ
∆ ∆ ∆∝ ∝
∆ ∆ ∆ (9.9)

208
particle size decreases to nano scales, this ratio increases and hence, the shell conducts
heat easily. This eventually melts the aluminum core before the shell melts and results in
rupture at around 933 K. In case of a micro-sized particle, the energy stored is more
compared to conduction. This high thermal resistance to conduction results in rapid
heating and eventual melting of the shell before the solid core. This Fourier number
analysis and characteristic time scales can be used to explain the high correlation between
core melting and oxide layer cracking at nano scales as shown in Figure 9.4. A
characteristic time scale of the order of picoseconds falls in the range of heating time
scales associated with some experimental studies performed for nano-sized particles
involving laser flash heating (Wang et al., 2005).
However, there always is a parallel process of direct oxidation at these crack sites
which heal the layer. Theoretically this is the fastest oxidation rate and can be calculated
using (Friedlander, 2000)
Oxide thickness (nm)
Cha
ract
eris
tictim
esc
ale
(ps)
1 2 3 4 5 6 7 8 9 10
2
4
6
8
Core Melting/Fragmentation of Shell
Melting of Shell/Heterogeneous Oxidationof core
Figure 9.4: Fourier Analysis based on characteristic time and length scales associated
with oxide layer

209
where P is the partial pressure of oxygen in gas, D the particle diameter, Bk the
Boltzmann’s constant, T the temperature, and N is the number of molecules. This gives a
characteristic time of the order of 10-12 seconds for a particle size of the order of 50 nm
with pressure and temperature of 0.3 MPa and 1373 K respectively. Looking at other time
scales, the characteristic times for heating and melting for the core are given by (Faeth,
1977)
where, D is the particle diameter, fα the thermal diffusivity, and fgh the heat of fusion.
These are of the same order of magnitude as that of the characteristic time scale obtained
using Equation 9.10. The characteristic heat transfer from the particle in the molecular
limit can be defined as (Filippov et al., 2000)
where, pρ is the density of the aluminum core, gρ the gas density, pc the specific heat
of aluminum core, gm the mass of oxygen molecule, Bk the Boltzmann’s constant, gT
the gas temperature, D the particle diameter, and α the accommodation coefficient. At
room temperature the characteristic time scale for a 10 nm particle is of the order of 10-7
2 2
2
2O O p
B
dN P Ddt mk T
π
π= (9.10)
2
heatf
Dτα
= (9.11)
2fg
meltp f
D hc T
τα
=∆
(9.12)
, 8p p g
heat molg B B g g
c m Dk k T m
ρτ
αρ π
⎛ ⎞⎜ ⎟=⎜ ⎟⎝ ⎠
(9.13)

210
seconds. This is two orders of magnitude larger than the characteristic time scales
obtained using continuum relations.
The characteristic time for diffusion of heat through gas phase is 1000 times more
than condensed phase and hence can be ignored. If the characteristic time scale for the
growth of layer through direct oxidation is small as compared to that of melting and
cracking, then the oxidation for the rest of time can be modeled as that of diffusion
through the layer. Otherwise, the oxidation process has to be modeled as the direct attack
of oxygen on aluminum surface, with cracks exposing the surface. It is this comparison
between characteristic times of healing and cracking and Fourier number which explains
ignition due to cracking or melting for nano or micro-particles respectively. The stage
continues till the melting of aluminum core is complete.
9.2.3 Stage III
The healing and formation of cracks continues in stage three. The surface
reactions take place with the diffusion of oxygen through the oxide shell as the rate-
limiting step. This stage is characterized by oxidation at the interface, heating up of the
regressing liquid aluminum core, and growth of solid aluminum oxide layer until the
melting point of aluminum oxide is reached, subsequently ending Stage III.

211
9.2.4 Stage IV
At this point, the oxide layer melts and forms a cap under the effect of surface
tension, covering a portion of the surface for a micron-sized particle (Stage IV). This is
followed by heterogeneous reactions at the surface or homogeneous gas phase ractions.
The aluminum oxide formed, continues to melt, and adds to the oxide cap. Pressure and
particle diameter play a very important role in determining the particle behavior in the
stage IV through their influence on the characteristic diffusion time relative to kinetic
times. For diffusion controlled mechanism the combustion time can be derived as
where Dp is the initial particle diameter, pρ the particle density, ρ the gas density, D the
gas mass diffusivity, ν the mass stoichiometric fuel-oxidant ratio, and Y is the mass
fraction. In case of a kinetically controlled mechanism the mass consumption rate is
given by
where, Xo is the oxidizer mole fraction, and k the surface reaction rate with the oxidizer.
This on integration gives a characteristic time of
To determine the dominant combustion mechanism the Damkohler number, Da, for
surface reaction is defined as (Yetter and Dryer, 2001)
2
,,8 ln(1 )
p pb diff
O
Dt
D Yρ
ρ ν ∞
=+
(9.14)
,24 p O sp
m MW kPXrπ
= (9.15)
,,2
p pb kin
p o
Dt
MW kPXρ
∞
= (9.16)

212
This implies that small particles at low pressures generally burn under kinetically
controlled conditions as shown in Figure 9.5. Similarly, larger particles at high pressures
may undergo a diffusion- controlled mechanism. It is also speculated that because of the
geometry of nano-sized particles, the oxidizer species need not diffuse across a relatively
large distance before reaching the particle surface. This results in significantly shorter
diffusion times and would lead to a chemical-kinetic-controlled situation. Till the end of
stage four, a nano-sized particle will be fully consumed, whereas a micron-sized particle
will enter the final fifth stage. The boiling point of aluminum is reached, and instead of
heterogeneous reactions at the surface, homogeneous reaction takes place with a detached
flame (Stage V).
To obtain the kinetics of oxidation, various oxidation laws have been observed
experimentally (Medvedev et al., 1982; Gurevich et al., 1978; Grigor'ev et al., 1973;
, ,
, ,4 ln(1 )b diff p p o
b kin o
t MW kPD XDa
t D Yρ ν∞
∞
= =+
(9.17)
Particle Size, m
Pres
sure
,Pa
10-8 10-6 10-4 10-2 100 102 104 106
103
104
105
106
107
108 300 K500 K940 K1000 K1400 K1800 K2200 K2740 K
Kineticallycontrolled
Diffusioncontrolled
Figure 9.5: Regimes of Diffusion vs. Kinetically controlled mechanism as a function of
different pressures and particle size

213
Grigor'ev et al. 1979). The process of growth of oxide layer can be described by a
generalized expression (Fedorov and Kharlamova, 2003)
where h is oxide thickness, 0h the initial oxide thickness, K the pre-exponent in oxidation
law, oxC the oxidizer concentration near particle surface, and m the oxidizer
concentration in terms of oxidizer. Another frequently used equation to describe kinetics
is of the form
For 1n = , parabolic oxidation rate law is assumed, which is valid if the oxidation
rate is limited by the diffusion through the oxide film. The kinetics for reaction between
oxygen and aluminum in the temperature range 1873 to 2273 K, following the parabolic
rate law can be expressed as (Merzhanov et al., 1977)
where, uR is in cal/mol K and /dh dt is in cm/s. The growth rate calculated using
Eqn. 9.20 is of the order of 1.54 cm/s at 1000 K. The relation was obtained through
electro-thermo-graphic method by heating aluminum wire through constant power
electric current in oxygen. For 0n = , the rate law can be expressed as
( ) ( )0exp expmox
dh KC E RT h hdt
= − − (9.18)
( )expmox
n
KCdh E RTdt h
= − (9.19)
( )51.9 10 exp 17,000 / u
dh R Tdt h
−×= − (9.20)
( )518 10 exp 20,000 / udh R Tdt
= × − (9.21)

214
where, uR is in cal/mol K and /dh dt is in cm/s. This gives a growth rate of 8.17 cm/s at
1000 K. Roberts et al. ignited micron-sized particles in 99% oxygen and 1% nitrogen
atmospheres at high temperatures and pressures and obtained the following surface
reaction rate law (Roberts et al., 1993)
Here, A is the pre-exponential coefficient with value of 200 kg/m2s, Ea the activation
energy with value of 22800 cal/mol, Tp the particle surface temperature and Ru the gas
constant in cal/mol K.
Bergsmark et al. (Bergsmark et al., 1989) studied the oxidation of molten
aluminum in oxygen at different particle pressures in the temperature range 1073 to 1223
K. They observed parabolic rate constants of the order of 10-11 to 10-12 cm2/s. These
values are consistent with results of Fedorov et al.
Suvaci et al. studied the oxidation kinetics of aluminum powder in air and
concluded that beyond a critical temperature, the oxidation rate changes from parabolic to
linear rate law (Suvaci et al., 2000). The linear oxidation rate is faster than the parabolic
rate. The growth rate can be expressed as ( )161.1 10 exp 238,000 uR T−× − g2/cm4s and
( )117.4 10 exp 128,000 uR T−× − g/cm2s for growth of amorphous and γ layer
respectively.
Trunov proposed the following relation for growth of layer in each phase
( )1 11
exp /i i poxi
i i
C E RTm
r r− −−
−=
− with constants in the Table 9.3below. These give oxidation rates
of the order of 10-38 kg/s.
( )exp /s a pk A E RT= − (9.22)
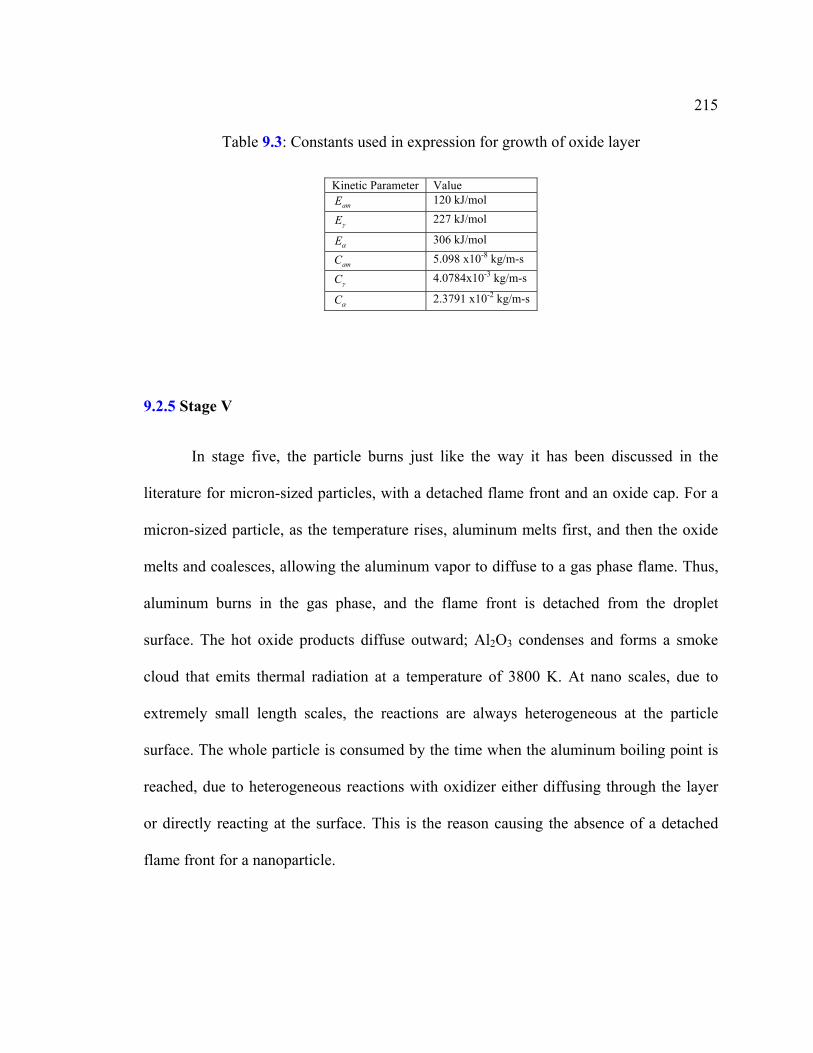
215
Kinetic Parameter Value amE 120 kJ/mol
Eγ 227 kJ/mol
Eα 306 kJ/mol
amC 5.098 x10⁻⁸ kg/m-s
Cγ 4.0784x10⁻³ kg/m-s
Cα 2.3791 x10⁻² kg/m-s
9.2.5 Stage V
In stage five, the particle burns just like the way it has been discussed in the
literature for micron-sized particles, with a detached flame front and an oxide cap. For a
micron-sized particle, as the temperature rises, aluminum melts first, and then the oxide
melts and coalesces, allowing the aluminum vapor to diffuse to a gas phase flame. Thus,
aluminum burns in the gas phase, and the flame front is detached from the droplet
surface. The hot oxide products diffuse outward; Al2O3 condenses and forms a smoke
cloud that emits thermal radiation at a temperature of 3800 K. At nano scales, due to
extremely small length scales, the reactions are always heterogeneous at the particle
surface. The whole particle is consumed by the time when the aluminum boiling point is
reached, due to heterogeneous reactions with oxidizer either diffusing through the layer
or directly reacting at the surface. This is the reason causing the absence of a detached
flame front for a nanoparticle.
Table 9.3: Constants used in expression for growth of oxide layer

216
9.3 Modes of ignition
Based on combinations of length and time scales defined in Stage I-III, six
different modes of ignition can be identified as summarized in Table 9.4
Phenomenon Time Scale Length Scale Remarks Core melts
Shell melts
Shell Heals
Oxide Core Mode
Y Y N , ,melt core melt shellt t≈
, ,,reac melt core melt shellt t t>>
thin small Ignition by melting at smaller scales very early in Stage II
I
Y N Y ,melt core react t≈
, , ,melt shell melt core react t t>>
thick small Oxide Cracks and Heals, Stage III prominent, Nano self consumed in Stage IV, Micron sized particle reaches Stage V
II
N Y Y ,reac melt shellt t≈
, ,,melt core reac melt shellt t t>>
thin large Oxide melts and Heals, Stage IV prominent, Nano self consumed, Micron sized particle reaches Stage V
III
Y N N , ,,melt core reac melt shellt t t<<
thick small Ignition by crack and oxide fragmentation, no coating formed. Core small, shell thick and kinetic rates such that reaction scale is slow to heal, Stage II/III ignition
IV
N N Y , ,,reac melt core melt shellt t t<<
thick large Phase transformations, heals very fast so always protected, shell is still not melting. No early ignition in Stage II/III. Nano particle self consumed in Stage IV, Micron sized particle reaches Stage V.
V
N Y N , , ,melt shell melt core react t t<<
thin large Ignition by melting at larger scales, shell melts doesn’t heal in time and core also intact. Shell is thin enough to melt compared to large core, unique case of very thin shells
VI
N N N No ignition, condition not met
Table 9.4: Various regimes of particle behavior during ignition

217
Depending on the unique combination of pressure, temperature, core size, and
thickness of the layer, there is a time scale associated with phenomena like core melting,
shell melting and healing of the shell and this determines the mode of ignition. Figure 9.6
shows all these different modes. First three cases (I-III) deal with situation where two
phenomena have time scales of the same order of magnitude and the third one has little
affect. The later three cases (IV-VI) deal with the situation where one of the phenomena
dominates the other two and hence determines the overall mode of ignition. Previous MD
simulations have already shown that at nano scales core and shell melt at a much lower
temperature compared to the bulk (Puri and Yang, 2007; Puri and Yang, 2007b; Puri and
Yang, 2008d).
If the particle size is very small and is covered with a thin layer, it can result in
similar time scales for melting of the core as well as the shell. If the time scales
associated with healing of the shell is large compared to these, the ignition can happen
very early in Stage II by peeling of the oxide shell as shown in Figure 9.7 as Mode I.
Core size (nm)
Oxi
deth
ickn
ess(
nm)
20 40 60 80 100
10-1
100
101
tmelt,s=tmelt,ctmelt,c=treactmelt,s=treac
tmelt,c> treac
tmelt,c< tmelt,s
tmelt,s< treac
I
II
III
IV
IV
V
V
VI
1000 K, 1 atm
VI
Figure 9.6: Different modes of ignition based on length and time scales

218
Figure 9.7 also shows the mode of ignition (II) if a small core is covered with a
much thicker oxide shell. In such a scenario, the time scales for melting of the core and
healing are of the same order and shell remains intact. Stage III in the five stage theory
becomes the prominent stage in time history of aluminum particle.
If on the contrary, the melting of the shell and heterogeneous reactions happen
simultaneously and melting of the core is slow, the oxide melts, nanoparticle is
completely consumed and micron sized particle reaches Stage V. This is shown as Mode
III in Figure 9.7.
In addition of above three modes, there can be three additional modes which are
characterized by one prominent phenomenon as compared to two competing processes. If
the core melting is very prominent, which happens in case of thick shell and small cores,
the ignition happens due to fragmentation and there is no healing either, because of slow
kinetic rates (Mode IV). If the heterogeneous reactions are the prominent mechanism,
phase transformations are the only process that continues and there is no ignition until
Stage IV. Nano-sized particle is totally self-consumed and micro stage particle reaches
stage V and burns in detached flame front fashion (Mode V). If time scales associated
with the melting of the shell is most prominent, the ignition occurs by melting at larger
scales, shell melts doesn’t heal in time and core also remains intact. This is a unique case
of very thin shells where shell is thin enough to melt compared to large core (Mode VI).

219
O2 Molecules Detached Flame
Oxide cap
Al (g)
oxidizer
MODE-III
O Anions Al Cations
Phase Transformations
O2 Molecules
MODE-IV
O Anions Al Cations
Phase Transformations
MODE-I
O Anions Al Cations
Phase Transformations
O2 Molecules
MODE-II
Detached Flame
Oxide cap
Al (g)
oxidizer
O Anions Al Cations
Phase Transformations

220
The plot shown in Figure 9.6 is at 1000 K and 1 atm. Temperature and pressure
also play a key role in determining probability of different mode of ignition. Figure 9.8
and 9.9 show the effect of increase in pressure and temperature respectively on different
modes. As pressure increase it does not affect melting time scales but it does affect the
reaction time scales. As pressure increases, the characteristic time scales associated with
healing of layer reduces, and hence stage V and VI become more prominent. The core is
virtually always covered with oxide shell and hence a nano-sized particle is consumed in
a heterogeneous way and a micron-sized particle enters Stage V. As temperature is
increased the characteristic time scales for direct attack of oxygen on particle increases
and hence the effect is opposite to that of an increase in pressure as shown in Figure 9.9.
Figure 9.7: Schematic of different modes of ignition for oxide coated aluminum particles
oxidizer
O2 Molecules Detached Flame
Oxide cap
Al (g)
MODE-V
O Anions Al Cations
Phase Transformations
Detached Flame
Oxide cap
Al (g)
MODE-VI
O Anions Al Cations
Phase Transformations
oxidizer

221
Core size (nm)
Oxi
deth
ickn
ess(
nm)
20 40 60 80 100
10-1
100
101
tmelt,s=tmelt,ctmelt,c=treactmelt,s=treac
tmelt,c> treac
tmelt,c< tmelt,s
tmelt,s< treac
I
II
III
IV
IV
V
V
VI
1000 K, 5 atm
VI
Core size (nm)
Oxi
deth
ickn
ess(
nm)
20 40 60 80 100
10-1
100
101
tmelt,s=tmelt,ctmelt,c=treactmelt,s=treac
tmelt,c> treac
tmelt,c< tmelt,s
tmelt,s< treac
I
II
III
IV
IV
V
V
VI
1000 K, 10 atm
VI
Core size (nm)
Oxi
deth
ickn
ess(
nm)
20 40 60 80 100
10-1
100
101
tmelt,s=tmelt,ctmelt,c=treactmelt,s=treac
tmelt,c< tmelt,s
tmelt,s< treac
III
V
V
VI
1000 K, 50 atm
Core size (nm)
Oxi
deth
ickn
ess(
nm)
20 40 60 80 100
10-1
100
101
tmelt,s=tmelt,ctmelt,c=treactmelt,s=treac
tmelt,c< tmelt,s
tmelt,s< treac
III
V
V
1000 K, 100 atm
Figure 9.8: Effect of Pressure on Characteristic Time Scale Study

222
9.4 Ignition Formulation using Phase Transformations
An attempt has been made to reproduce the work done by Dreizin so that this
phase transformation stage can be incorporated into the numerical codes. Some results
obtained from this model are shown below. Figure 9.10 shows the evolution of
temperature and layer growth at 1250 K for a 100nm particle. The temperature increases
rapidly in the stage when γ phase is forming due to direct oxidation. The combustion
could not be attained because after reaching a peak of about 2100 K, the temperature
starts falling off due to heat loss. This was an interesting phenomenon. It was realized
Core size (nm)
Oxi
deth
ickn
ess(
nm)
20 40 60 80 100
10-1
100
101
tmelt,s=tmelt,ctmelt,c=treactmelt,s=treac
tmelt,c> treac
tmelt,c< tmelt,s
tmelt,s< treac
I
II
III
IV
IV
V
V
VI
1500 K, 1 atm
VI
Core size (nm)
Oxi
deth
ickn
ess(
nm)
20 40 60 80 100
10-1
100
101
tmelt,s=tmelt,ctmelt,c=treactmelt,s=treac
tmelt,c> treac
tmelt,c< tmelt,s
tmelt,s< treac
I
II
III
IV
IV
V
V
VI
2000 K, 1 atm
VI
Core size (nm)
Oxi
deth
ickn
ess(
nm)
20 40 60 80 100
10-1
100
101
tmelt,s=tmelt,ctmelt,c=treactmelt,s=treac
tmelt,c> treac
tmelt,c< tmelt,s
tmelt,s< treac
I
II
III
IV
IV
V
V
VI
2500 K, 1 atm
VI
Core size (nm)
Oxi
deth
ickn
ess(
nm)
20 40 60 80 100
10-1
100
101
tmelt,s=tmelt,ctmelt,c=treactmelt,s=treac
tmelt,c> treac
tmelt,c< tmelt,s
tmelt,s< treac
I
II
III
IV
IV
V
V
VI
3000 K, 1 atm
VI
Figure 9.9: Effect of Temperature on Characteristic Time Scale Study

223
that due to large surface to volume ratio, a nanoparticle will have higher heat loss too. So,
if a particle has very high thermal conductivity it will loose heat quickly too and might
not ignite.
Figure 9.11 shows the behavior of a 500nm particle at 1650 K. The particle could
ignite at 1650 K. Figure 9.12 shows the case of a 5 mµ particle at 2100 K. Larger
particles need a higher ambient temperature to ignite. Since the bigger particle takes
longer to ignite, the higher fraction of α phase thickness as compared to smaller particles
is clearly seen. Further work needs to be done to fully reproduce and validate Dreizin’s
work, so that it can be incorporated into the numerical code for flame propagation
studies.
Time (µs)
Tem
pera
ture
(K)
Oxi
deth
ickn
ess(
nm)
0 0.5 1 1.5 20
500
1000
1500
2000
10-2
10-1
100
Temperatureamorphousamorphous+gammaamorphous+gamma+alpha
100 nm, 1250K
Figure 9.10: Predicted temperature histories and overall thickness of oxide layers for 100
nm particle introduced in air at 1250 K

224
9.5 Conclusions
From the existing literature it can be concluded that the modeling for nano
aluminum is still in nascent stages. Ignition and Combustion at Nano scales is much
Time (µs)
Tem
pera
ture
(K)
Oxi
deth
ickn
ess(
nm)
0 0.5 1 1.5 2
500
1000
1500
2000 5
10
Temperatureamorphousamorphous+gammaamorphous+gamma+alpha
500 nm, 1750K
Figure 9.11: Predicted temperature histories and overall thickness of oxide layers for 500
nm particle introduced in air at 1750 K
Time (µs)
Tem
pera
ture
(K)
Oxi
deth
ickn
ess(
nm)
0 25 50 75 100
500
1000
1500
2000
100
101
Temperatureamorphousamorphous+gammaamorphous+gamma+alpha
5 µm, 2100K
Figure 9.12: Predicted temperature histories and overall thickness of oxide layers for
5 mµ particle introduced in air at 2100 K

225
different from the one at micro scales. In case of direct oxidation at nano scales, the
process is kinetically controlled due to small diffusion scales involved. The
heterogeneous oxidation through the oxide layer is a diffusion controlled mechanism due
to the slow diffusion of aluminum cations or oxygen anions. However, oxidation in the
last stage through direct oxygen can be kinetically or diffusion controlled based on
Damkohler numbers.
For nano-sized particles the ignition stage always starts with heterogeneous
reactions and phase transformations and is observed at relatively lower temperatures as
compared to micro-scale. Cracking in oxide layer can occur either due to phase
transformation of aluminum oxide or thermal expansion caused by melting of solid core.
Due to fast rate of heterogeneous reactions, the nanoparticles are totally consumed in a
pure heterogeneous fashion till the time the boiling point of aluminum is reached and
there is no detached flame front formation. All the phenomena are closely coupled and
are associated with characteristic time scales which help in explanation of different
modes of ignition at both scales.

Chapter 10
Summary and Future Work
10.1 Summary
In the present research work, a comprehensive study based on molecular-
dynamics (MD) simulations has been performed to explore the thermo-mechanical
behavior of nano aluminum particles covered with oxide layers (Puri and Yang, 2007;
Puri and Yang, 2007b; Puri and Yang, 2008d). In addition, a unified theoretical model
and numerical scheme has been established to investigate the ignition and combustion of
aluminum particles at different length scales (Puri and Yang, 2008c; Puri and Yang,
2008). The entire framework accommodates all the processes and mechanisms involved
at micro- and nano scales, and can be conveniently applied to a variety of metal
particulates. A comprehensive review is currently being prepared summarizing the state
of knowledge in this topical area (Puri and Yang 2008b). The research results (modeling
techniques and research findings) will be transferred to ARL and other DoD laboratories
to maximize the utilization of nano metal particles in the formulation of advanced
energetic materials.
Chronologically, a comprehensive review on the ignition and combustion of
aluminum particles at micro and nano scales was first performed. Various processes and
mechanisms involved were identified. Research focus was then placed on the continued
development of a unified theory of particle ignition and combustion, and on the

227
establishment of a Molecular Dynamics (MD) simulation tool to handle the problems at
nano scales. With the theoretical and computational tools already established the main
objective was then to investigate the thermo-mechanical behaviors of bulk and nano-
particulate aluminum by means of MD simulations. The general computational
framework developed in the current molecular-dynamics study can handle micro-
canonical (NVE), isobaric-isoenthalpic (NPH), and isobaric-isothermal (NPT) ensembles
using both Verlet and predictor-corrector algorithms. These algorithms have been
parallelized using the atomic decomposition method. A separate post-processing code has
also been developed to superimpose the grid on the geometry under consideration, and to
analyze the results using the contours of various thermodynamic properties. The code has
the capability of handling multi-atom simulations and can treat liquid and solid phases.
Nano-sized aluminum particles in the range of 2-9 nm are studied in the first
study. Five different potential functions are implemented, and the results are evaluated
using the particle-size dependence of the melting phenomenon as a benchmark. A
combination of structural and thermodynamic parameters, including the potential energy,
Lindemann index, translational-order parameter, and radial-distribution functions, are
used to characterize the melting process. The dynamic coexistence of the solid and liquid
phases is also explored. In addition, the effect of surface charge development on melting
is examined using the Streitz-Mintmire potential.
To investigate the effect of voids and surfaces on melting, bulk materials are
considered in addition to the particulate phase. For the study of bulk materials, crystals
composed of 864 and 2048 atoms were treated; for the particulate phase, spherical
nanoparticles up to 8.5 nm (20736 atoms) were considered. Simulations are carried out

228
by arranging atoms in an FCC lattice structure and evolving the system with periodic
boundary conditions for the bulk phase. The phenomenon of defect nucleated melting is
studied using voids of different shapes and sizes. Results are compared with pure crystals
with no voids. The entire melting process is examined using snapshots of time evolution
of atomic positions and density contours.
Finally, molecular-dynamics study has been performed to examine the thermo-
mechanical behavior of nano aluminum particles coated with oxide layers. The size
dependence of the melting phenomenon was first examined in the range of 5-10 nm, with
the oxide thickness fixed at 1 nm. In each case, the oxide layer melted at temperatures
substantially lower than the bulk value. The melting temperatures obtained varied
between 986 and 1159 K. The effect of the oxide-shell thickness on the particle melting
was explored in the range of 1.0-2.5 nm, with the core diameter fixed at 5 nm. The
melting point of the oxide layer increased, from 1130 K for 1.0 nm to 1313 K for 2.5 nm
thickness. The results were compared by simulating a pure 5 nm alumina nanoparticle.
Melting was observed at 1284 K and the Lindemann index curve qualitatively showed the
same trend as seen for the oxide layers with aluminum core.
Melting for oxide layers was also preceded by solid-solid phase transition to
denser polymorphs, characterized by a decrease in Lindemann index for few picoseconds.
The phenomenon was only observed for crystalline layers and was absent in the case of
amorphous layers. A detailed structural analysis indicated that the shell stresses caused
by the core melting were an order of magnitude higher than the tensile strength. The shell
should have cracked under such a condition. However, in the present MD study, the shell

229
remained intact. This was attributed to the fact that the shell does not remain in a pure
solid state and undergoes solid-to-solid and solid-to-liquid phase transitions.
The phenomenon of diffusion of aluminum cations through the shell was also
investigated. The diffusion was faster and more prominent in the case of amorphous as
compared to the crystalline layer. With insight into the behavior of aluminum particles at
nano scales, the present research is an important milestone towards the development of a
multi-scale theory for the ignition and combustion of nano-particulate aluminum.
In the end the condition for pyrophoricity/explosivity of nano-particulate aluminum is
also analyzed. The size dependence of thermodynamic properties at nano scales,
including melting and, vaporization temperatures, heat of fusion and heat of vaporization
are considered and incorporated into the existing theories developed for micro and larger
scales. In the context of unified theory at nano scales, the limiting condition for
pyrophoricity is modified from the vaporization of aluminum to the melting of core and
subsequent rupture of the oxide layer. The critical particle size is evaluated using the
modified criterion and is found to be highly pyrophoric. The study also explores the
explosive tendency for oxide coated nano aluminum particles for given values of particle
size and thickness of oxide layer.
Finally, a phenomenological theory for ignition and combustion of aluminum
particles has been proposed. The whole time history from ignition till particle burnout is
divided into five stages. An attempt has been made to explore different modes of ignition
based on the effect of pressure, temperature, oxidizer, oxide thickness and particle
diameter and is investigated using time and length scales involved during ignition and
combustion.

230
10.2 Recommendations for Future Work
10.2.1 Ignition Behavior of Metal-Coated Aluminum Particles
Having investigated nano-particulate aluminum and its oxides in detail, we
propose to build a more complex system containing binary compositions like aluminum
coated with other metal or even involving doping. Low energy electron diffraction
(LEED) and scanning tunneling microscopy (STM) have shown that two metals
interacting on a surface can form compounds with structures not seen in bulk alloys
(Rodriguez, 1996). Many novel phenomena related to the kinetics of metals on metals
have been discovered. The knowledge gathered in this area provides a solid basis for the
synthesis of new materials with applications in areas of catalysis, electro-chemistry,
microelectronics and nano energetics. Metals such as platinum (Pt), palladium (Pd) or
nickel (Ni) have been recently considered for coating on aluminum to enhance the
ignition characteristics and energetics.
The isothermal oxidation performance for the Pt-Al system at 1473 K has been
found to be similar to that of Ni-Al. Both Pt-Al and Ni-Al oxidize at approximately the
same rate showing nearly parabolic reaction kinetics, and Zr-doped alloys have been
observed to oxidize at different rates (Dickey et al., 1999). Doping can also be used to
control the outward diffusion of ions in Al2O3 in an oxide-coated nano aluminum particle.
The segregation of these dopants is believed to alter the cation transport in the Al2O3
scale (one of the prominent mechanisms at nano scales) and thereby change the oxidation
mechanism (Pint et al., 1993). Partially oxidized aluminum substrates have been obtained
at different oxidation conditions in the study of Pd/AlOx/Al samples prepared in situ

231
through X-ray photoelectron spectroscopy (XPS) and low energy ion scattering (LEIS)
(Sedlacek et al., 2004). For aluminum particles coated with a thin layer of metal like
nickel, ignition can be achieved at a considerably lower temperature due to the highly
exothermic inter-metallic reactions. This type of particles is also less subject to
agglomeration (Babuk et al., 2001). Several experimental studies have been conducted to
explore the structural and thermal behaviors of these inter-metallics. The ignition
mechanisms of such systems, however, are not completely understood (Andrzejak et al.,
2007). It is not clear if the inter-metallic reactions or oxidation with ambient gases are
responsible for the observed changes in ignition characteristics and flame development.
Furthermore, the behavior of some of these systems at nano scales is completely
unexplored in the field of energetics.
The proposed work will proceed in three steps. First, a phenomenological theory
will be established to describe and analyze the various physio-chemical processes
involved in the ignition and combustion of single aluminum particles coated with
different metals (e.g., Pt, Pd, and Ni) at nano scales. The key phenomena of concern
include inter-metallic reactions, phase transformations of aluminum core and coated-
metal layer, oxidation, and energy transport at different length and time scales. Results
will provide basic theoretical insights into the mechanisms involved. In the second step,
an appropriate inter-metallic system will be selected for further study based on the impact
to the Army’s needs and coordination with other members of the MURI team. The final
step will involve detailed MD simulations of the particle behavior in the size range up to
20 nm. The study will extend the general framework established in the present MURI
program by considering inter-metallic interactions. State-of-the-art potential functions

232
will be employed (Eck et al., 2002). Priority will be given to those which have been
specially developed for describing inter-atomic interaction forces of transition metals and
have been used reliably for modeling metal systems (Sutton and Chen, 1990). All the
calculations will be performed on a distributed computing facility recently upgraded at
PSU, so that sweeping results can be acquired in a timely fashion. The combined
modeling and computational capabilities will provide unique and quantitative insights
into the atomistic mechanisms involved in the heating and subsequent reactions of metal-
coated aluminum particles.
10.2.2 Oxidation of Aluminum in Flow Environments
The ultimate goal of this research is to study the behavior of nano-energetic
particles. The emphasis will be placed on aluminum particles and their collective
behavior in different flow environments. A solid foundation has been laid in this direction
by examining the single particle behavior.
For the flow environment study, the first step will be to establish a general
analysis accommodating particle and thermo-fluid dynamics for two phase flow
interactions. Efforts will be devoted to the combustion of nano aluminum particles in
gaseous environments with different compositions and flow conditions. The physical
configurations to be considered can be a premixed flame propagation or ignition in a
constant area duct. The formulation for the gas phase dynamics will be based on the
complete conservation equations for a multi-component chemically reacting system in
three dimensions. Turbulence closure will be achieved by means of large eddy simulation

233
(LES) techniques, in which grid resolved scales will be calculated explicitly. The
unresolved small scales and their effects on resolved scales will be modeled either
analytically or empirically.
10.2.3 Flame Speed Calculations in Particle Laden Flows
The combustion of nanoparticles has been studied previously in a well
characterized laminar particle laden flow by means of both numerical and theoretical
approaches. However, there were a lot of assumptions involved and the particles were
treated as large molecules, which is a limiting case when particle size goes to zero. The
particle laden flow has been modeled as one dimensional, laminar, steady flow of
premixed gas mixture. The formulation has been numerically solved using CHEMKIN
software. The results obtained in this PhD work can be used to relax some of those
assumptions and improve the model.
Bibliography
Alavi, S., and Thompson, D. L., “Molecular Dynamics simulations of melting of aluminum nanoparticles,” Journal of Physical Chemistry A, Vol. 110, No. 4, 2006, pp. 1518
Alavi, S., Mintmire, J. W., and Thompson, D. L., “Molecular Dynamics Simulations of Oxidation of Aluminum Nano Particles,” Journal of Physical Chemistry B, Vol. 109, 2005, pp. 209

234
Alder, B. J., and Wainwright, T. E., “Phase Transition for a Hard Sphere System,” Journal of Chemical Physics, Vol. 27, 1957, pp. 1208
Alekseev, A. G., Barlas, R. A., Tsidelko, T. I., and Shapoval, A. F., “Effect of Particle Size on the Combustibility and Explosion Parameters of Dispersed Aluminum and Magnesium Powders,” in V. V. Nedin (Ed), Preduprezhdenie Vnezapnykh Vzryvov Gazodispersnykh Sistem, 1971, pp. 66 (in Russian)
Allard, L. F., Voelkl, E., Kalakkad, D. S., and Datye, A. K., “Electron holography reveals the internal structure of palladium nano-particles,” Journal of Material Science, Vol. 29, 1994, pp. 5612
Allen, M. P., and Tildesley, D. J., Computer simulation of liquids, Second Edition, Clarendon Press, Oxford, 1989
Anderson, H. C., “Molecular dynamics simulations at constant pressure and/or temperature,” Journal of Chemical Physics, Vol. 72, No. 4, 1980, pp. 2384-2393
Agarwal, P. M., Rice, B. M., and Thompson, D. L., “Molecular dynamics study of the effects of voids and pressure in defect-nucleated melting simulations,” Journal of Chemical Physics, Vol. 118, No. 21, 2003, pp. 9680-9688
Andrzejak, T., Shafirovich, E., and Varma, A., “Ignition Mechanism of Nickel-Coated Aluminum Particles,” Combustion and Flame, Vol. 150, 2007, pp. 60-70
Assovskiy, I. G., Zhigalina, O. M. and Kolesnikov-Svinarev, V. I., “Gravity Effect in Aluminum Droplet Ignition and Combustion,” 5th International Microgravity Combustion Workshop, 18-20 May 1999 Cleveland, USA, NASA, 1999
Assovskiy I. G., “Nano particles in aluminum combustion,” Proceedings of 29th International Pyrotechnics Seminar, Westminster, Colorado, IPS, 2002, pp.219-226
Babuk, V. A., Vassiliev, V. A., and Sviridov, V.V., “Propellant Formulation Factors and Metal Agglomeration in Combustion of Aluminized Solid Rocket Propellant,” Combustion Science and Technology, Vol. 163, 2001, pp. 261–289
Babuk, V. A., Vassiliev, V. A., and Sviridov, V. V., “Formation of Condensed Combustion Products at the Burning Surface of Solid Rocket Propellant,” Solid Propellant Chemistry, Combustion and Motor Interior Ballistics, Chapter 2.21, edited by V. Yang, T.B. Brill and W.Z. Ren, Progress in Astronautics and Aeronautics, AIAA, Vol. 185, 2000, pp. 749-774
Baldi, and Alfonso L., Patent 5028385, “Treatment of metals for coating or activation,” July 1991, http://www.freepatentsonline.com/5028385.html

235
Bartlett, R. W., Ong J. N., Fassell W. M., and Papp C. A., “Estimating Aluminum Particle Combustion Kinetics,” Combustion and Flame, Vol. 7, 1963, pp. 227-234
Beckstead, M. W., “A Summary of Aluminum Combustion,” Internal Aerodynamics in Solid Rocket Propulsion,” von Karman Institute for Fluid Dynamics, Lecture Series, Belgium, May, 2002
Belyaev, A. F., Frolov, Yu. V., and Korotkov, A. I., “Combustion and Ignition of Particles of Finely Dispersed Aluminum,” Fiz. Goreniia Vzryva, Vol. 4, 1968, pp. 323 (in Russian)
Bergsmark, E., Simensen, C. J., and Kofstad, P., “The oxidation of Molten Aluminum,” Materials Science and Engineering, A120, 1989, pp. 91-95
Bhatia, R., and Sirignano, W., “Metal Particle Combustion with Oxide Condensation,” Combustion Science and Technology, 1993
Boiko, V., Lotov, V., and Papyrin, A., “Ignition of gas suspensions of metallic powders in reflected shock waves,” Combustion, Explosion, and Shock Waves, Vol. 25, 1989, pp. 67-74,
Born, M., and Oppenheimer, R., “On the Quantum Theory of Molecules,” Annalen der Physik, Vol. 84, 1927, pp.457-484
Brewer, L., “The Thermodynamic Properties of the Oxides and Their Vaporization Processes,” Chemical Reviews, Vol. 52, No. 1, 1953, pp. 36-40
Brooks, K. P., and Beckstead, M. W., “Evaluation of a Flame Model with a Rijke Burner,” 28th JANAF Combustion Meeting, Vol. II, CPIA 573, 1991, pp.509-517
Brooks, K. P., and Beckstead, M. W., “Dynamics of Aluminum Combustion,” Journal of Propulsion and Power, Vol. 11, No. 4, pp. 769-780, 1995
Brossard, C.¸ Ulas, A., Yen, C. L., and Kuo, K. K., “Ignition and Combustion of Isolated Aluminum Particles in the Post-Flame Region of a Flat-Flame Burner,” 16th International Colloquium on the Dynamic of Explosions and Reactive Systems, Krakow, Poland, 3-8 August, 1997
Brousseau, P., and Anderson, C. J., “Nanometric Aluminum in Explosives,” Propellants, Explosives and Pyrotechnics, Vol. 27, 2002, pp.300-306
Brzustowski, T., and Glassman, I., “Spectroscopic Investigation of metal combustion,” Heterogeneous Combustion, Progress in Aeronautics and Astronautics, AIAA, New York, Vol. 15, 1964a, pp. 41-63
Bucher, P., Yetter, R. A., Dryer, F. L., Vicenzi, E. P., Parr, T. P., and Hanson, D. M., “Flame Structure Measurement of Single Measurement of Single Isolated

236
Aluminum Particles Burning in Air,” Twenty-Sixth Symposium (International) on Combustion, Naples, Italy, 1996, pp. 2-25
Bucher, P., Yetter, R. A., Dryer, F. L., Vicenzi, E. P., Parr, T. P., and Hanson, D. M., “PLIF Species and Ratio metric Temperature Measurements of Aluminum Particle Combustion in O2,CO2, and N2O Oxidizers, and comparison with Model Calculations,” Twenty-Seventh Symposium (International) on Combustion, The Combustion Institute, 1998, pp. 2421-2429
Bucher, P., Yetter, R. A., Dryer, F. L., Vicenzi, E. P., Parr, T. P., and Hanson, D.M., “Condensed-phase Species Distributions about Aluminum Particles Reacting in Various Oxidizer,” Combustion and Flame, Vol. 117, 1999, pp. 351-361,
Bucher, P., Yetter, R. A., Dryer, F. L., Vicenzi, E. P., Parr, T. P., and Hanson, D. M., “Detailed Studies on the Flame Structure of Aluminum Particle Combustion,” Solid Propellant Chemistry, Combustion and Motor Interior Ballistics, Chapter 2.19, edited by Yang, V., Brill, T. B., and Ren, W. Z., Progress in Astronautics and Aeronautics, AIAA, Reston, VA, Vol. 185, 2000, pp. 689-722
Bulian, C. J., Kerr, T. T., and Puszynski, J. A., “Ignition Studies of Aluminum and Metal Oxide Nanopowders,” in F. J. Schelling (Ed), IPSUSA Seminars, Inc., 31st International Pyrotechnics Seminar, Fort Collins, CO, 12-14 July, 2004, pp. 327
Buoik, A., Safety Engineering in Powder Metallurgy [in Russian from the Polish], Hutnik (Stalingrod), Vol. 8, 1954
Campbell, T., Kalia, R. K., Nakano, A., Vashishta, P., “Dynamics of Oxidation of Aluminum Nanoclusters using Variable Charge Molecular-Dynamics Simulations on Parallel Computers,” Physical Review Letters, Vol. 82, No. 24, 1999, pp. 4866-4869
Campbell, T. J., Aral, G., Ogata, S., Kalia, R. K., Nakano, A., and Vashishta, P., “Oxidation of aluminum nanoclusters,” Physical Review B., Vol. 71, 2005, pp. 205413
Catorie, L., Private Communication, December 2004
Chang, H., Choi, Y., Kong, K., Ryu, B. H., “Atomic and electronic structures of amorphous Al2O3,” Chemical Physics Letters, Vol. 391, 2004, pp. 293-296
Cleri, F., and Rosato, V., “Tight binding potentials for transition metals and alloys,” Physical Review B, Vol. 48, No. 1, 1993, pp. 22-33
Cousins, C. S. G., “The corundum structure: internal strain tensors and cluster configurations under stress,” Journal of Physics: Solid State Physics, Vol. 14, 1981, pp. 1508-1602

237
Davis, A., “Solid Propellants: The Combustion of Particles of Metal Ingredients,” Combustion and Flame, Vol. 7, 1963, pp. 359-367
Daw, M. S., and Baskes, M. I., “Embedded-atom method: Derivation and application to impurities, surfaces, and other defects in metals,” Physical Review B, Vol. 29, No. 12, 1984, pp. 6443-6453
Daw, M. S., “Model of metallic cohesion: The embedded-atom method,” Physical Reivew B, Vol. 39, No. 11, 1989, pp. 7441-7452
Daw, M. S., Foiles, S. M., and Baskes, M. I., “The Embedded Atom Method: A review of theory and applications,” Materials Science Reports, 1993, pp. 251-310
Derevyga, M. E., Stesik, L. N., and Fedorin, E. A., “Study of the Ignition and Combustion of Aluminum and Zinc in Air,” Combustion Explosion and Shock Waves, Vol. 13, 1977, pp. 722
Dickey, E. C., Pint, B. A., Alexander, K. B., and Wright, I. G., “Oxidation Behavior of Platinum-Aluminum Alloys and the Effect of Zr doping,” Journal of Materials Research, Vol. 14, No. 12, 1999, pp. 4531
Dreizin, E. L., “Surface Phenomena in Aluminum Combustion,” Combustion and Flame, Vol. 101, 1995, pp. 378-382
Dreizin, E. L., “Experimental Study of Stages in Aluminum Particle Combustion in Air,” Combustion and Flame, Vol. 105, 1996, pp. 541-556
Dreizin, E. L., “On Mechanism of Asymmetric Aluminum Particle Combustion,” Combustion and Flame, Vol. 117, 1999, pp. 841-850
Dreizin, E. L., “Experimental Study of Aluminum Particle Flame Evolution in Normal and Micro-Gravity,” Combustion and Flame, Vol. 116, 1999, pp. 323-333
Dreizin, E.L., “Phase Changes in Metal Combustion,” Progress in Energy and Combustion Science, Vol. 26, 2000
Dreizin, E. L., “Effect of Phase Changes on Metal-Particle Combustion Process,” Combustion, Explosion, and Shock Waves, Vol. 39, No. 6, 2003, pp. 681-693
Duan, W., Wentzcovitch, R. M., and Thomson, T., “First principles study of high-pressure alumina polymorphs,” Physical Review B, Vol. 57, No. 17, 1998
Eck, B., Kurtulus, Y., Offermans, and W., Dronskowski, R., “Atomistic Simulations of Solid-State Materials Based on Crystal-Chemical Potential Concepts: Application for Compounds, Metals, Alloys, and Chemical Reactions,” Journal of Alloys and Compounds, Vol. 338, 2002, pp. 142

238
Eckert, J., Holzer, J. C., Ahn, C. C., Fu, Z., and Johnson, W. L., “Melting Behavior of Nanocrystalline Aluminum Powders,” Nano Structured Materials, Vol. 2, 1993, pp. 407
Eisenreich, N., Fietzek, H., Lorenzo, M., Kolarik, V., Koleczko, A., and Weiser, V., “On the mechanism of low temperature oxidation for aluminum particles down to the nano-scale,” Propellants, Explosives, Pyrotechnics, Vol. 29, 2004
Ercolessi, F., and Tosatti, E., “Au (100) Surface Reconstruction,” Physical Review Letters, Vol. 57, No. 6, 1986, pp. 719-722
Ercolessi, F., Parrinello, M., and Tosatti, E., “Simulation of gold in the glue model,” Philosophical Magazine A, Vol. 58, No. 1, 1988, pp. 213-226
Ercolessi, F., and Adams, J. B., “Interatomic Potentials from First principles Calculations: the Force-Matching Method,” Europhysics Letters, Vol. 26, No. 8, 1994, pp. 583-588
Ermakov, V. A., Razdobreev, A. A., Skorik, A. I., Pozdeev, V. V., and Smolyakov, S. S., “Temperature of Aluminum Particles at the Moments of Ignition and Combustion,” Fiz. Goreniya Vzryva, Vol. 18, 1982, pp. 141 (in Russian)
Ermakova, E., Solca, J., Huber, H., and Welker, M., “Argon in condensed phase: Quantitative calculations of structural, thermodynamic, and transport properties from pure theory,” Journal of chemical Physics, Vol. 102, No. 12, 1995, pp. 4942-4951
Evans, D. J., and Hoover, W. G., “Flows far from equilibrium via molecular Dynamics,” Annual Rev. Fluid Mech., Vol. 18, 1986, pp. 243-264
Faeth, G. M., “Current Status of Droplet and Liquid Combustion,” Progress in Energy and Combustion Science, Vol. 3, 1977, pp. 191-224
Fedorov, A. V., and Kharlamova Y. V., “Ignition of an Aluminum Particle,” Combustion, Explosion, and Shock Waves, Vol. 39, No. 5, 2003, pp. 544-547
Fedoseev, V. A., “Combustion of Magnesium and Aluminum Particles in Different Media,” Fizika Aerodispersnykh Sistem, Vol. 3, 1970, pp. 61 (in Russian)
Filippov, A.V., and Rosner, D. E., “Energy transfer between an aerosol particle and gas at high temperature ratios in the Knudsen transition regime,” International Journal of Heat and Mass Transfer, Vol. 43, 2000, pp. 127-138
Finnis, M. W., and Sinclair, J. E., “A simple empirical N-body potential for transition metals,” Philosophical Magazine A, Vol. 50, No. 1, 1984, pp. 45-55

239
Foelsche, R. O., Burton, R. L., and Krier, H., “Ignition and Combustion of Aluminum Particles in H2/O2/N2 Combustion Products,” Journal of Propulsion and Power, Vol. 14, No. 6, 1998, pp. 1001-1008
Foiles, S. M., “Calculation of the surface segregation of Ni-Cu alloys with the use of the embedded-atom method,” Physical Review B, 1985, Vol. 32, No. 12, pp. 7685-7693
Foiles, S. M., Baskes, M. I., and Daw, M. S., “Embedded-atom-method functions for the fcc metals Cu, Ag, Au, Ni, Pd, Pt, and their alloys,” Physical Review B, Vol. 33, No. 12, 1986, pp. 7983-7991
Foiles, S. M., and Daw, M. S., “Application of the embedded atom method to Ni3Al,” Journal of Materials Research, Vol. 2, 1987, pp. 5-15
Foiles, S. M., and Daw, M. S., “Calculation of the thermal expansion of metals using the embedded-atom method,” Physical Review B, Vol. 38, No. 17, 1988, pp. 12643-12644
Foiles, S. M., and Adams, J. B., “Thermodynamic properties of fcc transition metals as calculated with the embedded atom method,” Physical Review B, Vol. 40, No. 9, 1989, pp. 5909-5915
Fontijin, A., and Felder, W., “HTFFR kinetics studies of Al+CO2=AlO+CO from 300 to 1900K, a non-Arrhenius reaction,” The Journal of Chemical Physics, Vol. 67, No. 4, 1977, pp. 1561-1569
Fowler, R.F., “The identification of a droplet in equilibrium with its vapor”, CCP5 Quaterly, 13, pp.58-62, 1984
Frenkel, D., and Smit, B., Understanding Molecular Simulation: From Algorithms to Applications, Second Edition, Academic Press, New York, 2002
Friedlander, S. K., Smoke, Dust and Haze, Second Edition, Oxford University Press, New York, 2000
Friedman, R., and Maeck, A., “Ignition and Combustion of Aluminum Particles in Hot Ambient Gases,” Combustion and Flame, Vol. 6, 1962, pp. 9-19
Friedman, R., and Maeck A., “Combustion Studies of Single Aluminum Particles,” Ninth Symposium (International) on Combustion, 1963, pp. 703-709
Gall, M. L., Huntz, A. M., Lesage, B., and Monty, C., “Self-diffusion in alpha-Al2O3 and growth of alumina scales formed by oxidation: Effect of Y2O3 doping,” Journal of Materials Science, Vol. 30, 1995, pp. 201-211

240
Gezelter, J. D., Rabani, E., and Berne, B. J., “Can Imaginary Instantaneous Normal Mode Frequencies Predict Barriers to Self-Diffusion?,” Journal of Chemical Physics, Vol. 107, No. 12, 1997, pp. 4618-4627
Glassman, I., Combustion, First Edition, Academic, New York, 1977
Glassman, I., Papas, P., and Brezinsky, K., “A new definition and Theory of Pyrophoricity,” Combustion Science and Technology, Vol. 83, 1992, pp. 161-165
Glassman, Combustion, Third edition, Academic Press, 1996
Girifalco, L. A., and Weizer, V. G., “Application of the Morse Potential Function to Cubic Metals,” Physical Review, Vol. 114, No. 3, 1959, pp. 687-690
Goldsmith, A., Hirschhorn, H. J., and Waterman, T. E., Thermo-physical Properties of Solids, WADC Technical Report 58-76, Vol. III, US Air Force Wright-Patterson AF Base, OH, 1960
Gremyachkin, V. M., Istratov, A. G., and Leipunskii, O. I., “Effect of immersion in a flow on Metal Droplet Combustion,” Combustion Explosion and Shock Waves, Vol. 15, No. 1, 1979, pp. 26-29
Grigor’ev, Y. M., Galchenko, Y. A., and Merzhanov, A. G., “Investigation of the rate of the high temperature reaction between aluminum and oxygen using the ignition method,” Combustion, Explosion and Shock Waves, Vol. 9, No. 2, 1973, pp. 162-167
Grigor’ev, Y. M., and Vakina, Z. K., “Critical Ignition Conditions for Metals with a Logarithmic Oxidation Law,” Combustion, Explosion and Shock Waves, Vol. 15, No. 1, 1979, pp. 51-53
Gutierrez, G., Taga, A., and Johansson, B., “Theoretical structure determination of Al2O3,” Physical Review B, Vol. 65, 2001, pp. 012101
Gutierrez, G., and Johansson, B., “Molecular dynamics study of structural properties of amorphous Al2O3, Physical Review B, Vol. 65, 2002, pp. 104202
Gurevich, M. A., Ozerov, E. S., and Yurinov, A. A., “Effect of an oxide film on the inflammation characteristics of aluminum,” Combustion, Explosion and Shock Waves, Vol. 14, No. 4, 1978, pp. 448-451
Halicioglu, T., and Pound, G. M., “Calculation of Potential Energy parameters from Crystalline State Properties,” Physica Status solidi (a), Vol. 30, 1975, pp. 619-623
Hartman, K. O., “Ignition and Combustion of Aluminum Particles in Propellant Flame Gases,” Eighth JANAF Combustion Meeting, Vol. 1, 1971, pp. 1-24

241
Hasnaoui, A., Politano, O., Salazar, J. M., Aral, G., Kalia, R. K., Nakano, A., Vashishta, P., “Molecular dynamics simulations of the nano-scale room-temperature oxidation of aluminum single crystals,” Surface Science, Vol. 579, 2005, pp. 47-57
Hoang, V. V., Oh, S. K., “Annealing effects on structure in amorphous Al2O3 models,” Physica B, Vol. 364, 2005, 2125-232
Hoagland, R. G., Daw, M. S., Foiles, S. M., and Baskes, M. I., “An atomic model of crack tip deformation in aluminum using an embedded atom potential,” Journal of Materials Research, Vol. 5, No. 2, 1990, pp. 313-324
Hoover, W. G., “Canonical dynamics: Equilibrium phase-pace distributions,” Physical Review A, Vol. 31, 1985, pp. 1695
Huang, Y., Risha, G. A., Vigor, Y., and Yetter, R. A., “Analysis of Nano-Aluminum Particle Dust Cloud Combustion in Different Oxidizer Environments,” 43rd Aerospace Sciences Meeting and Exhibit, Reno, Nevada, 2005
Huang, Y., Risha, G. A., Vigor, Y., and Yetter, R. A., “Flame Propagation in Bimodal Nano/Micro-Sized Aluminum Particles/Air Mixtures,” 44th Aerospace Sciences Meeting and Exhibit, Reno, Nevada, 2006
Huang, Y., Risha, G. A., Yang, V., and Yetter R. A., “Combustion of bimodal nano/micron-sized aluminum particle dust in air,” Proceedings of the Combustion Institute, Vol. 31, 2007, pp. 2001-2009
Hultgren, R., Desai, P. D., Hawkins, D. T., Gleiser, M., and Kelley, K. K., Selected Values of Thermodynamic Properties of the Elements, American Society for Metals, 8th Edition, Metal Parks, Ohio,1973
Hyuk, I., Jeong, U., and Xia, Y., “Polymer hollow particles with controllable holes in their surfaces,” Nature Materials, Vol. 4, 2005, pp. 671
Ilyin, A. P., Gromov, A. A., Vereshchagin, V. I., Popenko, E. M., Surgin, V. A., and Lehn H., “Combustion of Agglomerated Ultrafine Aluminum Powders in Air,” Combustion Explosion and Shock Waves, Vol. 37, 2001, pp. 664
Ivanov, G. V., and Tepper, F., “Activated Aluminum as a Stored Energy Source for Propellants,” Fourth International Symposium on Special Topics in Chemical Propulsion, Challenges in Propellants and Combustion 100 Years after Nobel, Stockholm, Sweden, 27-28 May, 1996, pp. 636-644
JANAF Thermodynamic Tables, 3rd Edition, American Chemical Society, 1981

242
Jiang, Q., Yang, C. C., and Li, J. C., “Melting enthalpy depression of nanocrystals,” Materials Letters, Vol. 56, 2002, pp. 1019-1021
Jeurgens, L. P. H., Sloof, W. G., Tichelaar, F. D., and Mittemeijer, E. J., “Determination of thickness and composition of aluminum-oxide overlayers on aluminum substrates,” Applied Surface Science, Vol. 144-145, 1999, pp. 11-15
Jeurgens, L. P. H., Sloof, W. G., Tichelaar, F. D., and Mittemeijer, E. J., “Thermodynamic stability of amorphous oxide films on metals: Application to aluminum oxide films on aluminum substrates,” Physical Review B, Vol. 62, No. 7, 2000, pp. 4707-4719
Jeurgens, L. P. H., Sloof, W. G., Tichelaar, F. D., Borsboom, C. G., and Mittemeijer, E. J., “Determination of total primary zero loss intensities in measured electron emission spectra of bare and oxidized metals Application to aluminum oxide films on aluminum substrates,” Applied Surface Science, Vol. 161, 2000, pp. 139-148
Jeurgens, L. P. H., Sloof, W. G., Tichelaar, F. D., and Mittemeijer, E. J., “Growth kinetics and mechanisms of aluminum-oxide films formed by thermal oxidation of aluminum,” Journal of Applied Physics, Vol. 92, No. 3, 2002, pp.1649-1656
Jeurgens, L. P. H., Sloof, W.G., Tichelaar, F. D., and Mittemeijer, E. J., “Structure and morphology of aluminum-oxide films formed by thermal oxidation of aluminum,” Thin Solid Films, Vol. 418, No. 2, 2002, pp. 89-101
Jeurgens, L.P.H., Sloof, W.G., Tichelaar, F.D., and Mittemeijer, E.J., “Composition and chemical state of the ions of aluminum-oxide films formed by thermal oxidation of aluminum,” Surface Science, Vol. 506, 2002, pp. 313-332
Johnson, C., Parr, T., Hanson-Parr, D., Hollins, R., Fallis, S., and Higa, K., “Combustion and Oxidation of Metal Nanoparticles and Composite Particles,” Proceedings of 37th JANNAF Meeting, 13-17 Nov, 2000, pp. 539
Johnson, R. A., “Analytic nearest neighbor model for fcc metals,” Physical Review B, Vol. 37, No. 8, 1988, pp. 3924-3931
Johnson, R. A, “Alloy models with the embedded-atom method,” Physical Review B, Vol. 39, No. 17, 1989, pp. 12554-12559
Jones, H. D., “Theory of the Thermodynamic Properties of Liquid Metals,” Physical Review A, Vol. 8, No. 6, 1973, pp. 3215-3226
Joswig, J. O., and Springborg, M., “Genetic algorithms search for global minima of aluminum clusters using a Sutton-Chen potential,” Physical Review, Vol. 68, No. 8, 2003, pp. 085408

243
Keffer, D. J., and Mintmire, J. W., “Efficient Parallel Algorithms for Molecular Dynamcis Simulations Using variable Charge Transfer Electrostatic Potentials,” International Journal of Quantum Chemistry, Vol. 80, 2000, pp. 733-742
King, M., “Modeling of Single Particle Aluminum Combustion in CO2-N2 Atmospheres,” 17th Symposium (International) on Combustion, The Combustion Institute, Pittsburg, 1977, pp. 1317-1328
Kondis, Thomas J., Patent 3986674, “Monitoring activation of particulate aluminum,” October 1976, http://www.freepatentsonline.com/3986674.html
Kondis, Thomas J., Patent 3963482, “Large size aluminum particle containing aluminum oxide therein,” June 1976, http://www.freepatentsonline.com/3963482.html
Konning, M., Antonelli, A., and Yip, S., “Single simulation determination of phase boundaries: A dynamic Clasius-Clapeyron integration method,” Journal of Chemical Physics, Vol. 115, No. 24, 2001, pp. 11025-11035
Kudryavtsev, V., Sukhov, A., Voronetskii, A., and Shpara, A., “High Pressure Combustion of Metals (Three-Zone Model),” Combustion Explosion and Shock Waves, Vol. 15, No. 6, 1979, pp. 731-737
Kwon Y. S., Gromov, A. A., Ilyin A. P., Popenko E. M., and Rim G. H., “The mechanism of combustion of superfine aluminum powders,” Combustion and Flame, Vol. 133, 2003, pp. 385
Law, C. K., “A simplified Theoretical Model for Vapor Phase Combustion of Metal Particles,” Combustion Science and Technology, Vol. 7, 1973, pp. 197-212
Law, C. K., and Williams, F., “On a Class of Models for Droplet Combustion,” 12th Aerospace Sciences Meeting, Washington, D.C., AIAA Paper 74-147, 1974
Liang, L. H., Li, J. C., and Jiang, Q., “Size-dependant melting depression and lattice contraction of Bi nanocrystals,” Physica B, 2003, pp. 49-53
Little, J. K., “Simulation of droplet evaporation in supercritical environments using parallel molecular dynamics,” Ph.D Dissertation, Department of Mechanical Engineering, The Pennsylvania State University, PA, 1996
Lokenbakh, A., Zaporina, N., Knipele, A., Strod, V., and Lepin, L., “Effects of heating conditions on the agglomeration of aluminum powder in air,” Combustion, Explosion, and Shock Waves, Vol. 21, pp. 73-82, 1985
Long, L. N. L., Micci, M. M., Wong, B. C., “Molecular dynamics simulations of droplet evaporation,” Computer Physics Communications,” Vol. 96, 1996, pp. 167-172

244
Lutsko, J. F., Wolf, D., Phillpot, S. R., and Yip, S., “Molecular Dynamics study of lattice-defect nucleated melting in metals using an embedded-atom-method potential,” Physical Review B., Vol. 40, No. 5, 1989, pp. 2841-2855
Maeck, A., “Fundamentals of Combustion of Single Aluminum and Beryllium Particles,” Eleventh Symposium (International) on Combustion, 1967, pp. 203-217
Mallard, W. G., Westley, F., and Hampson, R. F., NIST Chemical Kinetics Database Version 6.0, NIST Standard Reference Data, Gaithersburg, MD, 1994
Marian, J., Knap, J., and Ortiz, M., “Nanovoid Cavitation by Dislocation Emission in Aluminum,” Physical Review Letters, Vol. 93, 2004
Marian, J., Knap, J., and Ortiz, M., “Nanovoid deformation in aluminum under simple shear,” Acta Materiala, Vol. 53, 2005, pp. 2893
Marion M., and Gokalp I., “Studies on the Ignition and Burning of Aluminum Particles,” AIAA 95-2861, 1995
Marion M., and Gokalp I., “Studies on the Ignition and Burning of Aluminum Particles,” Combustion Science and Technology, Vol. 116, 1996, pp. 369-390
Matyushov, D. V., and Schmid, R., “Calculation of Lennard-Jones energies of molecular fluids,” Journal of Chemical Physics, Vol. 104, No. 21, 1996, pp. 8627-8638
McClean, R., Nelson, H., and Cambell, M., “Kinetics of Reaction Al+H2O over an extended temperature range,” Journal of Physical Chemistry, Vol. 97, 1993, pp. 9673-9676
Meda, L., Marra, G., Galfetti, L., Inchingalo, S., Severini, F., and De Luca, L., “Nano-composites for rocket solid propellants,” Composites Science and Technology, v 65, n 5 SPEC. ISS., April, 2005, pp. 769-773
Medvedev, A. E., Fedorov, A. V., and Fomin, V. M., “Mathematical modeling of metal particle ignition in the high temperature flow behind a shock,” Combustion, Explosion and Shock Waves, Vol. 18, No. 3, 1982, pp. 261-264
Melcher, J. C., Burton R. L., and Krier, H., “Combustion of Aluminum Particles in Solid Rocket Motor Flows,” 36th JANAF Combustion Meeting, Vol.1,CPIA#691,1999, pp. 249-258
Melcher, J., Burton, and R., Krier, H., “Formation of Condensed Combustion Products at the Burning Surface of Solid Rocket Propellant,” Solid Propellant Chemistry, Combustion and Motor Interior Ballistics, Chapter 2.20, edited by V. Yang, T.B. Brill and W.Z. Ren, Progress in Astronautics and Aeronautics, AIAA, Vol. 185, 2000, pp. 723-748

245
Melchionna, S., Cicccotti, G., Holian, B.L., “Hoover NPT Dynamics for systems varying in shape and size”, Molecular Physics, Vol. 78, No. 3, pp. 533-544
Mench, M., Yeh, C. L., and Kuo, K., “Propellant Burning Rate Enhancement and Thermal Behavior of Ultra-Fine Aluminum Powders (Alex),” 29th International Annual Conference of ICT, Karlsruhe, Germany, June 30-July 3, 1998, pp. 30/1
Merzhanov, A. G., Grigorjev, Y. M., and Galchenko, Y. A., “Aluminum Ignition,” Combustion and Flame, Vol. 29, 1977, pp. 1-14
Mei J., and Davenport, J. W., “Free-energy calculations and the melting point of Al,” Physical Review B, Vol. 46, No. 1, 1992, pp. 21-25
Micheli, P. L., and Schmidt, W. G., “Behavior of Aluminum in Solid Rocket Motors,” Aerojet Solid Propulsion Co., AFRPL-TR-76-58, Sacramento, CA, 1977
Miguel, M. A. S., and Sanz, J. F., “Molecular dynamics simulations of liquid aluminum oxide,” Physical Review B, Vol. 58, No. 5, 1998, pp. 2369-2371
Morse, P. M., “Diatomic molecules according to the wave mechanics II. Vibrational levels,” Physical Review, Vol. 34, 1929, pp. 57-64
Nose, S., “A unified formulation of the constant temperature molecular dynamics methods,” Journal of Chemical Physics, Vol. 81, 1984, pp. 511
Nose, S., “A molecular dynamics method for simulations in the canonical ensemble,” Molecular Physics, Vol. 52, 1985, pp. 255
Nose S., and Yonezawa, F., “Isothermal-isobaric computer simulations of melting and crystallization of a Lennard-Jones system,” Journal of Chemical Physics, Vol. 84, No. 3, 1986, pp. 1803-1814
Olsen, S. E., and Beckstead M. W., “Burn time measurements of Single Aluminum Particles in Steam and Carbon-di-oxide mixtures,” Journal of Propulsion and Power, Vol. 12, No. 4, 1996, pp. 662-671
Orlandi, O., and Fabignon, Y., “Numerical simulation of the combustion of a single droplet in propellant gas environment,” 2nd European Conference on Launcher Technology, Space Solid Propulsion, Rome, November 21-24, 2000
Ortega, A., “The kinetics of solid-state reactions toward consensus - Part I: Uncertainties, failures, and successes of conventional methods,” International Journal of Chemical Kinetics, Vol. 33, 2001, pp. 343-353
Panda, S., and Pratsinis, S. E., “Modeling the synthesis of aluminum particles by evaporation-condensation in an aerosol flow reactor,” Nanostructured Materials, Vol. 5, No. 7, 1995, pp. 755-767

246
Park, K., Lee, D., Rai, A., Mukherjee, D., and Zachariah, M. R., “Size-resolved Kinetic Measurements of Aluminum Nanoparticle Oxidation with Single Particle Mass Spectrometry,” Journal of Physical Chemistry, Vol. 109, 2005, pp.7290-7299
Ph. Buffat, and Borel, J. P., “Size effect of the melting temperature of gold particles,” Physical Review A, Vol. 13, 1976, pp. 2287
Phillpot, S. R., Lutsko, J. F., Wolf, D., Yip, S., “Molecular dynamics study of lattice-defect-nucleated melting in silicon,” Physical Review B, Vol. 40, 1989, pp. 2831
Pint, B. A., Martin, J. R., and Hobbs, L. W., “O/SIMS Characterization of the Growth Mechanism of Doped and Undoped α -Al2O3,” Oxidation of Metals, Vol. 39, 1993, pp. 167
Pivkina, A., Ulyanova, P., Frolov, Y., Zavyalov, S., and Schoonman, J., “Nanomaterials for Heterogeneous Combustion,” Propellants, Explosives, Pyrotechnics, Vol. 29, No. 1, 2004, pp. 39-48
Plimpton, S., “Fast parallel Algorithms for short range Molecular Dynamics,” Journal of Computational Physics, Vol. 117, No. 1, 1995, pp. 1-19
Powles, J. G., Fowler, R. F., Evans, W. A. B., “The surface thickness of simulated microscopic liquid drops”, Physics Letters, 98A, 1983, pp. 421-425
Powles, J. G., Fowler, R. F., Evans, W. A. B., “A new method for computing surface tension using a drop of liquid,” Chemical Physics Letters, Vol. 96, No.3, 1983, pp.289-292
Powles, J.G., Fowler, R.F., Evans, W. A. B., “The dielectric constant of a polar liquid by the simulation of microscopic drops,” Chemical Physics Letters, Vol. 7, No. 3, 1984, pp.280-283
Powles, J.G., Rickayzen, G., Williams, M.L., “A curious result concerning the Clasius virial,” Journal of Chemical Physics, Vol. 83, 1985, pp. 293-296 Text
Prentice, J. L., “Combustion of Pulse Heated Single Particles of Aluminum and Beryllium,” NWC TP 5162, Naval Weapons Center, China Lake, CA, 1971
Prentice, J. L., “Combustion of Laser-Ignited Aluminum Droplets in Wet and Dry Oxidizers,” AIAA 12th Aerospace Science Sciences Meeting, AIAA Paper No. 74-146, 1974
Price, E. W., Christensen, H. C., Knipe, R. H., Drew, C. M., Prentice, J. L., and Gordon, A. S., “Aluminum Particle Combustion Progress Report,” NOTS-TP-3916, Naval Ordnance Test Station, China Lake, Ca, 1966

247
Price, E. W., and Sigman, R. K., “Combustion of Aluminized Solid Propellants,” Solid Propellant Chemistry, Combustion and Motor Interior Ballistics, Chapter 2.18, edited by V. Yang, T.B. Brill and W.Z. Ren, Progress in Astronautics and Aeronautics, AIAA, Vol. 185, 2000, pp. 663-687
Puri, P., Yang, V., “Effect of Particle Size on Melting of Aluminum at Nano Scales,” Journal of Physical Chemistry C, Vol. 111, 2007, pp. 11776
Puri, P., and Yang, V., “Molecular Dynamics Simulations of Effects of Pressure and Void Size on Melting of Aluminum,” 43rd AIAA/ASME/SAE/ASEE Joint Propulsion Conference & Exhibit, Cincinnati, July 2007
Puri, P., and Yang, V., “A multi-scale theory of ignition and combustion of particulate aluminum,” in preparation, 2008
Puri, P., and Yang, V., “Ignition and Combustion of Aluminum Particles at Micron and Nano Scales,” in preparation for Progress in Energy and Combustion Science, 2008
Puri, P., and Yang, V., “Pyrophoricity of Aluminum at Nano Scales,” to be submitted to Combustion and Flame, 2008
Puri, P., and Yang, V., “Thermo-Mechanical Behavior of Nano Aluminum Particles with Oxide Layers,” AIAA Paper 2008-938, to be submitted to Physical Review, 2008
Ragab, A., and Bayouni, S. E., Engineering Solid Mechanics Fundamentals and Applications, CRC Press, New York, 1999
Rahman, A., “Correlations in the motion of Atoms in Liquid Argon,” Physical Review, Vol. 136, No. 2A, 1964, pp. 405
Rai, A., Lee, D., Park, K., and Zachariah, M. R., “Importance of Phase Change of Aluminum in Oxidation of Aluminum Particles,” Journal of Physical Chemistry, Vol. 108, No. 9, 2004, pp.14793-14795
Rai, A., Lee, D., Park K., and Zachariah, M.R., “Size Resolved Measurements and Theory of Aluminum Nanoparticle Oxidation Kinetics,” Combustion Institute Meeting, 2005
Rappe, A. K., and Goddard, W. A., “Charge Equilibration for Molecular Dynamics Simulations,” Journal of Physical Chemistry, Vol. 95, No. 8, 1991, 3358-3363
Rhee, S. K., “Wetting of Ceramics by Liquid Aluminum,” Journal of American Ceramic Society, Vol. 53, No. 7, 1970, pp. 386-389

248
Risha G. A., “Enhancement of Hybrid Rocket Combustion Performance using Nano-Sized Energetic materials” Ph.D Dissertation, Department of Mechanical Engineering, The Pennsylvania State University, PA, 2003
Risha, G. A., Huang, Y., Yetter, R. A., and Yang, V., “Experimental Investigation of Aluminum Particle Dust Cloud Combustion,” 43rd Aerospace Sciences Meeting and Exhibit, Reno, Nevada, 2005, Reno, Nevada, AIAA 2005-739
Risha, G. A., Huang, Y., Yetter, R. A., and Yang, V., “Combustion of Aluminum Particles with Steam and Liquid Water,” 44th AIAA Aerospace Sciences Meeting and Exhibit, Reno, Nevada, 2006, AIAA 2006-1154
Risha, G. A., Son, S. F., Yetter, R. A., and Yang, V., Tappan, B.C., “Combustion of nano-aluminum and liquid water,” Proceedings of Combustion Institute, 31, 2007, pp. 2029-2036
Roberts, T. A., Burton R. L., and Krier H., “Ignition and Combustion of Aluminum/Magnesium Alloy particles in O2 at High pressures,” Combustion and Flame, 92, 1993, pp. 125-143
Rode, H., Hlavacek, V., Viljoen, H. J., and Gatica, J. E., “Combustion of Metallic Powders: A Phenomenological model for the Initiation of Combustion,” Combustion Science and Technology, Vol. 88, pp. 153-175
Rodriguez, J. A., “Physical and Chemical Properties of Bimetallic Surfaces,” Surface Science Reports, 24, 1996, pp. 223
Roohtan, C. C. J., “A study of Two-Center Integrals Useful in Calculations on Molecular Structure I,” Journal of Chemical Physics, Vol. 19, No. 12, 1951, pp. 1445-1458
Rozenband, V. I., and Vaganova N. I., “A Strength Model of Heterogeneous Ignition of Metal Particles,” Combustion and Flame, Vol. 88, 1992, pp. 113
Sebetci, A., and Guvenc, Z. B., “Global minima of AlN, AuN and PtN, N<80 clusters described by the Voter-Chen version of embedded-atom potentials,” Modeling and Simulation in Materials Science and Engineering, Vol. 13, 2005, pp. 683-698
Sedlacek, L., Matolinova, I., Veltruska, K., and Matolin, V., “Study of Pd-Al Interactions on Pd/AlOx/Al Systems during CO Adsorption and Desorption Cycles: XPS and LEIS,” Surface Science, Vol. 556, 2004, pp. 1035
Shackelford, J.F., and Alexander, W., CRC Materials Science and Engineering Handbook, CRC Press, Third Edition, 2000

249
Shimomura, Y., and Moritaki, Y., “On the Important Effect of Water Vapor in the Atmosphere on Void Formation in Quenched Pure Aluminum,” Japanese Journal of Applied Physics, Vol. 20, 1981, pp.1781
Simpson, T. W., Wen, Q., Yu, N., and Clarke, D. R., “Kinetics of the Amorphous→ γ →α transformations in Aluminum Oxide: Effect of Crystallographic orientation,” Journal of American Ceramic Society, Vol. 81, No. 1, 1998, pp. 61-66
Solca, J., Anthony, J. D., Steinebrunner, G., Kircher, B., and Huber, H., “Melting curve for argon calculated from pure theory,” Chemical Physics, Vol. 224, No. 2, 1997, pp. 253-261
Solca, J., Dyson, A.J., Steinebrunner, G., Kirchner, B., and Huber, H., “Melting curves for neon calculated from pure theory,” Journal of Chemical Physics, Vol. 108, No. 10, 1998, pp. 4107-4111
Song, X., and Morris, J. R., “Accurate method to calculate liquid and solid free energies for embedded atom potentials,” Physical Review B, Vol. 67, 2003, pp. 092203
Streitz, F. H., and Mintmire, J. W., “Electrostatic Potentials for metal-oxide surfaces and interfaces,” Physical Review B, Vol. 50, No. 16, 1994, pp. 11996-12003
Sturgeon, J. B., and Laird, B. B., “Adjusting the melting point of a model system via Gibbs-Duhem integration: Application to a model of aluminum,” Physical Review B, Vol. 62, No. 22, 2000, pp. 14720-14727
Sutton, A. P., and Chen, J., “Long Range Finnis-Sinclair Potentials,” Philosophical Magazine Letters, 61, 1990, pp. 139
Suvaci, E., Simkovich, G., and Messing, G. L., “The Reaction-Bonded Aluminum Oxide Process: I, The Effect of Attrition Milling on the Solid-State Oxidation of Aluminum Powder,” Journal of American Ceramic Society, Vol. 83, No. 2, 2000, pp. 299-305
Tatum, D., and Kuo, K., “Physicochemical Considerations in Modeling Ignition and Combustion of Highly Non-Spherical Nano-Sized Aluminum Particles,” 39th AIAA/ASME/SAE Joint Propulsion Conference and Exhibit, Huntsville, Alabama, 20-23 July, 2003
Thompson, S. M., Gubbins, K. E., Walton, J. P. R. B., Chantry, R. A. R., and Rowlinson, J. S., “A molecular dynamics study of liquid drops,” Journal of Chemical Physics, Vol. 81, No. 1, 1984, pp. 530-542

250
Tomar, V., and Zhou, M., “Classical molecular dynamics potential for the mechanical strength of nanocrystalline composite fcc Al + Fe2O3,” Physical Review B, Vol. 73, 2006, pp. 174116
Trunov, M. A., Schoenitz, M., Zhu, X., and Dreizin, E. L., “Effect of polymorphic phase transformations in Al2O3 film on oxidation kinetics of aluminum powders,” Combustion and Flame, 2005, pp 310-318
Trunov, M. A., Schoenitz, M., and Dreizin, E. L., “Ignition of Aluminum Powders Under Different Experimental Conditions,” Propellants Explosives and Pyrotechnics, Vol. 30, 2005, pp. 36-43
Trunov, M.A., Schoenitz, M., Dreizin, E. L., “Effect of polymorphic phase transformations in alumina layer on ignition of aluminum particles,” Combustion Theory and Modeling, Vol. 10, 2006, pp. 603
Trunov, M. A., Umbrajkar, S. M., Schoenitz, M., Mang, J. T., and Dreizin, E. L., “Oxidation and Melting of Aluminum Nanopowders,” Journal of Physical Chemistry B, 110 No. 26, 2006, pp. 13094-13099
Turns, S. R., Wong S. C., and Ryba, E., “Combustion of Aluminum based Slurry Agglomerates,” Combustion Science and Technology, Vol. 54, 1987, pp. 299-318
Turns, S.R., An Introduction to Combustion, Second Edition, McGraw Hill, 1996,
Vashishta, P., Kalia, R. K., Nakano, A., “Multimillion atom molecular dynamics simulations of nanostructures on parallel computers,” Journal of Nanoparticle Research, Vol. 5, 2003, pp. 119-135
Vorter, A., and Chen, S. F., “Accurate Interatomic Potentials for Ni, Al and Ni3Al,” Materials Research Society symposia proceedings, Vol. 82, No. 175, 1987, pp. 175-180
Wang, S., Yang, Y., Yu, H., and Dlott, D. D., “Dynamical Effects of the Oxide Layer in Aluminum Nano energetic Materials,” Propellants, Explosives, Pyrotechnics, Vol. 30, No. 2, 2005
http://www.neem.psu.edu/, 2008
Widener, J. F., Liang, Y., and Beckstead, M. W., “Aluminum Combustion Modeling in Solid Propellant Environments,” AIAA 99-2629, 35th AIAA/ASME/SAE/ASEE Joint Propulsion Conference and Exhibit, 1999
Wilson, R. P., and Williams F. A., “Experimental Study of Combustion of Single Aluminum Particles in O2/Air,” Thirteenth Symposium (International) on Combustion, The Combustion Institute, Pittsburg, PA, 1971, pp. 833-845

251
Wong, S. C., and Turns S. R., “Ignition of Aluminum Slurry Droplets,” Combustion Science and Technology, Vol. 52, 1987, pp. 221-242
Woon, D. E., “Accurate modeling of interatomic forces: a systematic Moller-Plesset study of the argon dimmer using correlation consistent basis sets,” Chemical Physics Letters, Vol. 204, No 1, 1993, pp. 29-35
Wronski C. R. M., “The size dependence of the melting point of small particles of tin,” British Journal of Applied Physics, Vol. 18, 1967, pp. 1731
Yetter, R. A., and Dryer, F. L., “Metal Particle Combustion and Classification,” Mico-gravity Combustion: Fire in Free Fall, Academic Press, pp. 419-478, 2001
Yuasa, S., Zhu, Y., and Sogo, S., “Ignition and Combustion of Aluminum in Oxygen/Nitrogen Mixture Streams, Effects of Oxygen Concentration on Combustion of Aluminum in Oxygen/Nitrogen Mixture Streams,” Combustion and Flame, Vol. 108, 1997, pp.387
Zenin, A. A., Kusnezov, G., and Kolesnikov, V., “Physics of Aluminum Particle Combustion at micro gravity,” AIAA-90-0696, 1999
Zenin, A. A.,Kusnezov, G., and Kolesnikov, V., “Physics of Aluminum Particle Combustion at convection,” AIAA-2000-0849, 2000
Zha, C. S., Boehler, R., Young, D. A., Ross, M., “The argon melting curve to very high pressures,” Journal of Chemical Physics, Vol. 85, No. 2, 1986, pp. 1034-1036
Zhang, Z., Lu, X. X., and Jiang, Q., “Finite size effect on melting enthalpy and melting entropy of nanoscrystals,” Physica B, 1999, pp. 249-254
Zhao, M., Jiang, Q., “Melting and surface melting of low-dimensional in crystals,” Solid State Communications, 2004, pp. 37-39
Zhu , Y., and Yuasa, S., “Effects of Oxygen Concentration on Combustion of Aluminum in Oxygen/Nitrogen Mixture Streams, Combustion and Flame, Vol. 115, No. 3, 1998, pp. 327
Zhou, Y., Karplus, M., Ball, K. D., and Berry, R. S., “The distance fluctuation criterion for melting: Comparison of square well and More potential modes for clusters and homo polymers,” Journal of Chemical Physics, Vol. 116, No. 5, 2002, pp. 2323-2329
Zik, O., Olami, Z., and Moses, E., “Fingering instability in combustion,” Physical Review Letters, Vol. 81, 1998, pp 3868

VITA
Puneesh Puri
Puneesh Puri was born in Rohtak, India on January, 16 1982. He received his B.
Tech. degree in Mechanical Engineering from Indian Institute of Technology, Delhi in
2003. He joined the Department of Mechanical and Nuclear Engineering at The
Pennsylvania State University in August, 2003 to conduct full time research at Propulsion
Engineering Research Center (PERC) in the area of ignition and combustion of micro and
nano aluminum particles. He has been a research assistant in combustion area since then,
working on injector dynamics, combustion wave ignition systems with focus on ignition
characteristics of JP-7 fuel in particular, and managing the high performance computing
facility for large scale CFD and MD calculations.