moore vietnam-digital-landscape-2015
TRANSCRIPT

VIETNAM DIGITAL LANDSCAPE 2015
BY MOORE CORPORATION
0
TABLE OF CONTENT
[1] VIETNAM IN A GLOBAL CONTEXT
[2] VIETNAM DIGITAL MARKET OVERVIEW
[3] ONLINE POPULATION DEMOGRAPHIC
[4] VIETNAM INTERNET USER BEHAVIOR
[5] VIETNAM MOBILE
[6] VIETNAM SOCIAL NETWORK
[7] VIETNAM E-COMMERCE
[8] APPENDIX
1
VIETNAM IN GLOBAL CONTEXT
01
2
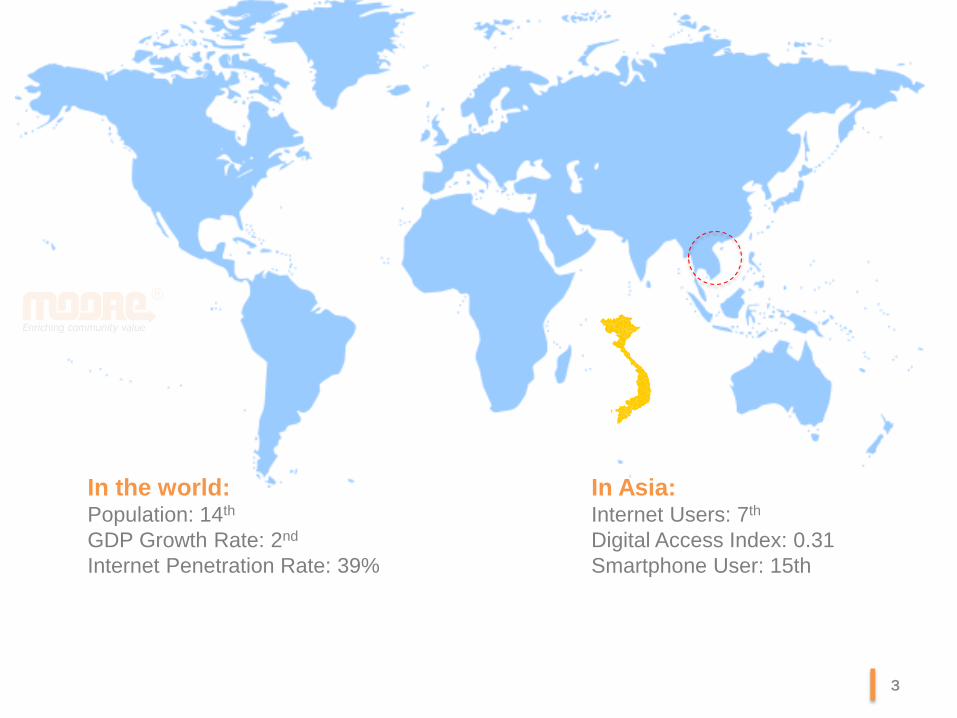
In Asia: Internet Users: 7th
Digital Access Index: 0.31
Smartphone User: 15th
In the world: Population: 14th
GDP Growth Rate: 2nd
Internet Penetration Rate: 39%
3

VIETNAM DIGITAL MARKETING
OVERVIEW
02
4
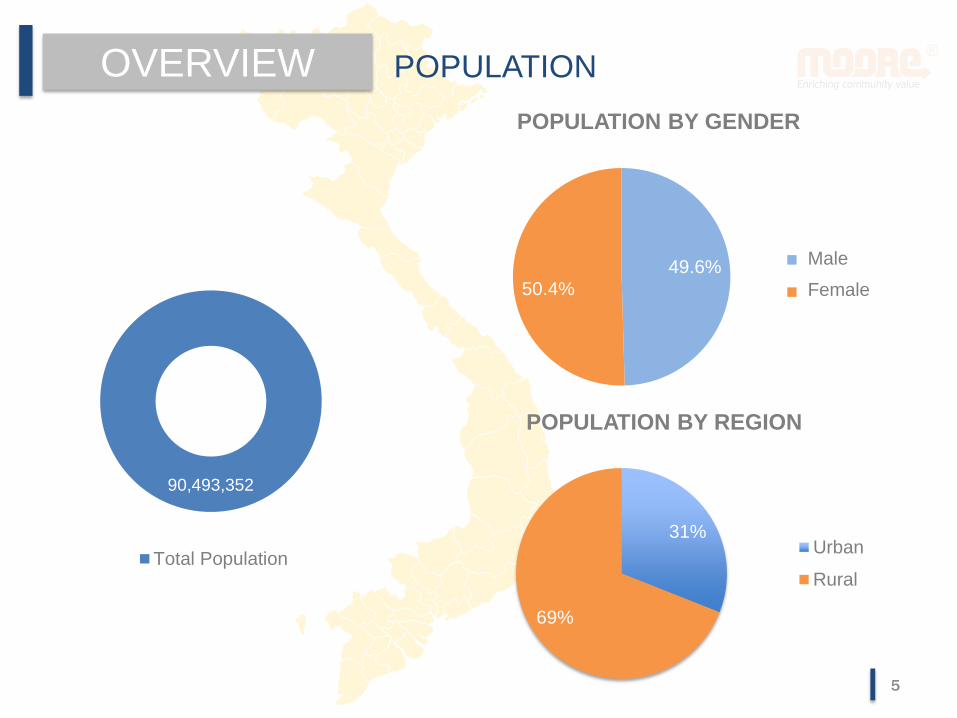
NETIZEN OVERVIEW POPULATION
49.6%
50.4%
POPULATION BY GENDER
Nam
Nữ
31%
69%
POPULATION BY REGION
Urban
Rural
90,493,352
Total Population
fvdvd
vh
e
llo
Male
Female
5
8.00%
7.90%
8.20%
9.20%
8.50%
8.50%
7.90%
7.60%
7.30%
6.80%
6.20%
4.20%
2.80%
0-4
5--9
9--14
15-19
20-24
25-29
30-34
35-39
40-44
45-49
50-54
55-59
60-64
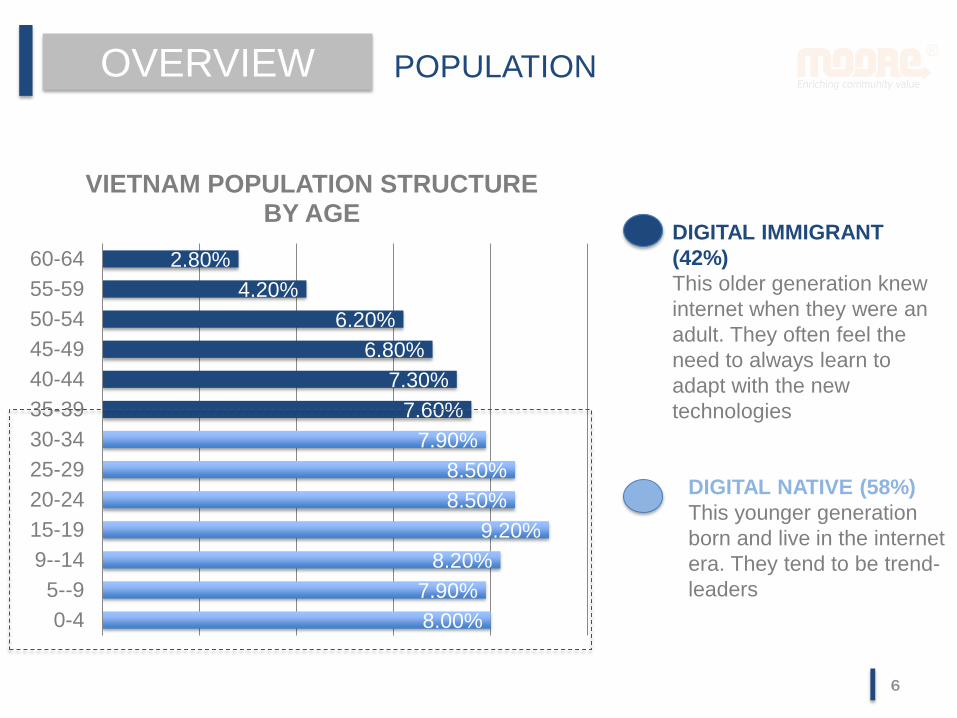
VIETNAM POPULATION STRUCTURE BY AGE
DIGITAL IMMIGRANT
(42%)
This older generation knew
internet when they were an
adult. They often feel the
need to always learn to
adapt with the new
technologies
DIGITAL NATIVE (58%)
This younger generation
born and live in the internet
era. They tend to be trend-
leaders
NETIZEN
OVERVIEW POPULATION
6

NETIZEN
OVERVIEW CHANGE FROM 2005 TO 2014
82.4
12.9 15.8
90.9
39.8
128.6
0
20
40
60
80
100
120
140
POPULATION INTERNET USER MOBILESUBSCRIPTION
Mil
lio
ns
VIETNAM CHANGES FROM 2005 TO 2014
2005
2014
Number of Internet Users increases more than 3 times and number of
Mobile Subscription increases 8 times in 2014 when comparing with ones
in 2005 7
NETIZEN
OVERVIEW INTERNET USER
0.2 3.3
10.7
14.7 17.7
20.8 22.8
26.8
30.6
34.9 36.1
39.8
0.3% 4.0%
13.0%
17.6%
21.0%
24.5% 26.5%
30.8%
34.8%
39.3% 40.2%
43.8%
-
5
10
15
20
25
30
35
40
45
2000 2004 2005 2006 2007 2008 2009 2010 2011 2012 2013 2014
0.0%
10.0%
20.0%
30.0%
40.0%
50.0%
60.0%
Millio
ns
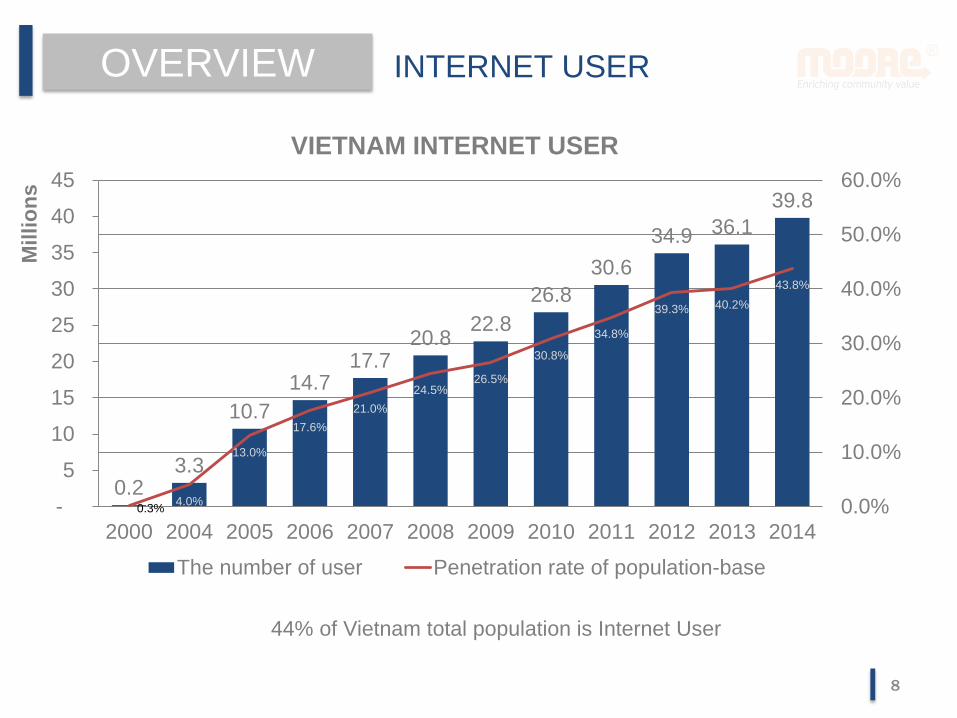
VIETNAM INTERNET USER
The number of user Penetration rate of population-base
44% of Vietnam total population is Internet User
8
OVERVIEW BY DEVICE
4%
5%
36%
44%
93%
0% 20% 40% 60% 80% 100%
Internet Enable TV
Tablet
Smartphone
Computer
Mobile Phone
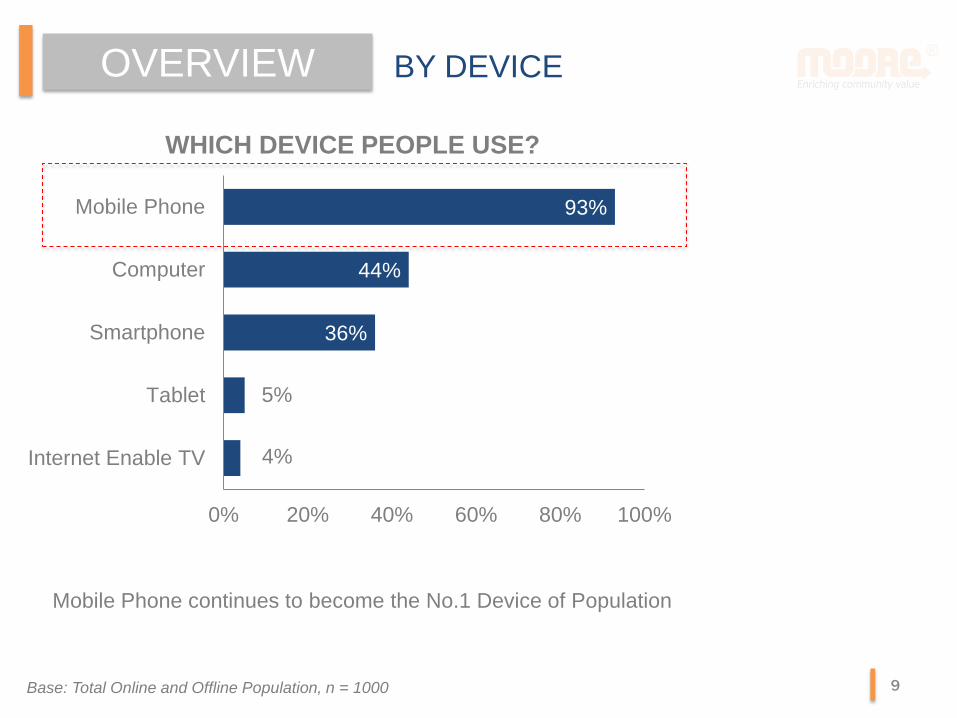
WHICH DEVICE PEOPLE USE?
Mobile Phone continues to become the No.1 Device of Population
Base: Total Online and Offline Population, n = 1000 9
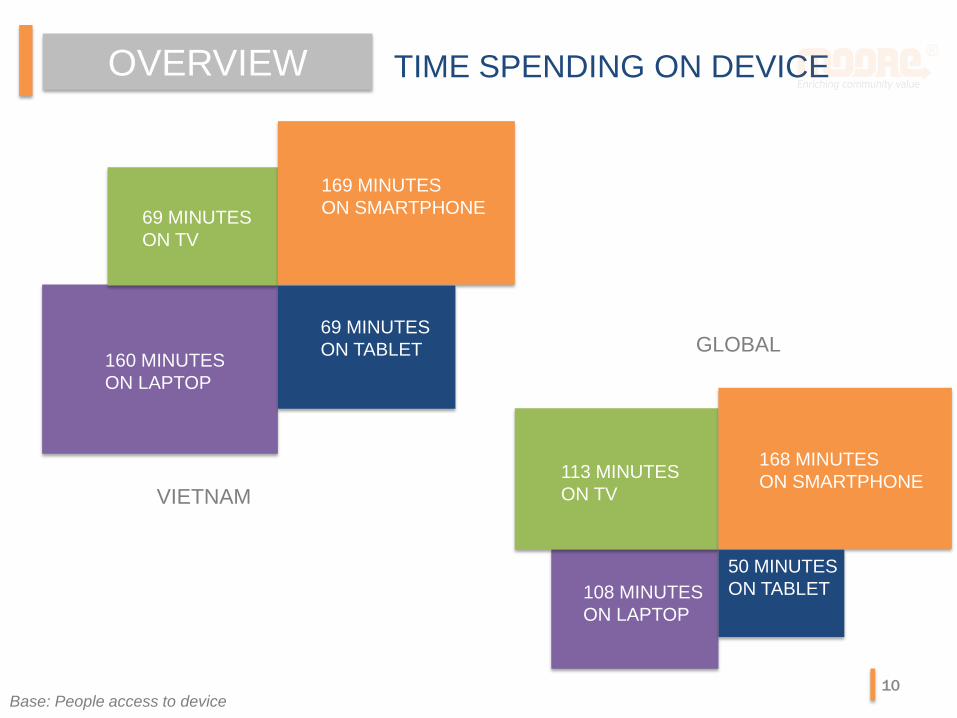
TIME SPENDING ON DEVICE OVERVIEW
69 MINUTES
ON TV
169 MINUTES
ON SMARTPHONE
160 MINUTES
ON LAPTOP
69 MINUTES
ON TABLET
113 MINUTES
ON TV
168 MINUTES
ON SMARTPHONE
108 MINUTES
ON LAPTOP
50 MINUTES
ON TABLET
VIETNAM
GLOBAL
Base: People access to device 10

ESTIMATED VIETNAM ONLINE ADVERTISING REVENUES IN 2014
70% total online advertising revenue in Vietnam belongs to Google and Facebook
OVERVIEW ADVERTISING REVENUE
42%
27%
11%
8%
5% 3% 4%
Admicro
FPT
24H
VNG
Other
Source: Moore Estimation 2014 11
ONLINE POPULATION
DEMOGRAPHIC
03
12

95
70
35
18
15-24 25-34 35-49 50-64
VIETNAM INTERNET USER BY AGE
% Internet User Total Population by Age
Vietnam Internet User is dominated by
young generation in 15-35 years old.
DEMOGRAPHIC BY AGE
Base: Urban internet user 15 – 64, n=5800 13
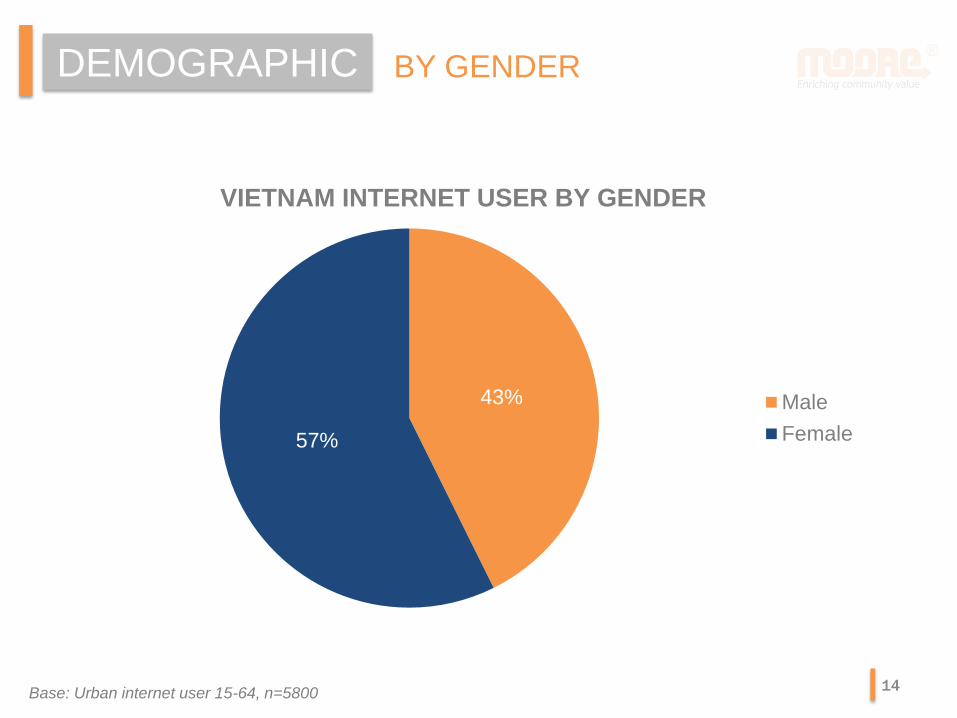
DEMOGRAPHIC BY GENDER
Base: Urban internet user 15-64, n=5800
43%
57%
VIETNAM INTERNET USER BY GENDER
Male
Female
14

VIETNAM
INTERNET USER BEHAVIOR
04
15
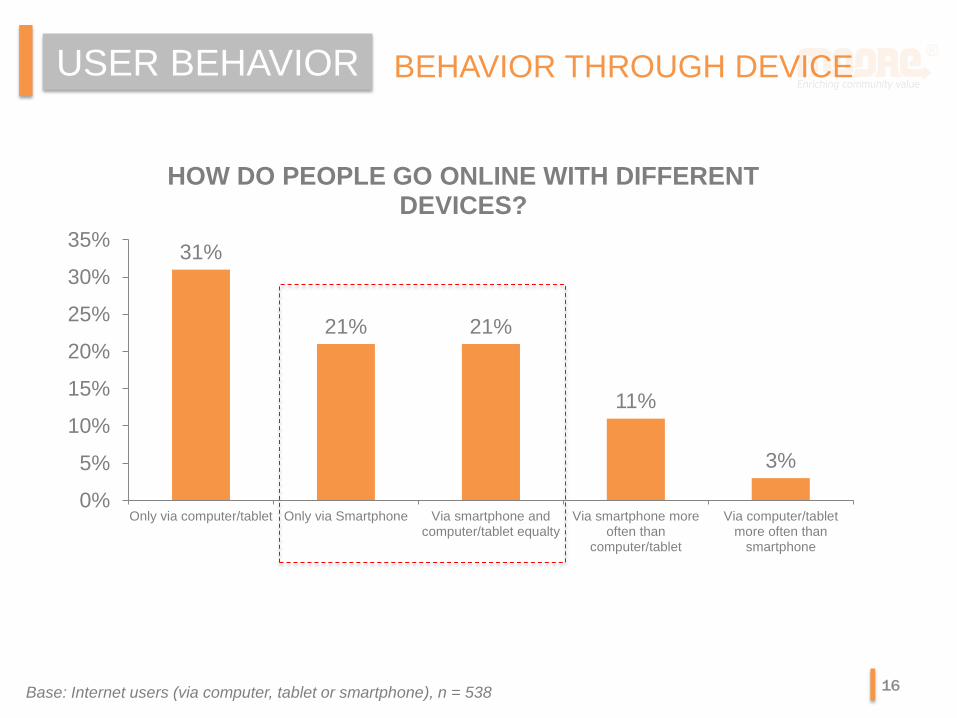
USER BEHAVIOR BEHAVIOR THROUGH DEVICE
Base: Internet users (via computer, tablet or smartphone), n = 538
31%
21% 21%
11%
3%
0%
5%
10%
15%
20%
25%
30%
35%
Only via computer/tablet Only via Smartphone Via smartphone andcomputer/tablet equalty
Via smartphone moreoften than
computer/tablet
Via computer/tabletmore often than
smartphone
HOW DO PEOPLE GO ONLINE WITH DIFFERENT DEVICES?
16
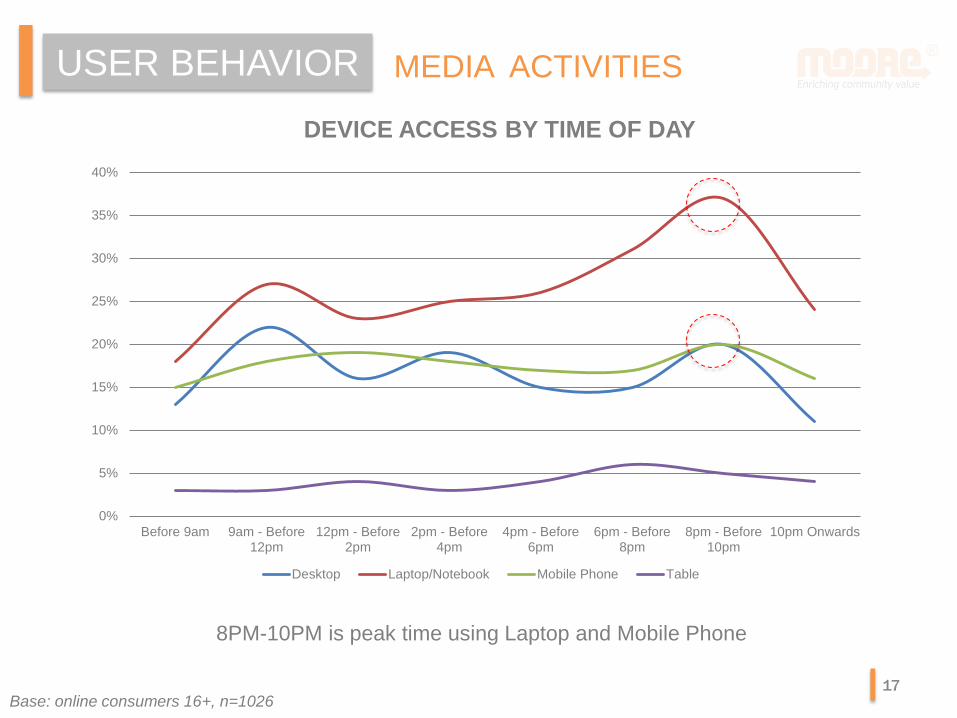
MEDIA ACTIVITIES USER BEHAVIOR
DEVICE ACCESS BY TIME OF DAY
0%
5%
10%
15%
20%
25%
30%
35%
40%
Before 9am 9am - Before12pm
12pm - Before2pm
2pm - Before4pm
4pm - Before6pm
6pm - Before8pm
8pm - Before10pm
10pm Onwards
Desktop Laptop/Notebook Mobile Phone Table
8PM-10PM is peak time using Laptop and Mobile Phone
Base: online consumers 16+, n=1026 17

ONLINE ACTIVITIES USER BEHAVIOR
ONLINE ACTIVITIES BY TIME OF DAY
0%
5%
10%
15%
20%
25%
30%
35%
40%
45%
Before 9am 9am - Before12pm
12pm - Before2pm
2pm - Before4pm
4pm - Before6pm
6pm - Before8pm
8pm - Before10pm
10pm Onwards
Social Media Online News Online Video (+ Internet TV) Online Shopping
Base: online consumers 16+, n=1026 18
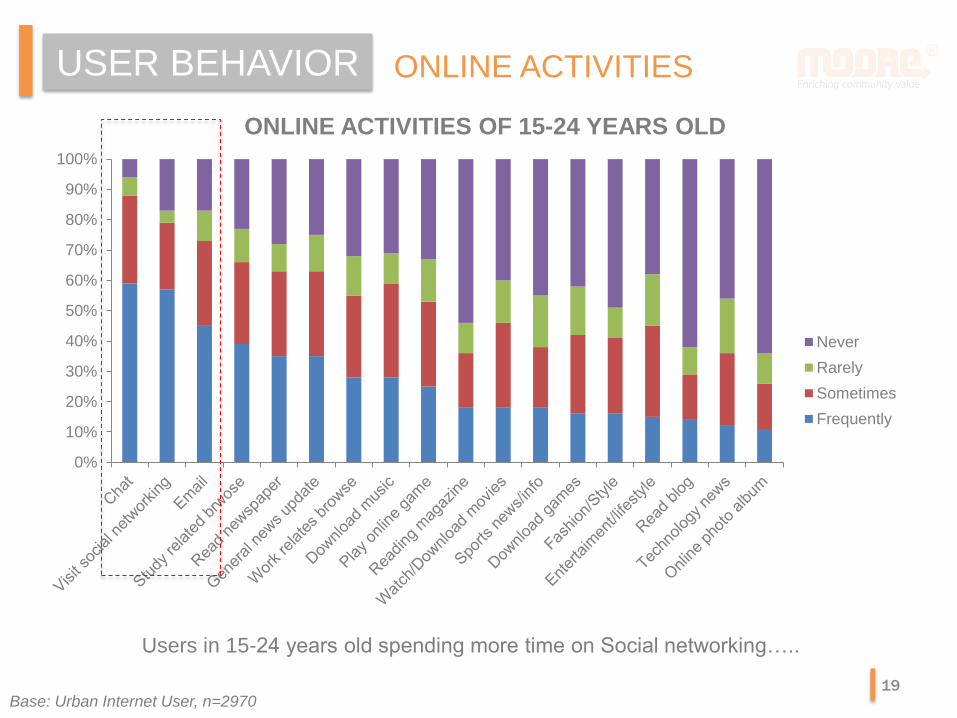
ONLINE ACTIVITIES USER BEHAVIOR
0%
10%
20%
30%
40%
50%
60%
70%
80%
90%
100%
Never
Rarely
Sometimes
Frequently
ONLINE ACTIVITIES OF 15-24 YEARS OLD
Users in 15-24 years old spending more time on Social networking…..
Base: Urban Internet User, n=2970 19
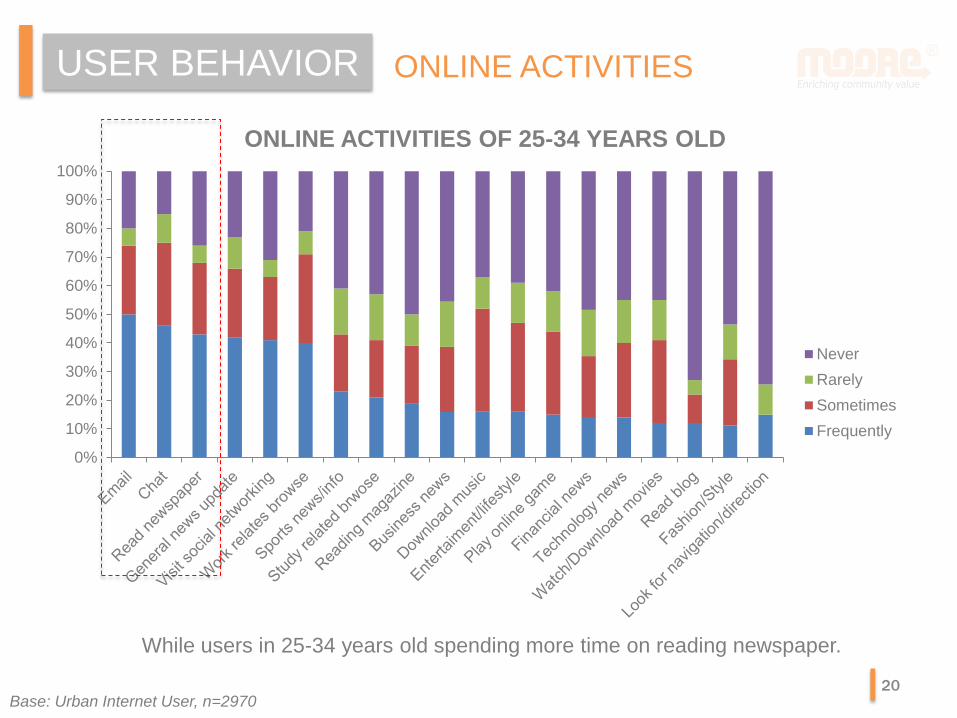
ONLINE ACTIVITIES USER BEHAVIOR
ONLINE ACTIVITIES OF 25-34 YEARS OLD
0%
10%
20%
30%
40%
50%
60%
70%
80%
90%
100%
Never
Rarely
Sometimes
Frequently
While users in 25-34 years old spending more time on reading newspaper.
Base: Urban Internet User, n=2970 20
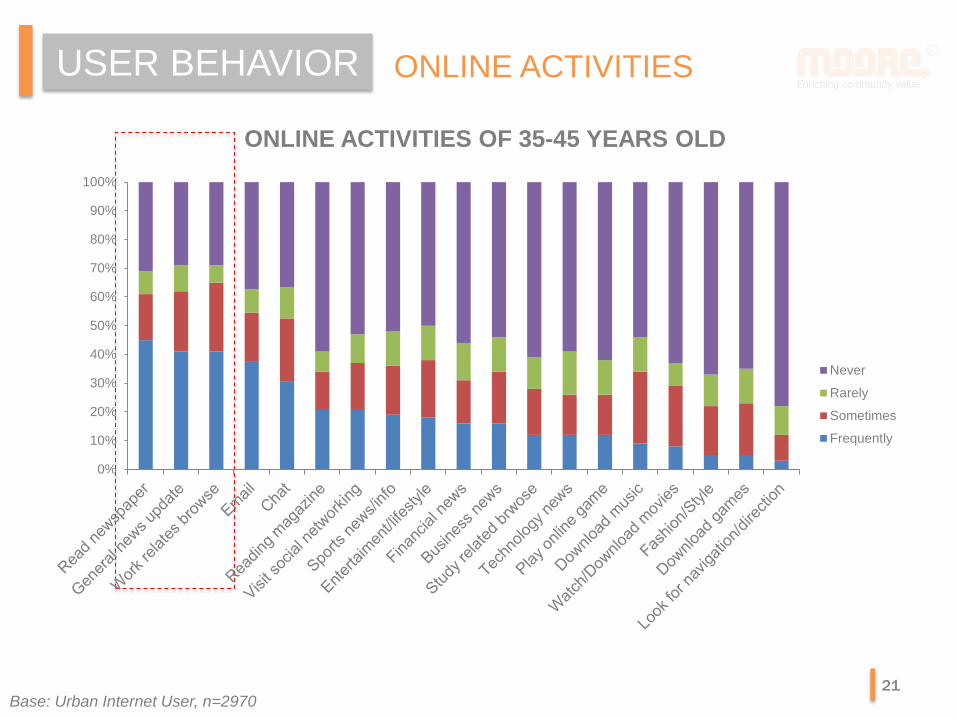
ONLINE ACTIVITIES USER BEHAVIOR
ONLINE ACTIVITIES OF 35-45 YEARS OLD
Base: Urban Internet User, n=2970
0%
10%
20%
30%
40%
50%
60%
70%
80%
90%
100%
Never
Rarely
Sometimes
Frequently
21
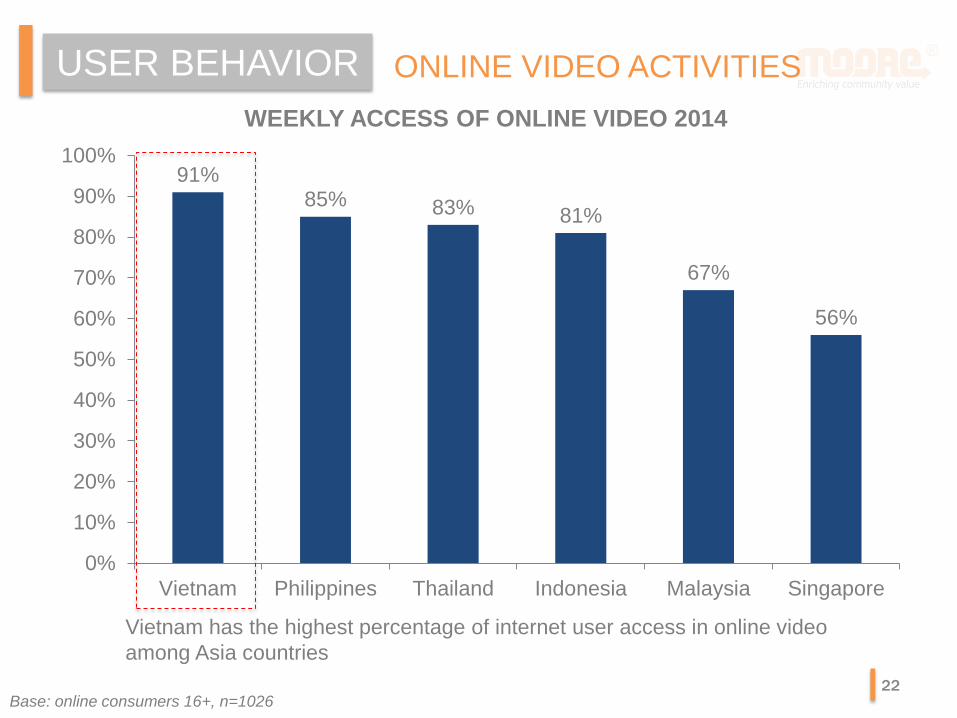
ONLINE VIDEO ACTIVITIES USER BEHAVIOR
WEEKLY ACCESS OF ONLINE VIDEO 2014
91% 85% 83% 81%
67%
56%
0%
10%
20%
30%
40%
50%
60%
70%
80%
90%
100%
Vietnam Philippines Thailand Indonesia Malaysia Singapore
Vietnam has the highest percentage of internet user access in online video
among Asia countries
Base: online consumers 16+, n=1026 22

ONLINE VIDEO ACTIVITIES USER BEHAVIOR
33% 37%
47% 48%
43%
2% 5%
3% 1% 0%
0%
10%
20%
30%
40%
50%
60%
16-20 21-29 30-39 40-49 50+
2014
2011
ONLINE VIDEO VIA MOBILE PHONE 2011-2014
Online Video accessed via mobile grown rapidly from 2011 to 2014
Base: online consumers 16+, n=1026 23
ONLINE VIDEO ACTIVITIES USER BEHAVIOR
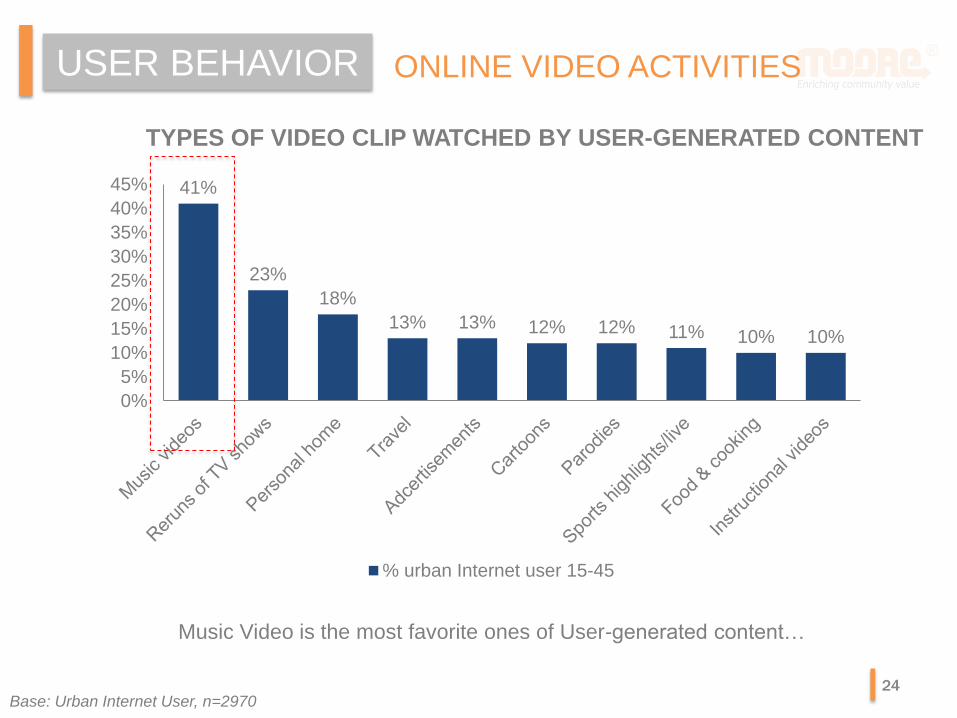
TYPES OF VIDEO CLIP WATCHED BY USER-GENERATED CONTENT
41%
23%
18%
13% 13% 12% 12% 11% 10% 10%
0%
5%
10%
15%
20%
25%
30%
35%
40%
45%
% urban Internet user 15-45
Music Video is the most favorite ones of User-generated content…
Base: Urban Internet User, n=2970 24

ONLINE VIDEO ACTIVITIES USER BEHAVIOR
TYPES OF SITES PEOPLE USED TO WATCH ONLINE VIDEO
87%
12%
44%
15% 8%
0%
10%
20%
30%
40%
50%
60%
70%
80%
90%
100%
An online videosite/app
A catch-up TVplayer
A social network A news ormahazinesite/app
Another type ofsite/app
% of Internet user - Watched online video in the past week
An online video site or app is used by most people when watch video online
Base: Internet users | Watched online video in the past week, n=3051 25

VIETNAM MOBILE
05
“Mobile has driven an unprecedented behavioral and
cultural shift, providing utility, information and
connectivity at our fingertips”
26
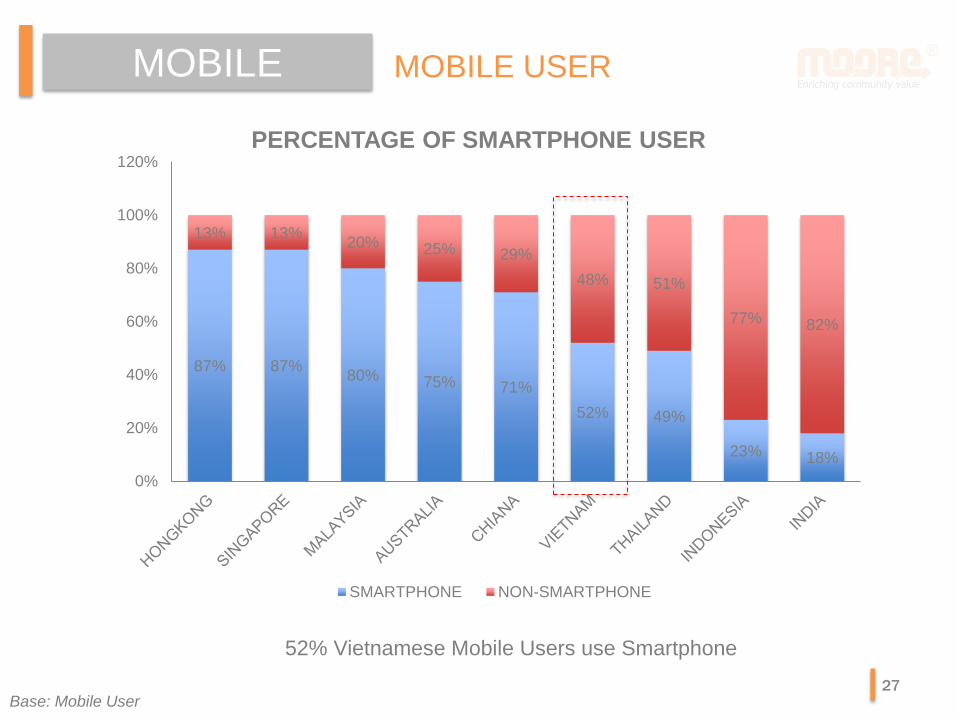
MOBILE MOBILE USER
52% Vietnamese Mobile Users use Smartphone
87% 87% 80% 75% 71%
52% 49%
23% 18%
13% 13% 20% 25% 29%
48% 51%
77% 82%
0%
20%
40%
60%
80%
100%
120%
SMARTPHONE NON-SMARTPHONE
PERCENTAGE OF SMARTPHONE USER
Base: Mobile User 27
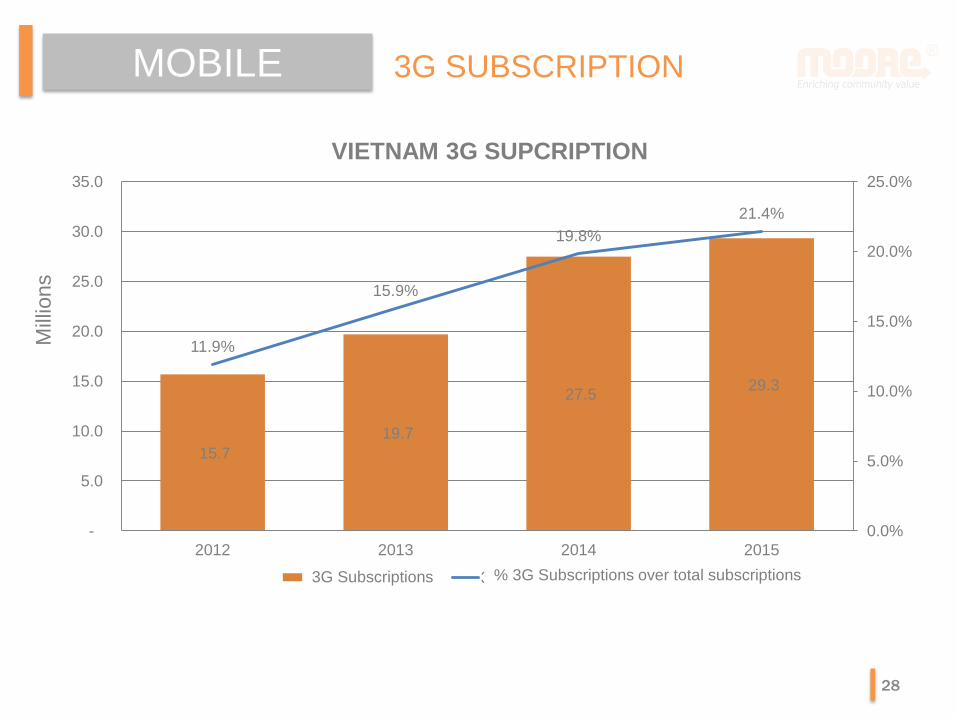
15.7
19.7
27.5 29.3
11.9%
15.9%
19.8%
21.4%
0.0%
5.0%
10.0%
15.0%
20.0%
25.0%
-
5.0
10.0
15.0
20.0
25.0
30.0
35.0
2012 2013 2014 2015
VIETNAM 3G SUPCRIPTION
Số thuê bao 3G 3G trên tổng thuê bao di động
MOBILE 3G SUBSCRIPTION M
illio
ns
3G Subscriptions % 3G Subscriptions over total subscriptions
28
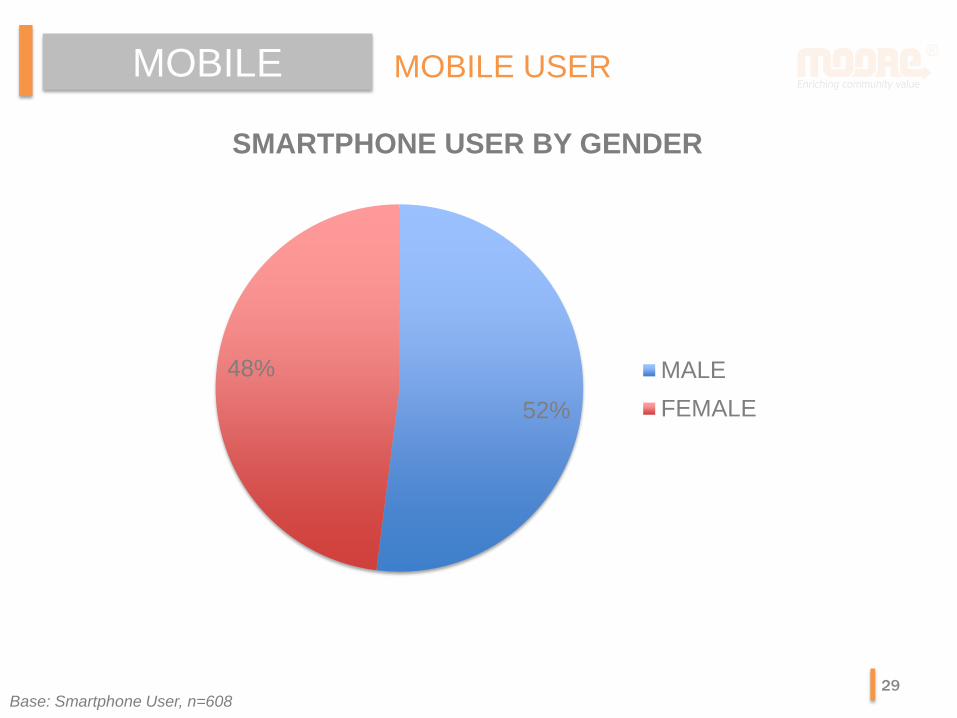
52%
48%
SMARTPHONE USER BY GENDER
MALE
FEMALE
MOBILE MOBILE USER
Base: Smartphone User, n=608 29

MOBILE MOBILE USER
Base: Smartphone User, n=608
62% 63%
47%
27%
0%
10%
20%
30%
40%
50%
60%
70%
16-24 25-34 35-44 45-64
SMARTPHONE USERS BY AGE
30

MOBILE MOBILE USER
SMARTPHONE USERS BY SEC
72%
50%
40% 42%
0%
10%
20%
30%
40%
50%
60%
70%
80%
SEC A SEC B SEC C SEC D-F
Base: Smartphone User, n=608 31
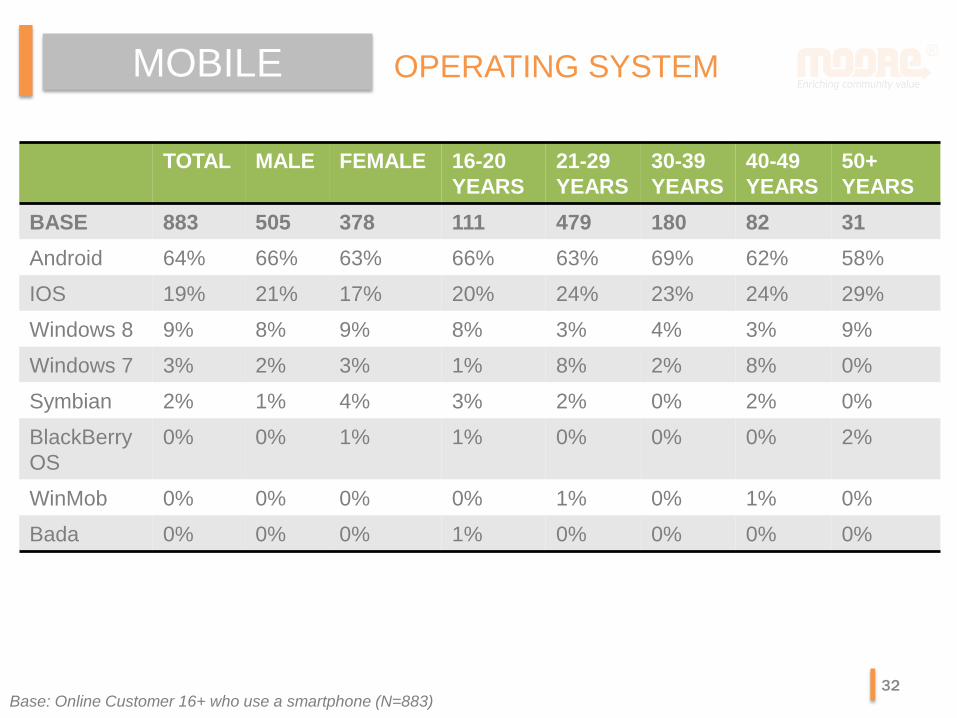
TOTAL MALE FEMALE 16-20
YEARS
21-29
YEARS
30-39
YEARS
40-49
YEARS
50+
YEARS
BASE 883 505 378 111 479 180 82 31
Android 64% 66% 63% 66% 63% 69% 62% 58%
IOS 19% 21% 17% 20% 24% 23% 24% 29%
Windows 8 9% 8% 9% 8% 3% 4% 3% 9%
Windows 7 3% 2% 3% 1% 8% 2% 8% 0%
Symbian 2% 1% 4% 3% 2% 0% 2% 0%
BlackBerry
OS
0% 0% 1% 1% 0% 0% 0% 2%
WinMob 0% 0% 0% 0% 1% 0% 1% 0%
Bada 0% 0% 0% 1% 0% 0% 0% 0%
MOBILE OPERATING SYSTEM
Base: Online Customer 16+ who use a smartphone (N=883)
32
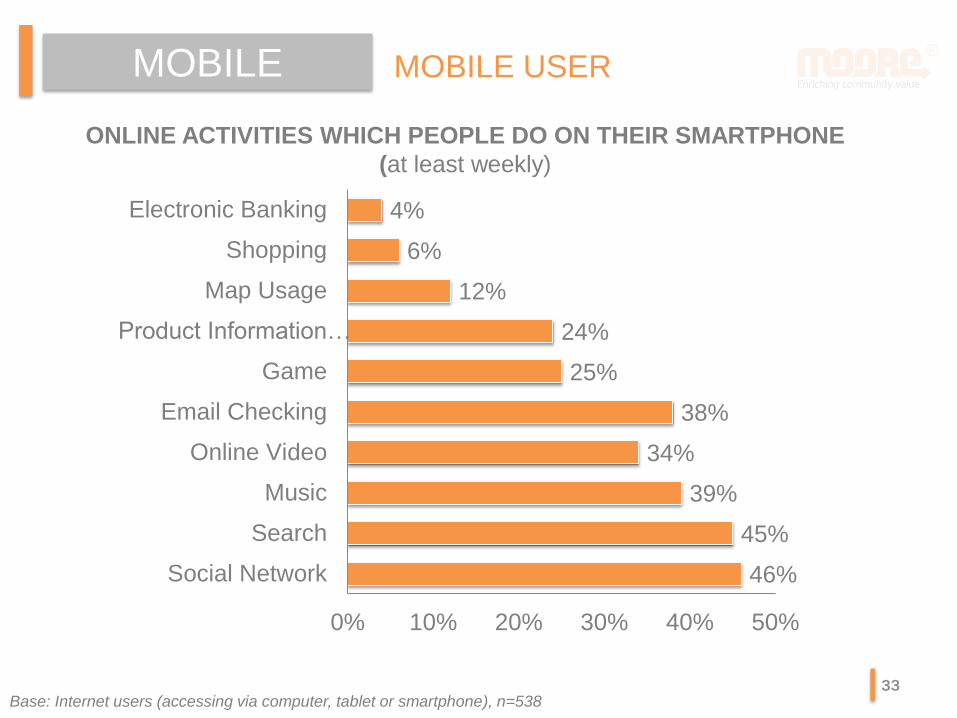
MOBILE MOBILE USER
ONLINE ACTIVITIES WHICH PEOPLE DO ON THEIR SMARTPHONE
(at least weekly)
46%
45%
39%
34%
38%
25%
24%
12%
6%
4%
0% 10% 20% 30% 40% 50%
Social Network
Search
Music
Online Video
Email Checking
Game
Product Information…
Map Usage
Shopping
Electronic Banking
Base: Internet users (accessing via computer, tablet or smartphone), n=538 33
VIETNAM SOCIAL NETWORK
06
34
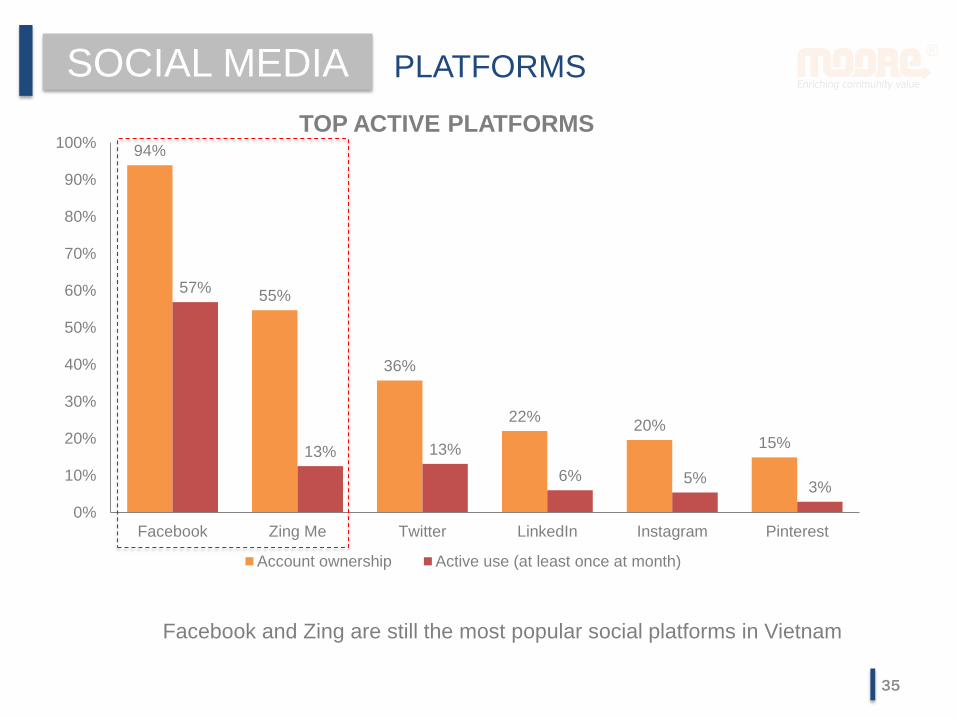
PLATFORMS SOCIAL MEDIA
94%
55%
36%
22% 20%
15%
57%
13% 13%
6% 5% 3%
0%
10%
20%
30%
40%
50%
60%
70%
80%
90%
100%
Facebook Zing Me Twitter LinkedIn Instagram Pinterest
Account ownership Active use (at least once at month)
TOP ACTIVE PLATFORMS
Facebook and Zing are still the most popular social platforms in Vietnam
35
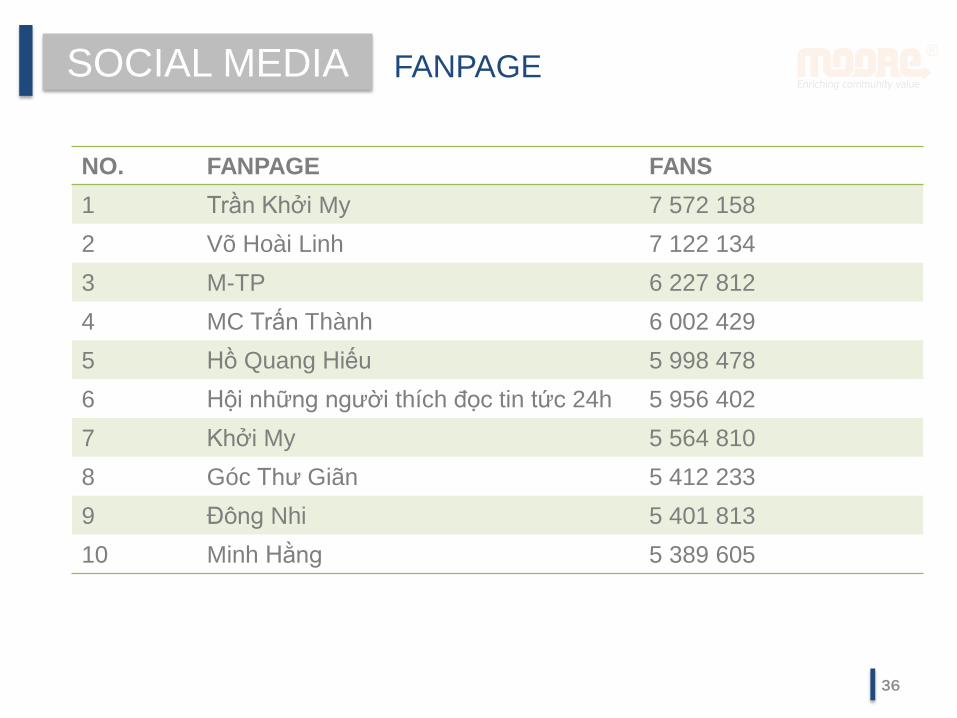
FANPAGE SOCIAL MEDIA
NO. FANPAGE FANS
1 Trần Khởi My 7 572 158
2 Võ Hoài Linh 7 122 134
3 M-TP 6 227 812
4 MC Trấn Thành 6 002 429
5 Hồ Quang Hiếu 5 998 478
6 Hội những người thích đọc tin tức 24h 5 956 402
7 Khởi My 5 564 810
8 Góc Thư Giãn 5 412 233
9 Đông Nhi 5 401 813
10 Minh Hằng 5 389 605
36
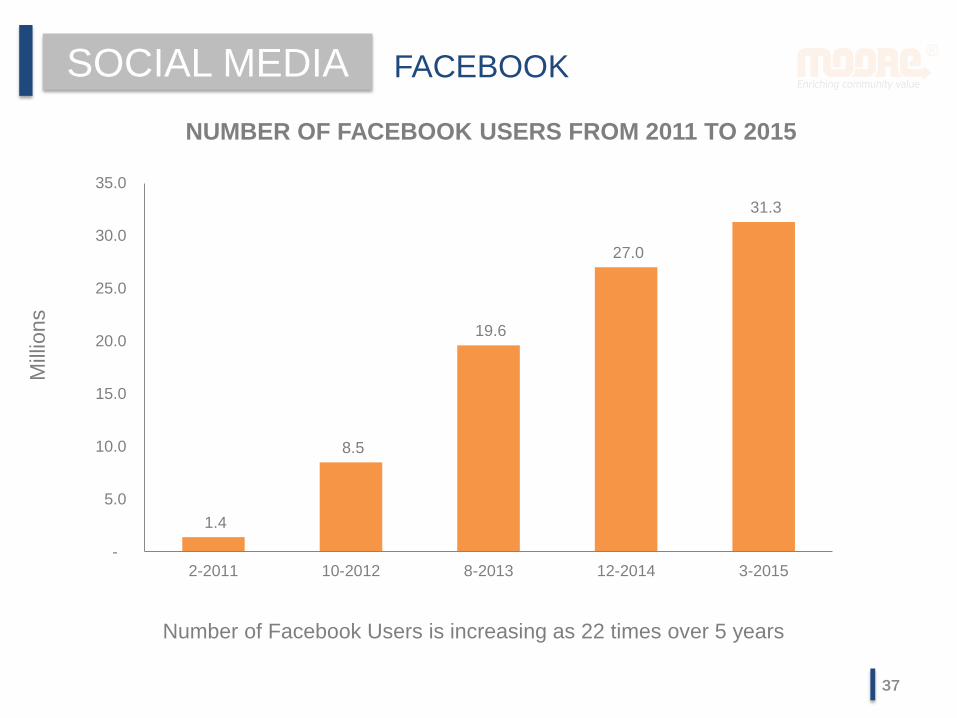
FACEBOOK SOCIAL MEDIA
NUMBER OF FACEBOOK USERS FROM 2011 TO 2015
1.4
8.5
19.6
27.0
31.3
-
5.0
10.0
15.0
20.0
25.0
30.0
35.0
2-2011 10-2012 8-2013 12-2014 3-2015
Mill
ions
Number of Facebook Users is increasing as 22 times over 5 years
37

FACEBOOK USERS BY AGE
1.40
8.80
5.00
1.74
0.30 0.14
1.40
7.60
3.80
0.86
0.22 0.05 -
1
2
3
4
5
6
7
8
9
10
13 - 15 15 - 24 25 - 34 35 - 49 50 - 64 65+
Mil
lio
ns
Male Female
FACEBOOK SOCIAL MEDIA
Facebook User is nominated by Male
38

FACEBOOK USER BY LOCATION
3.20 3.40
0.34 0.26 0.36
9.82
2.80 3.00
0.32 0.24 0.30
7.27
-
2
4
6
8
10
12
Ho Chi Minh Ha Noi Da Nang Can Tho Hai Phong Khác
Millio
ns
Male Female
FACEBOOK SOCIAL MEDIA
Others
39
VIETNAM E-COMMERCE
07
40
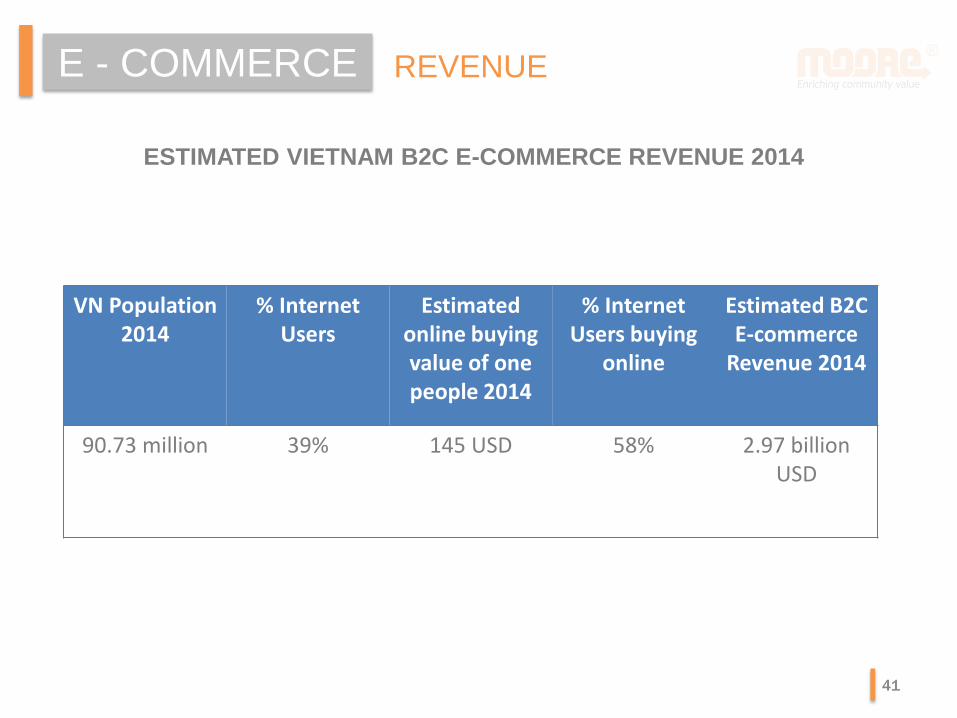
REVENUE E - COMMERCE
ESTIMATED VIETNAM B2C E-COMMERCE REVENUE 2014
VN Population 2014
% Internet Users
Estimated online buying value of one people 2014
% Internet Users buying
online
Estimated B2C E-commerce
Revenue 2014
90.73 million 39% 145 USD 58% 2.97 billion USD
41
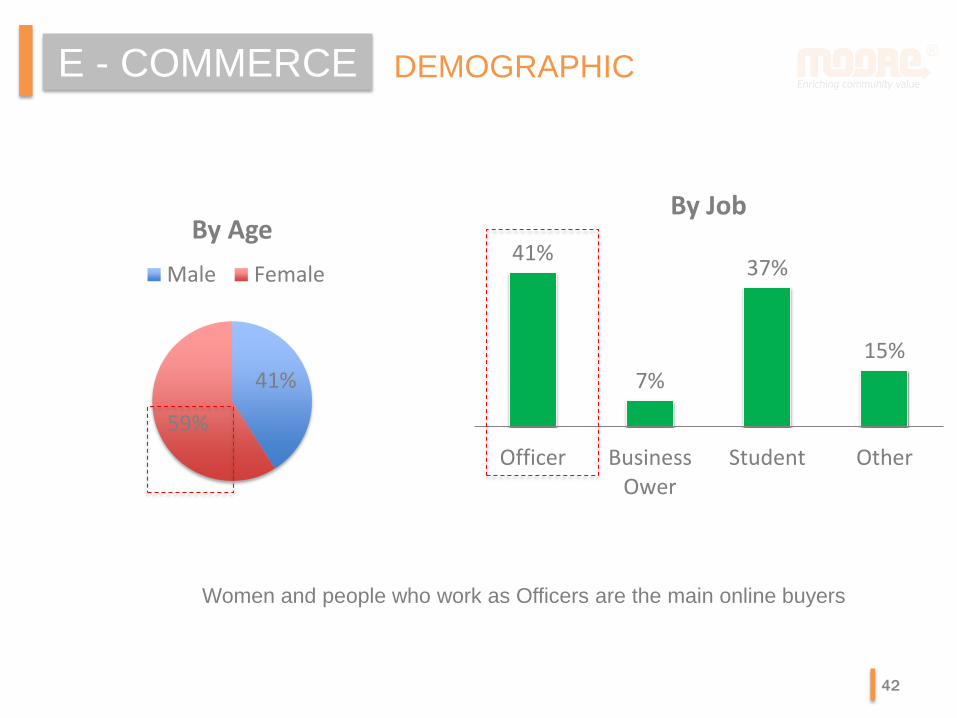
DEMOGRAPHIC E - COMMERCE
41%
59%
By Age
Male Female41%
7%
37%
15%
Officer BusinessOwer
Student Other
By Job
Women and people who work as Officers are the main online buyers
42
Base: Internet users | Answering based on a recent purchase, n=3018
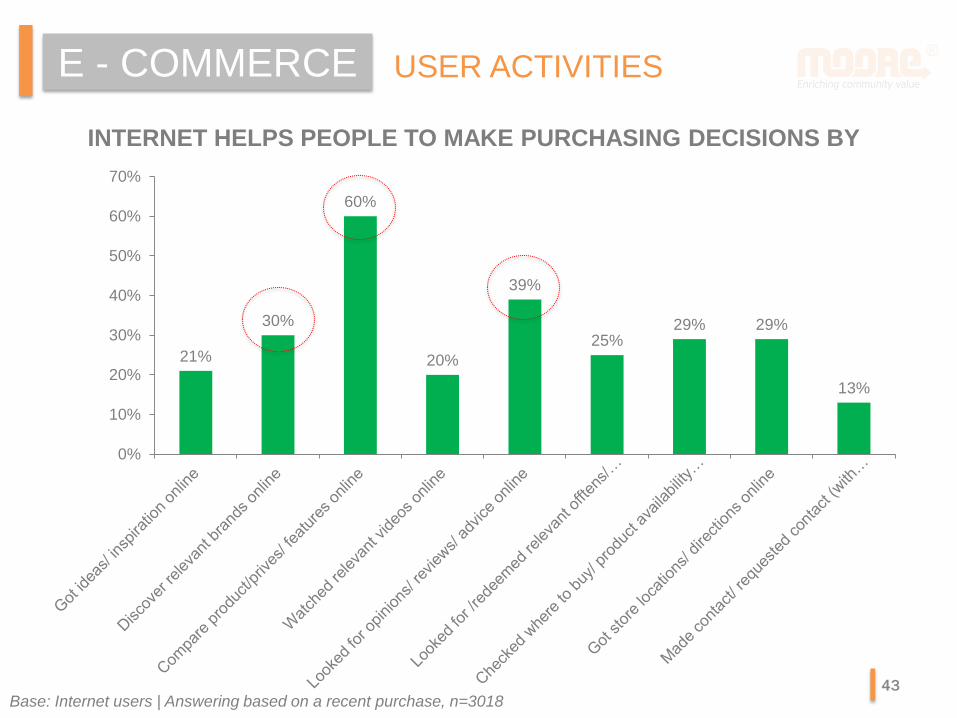
USER ACTIVITIES E - COMMERCE
INTERNET HELPS PEOPLE TO MAKE PURCHASING DECISIONS BY
21%
30%
60%
20%
39%
25% 29% 29%
13%
0%
10%
20%
30%
40%
50%
60%
70%
43
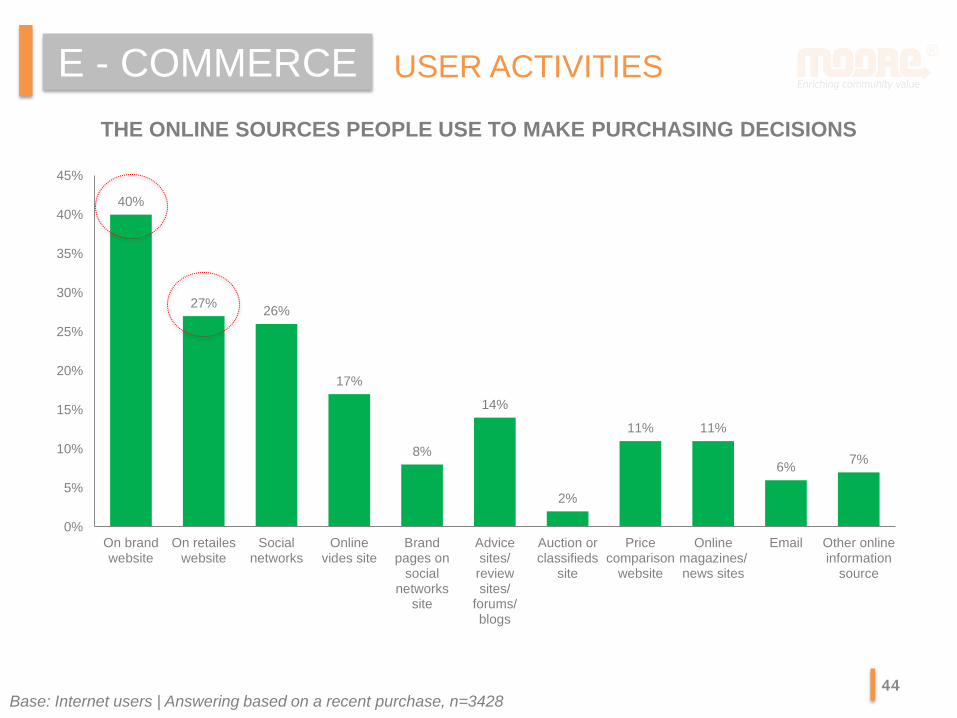
USER ACTIVITIES E - COMMERCE
THE ONLINE SOURCES PEOPLE USE TO MAKE PURCHASING DECISIONS
40%
27% 26%
17%
8%
14%
2%
11% 11%
6% 7%
0%
5%
10%
15%
20%
25%
30%
35%
40%
45%
On brandwebsite
On retaileswebsite
Socialnetworks
Onlinevides site
Brandpages on
socialnetworks
site
Advicesites/reviewsites/
forums/blogs
Auction orclassifieds
site
Pricecomparison
website
Onlinemagazines/news sites
Email Other onlineinformation
source
Base: Internet users | Answering based on a recent purchase, n=3428 44

HOW PEOPLE HEAR ABOUT THE PRODUCT THAT THEY PURCHASED
USER ACTIVITIES E - COMMERCE
33% 31%
13% 13%
9%
0%
5%
10%
15%
20%
25%
30%
35%
Previousexperiences
Discussionswith other
people
Pre-purchaseresearch
Throughtadvertising
None of these
Base: Internet users | Answering based on a recent purchase (in select categories) researched online 45
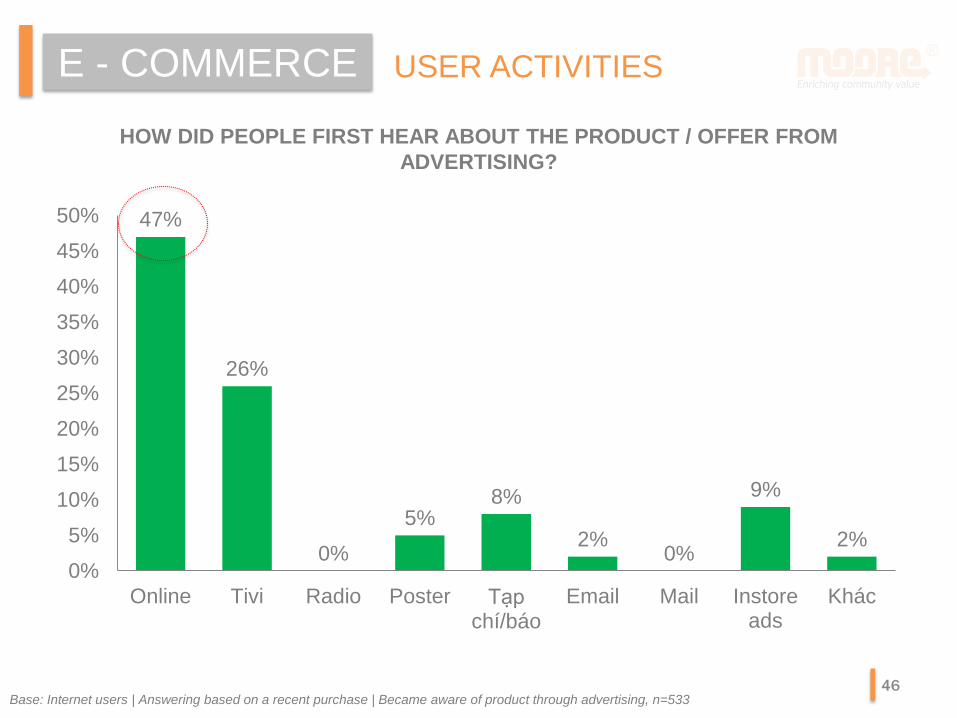
HOW DID PEOPLE FIRST HEAR ABOUT THE PRODUCT / OFFER FROM
ADVERTISING?
USER ACTIVITIES E - COMMERCE
47%
26%
0%
5% 8%
2% 0%
9%
2%
0%
5%
10%
15%
20%
25%
30%
35%
40%
45%
50%
Online Tivi Radio Poster Tạp chí/báo
Email Mail Instoreads
Khác
Base: Internet users | Answering based on a recent purchase | Became aware of product through advertising, n=533 46

WHAT DID PEOPLE DO ONLINE AFTER COMPLETING THEIR PURCHASE?
USER ACTIVITIES E - COMMERCE
Base: Internet users | Answering based on a recent purchase | n = 3428 47
28%
18%
14%
52%
0%
10%
20%
30%
40%
50%
60%
Shared purchaseexperiences on social
network(s)
Posted reviews / ratingsabout the purchase
Looked for the help on set-up / product usage
None of these
APPENDIX
08
48
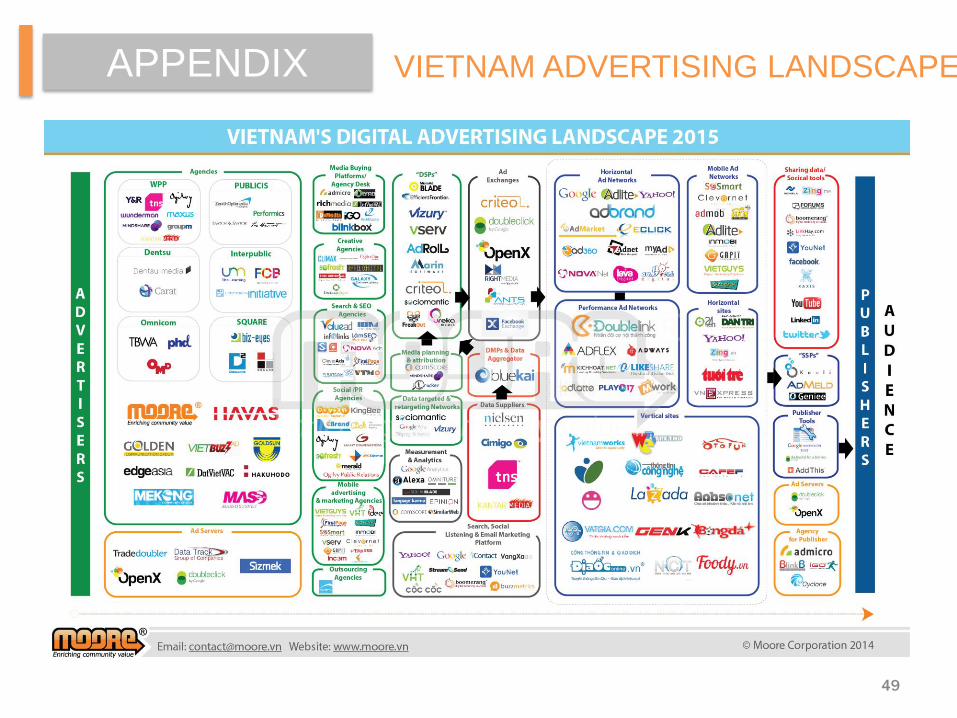
VIETNAM ADVERTISING LANDSCAPE APPENDIX
49
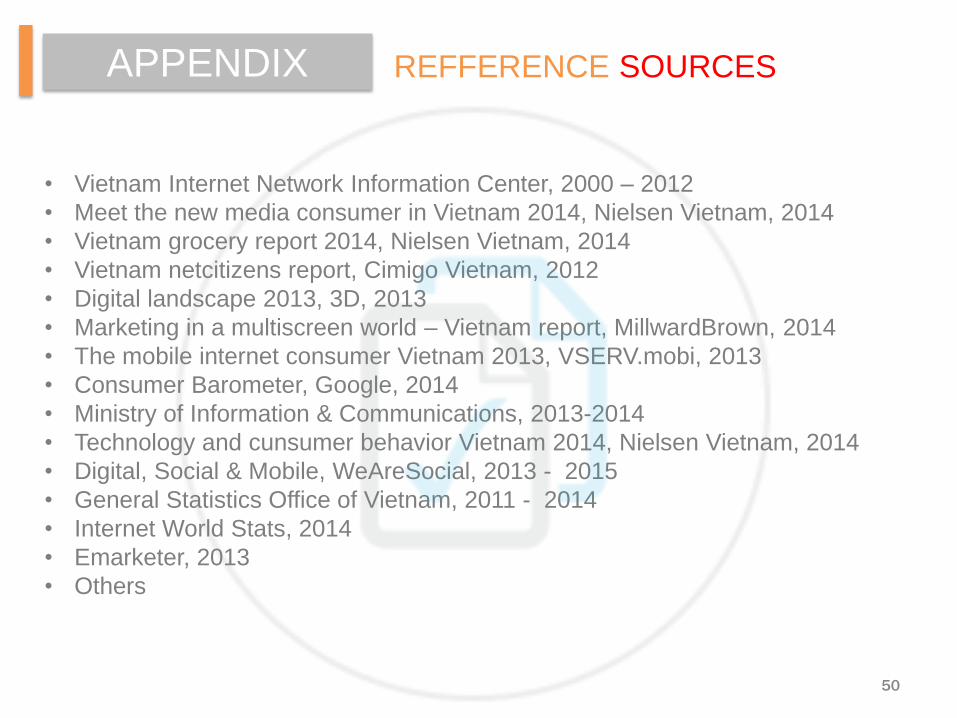
REFFERENCE SOURCES APPENDIX
• Vietnam Internet Network Information Center, 2000 – 2012
• Meet the new media consumer in Vietnam 2014, Nielsen Vietnam, 2014
• Vietnam grocery report 2014, Nielsen Vietnam, 2014
• Vietnam netcitizens report, Cimigo Vietnam, 2012
• Digital landscape 2013, 3D, 2013
• Marketing in a multiscreen world – Vietnam report, MillwardBrown, 2014
• The mobile internet consumer Vietnam 2013, VSERV.mobi, 2013
• Consumer Barometer, Google, 2014
• Ministry of Information & Communications, 2013-2014
• Technology and cunsumer behavior Vietnam 2014, Nielsen Vietnam, 2014
• Digital, Social & Mobile, WeAreSocial, 2013 - 2015
• General Statistics Office of Vietnam, 2011 - 2014
• Internet World Stats, 2014
• Emarketer, 2013
• Others
50
CONTACT
NGUYEN XUAN DONG
Vice Managing Director
098 999 5145
Moore Online Solution and Development Corporation
Head Office: 7th Floor, No.1 Hoang Dao Thuy St., Dist. Thanh Xuan, Ha Noi City
HCMC Branch: 6th Floor, No. 454 Nguyen Thi Minh Khai St., Ward 5, Dist. 3, Ho Chi Minh
City
Website: www.moore.vn | www.adbrand.net | www.adlite.net | www.doublelink.net | 51